The original text is from james lavish
Translation|Odaily Planet Daily Golem (@web 3golem)_
“The Federal Reserve may stop shrinking its balance sheet in the coming months,” a statement from Fed Chairman Powell last week sparked various speculations in the market. The underlying signal behind this statement is that “quantitative tightening (QT) is about to shift to quantitative easing (QE), and the pace will be faster than most expect.”
But is this merely a symbolic gesture from the Federal Reserve, or does it hold extraordinary significance? Most importantly, what is Powell really hinting at regarding the current state of the financial system? This article will delve into the Federal Reserve's liquidity strategy, the current liquidity crisis compared to 2019, and why the Fed will initiate a permanent quantitative easing policy (QE).
Liquidity Crisis Looms
Reverse Repurchase Agreements (RRP) Have Failed
RRP was once a massive reservoir of excess liquidity, peaking at about $2.4 trillion in 2022, but it is now essentially empty. As of this week, only a few billion dollars remain in RRP, a reduction of over 99% from its peak.
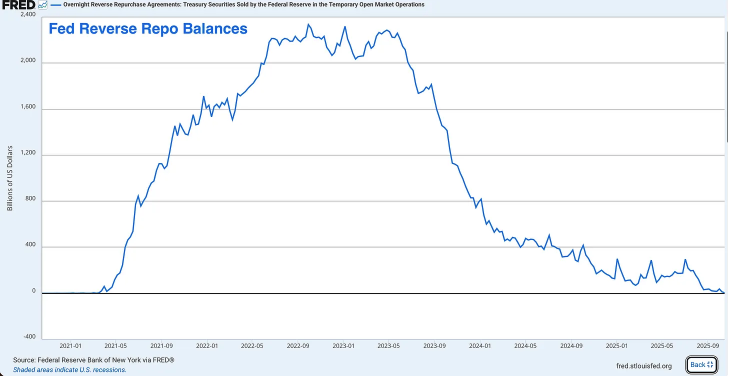
Although RRP was initially created as a tool to help the Fed manage short-term interest rates, it has transformed into a release valve for excess liquidity over the past few years, becoming a shock absorber for the entire financial system.
During the COVID-19 pandemic, the Fed and the Treasury injected trillions of dollars into the financial system, and this cash ultimately found its way into RRP through money market funds. Later, Treasury Secretary Janet Yellen devised a clever trick to deplete RRP funds by issuing attractive short-term Treasury bills.
Money market funds withdrew their cash from RRP (earning the Fed's RRP rate) to purchase higher-yielding Treasury bills. This allowed the Treasury to fund the government's massive deficit without injecting large amounts of long-term U.S. Treasury bonds into the market.
This was indeed a brilliant strategy before RRP was depleted, but it is no longer effective.
Bank Reserves Are in a State of Secondary Alert
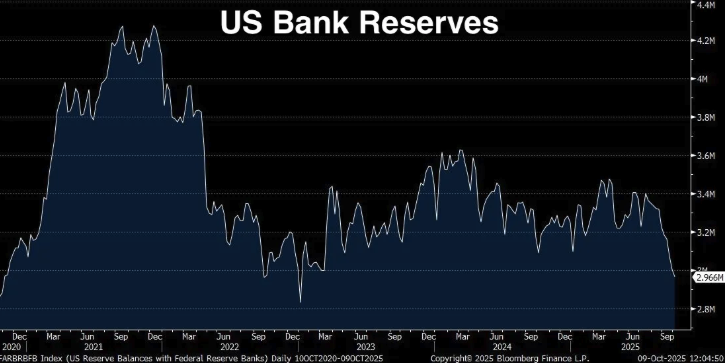
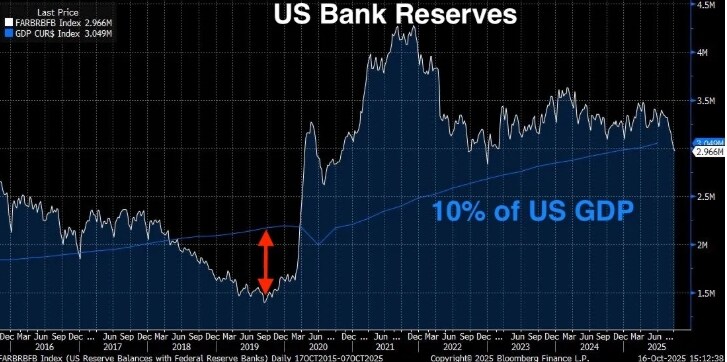
Bank reserves have fallen to $2.9 trillion, down $1.3 trillion since peaking in September 2021. Powell has clearly stated that the Fed will become nervous when bank reserves fall below 10-11% of GDP. The 10% threshold is not arbitrary; it is based on extensive research by the Fed, surveys of banks, and lessons learned from the actual experience of the crisis in September 2019 (which will be detailed later).
So, what level are we at now?
- Current bank reserves: $2.96 trillion (as of last week)
- Current U.S. GDP: $30.486 trillion (Q2 2025)
- Percentage of reserves to GDP: 9.71%
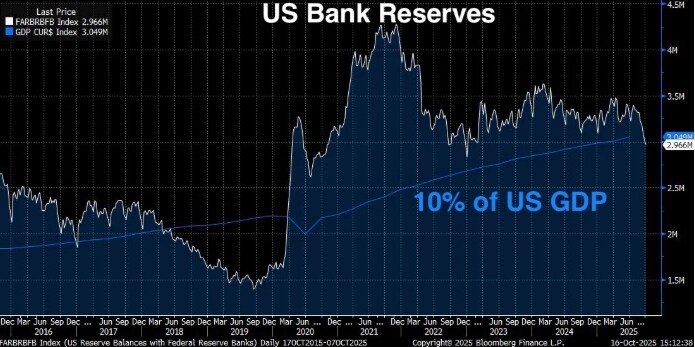
Current bank reserves are below the Fed's established minimum level of 10% for “adequate reserves” (the level at which the financial system can operate smoothly). According to the Fed, to ensure smooth market operations, reserves should be maintained between $2.8 trillion and $3.4 trillion. However, considering that GDP has reached $30.5 trillion, the 10% threshold ideally means reserves should exceed $3.05 trillion.
With our current reserves at $2.96 trillion, in short, we are in danger. And with RRP essentially depleted, the Fed has no buffer left.
In January of this year, bank reserves were about $3.4 trillion, RRP was about $600 billion, and total liquidity was about $4 trillion, meaning that in less than a year, total liquidity in the system has decreased by over $1 trillion. Worse still, the Fed is still conducting quantitative tightening at a pace of $25 billion per month.
This Time Will Be Worse Than 2019
Some may naively think that we faced a similar situation in 2019 when reserves fell to $1.5 trillion, but everything turned out fine in the end, so it will be the same this time. However, the truth may be that the liquidity crisis we face now will be worse than in 2019.
In 2019, reserves fell to $1.5 trillion, about 7% of GDP (when GDP was about $21.4 trillion), leading to a paralysis of the financial system, a surge in the repo market, and a panicked Fed that chose to start printing money. Currently, bank reserves are 9.71% of GDP, although they are below Powell's stated 10% adequate reserve threshold, they are still higher than in 2019. So why will the situation be worse?
There are three reasons:
- The absolute size of the financial system has expanded. The banking system is larger, with larger balance sheets, and the amount of reserves needed to maintain smooth system operations has increased. A 7% reserve in 2019 triggered a crisis; now, reserves at 9.71% of GDP are already showing signs of stress, and as reserve levels decline, this pressure point may worsen.
- We no longer have the RRP buffer. In 2019, RRP was almost nonexistent, but in the post-pandemic era, the financial system has become accustomed to this additional liquidity buffer. Now that it has disappeared, the financial system must readjust to operate without it.
- Regulatory requirements have become stricter. After the 2008 financial crisis and the recent regional banking crisis in 2023, banks face stricter liquidity requirements. They need to hold more high-quality liquid assets (HQLA) to meet regulations like the liquidity coverage ratio (LCR). Bank reserves are the highest quality liquid assets. As reserves decline, banks are getting closer to their regulatory minimum standards. When they approach these levels, they begin to take defensive actions, such as reducing lending, hoarding liquidity, and raising the secured overnight financing rate (SOFR).
SOFR Spread Is Widening
If the increase in bank reserves and the depletion of RRP are merely a few “stop signals” on our path to a liquidity crisis, then what we will see next are the real “flashing red lights” ahead.
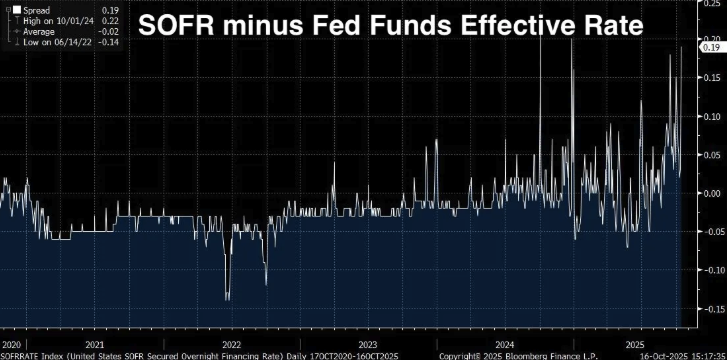
SOFR/EFFR Spread
SOFR (Secured Overnight Financing Rate) is the rate at which financial institutions borrow cash overnight using U.S. Treasury securities as collateral. It has replaced the London Interbank Offered Rate (LIBOR) as the primary benchmark for short-term rates, calculated based on actual transactions in the U.S. Treasury repo market (with a daily trading volume of about $1 trillion).
The Effective Federal Funds Rate (EFFR) is the rate at which banks lend reserve balances to each other overnight on an unsecured basis. Under normal circumstances, the trading prices of these two rates are very close (within a few basis points), as they are both overnight rates linked to Fed policy and reflect short-term financing conditions.
Under normal circumstances, they are almost identical, but when SOFR starts to be significantly higher than EFFR, it sends a warning. This means that secured loans (i.e., loans backed by U.S. Treasury securities) suddenly become more expensive than unsecured loans between banks.
Typically, the cost of borrowing against solid collateral like U.S. Treasury securities should be lower, not higher. Therefore, when the opposite occurs, it indicates that there is a problem in the system, such as tight reserves or shrinking balance sheet space.
When SOFR is higher than EFFR, it’s like banks are saying, “I would rather offer you an unsecured loan at a lower rate than accept your U.S. Treasury collateral at a higher rate.” This situation does not occur in a healthy, liquid market; it only happens when liquidity begins to dry up.
The Spread Is Structurally Widening
From 2024 to 2025, the spread has been steadily widening, with the current spread at 0.19 (i.e., 19 basis points). This may not sound like much, but in the overnight financing space, it is a significant number.
The average spread during the 2020-2022 period was about -0.02, with a low of -0.14 on June 14, 2022, but by October 1, 2024, the peak spread was 0.22, and now the spread is 0.19. The spread has shifted from negative to positive, which is not a short-term peak performance but a structural change, warning that market reserves are too tight.
Why the SOFR Spread Is So Important
The SOFR/EFFR spread is a real-time market signal. It is not a lagging indicator like GDP, nor is it a survey like consumer confidence. It reflects actual borrowing and lending of funds in the largest and most liquid financing market globally.
When this spread continues to widen, it means:
- Banks do not have excess reserves to lend freely. If they did, they would arbitrage by lending at higher rates in the SOFR market to offset the spread.
- The Fed's open market operations are insufficient. The Fed has a standing repo facility (SRF) designed to prevent funding pressures by allowing banks to borrow U.S. Treasuries at a fixed rate. Despite this tool, SOFR trading prices remain high, indicating that the demand for reserves exceeds what the Fed is providing.
- Year-end pressures are intensifying. Banks face additional balance sheet scrutiny at quarter-end and year-end, requiring regulatory reporting. These pressures have now spread to regular trading days, indicating that the benchmark level of reserves is too low.
- We are just a step away from a 2019-style crisis. Currently, we see structural increases, but we (as of now) do not see panic. In September 2019, the overnight repo rate did not rise gradually; it surged almost overnight from 2% to 10%.
The Fed is well aware of what this means; the SOFR spread is one of the key indicators monitored daily by the New York Fed's trading desk. They know what happened the last time the spread widened this much, and they also know what will happen if no action is taken.
Will the 2019 Repo Crisis Recur?
September 17, 2019. For anyone paying attention to Federal Reserve policy, this should be a date to remember. On that morning, the overnight repo rate (the rate at which banks borrow overnight using U.S. Treasury securities as collateral) suddenly skyrocketed from around 2% to 10%.
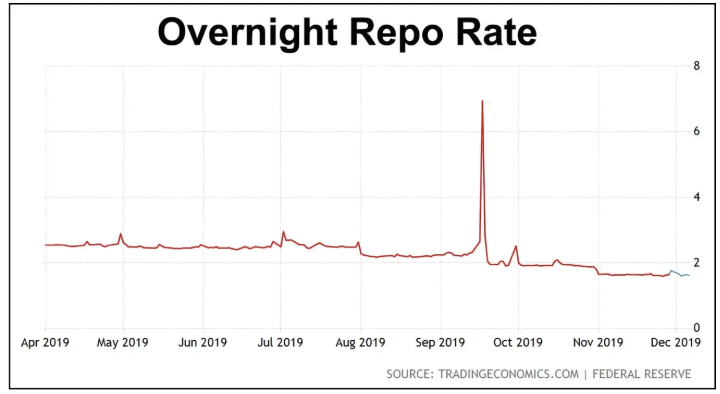
At that time, the Fed's target interest rate was 2.00-2.25%, and the repo rate surged to five times the Fed's policy rate within hours, all due to bank reserves being too low.
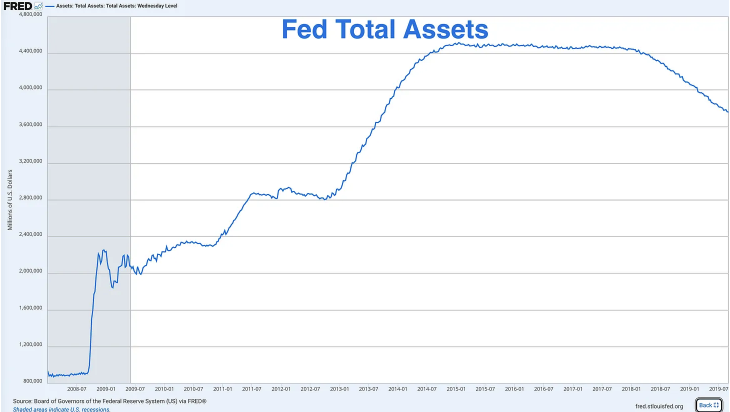
After the financial crisis, the Fed expanded its balance sheet from less than $1 trillion to over $4.5 trillion through various quantitative easing programs. However, starting in 2017, they began implementing quantitative tightening policies by allowing bonds to mature without reinvestment to reduce the balance sheet.
By September 2019, reserves had fallen to about $1.5 trillion, approximately 7% of GDP at the time (GDP was about $21.4 trillion). The Fed naively believed this was not a problem, but it turned out they were wrong.
Several fatal factors converged at that time, causing the overnight repo rate to spike:
- Corporate tax payments—mid-September is a critical deadline for corporate tax payments. Corporations withdrew reserves from the banking system to pay the U.S. government, temporarily consuming liquidity.
- Treasury settlements—A large Treasury auction had just settled, pulling additional reserves out of the system.
- No buffer—Unlike today (before RRP was depleted), in 2019, reserves were the only source of liquidity.
- Regulatory constraints—Post-2008 regulatory requirements meant banks were less willing to lend reserves, even as rates increased, because they needed to maintain certain ratios.
The Fed's Remedy: Pre-COVID Quantitative Easing
The Fed understandably felt panicked and announced emergency repo operations within hours, injecting billions into the overnight financing market. In the following weeks, they began to stabilize the market:
- Conducting daily repo operations, adding hundreds of billions of temporary liquidity to the market.
- Announcing they would begin purchasing U.S. Treasuries again (i.e., expanding the balance sheet).
- Ending quantitative tightening months early and starting quantitative easing in October 2019.
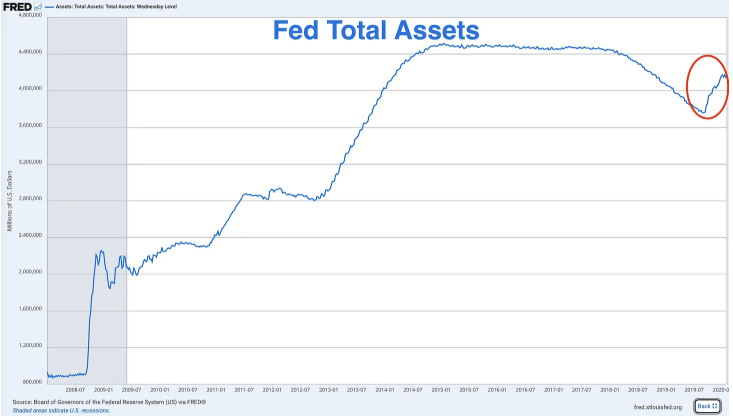
The increase in the Fed's total assets by the end of 2019 was due to quantitative easing, as the printing press began to operate.
But all of this happened in the six months leading up to the COVID-19 lockdown. Therefore, the Fed restarted quantitative easing not because of the pandemic, not because of a recession, and not because of a traditional financial crisis, but because bank reserves were too low, and the “pipes” of the financial system had broken.
Now the Fed is once again facing the issue of low bank reserves, and we are merely in the early stages of a crisis.
Differences Between Today and the 2019 Crisis
However, there are some differences between today and the 2019 crisis that are making the situation worse:
- The Treasury needs to issue more bonds
In 2019, the federal deficit was about $1 trillion per year, which, while high by historical standards, was manageable. Today, the annual deficit exceeds $2 trillion, with no end in sight. The Treasury must issue massive amounts of bonds to fund the government, and every dollar of bonds issued could absorb liquidity from the banking system.
- The Fed's balance sheet is much larger than expected
When the repo crisis erupted in 2019, the Fed's balance sheet was about $3.8 trillion. Today, even after $2 trillion of quantitative tightening (QT), it remains around $6.9 trillion. The Fed was supposed to “normalize” its balance sheet back to pre-crisis levels. But they can no longer do that because every attempt encounters the same problem: insufficient reserves.
The Fed has essentially pushed itself toward permanent quantitative easing. They cannot significantly reduce the size without damaging the system, nor can they maintain the current size without exacerbating inflation.
- Higher reserve levels are causing cracks in the system
In 2019, when the crisis erupted, reserves were at 7% of GDP, and now, at 9.7%, we are seeing warning signs. This indicates that the financial system now requires a higher reserve base to operate smoothly. The economy, banking system, and leverage have all grown larger, and regulatory requirements have become stricter, thus necessitating a larger buffer.
If a 7% reserve in 2019 broke the system, and we are now facing pressure at 9.7%, how much lower can this number go before the system collapses?
The Fed Has Signaled
Powell's statement that the Fed “may stop shrinking its balance sheet in the coming months” is not just casual talk; it is a carefully considered signal. The Fed is preparing for a policy shift, trying to avoid being caught off guard like in 2019, and taking panicked emergency adjustments.
This time, they want to appear as if they are in control. But control is merely an illusion; the outcome is the same: quantitative tightening is about to end, and quantitative easing is on the horizon.
The only question now is: will they wait for the situation to blow up, or will they act preemptively?
The Fed Must Implement Quantitative Easing (QE)
We already know that the current U.S. economy is fraught with crisis, with extremely low reserve levels, depleted RRP, widening SOFR spreads, and conditions worse than in 2019. Now, let’s delve into why the Fed is so concerned about reserve levels and what will happen when this liquidity crisis escalates.
When the reserve ratio falls below 10-11% of GDP, banks begin to exhibit stress behaviors, including:
- Being less willing to lend reserves overnight to other banks
- Hoarding liquidity to meet unexpected demands
- Charging higher rates for short-term loans (SOFR spread)
- Reducing lending to the real economy
- Making balance sheets more defensive
Currently, the reserve ratio is 9.71% of GDP, and the monetary transmission mechanism may have already begun to collapse.
The Trauma of the 2023 Banking Crisis
The Fed and regulators are deeply unsettled by the regional banking crisis in March 2023. The failures of banks like Silicon Valley Bank and First Republic Bank were due to poor liquidity management. Their long-term bonds depreciated due to rising interest rates, and when depositors withdrew funds, the banks could not cover the outflows without selling those bonds, resulting in massive losses.
Ultimately, the Fed intervened, launching the Bank Term Funding Program (BTFP), allowing banks to borrow against their underwater bonds at face value, which prevented the crisis.
This crisis is still fresh; imagine trying to reduce the overall supply of reserves (through quantitative tightening) in an environment where banks are still reeling, regulatory scrutiny is tight, and rates are below the 10% threshold. You can understand why Powell is already talking about stopping quantitative tightening.
The Fed Must Move Forward
With a current GDP of $30.5 trillion, growing at about 2-3% per year, if GDP grows by 3% this year, that means an additional output of about $900 billion. If the Fed wants to keep reserves around 10% of GDP, reserves need to increase by about $90 billion each year to keep pace with growth.
Conversely, the Fed is reducing reserves by about $300 billion each year (about $25 billion per month × 12). Even if the Fed stops quantitative tightening today and stabilizes reserves at $2.96 trillion, the ratio of reserves to GDP will still decline over time, from 9.7% to 9.5%, then to 9.2%, and even lower.
To maintain that ratio stable (or bring it back above 10%), the Fed has two options:
- Allow reserve growth to match GDP (moderate quantitative easing)
- Let the ratio gradually decline until a breakthrough occurs
There is no third option; in short, the Fed is like a mouse trapped in a hamster wheel, forced to move forward.
The Fed will officially announce the end of quantitative tightening at the FOMC meeting in December or January. They will describe it as a “technical adjustment to maintain adequate reserves,” rather than a policy shift. If there is a significant reduction in reserves again before the end of the year, the Fed may be forced to issue an emergency statement like in 2019.
The Fed Always Overcorrects
The federal government has an annual deficit exceeding $2 trillion, and the Treasury needs to issue a large number of bonds. With RRP depleted, where will the funds come from? There is not enough private demand to absorb $2 trillion in bonds each year unless yields soar. If banks use reserves to buy U.S. Treasuries, it will further deplete reserves, exacerbating the problem.
This forces the Fed to become the last buyer again. Additionally, with GDP growing at 2-3% annually, reserves need to increase by $60-90 billion each year to maintain the current ratio.
Looking back at 2008-2014, the Fed's quantitative easing was not restrained. They conducted three rounds of quantitative easing and one operation twist, increasing the balance sheet from $900 billion to $4.5 trillion.
Then look at 2019-2020; they restarted balance sheet expansion in October 2019 (purchasing $60 billion in U.S. Treasuries monthly). Then the COVID-19 pandemic hit, and they launched a massive expansion, adding $5 trillion in just a few months.
When the Fed shifts to easing policies, they always overcorrect. Therefore, when this round of quantitative tightening ends, do not expect the Fed to conduct quantitative easing in a gentle, gradual manner; what to anticipate is a flood-like expansion.
The Fed may purchase $60 billion to $100 billion in U.S. Treasuries each month to “maintain adequate reserves and ensure market stability.”
What Should We Do?
When central banks begin to print money indiscriminately, our only rational response is to hold assets that they cannot print: gold and Bitcoin.
The market has already priced in the quantitative easing policy into gold, and the price of gold has skyrocketed. In January 2025, the price of gold was around $2,500, and it has now risen over 70%, with trading prices exceeding $4,000 per ounce. Smart investors are not waiting for the Fed to announce quantitative easing; they have already started to "Buy in."
In addition to gold, Bitcoin is also the best asset to counter the impending tsunami of quantitative easing.
Bitcoin is the first truly scarce digital asset, with a total supply fixed at 21 million. While the Fed can print an unlimited amount of dollars, neither the Fed, the government, corporations, nor miners can create more Bitcoin.
At the same time, Bitcoin has even greater upside potential than gold for the following reasons:
- Bitcoin is harder to mine than gold.
- The supply of gold increases each year through mining, adding about 1.5-2% annually; the scarcity of gold is relative, not absolute. Bitcoin's supply grows at a fixed diminishing rate (halving every four years) and will reach an absolute peak of 21 million around 2140, after which no more Bitcoin will be issued, forever.
- Bitcoin is the hardest currency to mine in human history.
- Bitcoin follows gold's trend and has a multiplier effect. Currently, Bitcoin's performance is clearly "lagging" behind gold, but historically, when gold rises due to concerns about monetary policy, Bitcoin eventually catches up and often exceeds gold's percentage gains.
- Bitcoin allows you to completely escape the sovereign debt Ponzi scheme. Gold can protect you from inflation, but Bitcoin's role goes far beyond that; it exists entirely outside the system, cannot be confiscated (if properly stored), cannot be devalued, and is not manipulated by central banks.
In summary, I hope your investment decisions can be more informed after understanding the reasons behind the Fed's impending shift from quantitative tightening to quantitative easing, the liquidity situation, and why Bitcoin and gold are assets worth holding during the upcoming period of monetary expansion.
免责声明:本文章仅代表作者个人观点,不代表本平台的立场和观点。本文章仅供信息分享,不构成对任何人的任何投资建议。用户与作者之间的任何争议,与本平台无关。如网页中刊载的文章或图片涉及侵权,请提供相关的权利证明和身份证明发送邮件到support@aicoin.com,本平台相关工作人员将会进行核查。


