Market makers enjoy all the privileges of providing liquidity without having to bear any responsibility.
Author: YQ
Translation: Deep Tide TechFlow
In my previous three analyses of the cryptocurrency clearing storm from October 10 to 11, I explored oracle failures, infrastructure collapses, and potential coordinated attack paths. Today, I will focus on perhaps the most critical yet underestimated aspect: how market makers—entities that should provide market stability—became the main catalyst for creating an unprecedented liquidity vacuum, turning a manageable adjustment into a $19 billion disaster.
Understanding Market Makers: The Gap Between Theory and Reality
Before analyzing the October crash, it is essential to understand the theoretical function of market makers. In traditional financial markets, market makers act as intermediaries, continuously providing buy and sell quotes for financial instruments. They profit from the spread between these prices while providing a crucial service: liquidity.
The theoretical roles of market makers include:
Continuous Price Discovery: Reflecting fair market value by maintaining two-way quotes
Liquidity Provision: Ensuring traders can buy and sell at any time without significantly impacting prices
Volatility Mitigation: Absorbing temporary supply and demand imbalances
Market Efficiency: Maintaining uniform pricing by arbitraging price differences across platforms
In the cryptocurrency market, the operation of market makers is similar to traditional markets but faces unique challenges:
Operates 24/7 with no market closure
Liquidity is dispersed across hundreds of exchanges
Extreme volatility compared to traditional assets
Restrictive regulatory oversight and obligations
Technical infrastructure required for high-frequency trading
Under normal market conditions, this system operates relatively well. Market makers profit from moderate spreads while providing necessary liquidity. However, the events of October 10 to 11 revealed the consequences when incentives and responsibilities diverge.
Timeline of Liquidity Disappearance
During the October crash, the precision of market makers' withdrawal indicated a coordinated behavior rather than mere panic. Here is a detailed timeline of liquidity disappearance:
- 20:00 UTC (4:00 PM EST): Trump officially announces a 100% tariff on Chinese imports on social media. Bitcoin's price begins to drop from $122,000. Market makers maintain their positions but start to widen the spread—this is a standard defensive behavior.
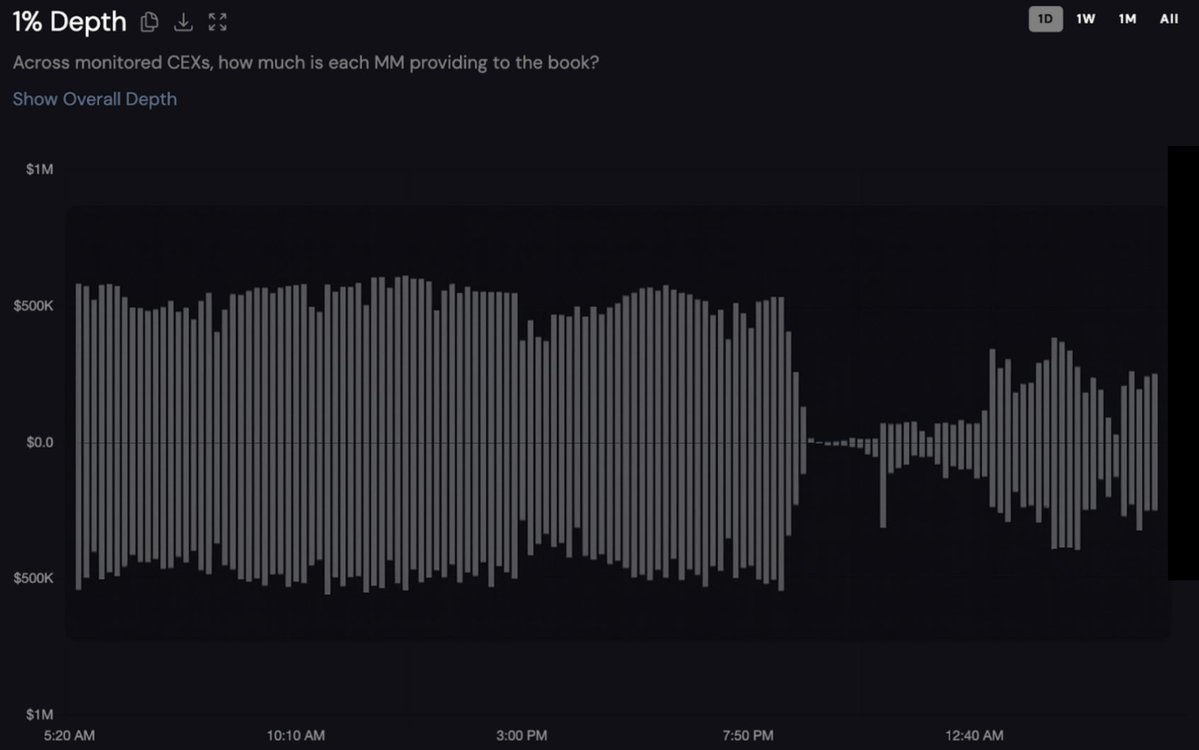
Bid-ask depth chart for an unnamed token on Binance over the past 24 hours. Buy orders are below the x-axis, and sell orders are above. Data source: Coinwatch
20:40 UTC: Real-time tracking data shows the beginning of a catastrophic liquidity withdrawal. The market depth for a major token sharply declines from $1.2 million.
21:00 UTC: A critical turning point. As U.S. trading begins, macroeconomic conditions deteriorate sharply. Institutional participants withdraw liquidity, spreads widen, and order book depth thins. At this point, market makers shift from defensive positions to complete withdrawal.
21:20 UTC: Chaos peaks. In the global clearing wave, almost all tokens hit bottom at this time. The market depth for tracked tokens drops to just $27,000—a 98% crash. As prices fall to $108,000, liquidity providers stop defending prices, and some altcoins drop by 80%.
21:35 UTC: As the most intense sell-off exhausts, market makers cautiously begin to return. Within 35 minutes, the combined depth of bid-ask spreads on centralized exchanges (CEX) recovers to over 90% of pre-event levels—but this is after the maximum damage has occurred.
This pattern reveals three key insights:
Market makers had a 20-40 minute warning before complete withdrawal.
Liquidity withdrawal was synchronized across multiple firms.
Liquidity only returned after profitable re-entry points emerged.
When Insurance Funds Fail: The Automatic Deleveraging (ADL) Chain Reaction
When market makers abandon their posts and liquidation sweeps the order book, exchanges initiate the last line of defense: Automatic Deleveraging (ADL). Understanding this mechanism is crucial for a comprehensive grasp of the October disaster.
ADL Mechanism in Centralized Exchanges
ADL is the third and final layer in the clearing hierarchy:
First Layer - Order Book Liquidation: When positions fall below the maintenance insurance fund, the exchange attempts to close positions through the order book. If liquidation can be successfully executed at a price better than the bankruptcy price (insurance fund = 0), the remaining funds will flow into the insurance fund.
Second Layer - Insurance Fund: If order book liquidity is insufficient, the insurance fund absorbs the losses. This fund is accumulated from clearing profits during normal times and acts as a buffer for bad debts.
Third Layer - Automatic Deleveraging (ADL): When the insurance fund cannot cover the losses, the exchange forcibly closes profitable positions on the opposite side.
ADL Ranking System
Binance's ADL Mechanism
Binance's ADL mechanism employs a complex ranking formula: ADL Ranking Score = Position P&L Percentage × Effective Leverage
Where:
Position P&L Percentage = Unrealized Profit / abs(Position Notional Value)
Effective Leverage = abs(Position Notional Value) / (Account Balance - Unrealized Loss + Unrealized Profit)
Bybit's Approach
Bybit's approach is similar to Binance's but includes additional protective measures. They display your ranking percentile through a five-light indicator:
5 Lights = Top 20% (Highest ADL Priority)
4 Lights = 20%-40%
3 Lights = 40%-60%
2 Lights = 60%-80%
1 Light = Bottom 20% (Lowest ADL Priority)
The most successful traders—those with the highest profits and leverage—are prioritized for forced liquidation. This is the most brutal aspect of the ADL mechanism.
The ADL Disaster of October
The scale of Automatic Deleveraging (ADL) from October 10 to 11 was unprecedented:
Hyperliquid: Initiated cross-insurance fund ADL for the first time in two years, affecting over 1,000 wallets.
Binance: Widely triggered ADL.
Bybit: Reported over 50,000 short positions being deleveraged, totaling $1.1 billion.
BitMEX: An exception, with only 15 contracts triggering ADL, thanks to its large insurance fund.
The timing of ADL initiation was highly correlated with the timing of market makers' withdrawal. Between 21:00 and 21:20 UTC, order book liquidity was depleted, and liquidation could not proceed normally, forcing the insurance fund to rapidly deplete and trigger ADL.
Case Study: The Catastrophic Impact of Chain Reactions
Here is a typical hedge portfolio's experience during this critical 35 minutes:
21:00 UTC: The trader holds:
BTC Long: $5 million, 3x leverage
DOGE Short: $500,000, 15x leverage (profitable hedge position)
ETH Long: $1 million, 5x leverage
21:10 UTC: Market makers withdraw, DOGE's price plummets, and the short position becomes highly profitable. However, due to the combination of high leverage and profits, ADL is triggered.
21:15 UTC: DOGE shorts are forcibly liquidated, and the portfolio loses its hedge protection.
21:20 UTC: After losing the hedge, BTC and ETH long positions are liquidated in a chain reaction. Final loss: the entire portfolio goes to zero.
This pattern repeated thousands of times in the market. Many carefully balanced positions were forcibly closed by ADL, leading to the loss of hedge protection, followed by the liquidation of exposed long or short positions, resulting in devastating losses.
Why Market Makers Failed: The Problem of Incentives
The synchronized withdrawal of liquidity exposed a fundamental structural issue. Market makers faced multiple incentives to abandon the market:
Asymmetry of Risk and Reward: During extreme volatility, the potential losses from maintaining quotes far exceed the spread profits under normal conditions. A market maker providing a $1 million depth quote might earn $10,000 in spread profit during normal times but could face losses of up to $500,000 during a market crash.
Information Advantage: Market makers can see the overall order flow and position distribution. When they notice a significant bullish bias in the market (87% of positions are long), they clearly understand the direction of the impending crash. Knowing the sell-off wave is coming, why would they continue to provide buy quotes?
No Legal Obligation: Unlike designated market makers in traditional exchanges, cryptocurrency market makers can withdraw at any time without regulatory requirements. Abandoning the market during a crisis incurs no penalties.
Arbitrage Opportunities: Data from the crash indicates that withdrawing market makers turned to arbitrage between exchanges. When price differences between different platforms exceeded $300, the profits from arbitrage trading far outweighed traditional market-making activities.
A Destructive Feedback Loop
The interaction between market maker withdrawal and Automatic Deleveraging (ADL) formed a catastrophic feedback loop:
Initial shock (Trump's tariff announcement) triggers sell-off;
Market makers perceive a potential crash and choose to withdraw;
Liquidation cannot proceed normally due to an empty order book;
The insurance fund rapidly depletes to absorb bad debts;
ADL is triggered, forcibly closing profitable positions;
Deleveraged traders must re-hedge, increasing selling pressure;
More liquidations trigger, looping back to step 3.
This cycle continues until leveraged positions are nearly eliminated. Data shows that the overall open interest in the market dropped by about 50% within hours.
The Truth About Market Structure
The disaster from October 10 to 11 was not primarily triggered by excessive leverage or regulatory failures, but rather by misaligned incentives within the market structure. When participants responsible for maintaining market order profit far more from chaos than from stability, chaos becomes inevitable.
Timeline data shows that market makers did not panic but executed a coordinated withdrawal at the optimal moment to minimize their own losses while maximizing subsequent opportunities. This rational behavior under the current incentive structure led to irrational outcomes for the market as a whole.
Rebuilding Trust Through Responsibility
The liquidity crisis in October 2025 revealed a key weakness in the cryptocurrency market: when mandatory liquidity support is most needed, voluntary liquidity provision fails. The $19 billion in liquidations was not merely a failure of over-leveraged traders but an inevitable result of a systemic issue—market makers enjoy all the privileges of providing liquidity without bearing any responsibility.
Future solutions must acknowledge a fact: a purely laissez-faire market-making mechanism cannot function effectively under stress. Just as traditional markets evolved from the chaos of unregulated trading to introduce circuit breakers, position limits, and market maker obligations, the crypto market must implement similar safeguards.
Technical solutions already exist:
Tiered Responsibility System: Linking interests with responsibilities;
Insurance Fund Size Matching Actual Risks: Avoiding overly optimistic forecasts;
ADL Mechanism Combined with Circuit Breakers: Preventing liquidation chain reactions;
Real-Time Transparency of Market Maker Behavior: Enhancing trust.
What is truly lacking is the willingness to implement these measures. Unless cryptocurrency exchanges prioritize long-term stability over short-term transaction fee revenue, similar "unprecedented" events will continue to occur with frustrating frequency.
The 1.6 million accounts liquidated on October 10 to 11 paid the price for this structural failure. The question is whether the industry will learn from their sacrifices or continue to wait for the next batch of traders to discover, in times of crisis, that the market makers they relied on have vanished like smoke, leaving only liquidation chain reactions and forcibly closed profitable positions.
The above analysis is based on existing market data, cross-platform price comparisons, and established patterns of market behavior. The views expressed in this article are solely personal opinions, inspired by relevant information but do not represent the position of any entity.
免责声明:本文章仅代表作者个人观点,不代表本平台的立场和观点。本文章仅供信息分享,不构成对任何人的任何投资建议。用户与作者之间的任何争议,与本平台无关。如网页中刊载的文章或图片涉及侵权,请提供相关的权利证明和身份证明发送邮件到support@aicoin.com,本平台相关工作人员将会进行核查。


