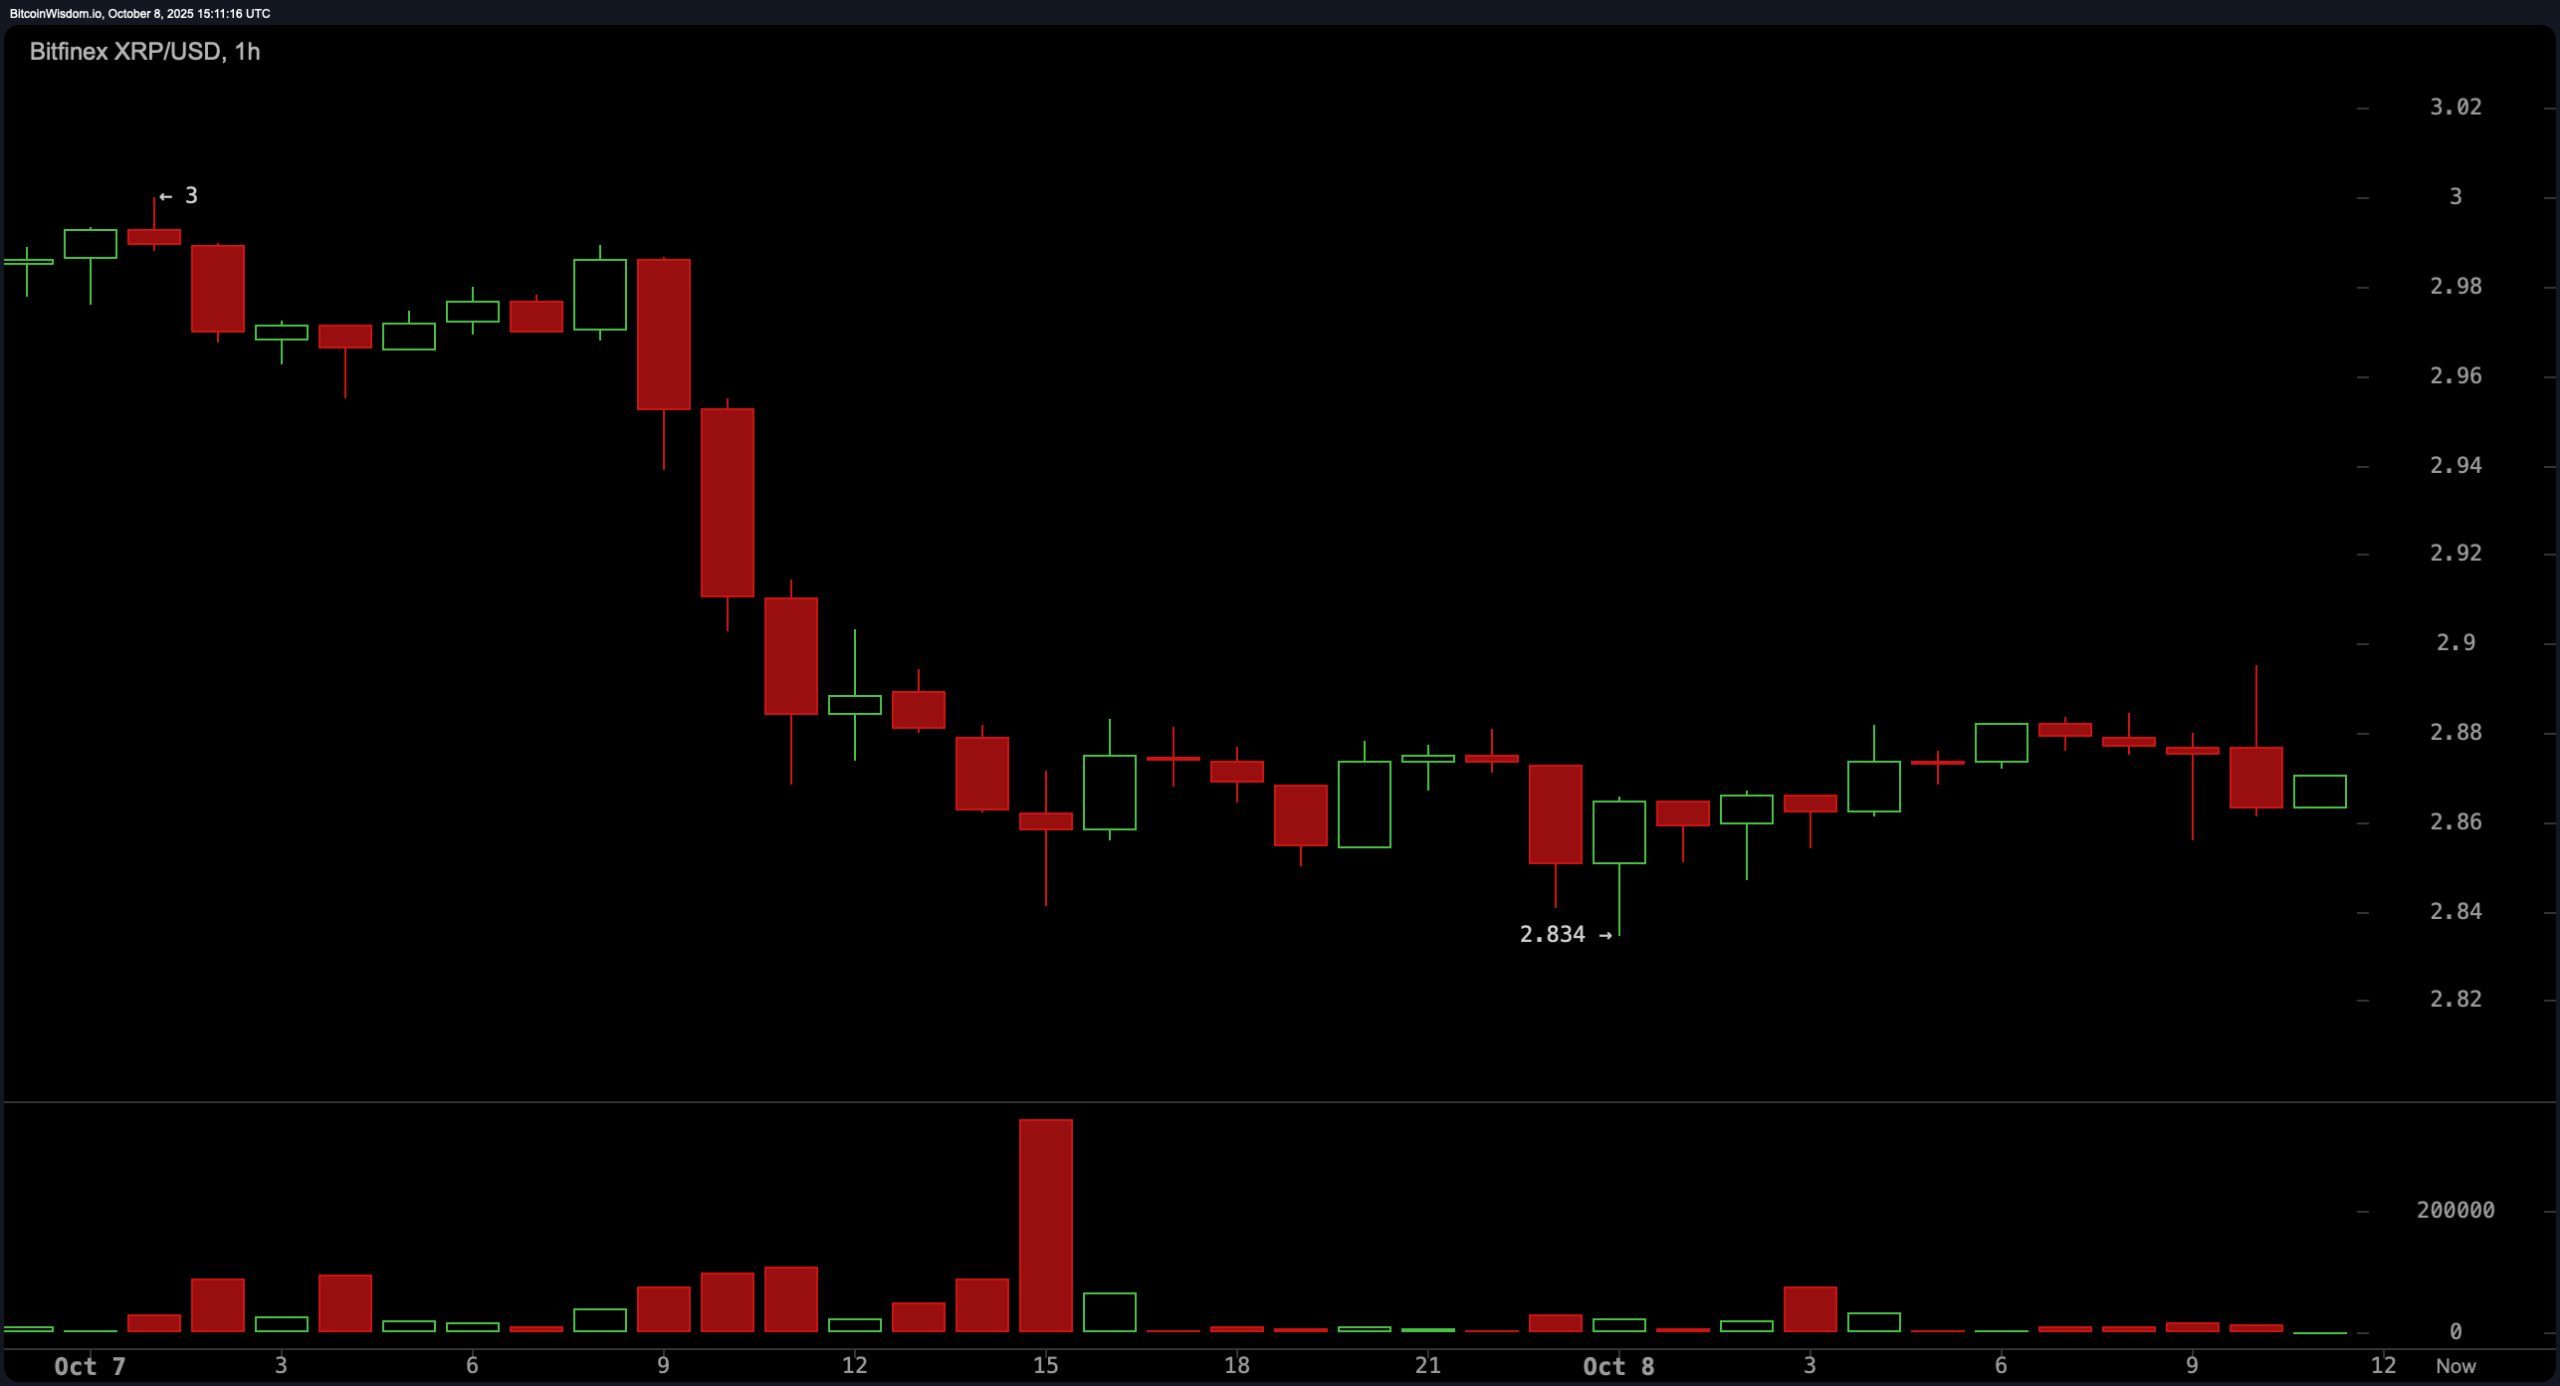
XRP’s 1-hour chart reflects a short-term stabilization in price action following a decline from the $3.00 level. The token found consistent support around the $2.83 level and has since hovered within the $2.86–$2.88 range.
However, the absence of a significant breakout and the presence of low volume during attempted recoveries indicate that market participants remain cautious. While minor scalp-long opportunities may arise between $2.83 and $2.88, these should be approached with a tight stop-loss, as price movement above $2.90 remains elusive.

XRP/USD 1-hour chart via Bitfinex on Oct. 8, 2025.
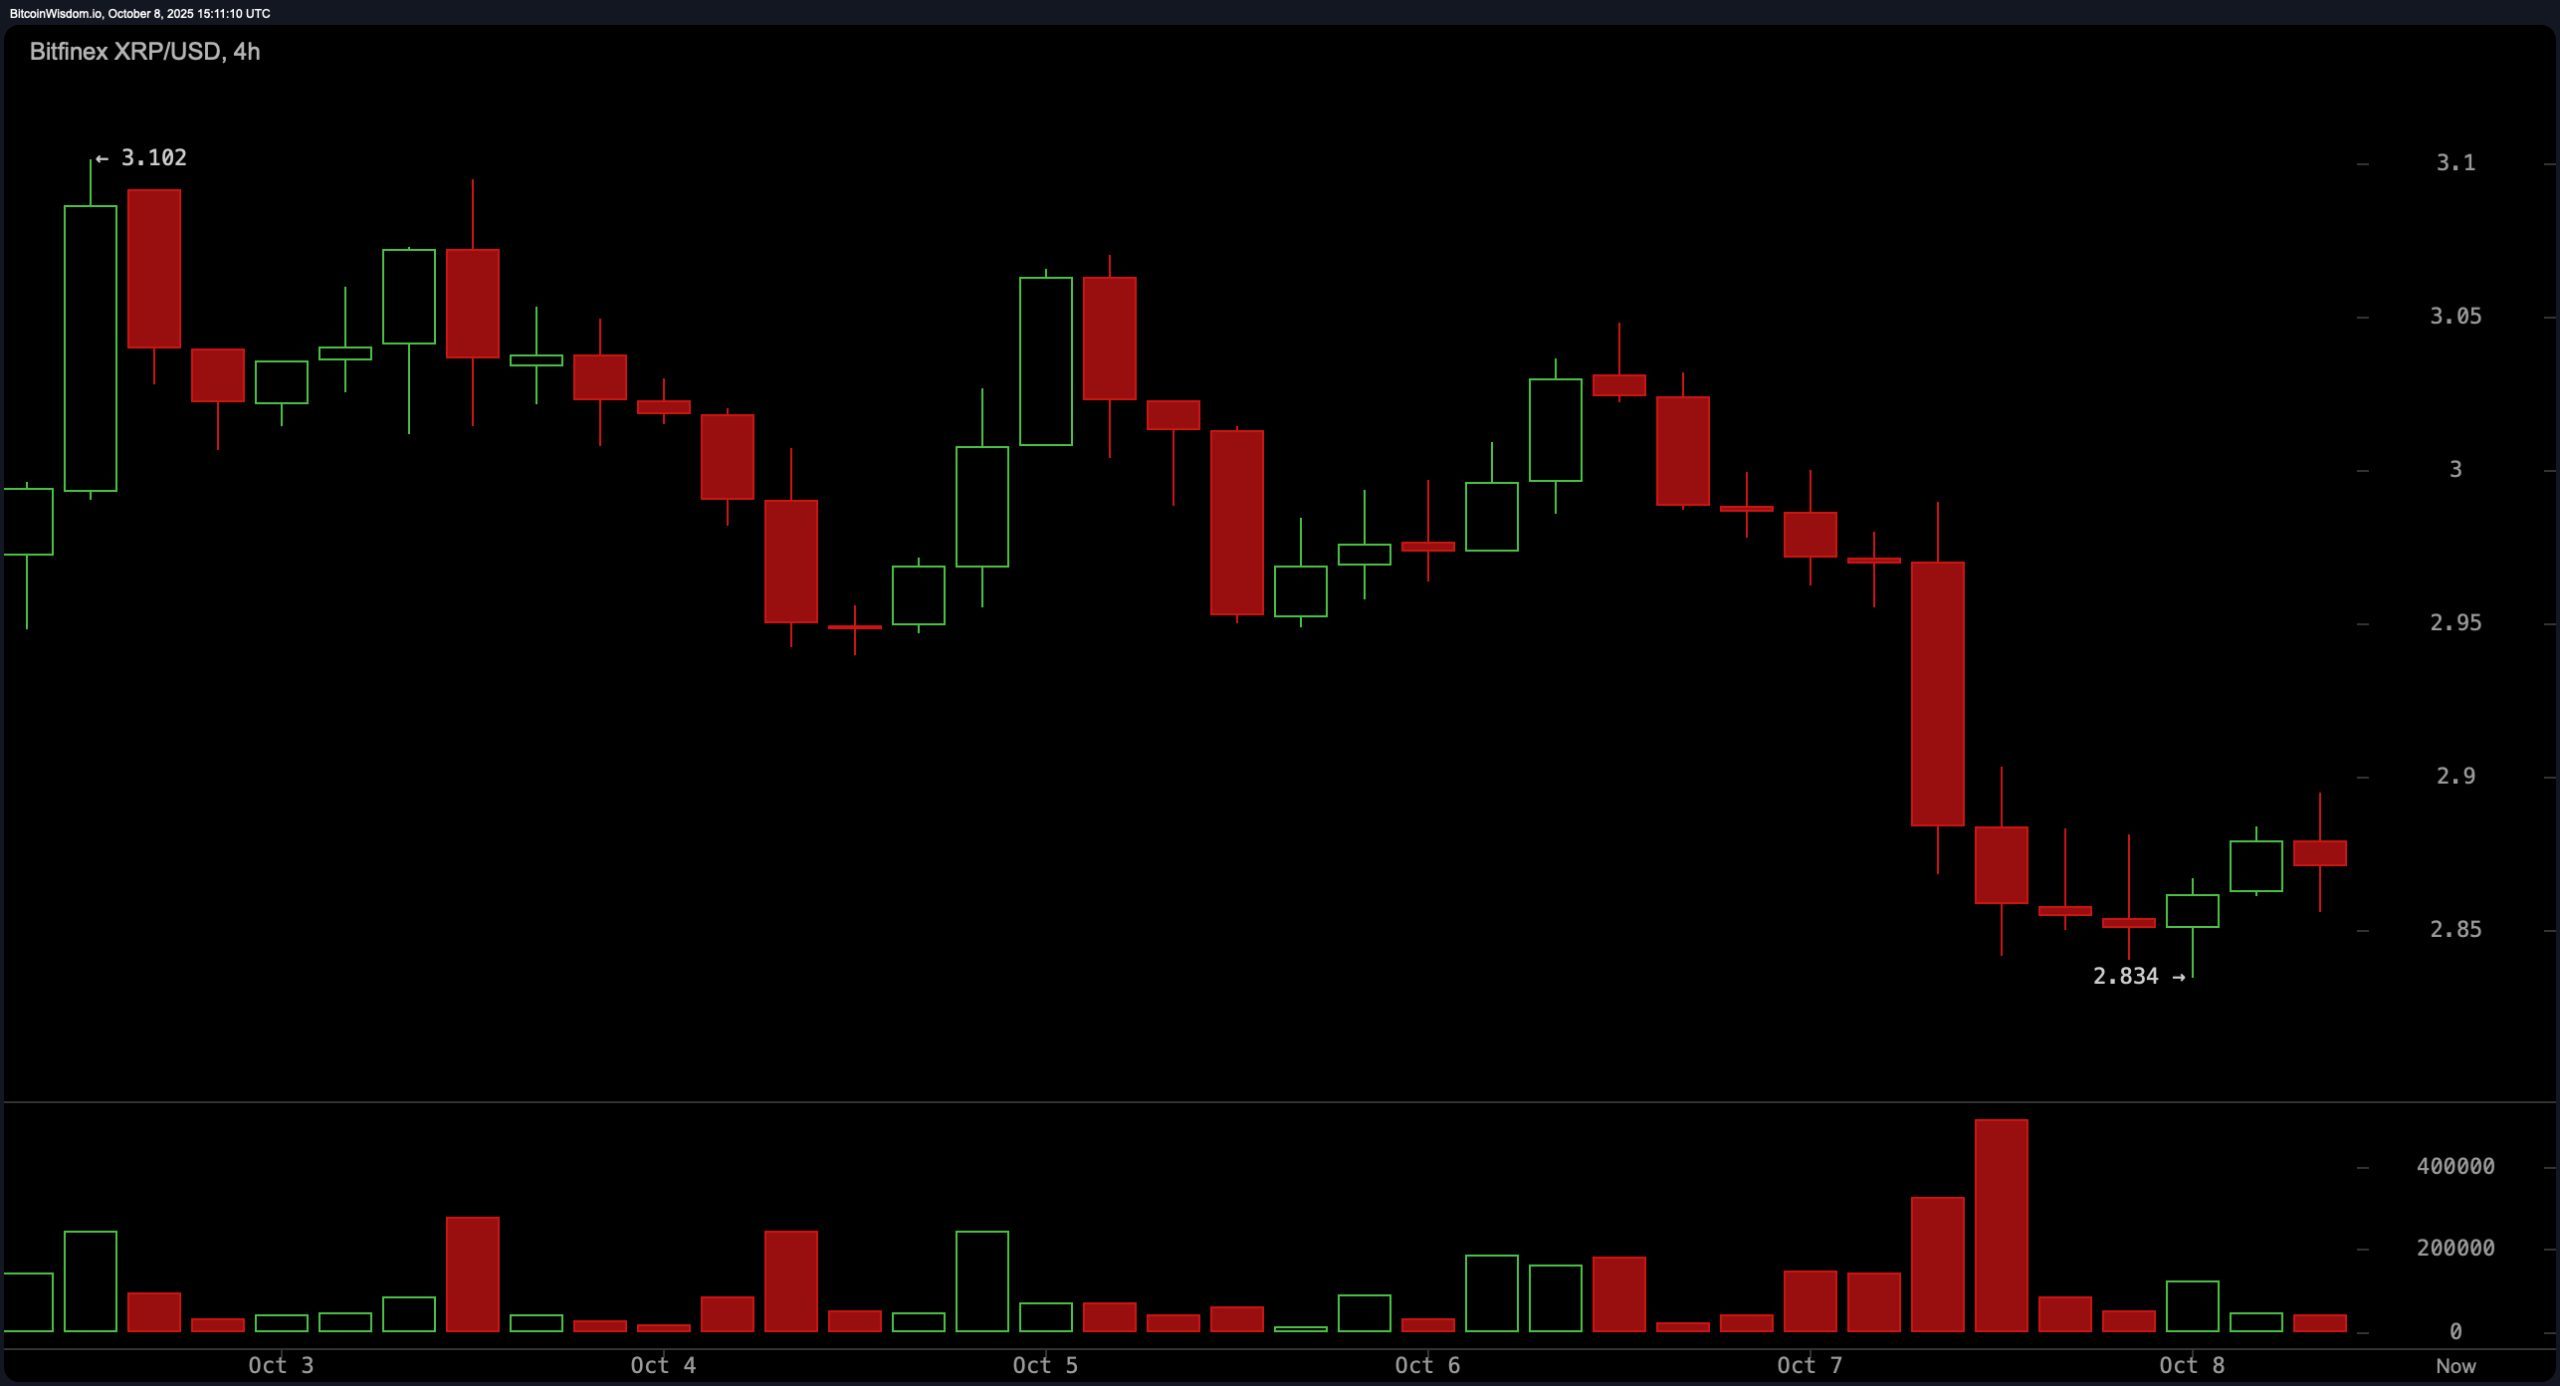
The 4-hour chart paints a clearer picture of XRP’s attempt to recover after slipping below the $3.00 psychological level. Following a drop to $2.834, XRP has stayed range-bound between $2.83 and $2.88, with a series of lower highs suggesting persistent bearish pressure. Volume accompanying recent recovery candles has diminished, implying weak buyer conviction. A potential bearish flag or pennant pattern appears to be forming, and without a confirmed breakout above the $2.90–$2.92 range, downside continuation remains a real possibility.

XRP/USD 4-hour chart via Bitfinex on Oct. 8, 2025.
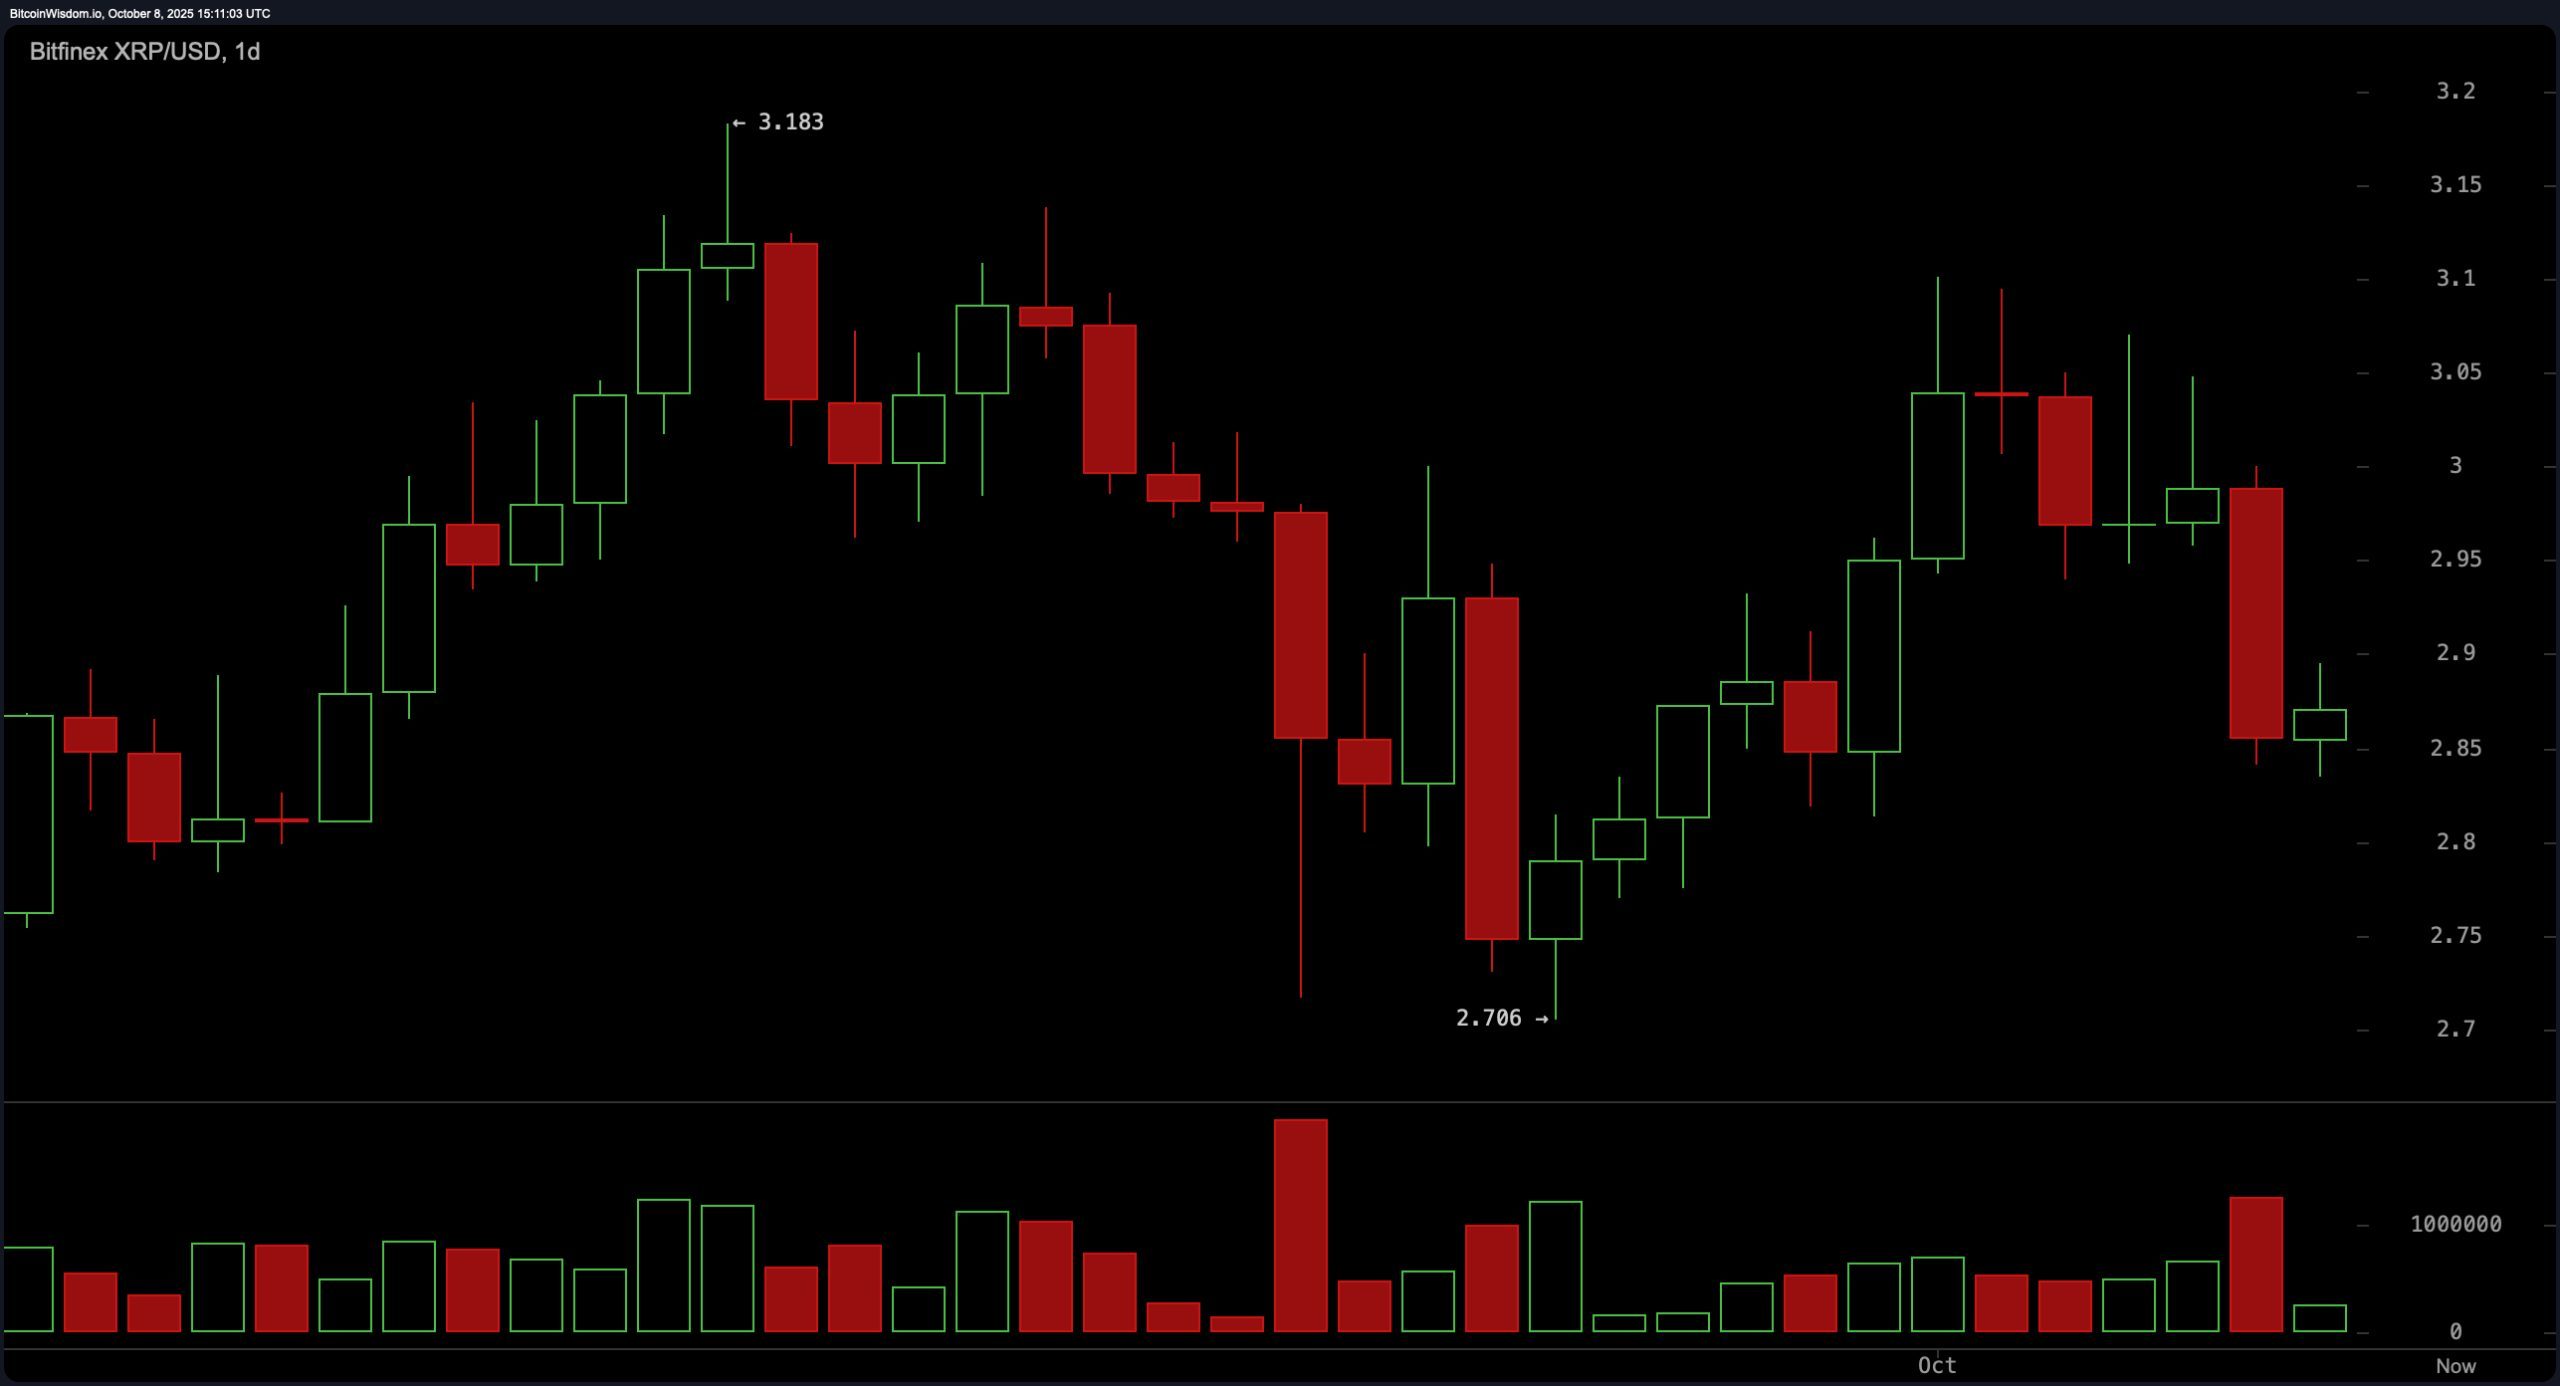
On the daily chart, XRP appears to be in a consolidation phase after a steep drop from its recent high of approximately $3.183 to a low near $2.706. The token currently trades within a narrow band, attempting to form a local bottom just above the $2.70–$2.75 support zone. A bearish engulfing candlestick on high volume suggests that the prior sell-off was backed by substantial selling pressure. Despite the minor rebound, no clear bullish reversal patterns have emerged, and the lack of upward momentum keeps sentiment subdued on this timeframe.

XRP/USD 1-day chart via Bitfinex on Oct. 8, 2025.
Oscillator readings largely confirm the neutral-to-bearish tone seen across multiple timeframes. The relative strength index (RSI) at 45.49, the Stochastic at 50.59, the commodity channel index (CCI) at -43.34, the average directional index (ADX) at 12.92, and the Awesome oscillator at 0.01436 all return neutral readings. However, the momentum indicator at -0.00021 and the moving average convergence divergence (MACD) at -0.00602 both issue negative signals. Collectively, this suggests a lack of strong directional conviction, with short-term bias leaning slightly bearish.
Moving averages (MAs) also indicate bearish pressure across most short- and mid-term timeframes. The exponential moving averages (EMAs) for 10, 20, 30, and 50 periods are all issuing negative signals, as are the corresponding simple moving averages (SMAs). Notably, only the 100-period and 200-period EMAs, as well as the 200-period SMA, suggest a potential longer-term bullish support, issuing positive signals. Until XRP can reclaim key resistance levels with convincing volume, traders are likely to remain defensive, particularly in light of persistent downward pressure indicated by shorter-term moving averages.
Bull Verdict:
If XRP maintains its footing above the $2.83 support and breaks decisively above the $2.90–$2.92 resistance zone with strong volume, a bullish continuation toward the $3.00–$3.18 range becomes plausible. Longer-term moving averages showing buy signals may support a sustained upward move if buyers step in with conviction.
Bear Verdict:
With weak recovery volume, persistent lower highs, and sell signals across key short-term moving averages and momentum indicators, the bearish structure remains intact. A failure to reclaim the $2.90 level could invite further downside toward the $2.70–$2.75 support range, making short setups more favorable in the near term.
免责声明:本文章仅代表作者个人观点,不代表本平台的立场和观点。本文章仅供信息分享,不构成对任何人的任何投资建议。用户与作者之间的任何争议,与本平台无关。如网页中刊载的文章或图片涉及侵权,请提供相关的权利证明和身份证明发送邮件到support@aicoin.com,本平台相关工作人员将会进行核查。


