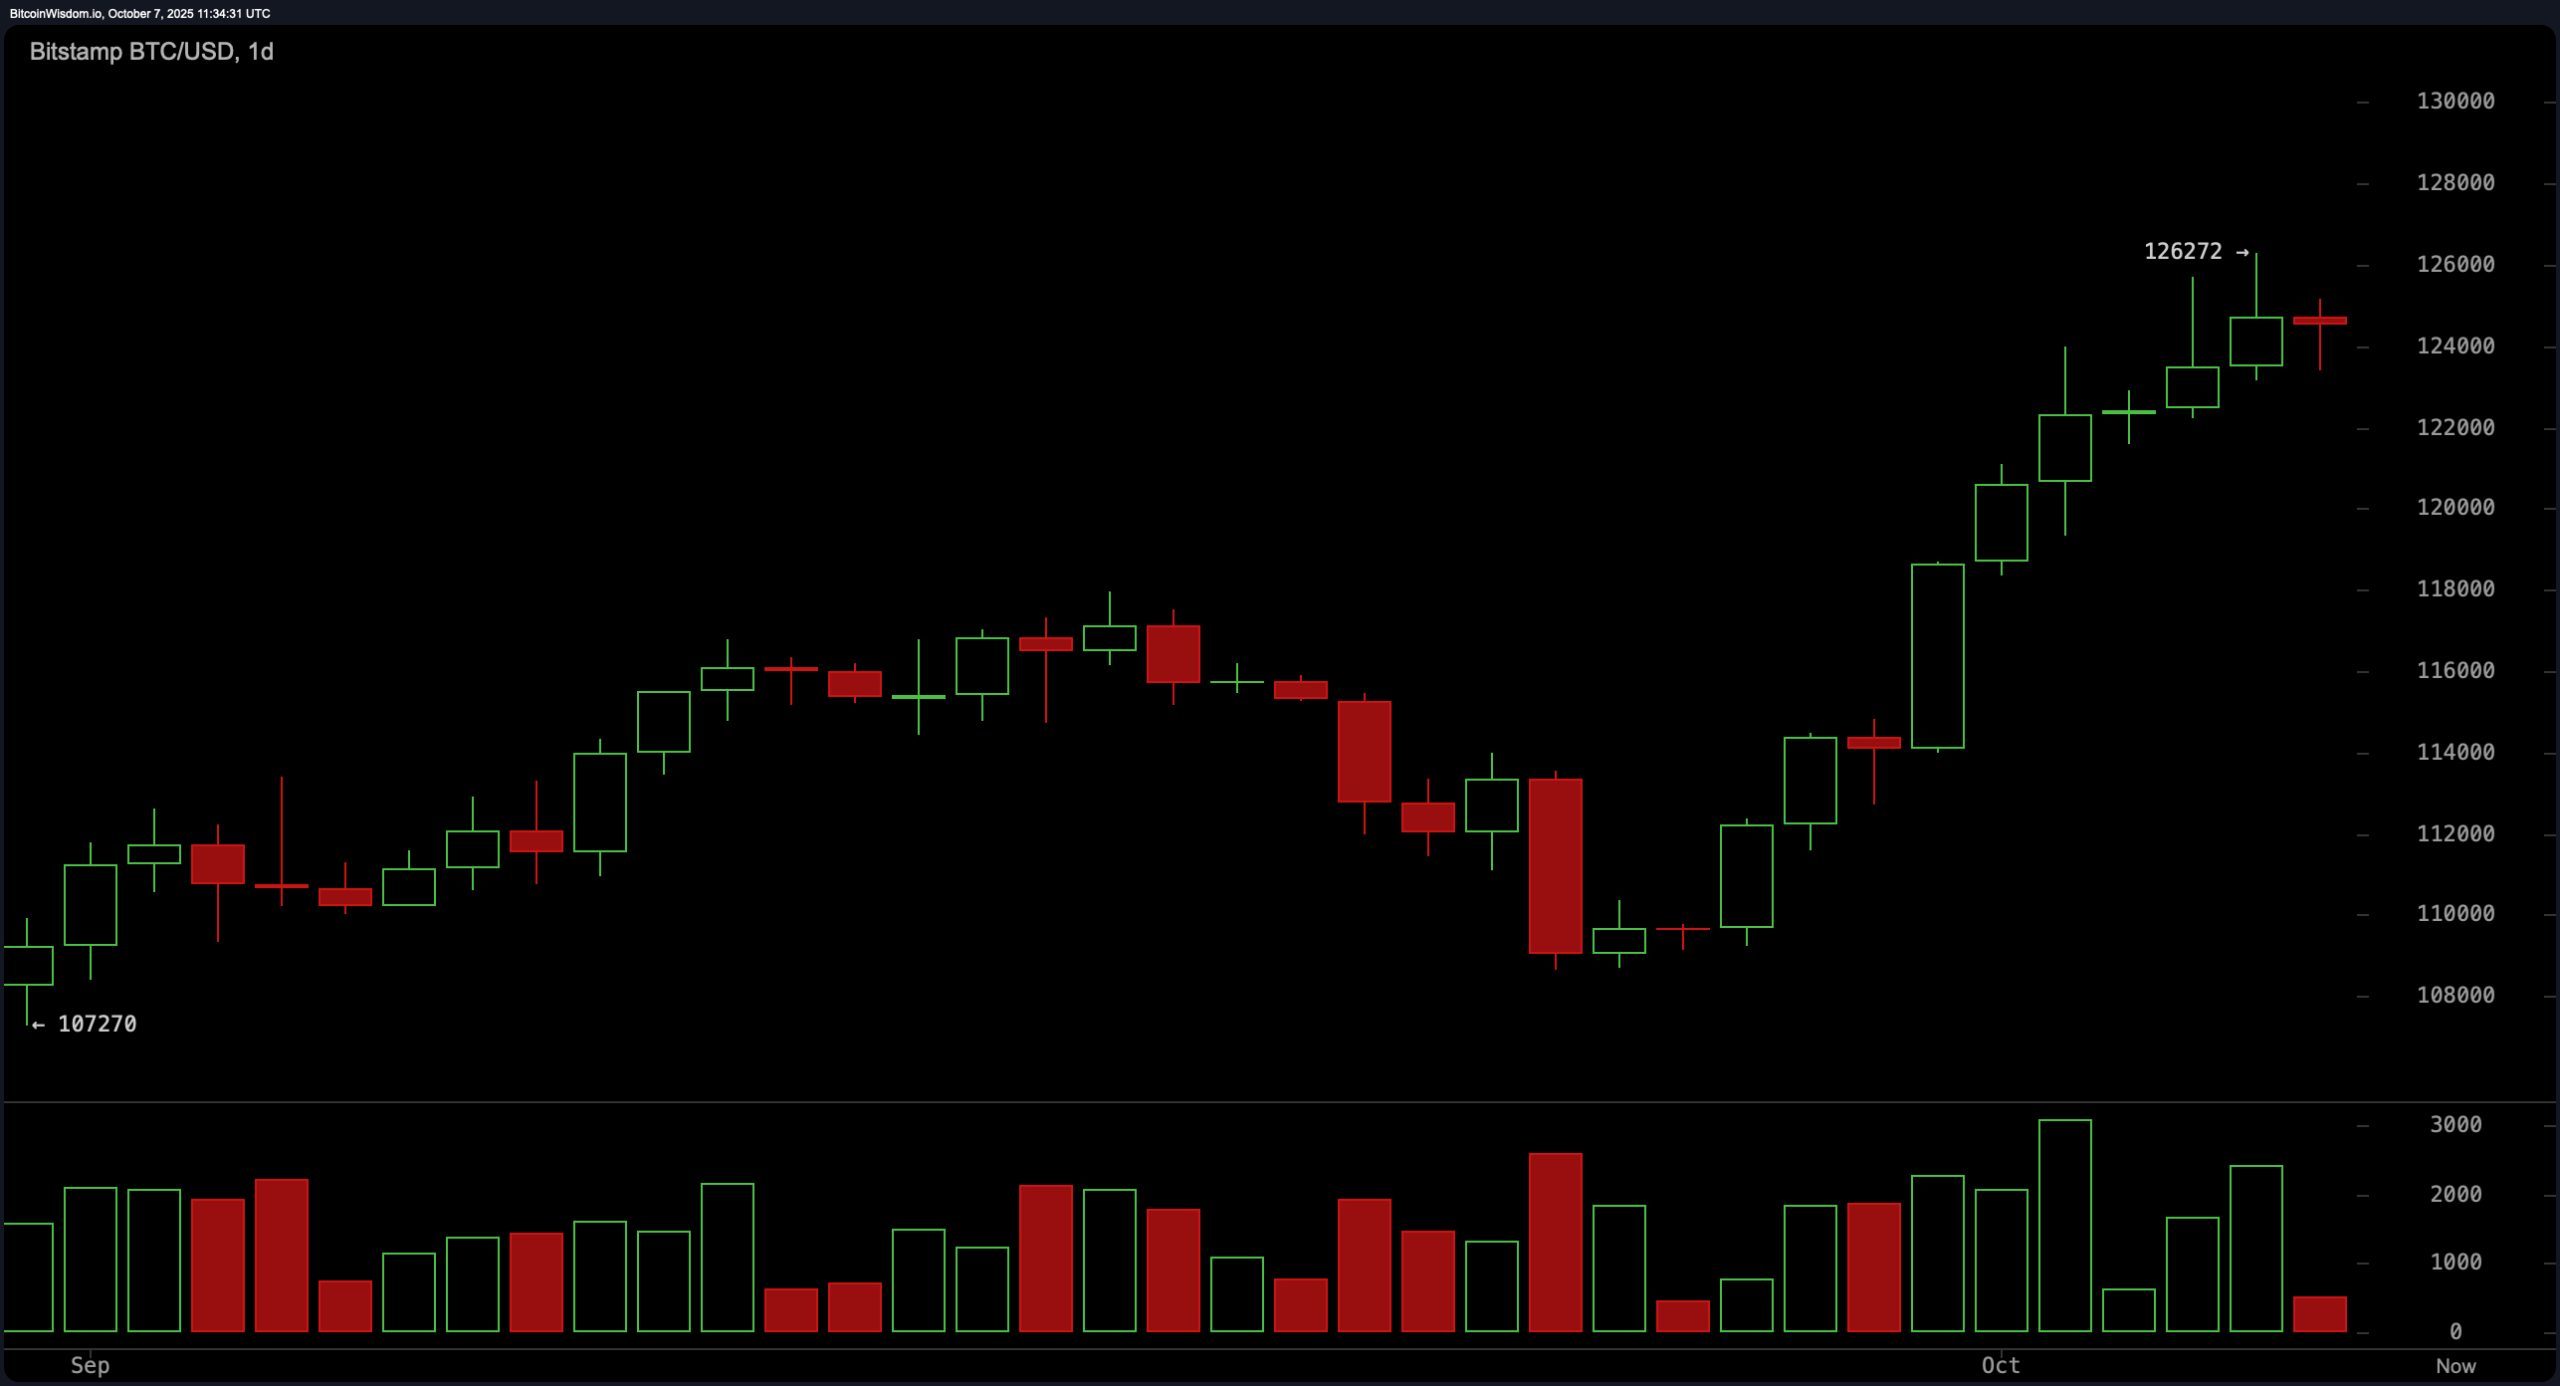
On the daily chart, bitcoin remains perched in a post-rally pause after its recent push above $126,000. While the macro trend is bullish, price action is cooling off, with two consecutive indecisive candles suggesting momentum may be fading.
Support is materializing around $124,000, and a retracement to the $122,000–$123,000 range could offer an attractive long setup—assuming bulls show up with volume. Resistance still lurks near $126,000–$127,000, and without a strong catalyst, upside may be capped short-term. For now, this looks like a market catching its breath.

BTC/USD 1-day chart via Bitstamp on Oct. 7, 2025.
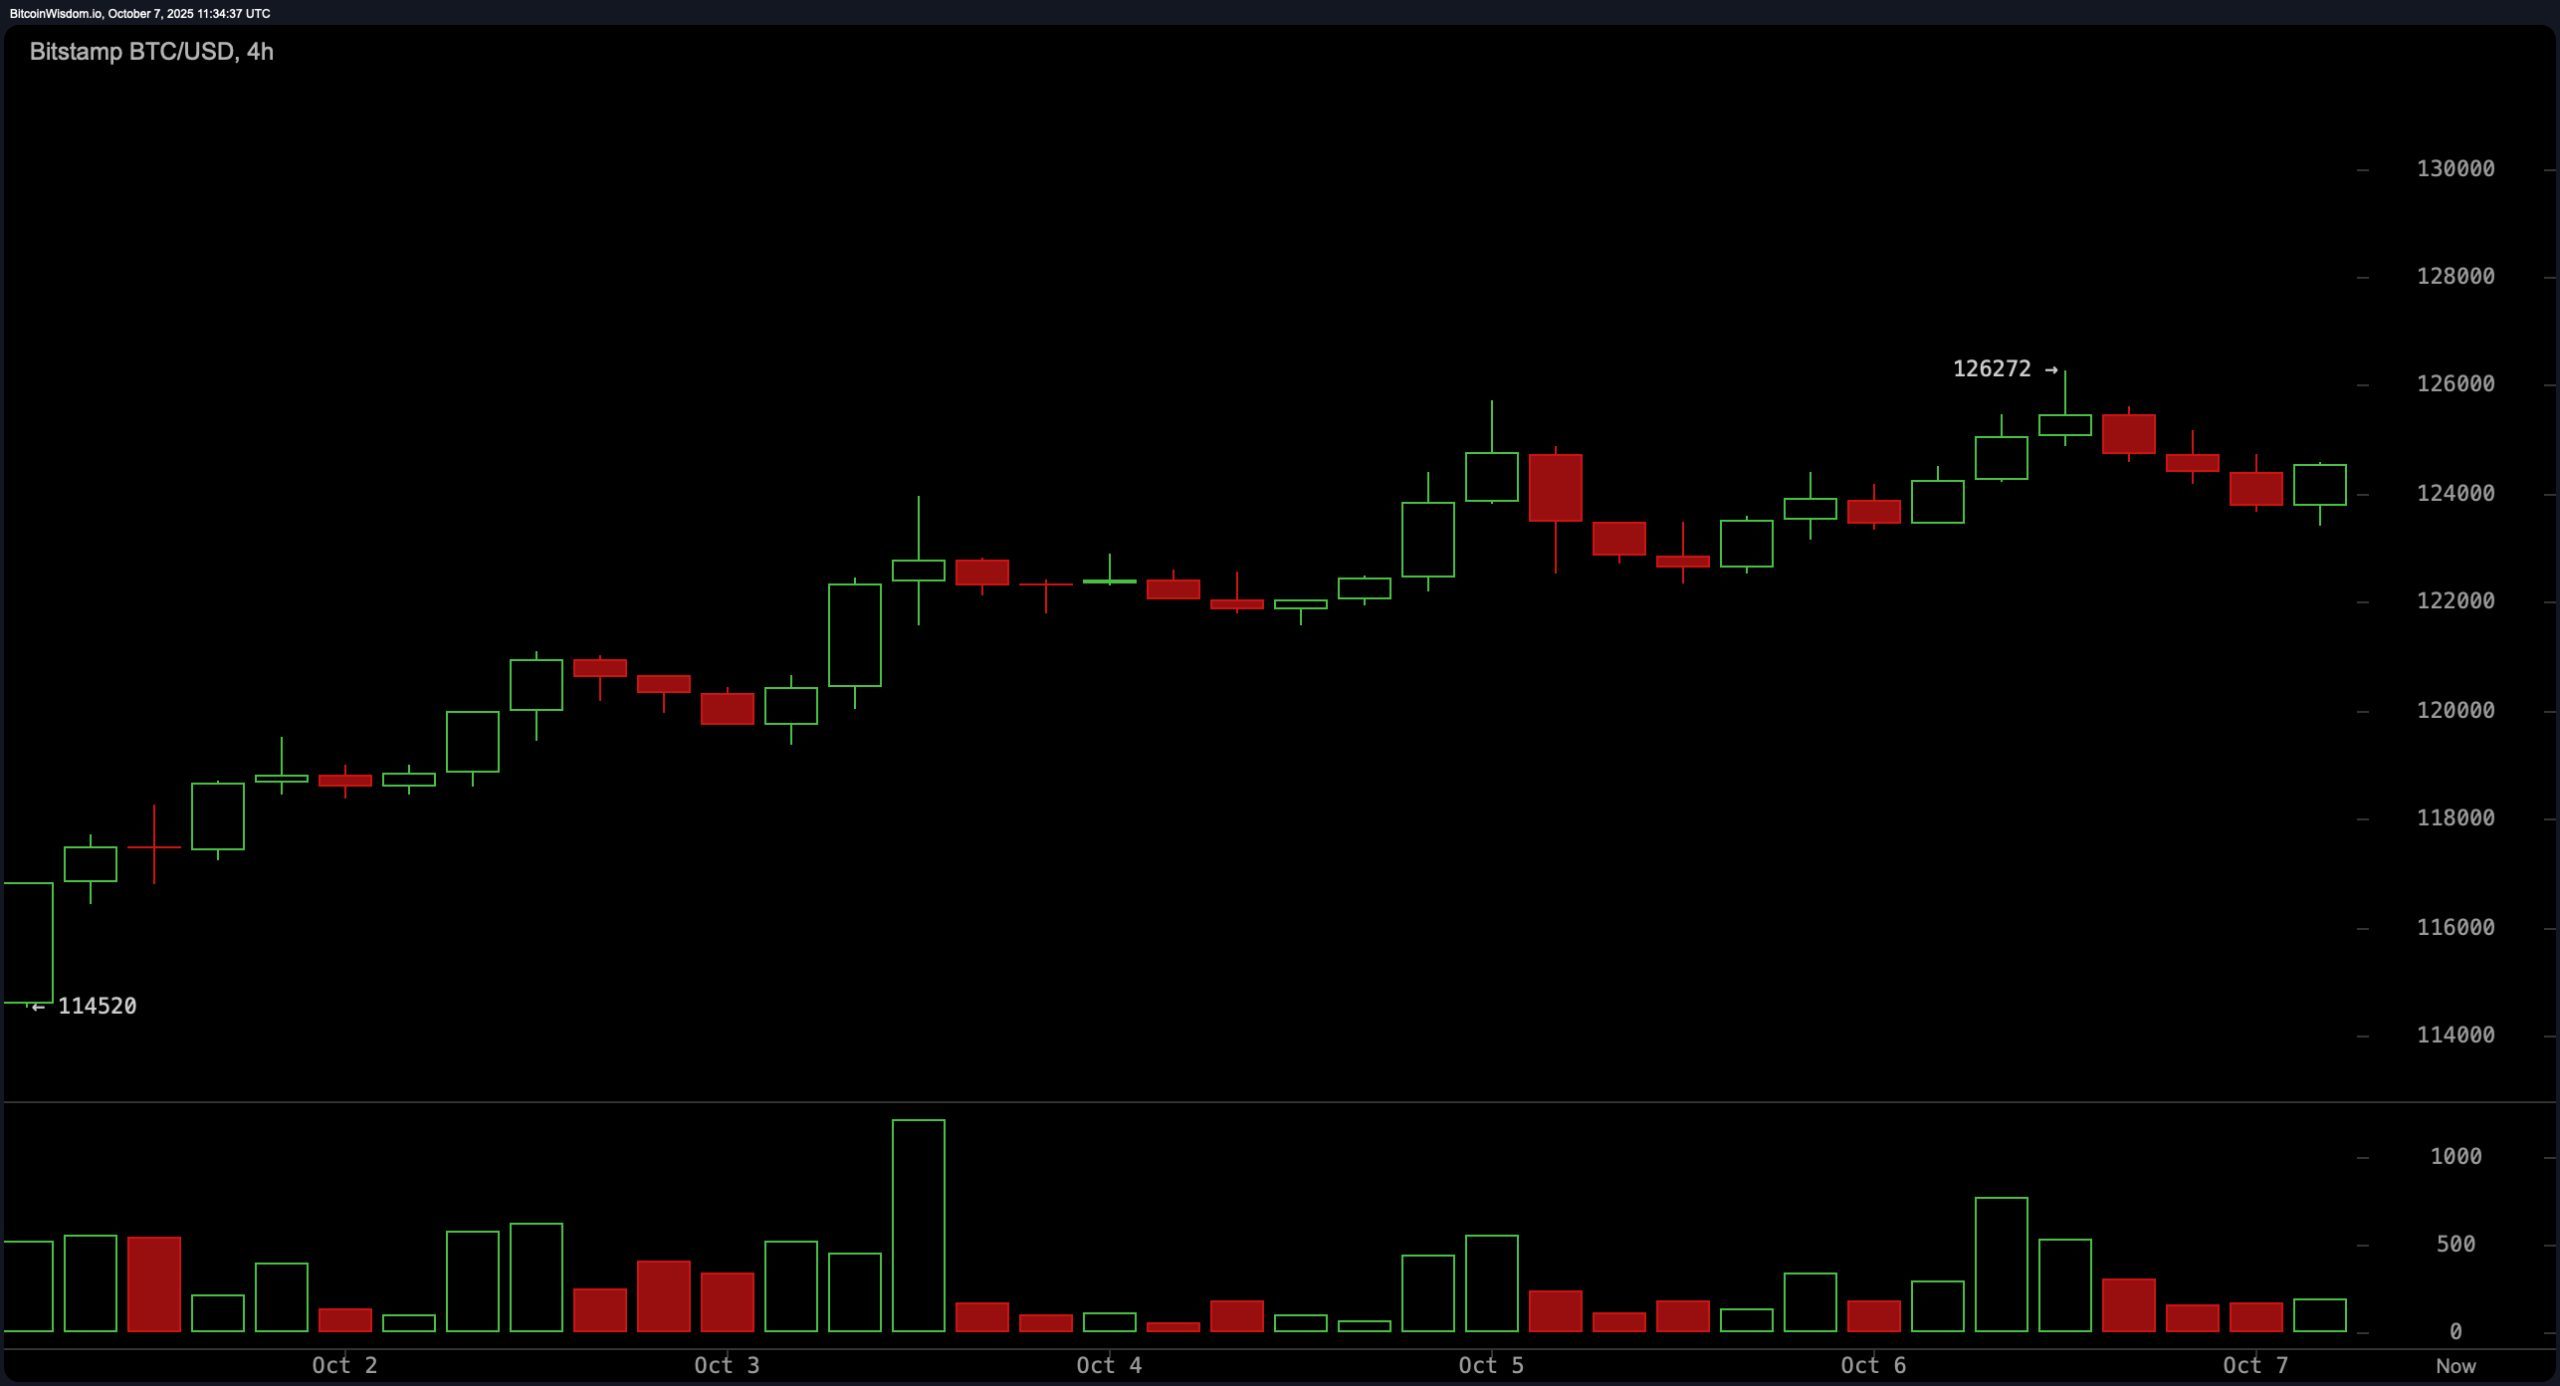
The 4-hour chart reveals a different beast: a rising wedge breakdown is in progress. After peaking at $126,272, bitcoin has been sketching out a series of lower highs and lower lows. Volume is soft, hinting at a lack of strong conviction, but the structure leans bearish. A drop below $124,000 with volume could usher in a move toward $122,500, while a reversal above $125,500 would shift the bias back to bullish. The wedge breakdown is a classic setup, and the market’s next move could be quick—and punishing.

BTC/USD 4-hour chart via Bitstamp on Oct. 7, 2025.
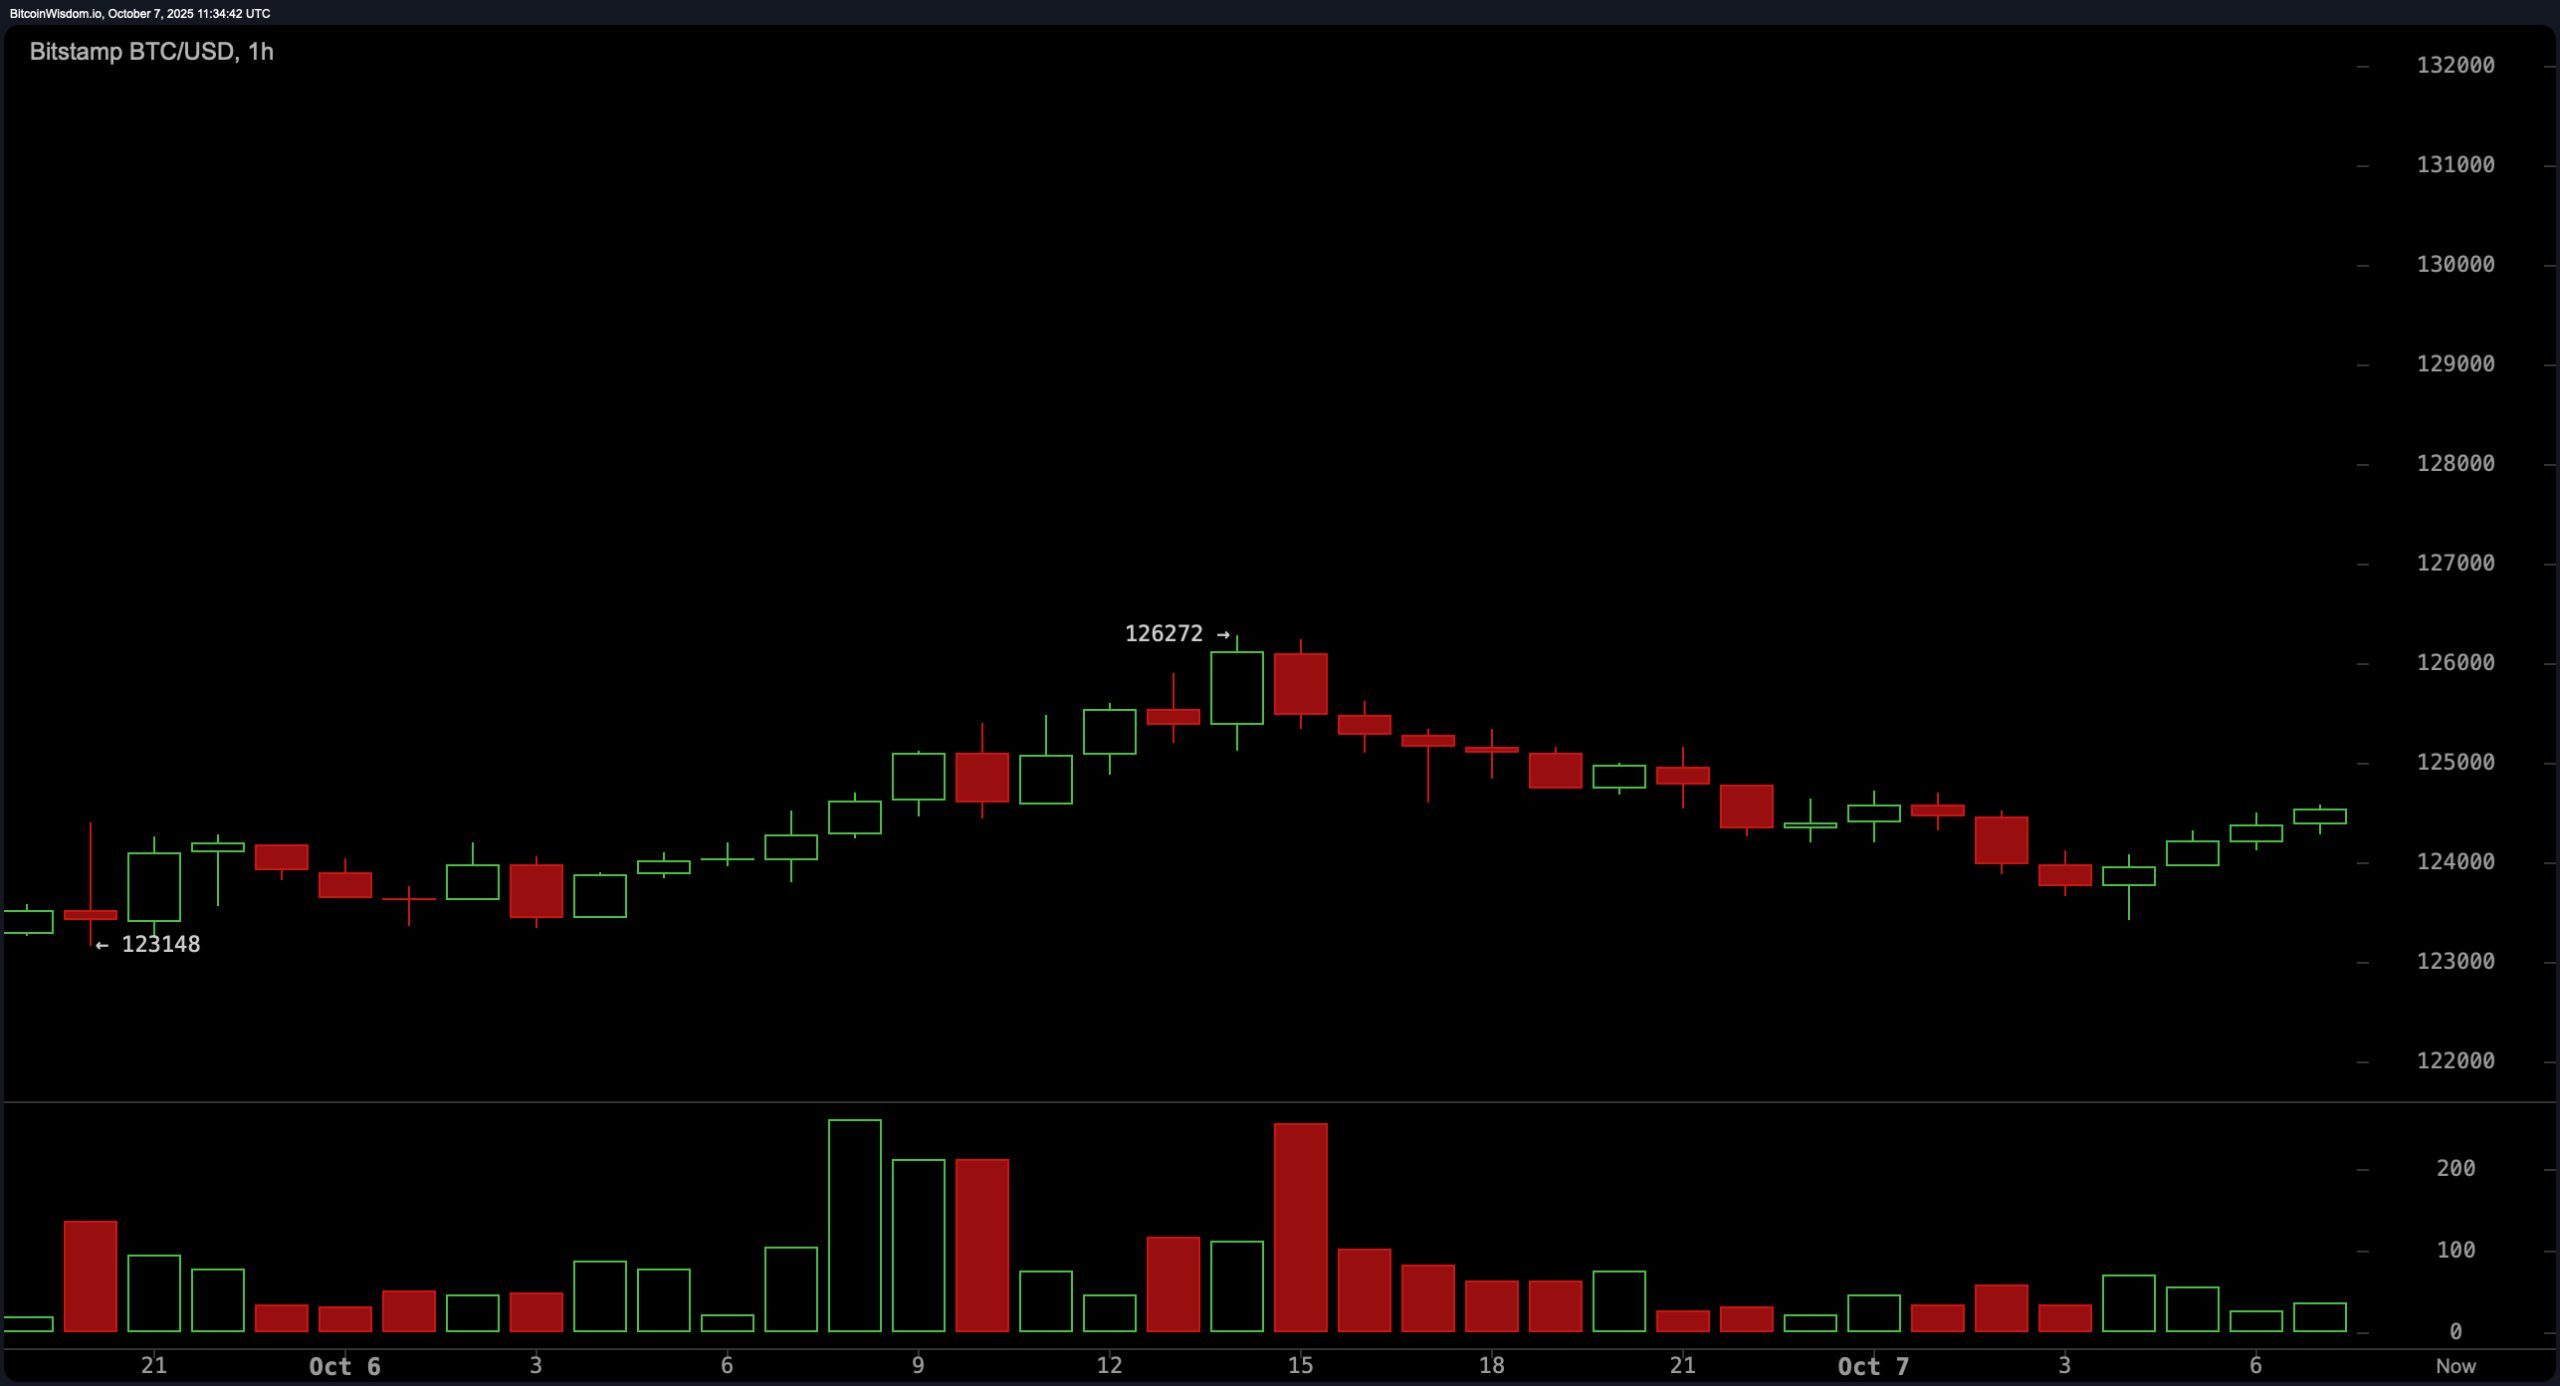
Zooming into the 1-hour chart, bitcoin looks like it’s bracing itself for its next act. A short-term downtrend is forming, marked by lower highs and lower lows after the recent high. That said, price has found footing just above $124,000, a key support zone that could ignite a rebound. Scalpers are watching closely: a bullish engulfing candle off this support could open the door for quick upside toward $125,500. Conversely, rejection in the $125,000–$125,300 zone sets up a tight shorting opportunity with risk capped above $125,600.

BTC/USD 1-hour chart via Bitstamp on Oct. 7, 2025.
The oscillators are chiming in with mixed messages. The relative strength index (RSI) at 72 is flashing a bearish signal, while the Stochastic at 90 remains neutral. The commodity channel index (CCI) at 131 and momentum at 14,891 are both pointing to sell pressure. But the moving average convergence divergence (MACD) level at 2,697 is still on team bull, giving buyers a glimmer of hope that this pullback might be temporary.
Moving averages are where the bulls hold their ground. Every major exponential moving average (EMA) and simple moving average (SMA) from the 10-day to the 200-day is flashing a clean bullish signal. That’s no small feat and reflects a structurally strong market, even amid short-term turbulence. Until the price slices below key support zones, the broader trend remains intact—though buyers will want to see conviction return soon.
Bull Verdict:
If you’re riding the trend, the bulls still have the edge. Every major moving average from the 10-day to the 200-day is firmly aligned in buy mode, and price action is consolidating above key support—not collapsing below it. A bounce from the $124,000 zone could lead to another stab at $126,000 or higher, especially if volume kicks back in. For now, this pullback is a breather, not a breakdown.
Bear Verdict:
Not so fast, say the bears. The rising wedge on the 4-hour chart just cracked, and momentum indicators are flashing red like a crypto crime scene. The relative strength index (RSI), momentum, and commodity channel index (CCI) are all screaming sell, and the 1-hour chart structure is leaning south. A decisive break below $124,000 with volume could open the trapdoor toward $122,000—or worse.
免责声明:本文章仅代表作者个人观点,不代表本平台的立场和观点。本文章仅供信息分享,不构成对任何人的任何投资建议。用户与作者之间的任何争议,与本平台无关。如网页中刊载的文章或图片涉及侵权,请提供相关的权利证明和身份证明发送邮件到support@aicoin.com,本平台相关工作人员将会进行核查。


