Bitcoin Uptober Surge: Can Moonvember and Bullcember Push BTC Higher?
Is Bitcoin preparing to repeat history with another legendary bull run? As October 2025 begins, it is trading at $116,730.59, marking a 3.22% intraday surge. With a $2.32 trillion market cap and $62.54 billion in daily volume, BTC is showing undeniable strength. Traders are once again asking: is this the start of “Uptober,” and will it extend into “Moonvember” and “Bullcember”?
 Source: CoinmarketCap
The term “Uptober” or “Pumptober” is no accident. Historically, it has delivered 10 winning Octobers in the last 12 years , cementing October as a bullish month. Losses were exceptions, seen only in 2014 ( -11.63% ) and 2018 ( -4.44% ). Every other October rewarded investors with strong upward moves.
Uptober and Pumptober: A Look at History
According to LookonChain, Bitcoin price outperformed in October over the years. In 2013, BTC surged 53.81%, climbing from $132.55 to $203.88. The bullish streak returned in 2015 with gains of 31.36% and peaked in 2021, when it rocketed 40.99%, jumping from $43,859.33 to $61,837.26. Other notable rallies include a 46.49% rise in 2017 (from $4,347.58 to $6,368.65), a 25.68% increase in 2020, a 27.92% surge in 2023, and a 14.39% climb in 2024, moving from $63,243.28 to $72,342.62.
 Source: LookonChain
Even in milder years, October still leaned bullish, with 2016 recording a 13.76% gain, 2019 showing a 10.89% rise, and 2022 posting a modest 5.89% increase. Now, in 2025, it opened at $114,024.23, and the early surge already suggests that another powerful “ Pumptober ” may be underway.
Moonvember & Bullcember: Can Bitcoin Extend the Rally?
While Uptober sets the stage, traders often look to Moonvember and Bullcember for sustained rallies. The momentum from October historically spills into November and December, months that often bring significant institutional flows and year-end optimism.
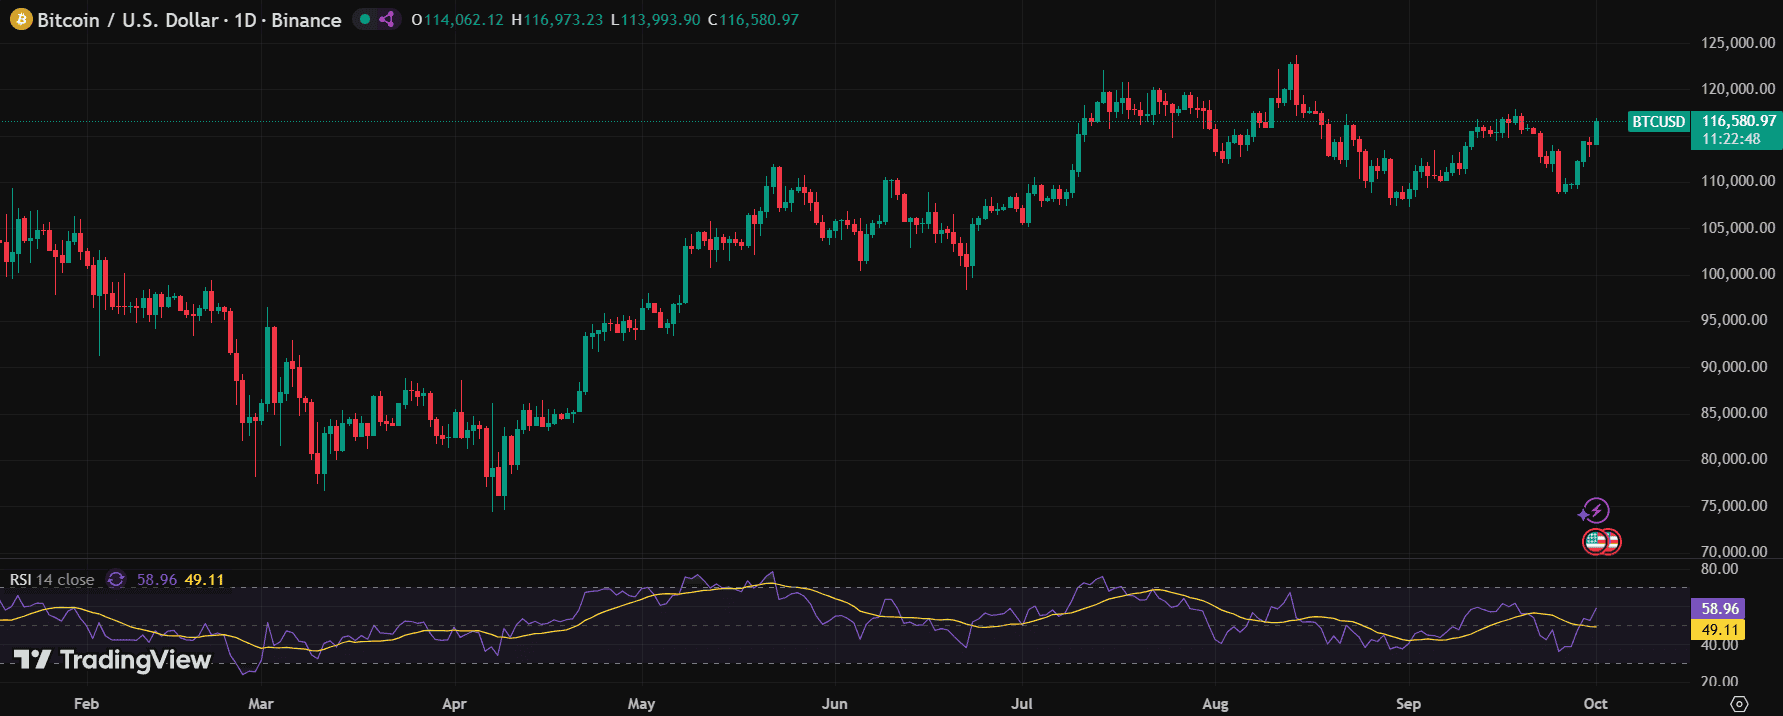
Its all-time highs tell the story. On November 10, 2021 , it hit $66,000 , and by December 18, 2024 , it touched $106,000 . With BTC now trading near $116,000 , the road ahead could lead to new milestones if momentum continues.
Indicators also support this outlook. The Relative Strength Index (RSI) currently sits at 58.96 , reflecting a bullish but not overbought condition—leaving space for upward runs.
Bitcoin Price Prediction : Short, Medium & Long Term
 Source: TradingView
-
Short-Term (1–2 weeks): BTC may test resistance at $120,000 . A breakout could see it sprint toward $125,000 .
-
Medium-Term (1–3 months): I f bullish sentiment holds, It could climb to $130,000–$135,000 , reinforcing Uptober’s legacy into Moonvember.
-
Long-Term (3+ months): BTC’s trajectory points to $140,000–$150,000 , especially with growing institutional demand and adoption.
If history repeats, it may once again ignite the rally that carries through Moonvember and Bullcember , echoing Bitcoin’s pattern of ending years on a high.
Conclusion
Bitcoin’s story has always been about cycles, seasons, and investor sentiment. With Uptober 2025 already off to a bullish start , history shows the months ahead— Moonvember and Bullcember —could drive BTC into uncharted territory. If momentum persists, the question isn’t whether Bitcoin will repeat history, but how much higher it will climb.
Disclaimer: This article is for informational purposes only, not to be considered as financial advice. Do your own research before investing.
免责声明:本文章仅代表作者个人观点,不代表本平台的立场和观点。本文章仅供信息分享,不构成对任何人的任何投资建议。用户与作者之间的任何争议,与本平台无关。如网页中刊载的文章或图片涉及侵权,请提供相关的权利证明和身份证明发送邮件到support@aicoin.com,本平台相关工作人员将会进行核查。


