Written by: Chris Beamish, Antoine Colpaert, CryptoVizArt, Glassnode
Compiled by: AididiaoJP, Foresight News
Bitcoin shows signs of weakness following the surge triggered by the Federal Open Market Committee (FOMC). Long-term holders have realized profits of 3.4 million BTC, while ETF inflows have slowed. With pressure in both the spot and futures markets, the cost basis for short-term holders at $111,000 is a key support level; if breached, there may be a risk of deeper cooling.
Summary
After the FOMC-driven surge, Bitcoin has entered a correction phase, displaying market signs of "buy the rumor, sell the news," with broader market structure indicating weakening momentum.
The current 8% decline remains relatively mild, but the $678 billion in realized market cap inflows and the 3.4 million BTC profits realized by long-term holders highlight the unprecedented scale of capital rotation and sell-off in this round.
ETF inflows sharply slowed before and after the FOMC meeting, while long-term holders accelerated their sell-offs, creating a fragile balance in capital flow.
Spot trading volume surged during the sell-off, and the futures market experienced severe deleveraging volatility, with liquidation clusters revealing the market's vulnerability to liquidity-driven fluctuations in both directions.
The options market is aggressively repricing, with skew rising sharply and strong demand for put options indicating a defensive positioning, while the macro backdrop suggests increasing fatigue in the market.
From Surge to Correction
Following the FOMC-driven surge, with prices nearing $117,000 at their peak, Bitcoin has transitioned into a correction phase, echoing the typical "buy the rumor, sell the news" pattern. In this issue, we step back from short-term volatility to assess the broader market structure, using long-term on-chain indicators, ETF demand, and derivatives positions to evaluate whether this pullback is a healthy consolidation or an early stage of deeper contraction.
On-Chain Analysis
Volatility Context
The current decline from the historical high (ATH) of $124,000 to $113,700 is only 8% (with the latest decline reaching 12%), which appears mild compared to the 28% drop in this cycle or the 60% drop in previous cycles. This aligns with the long-term trend of decreasing volatility, similar to the steady advance seen between 2015-2017, although the explosive rally at the end of that period has yet to materialize.
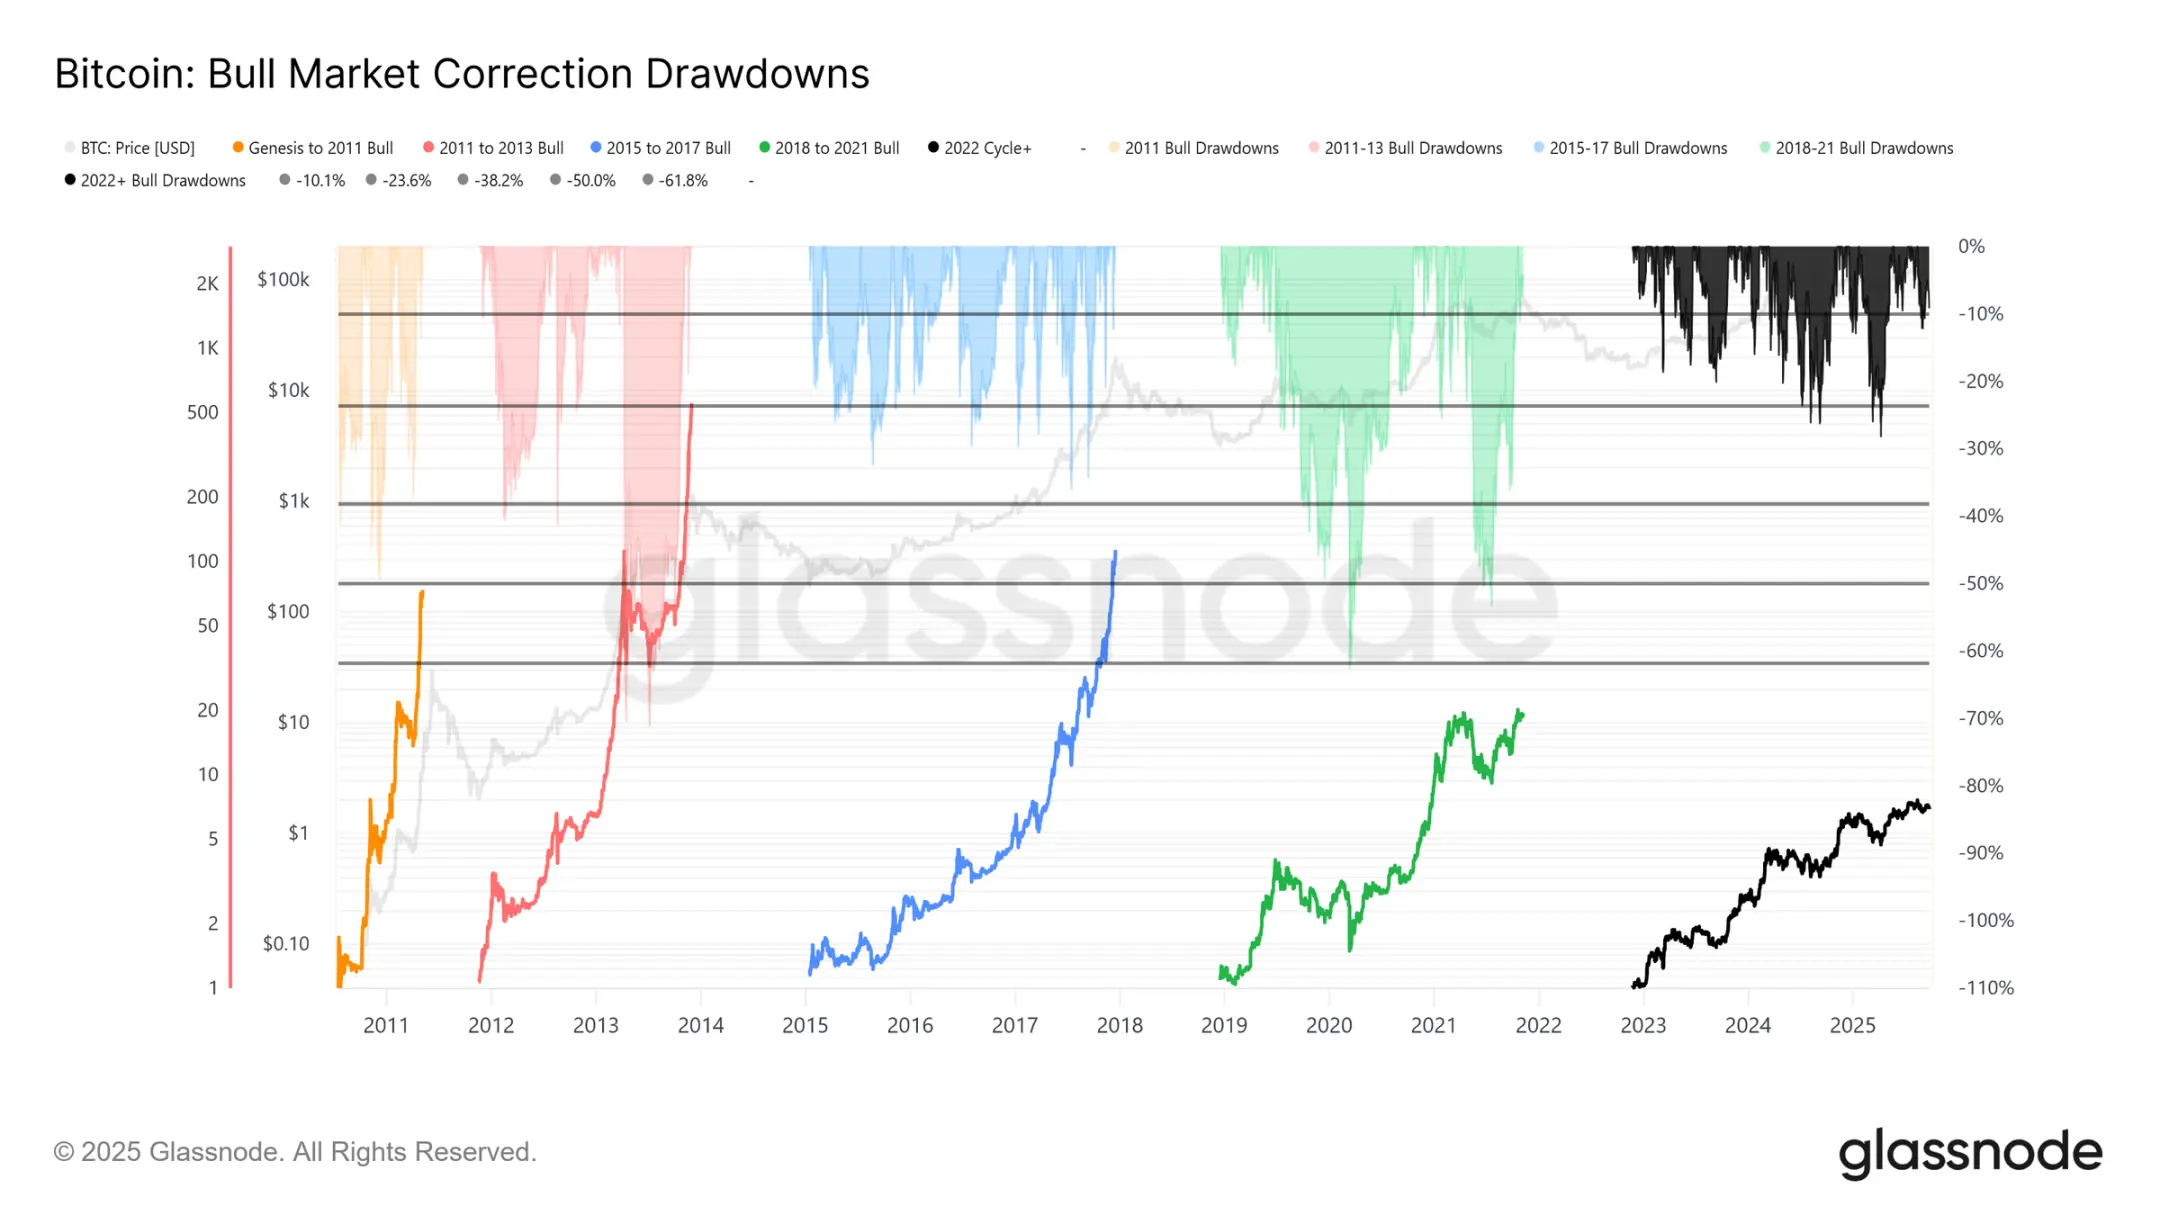
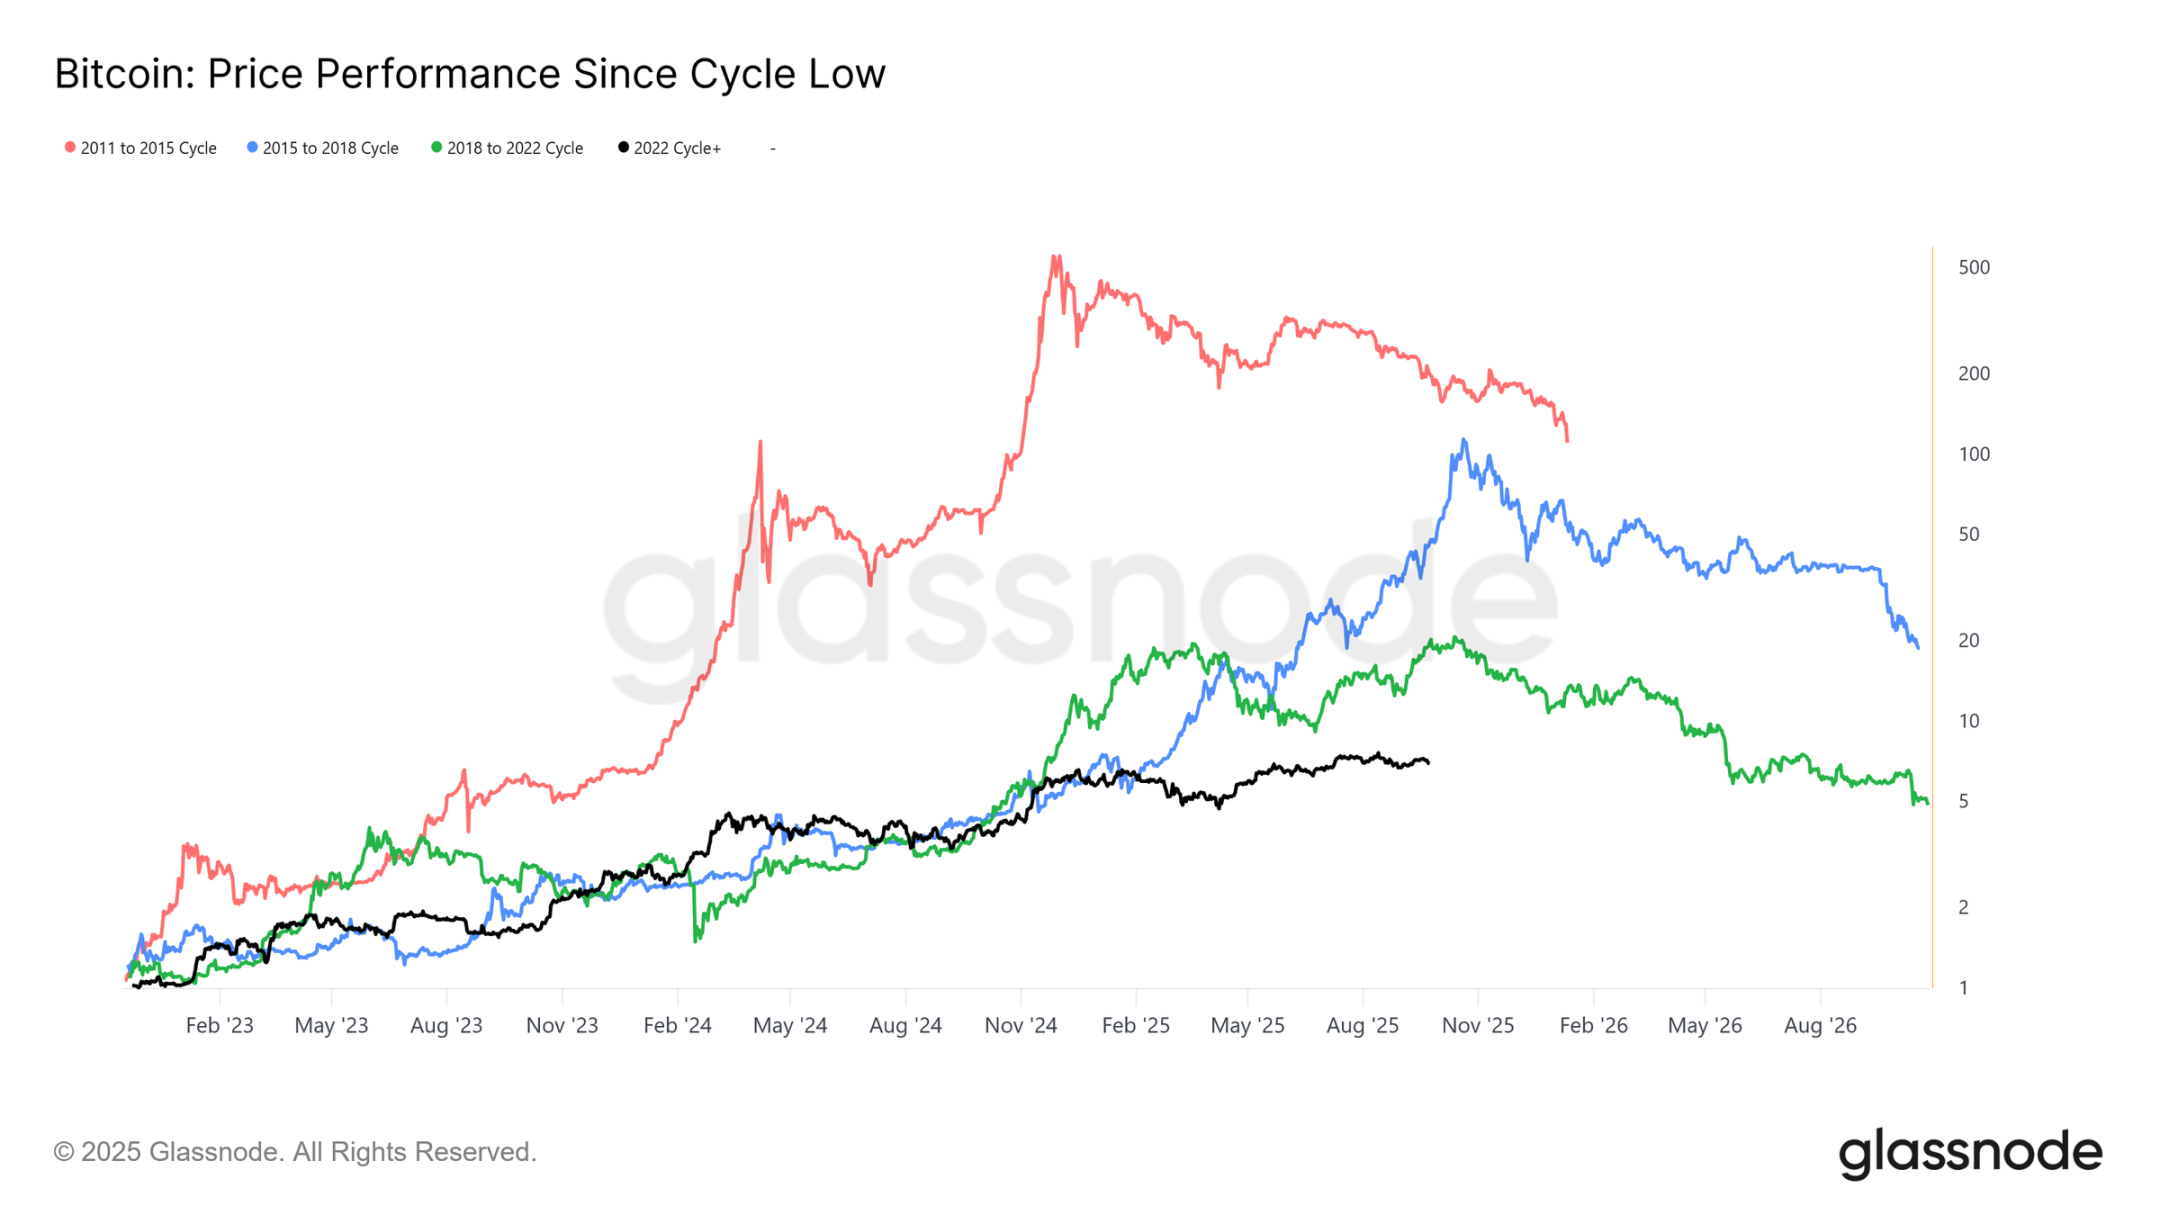
Cycle Duration
Overlaying the past four cycles shows that even though the current trajectory closely matches the previous two cycles, the peak returns have weakened over time. Assuming $124,000 marks the global top, this cycle has lasted about 1,030 days, very close to the approximately 1,060 days of the previous two cycles.
Capital Inflow Measurement
Beyond price trends, capital deployment provides a more reliable perspective.
Realized market cap has seen three waves of increases since November 2022. The total has risen to $1.06 trillion, reflecting the scale of capital inflows supporting this cycle.
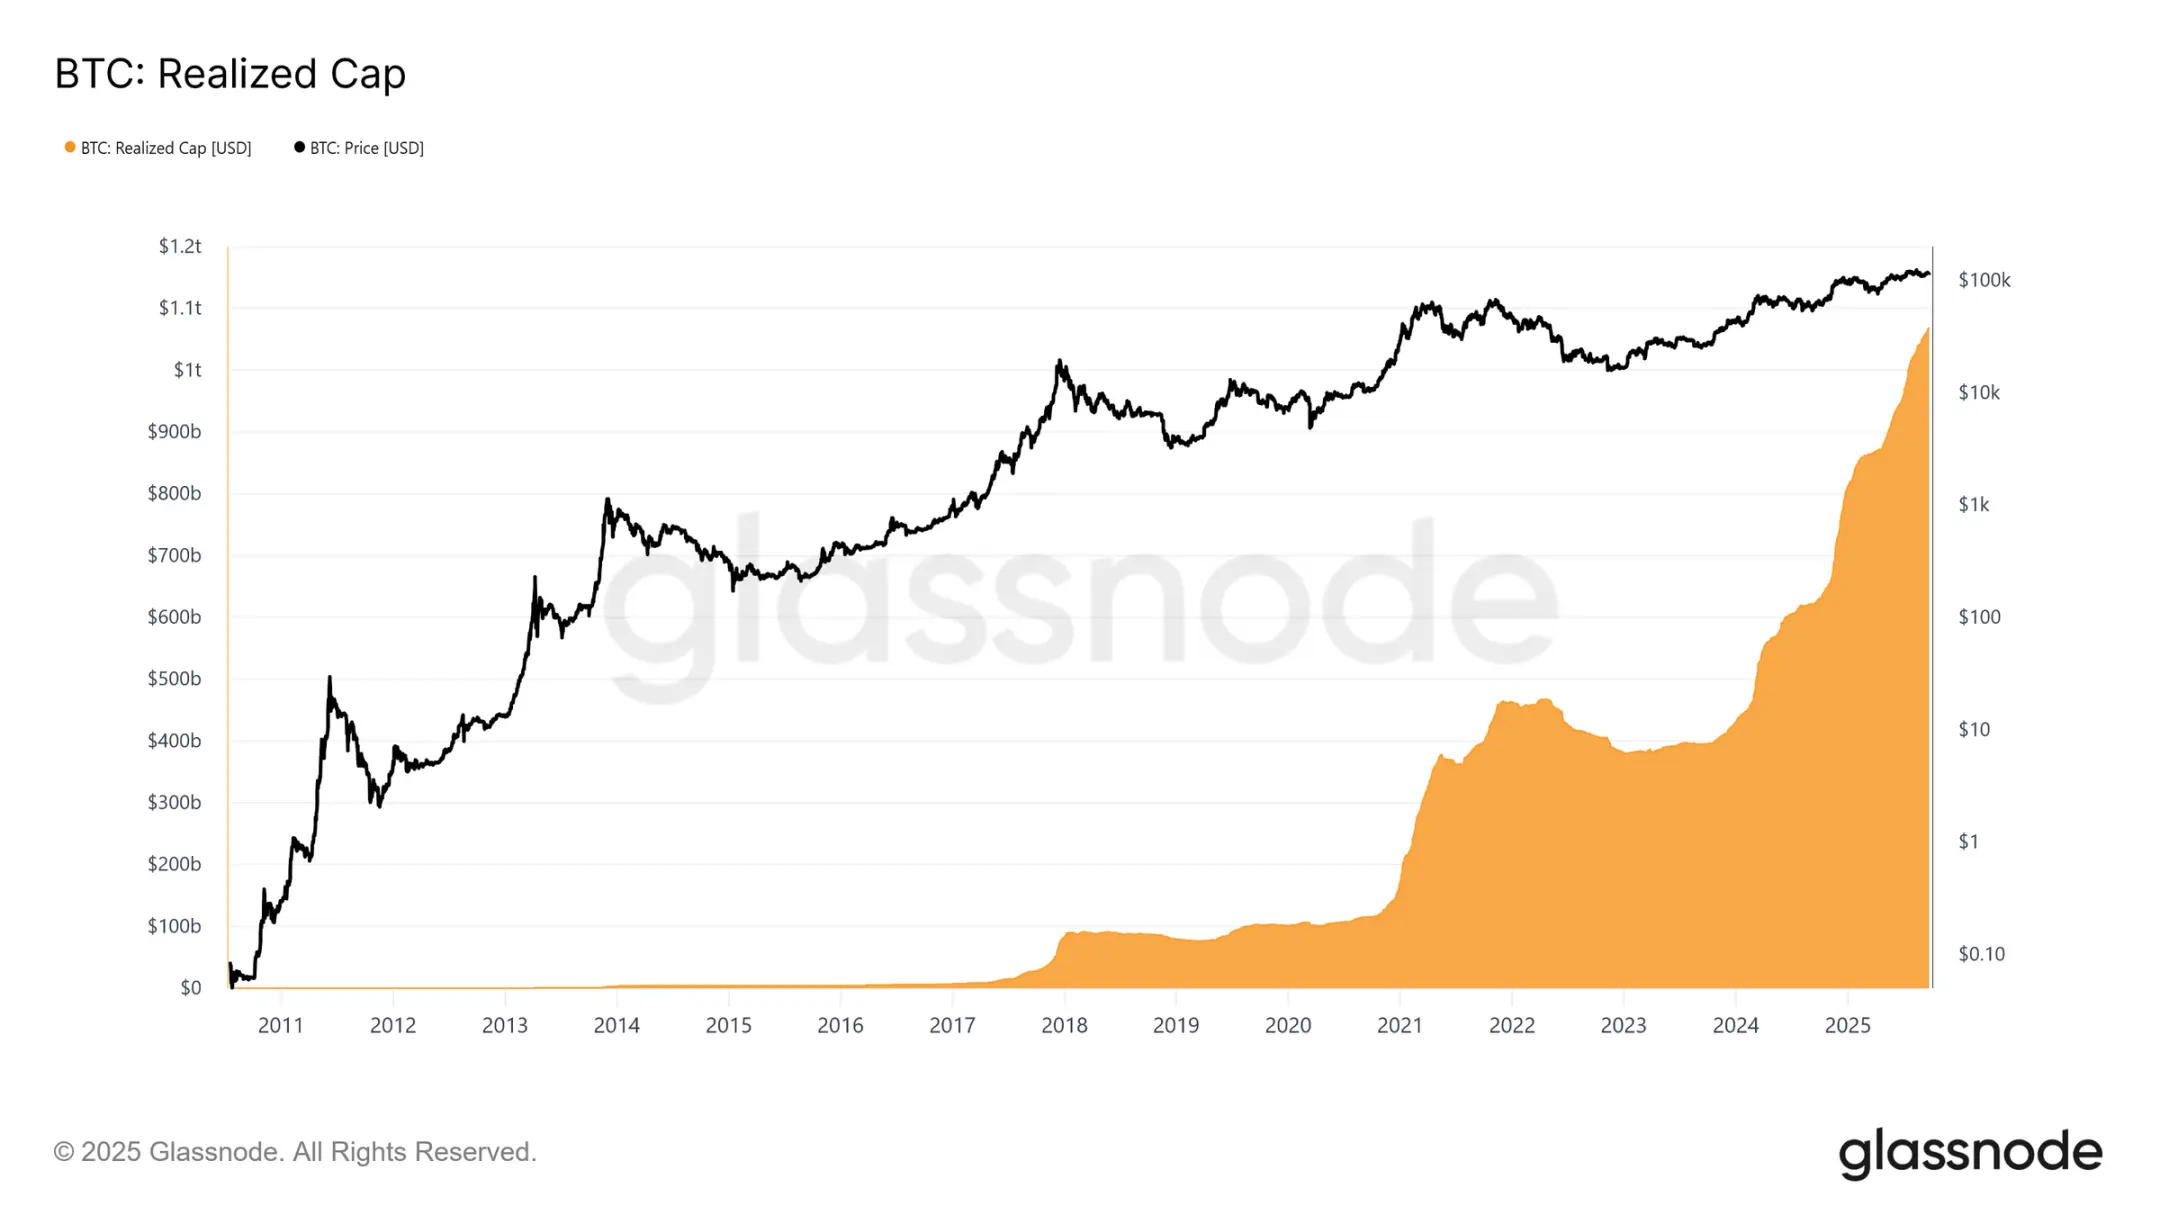
Realized Market Cap Growth
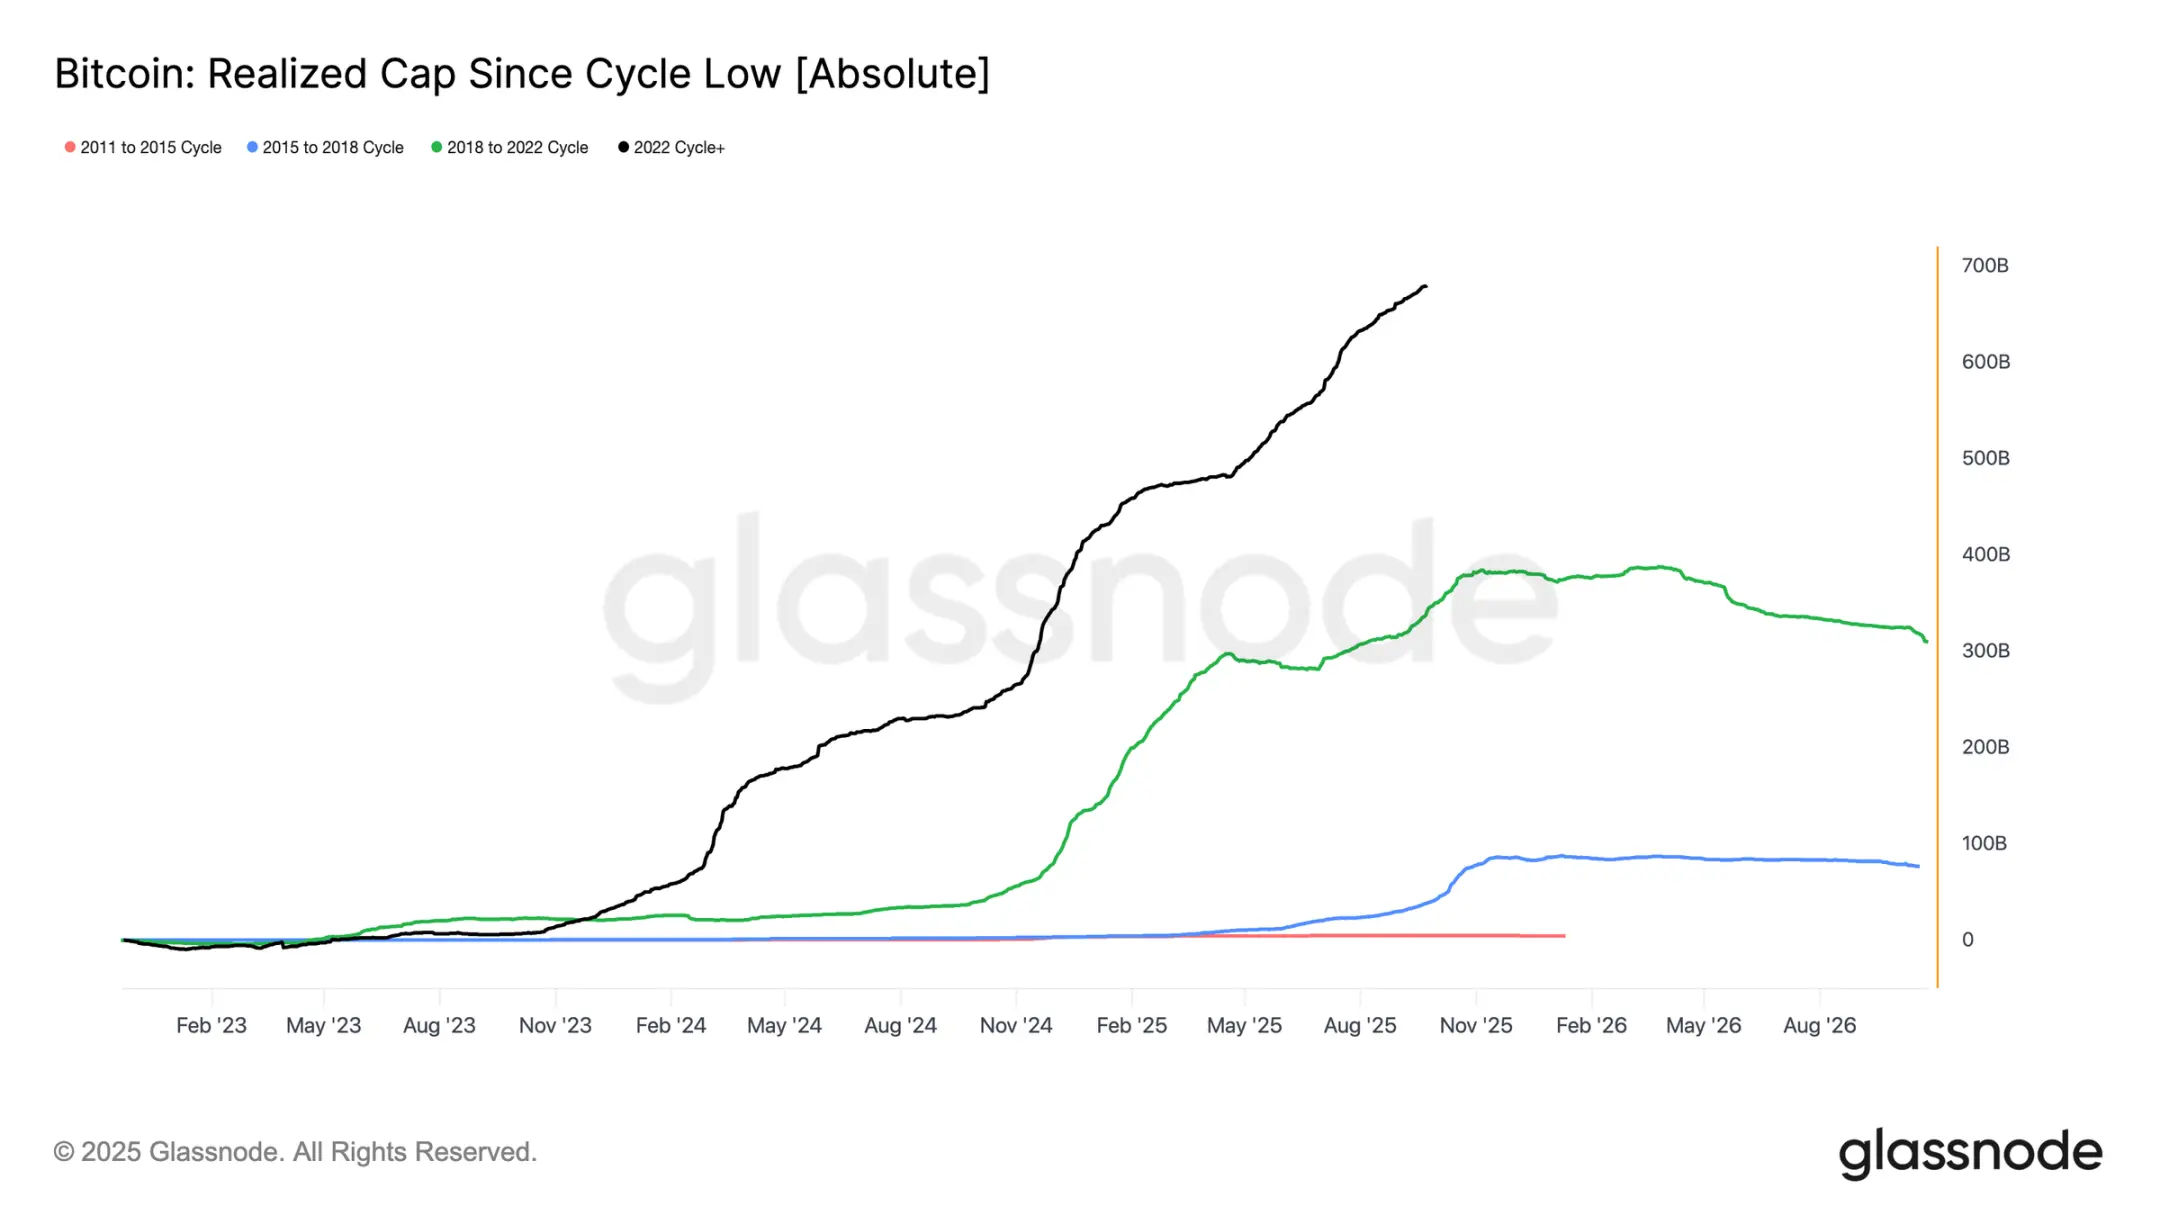
Background Comparison:
- 2011–2015: $4.2 billion
- 2015–2018: $85 billion
- 2018–2022: $383 billion
- 2022–present: $678 billion
This cycle has absorbed a net inflow of $678 billion, nearly 1.8 times that of the previous cycle, highlighting the unprecedented scale of its capital rotation.
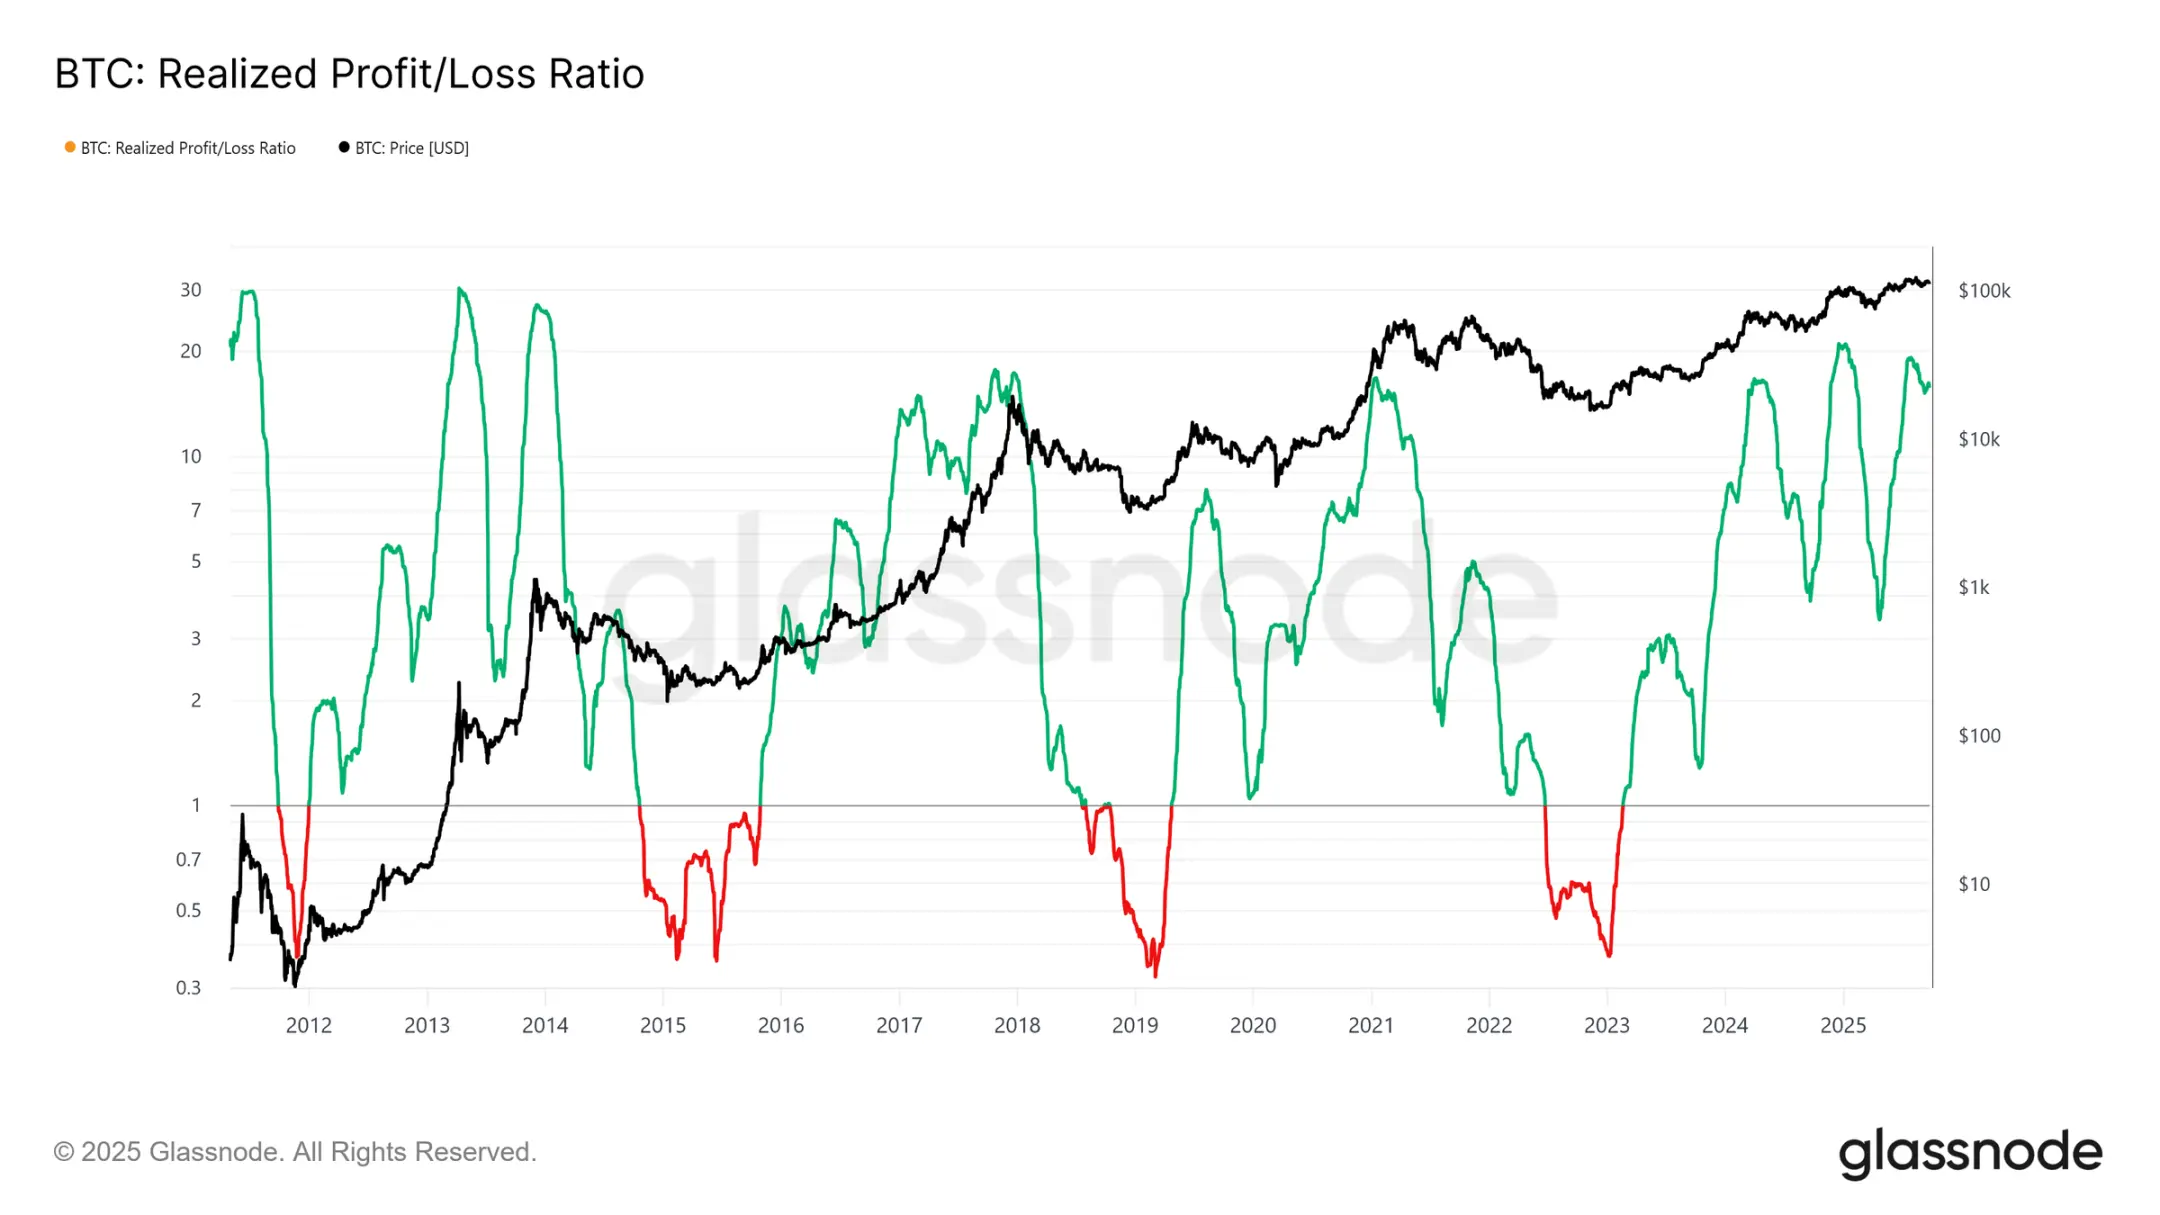
Profit Realization Peaks
Another distinction lies in the inflow structure. Unlike the single wave in earlier cycles, this cycle has seen three distinct surges lasting several months. The realized profit-loss ratio indicates that each time profits realized exceed 90% of the moving tokens, it marks a cyclical peak. Having just exited the third such extreme, the probability leans towards a cooling phase ahead.
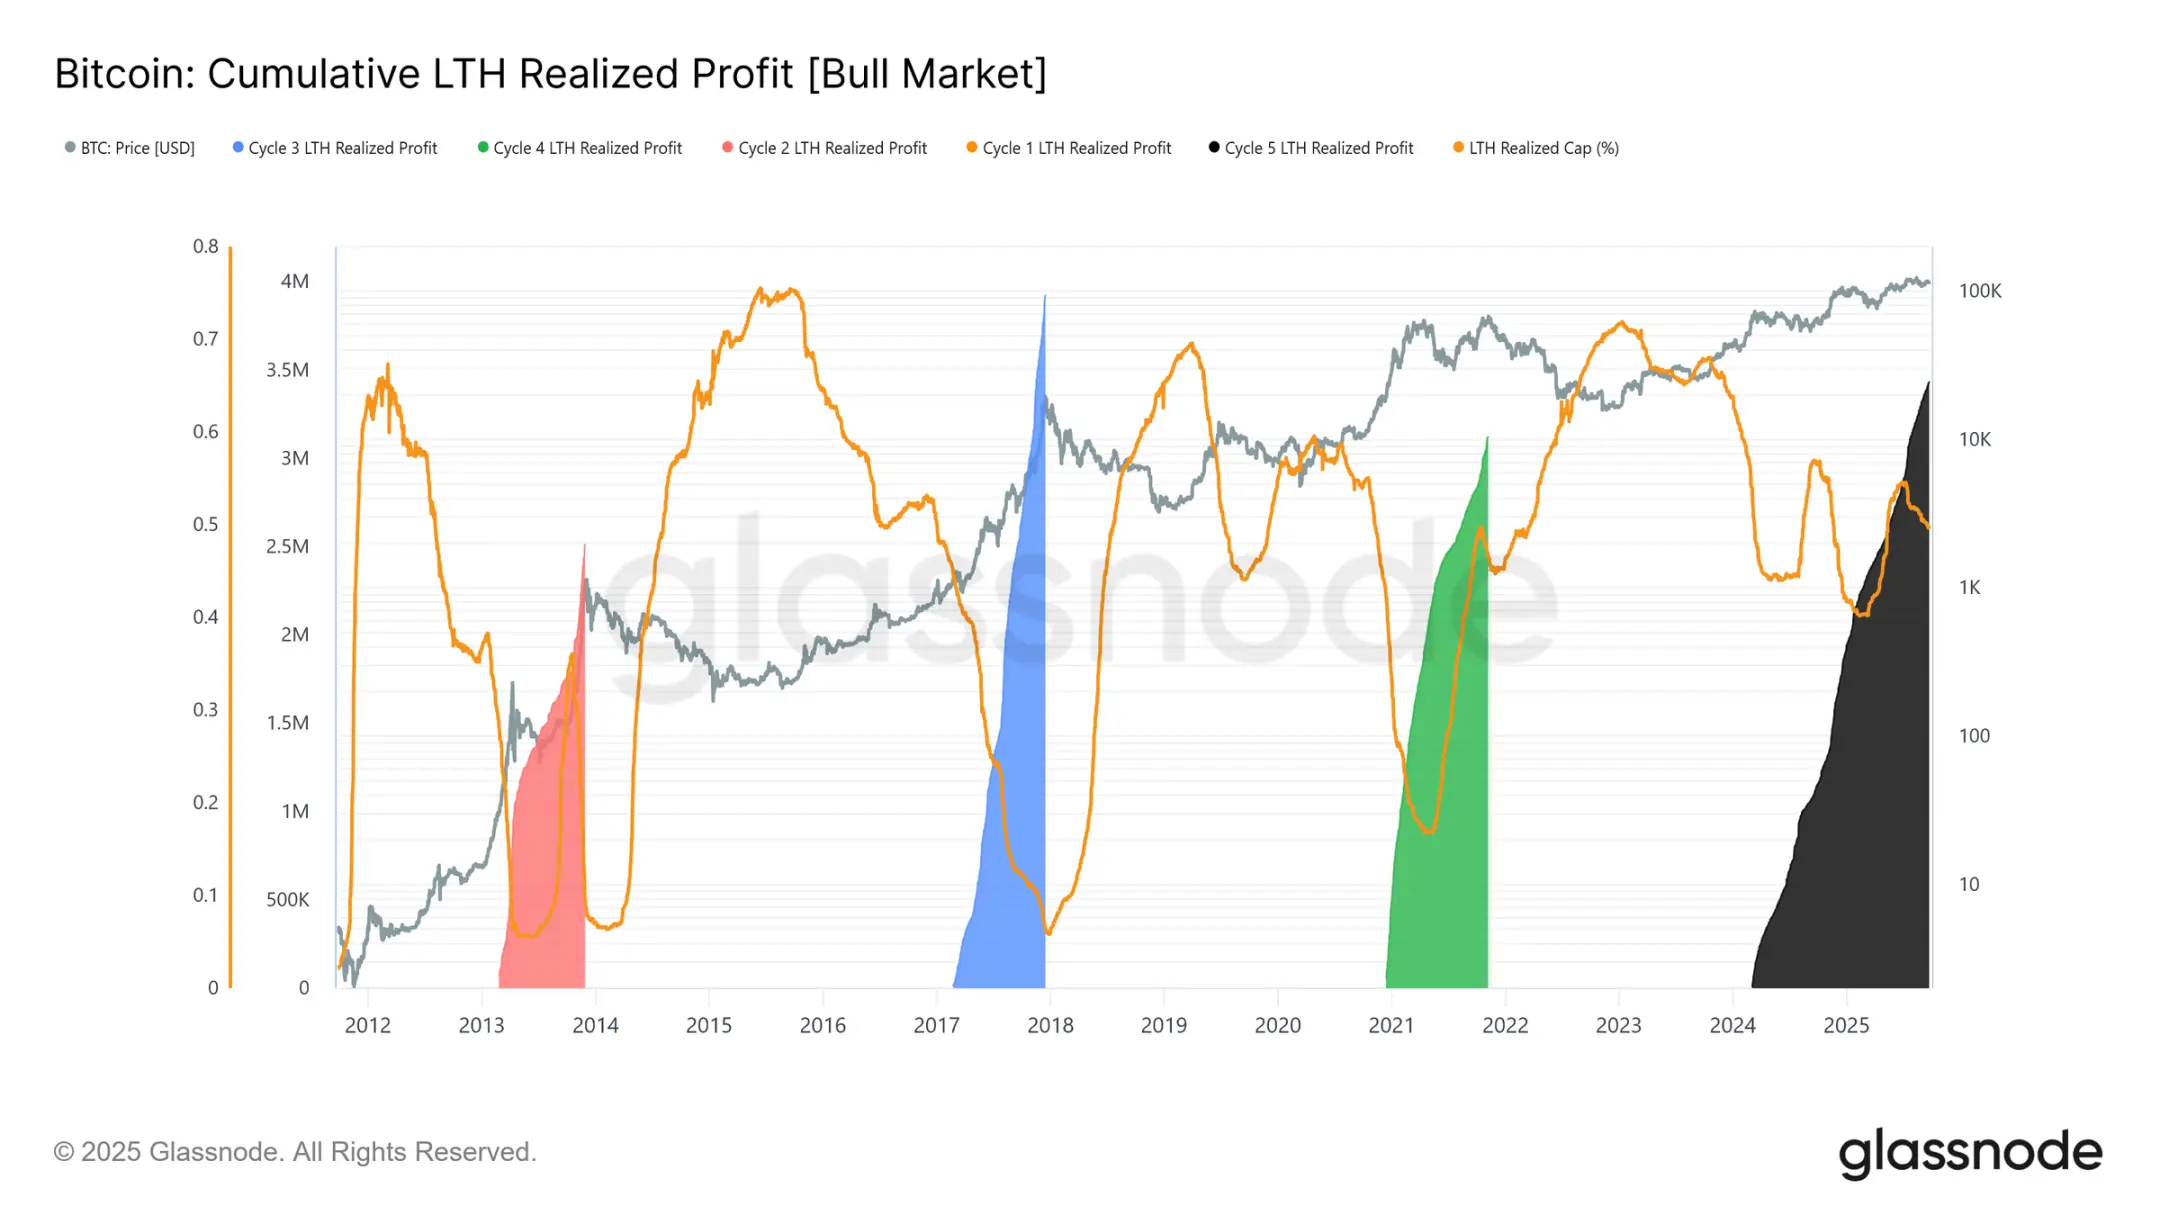
Long-Term Holder Profit Dominance
Focusing on long-term holders provides a clearer picture. This metric tracks the cumulative profits of long-term holders from new historical highs (ATH) to cycle peaks. Historically, significant sell-offs by this group have marked tops. In this cycle, long-term holders have realized profits of 3.4 million BTC, surpassing previous cycles, highlighting the maturity of this group and the scale of capital rotation.
Off-Chain Analysis
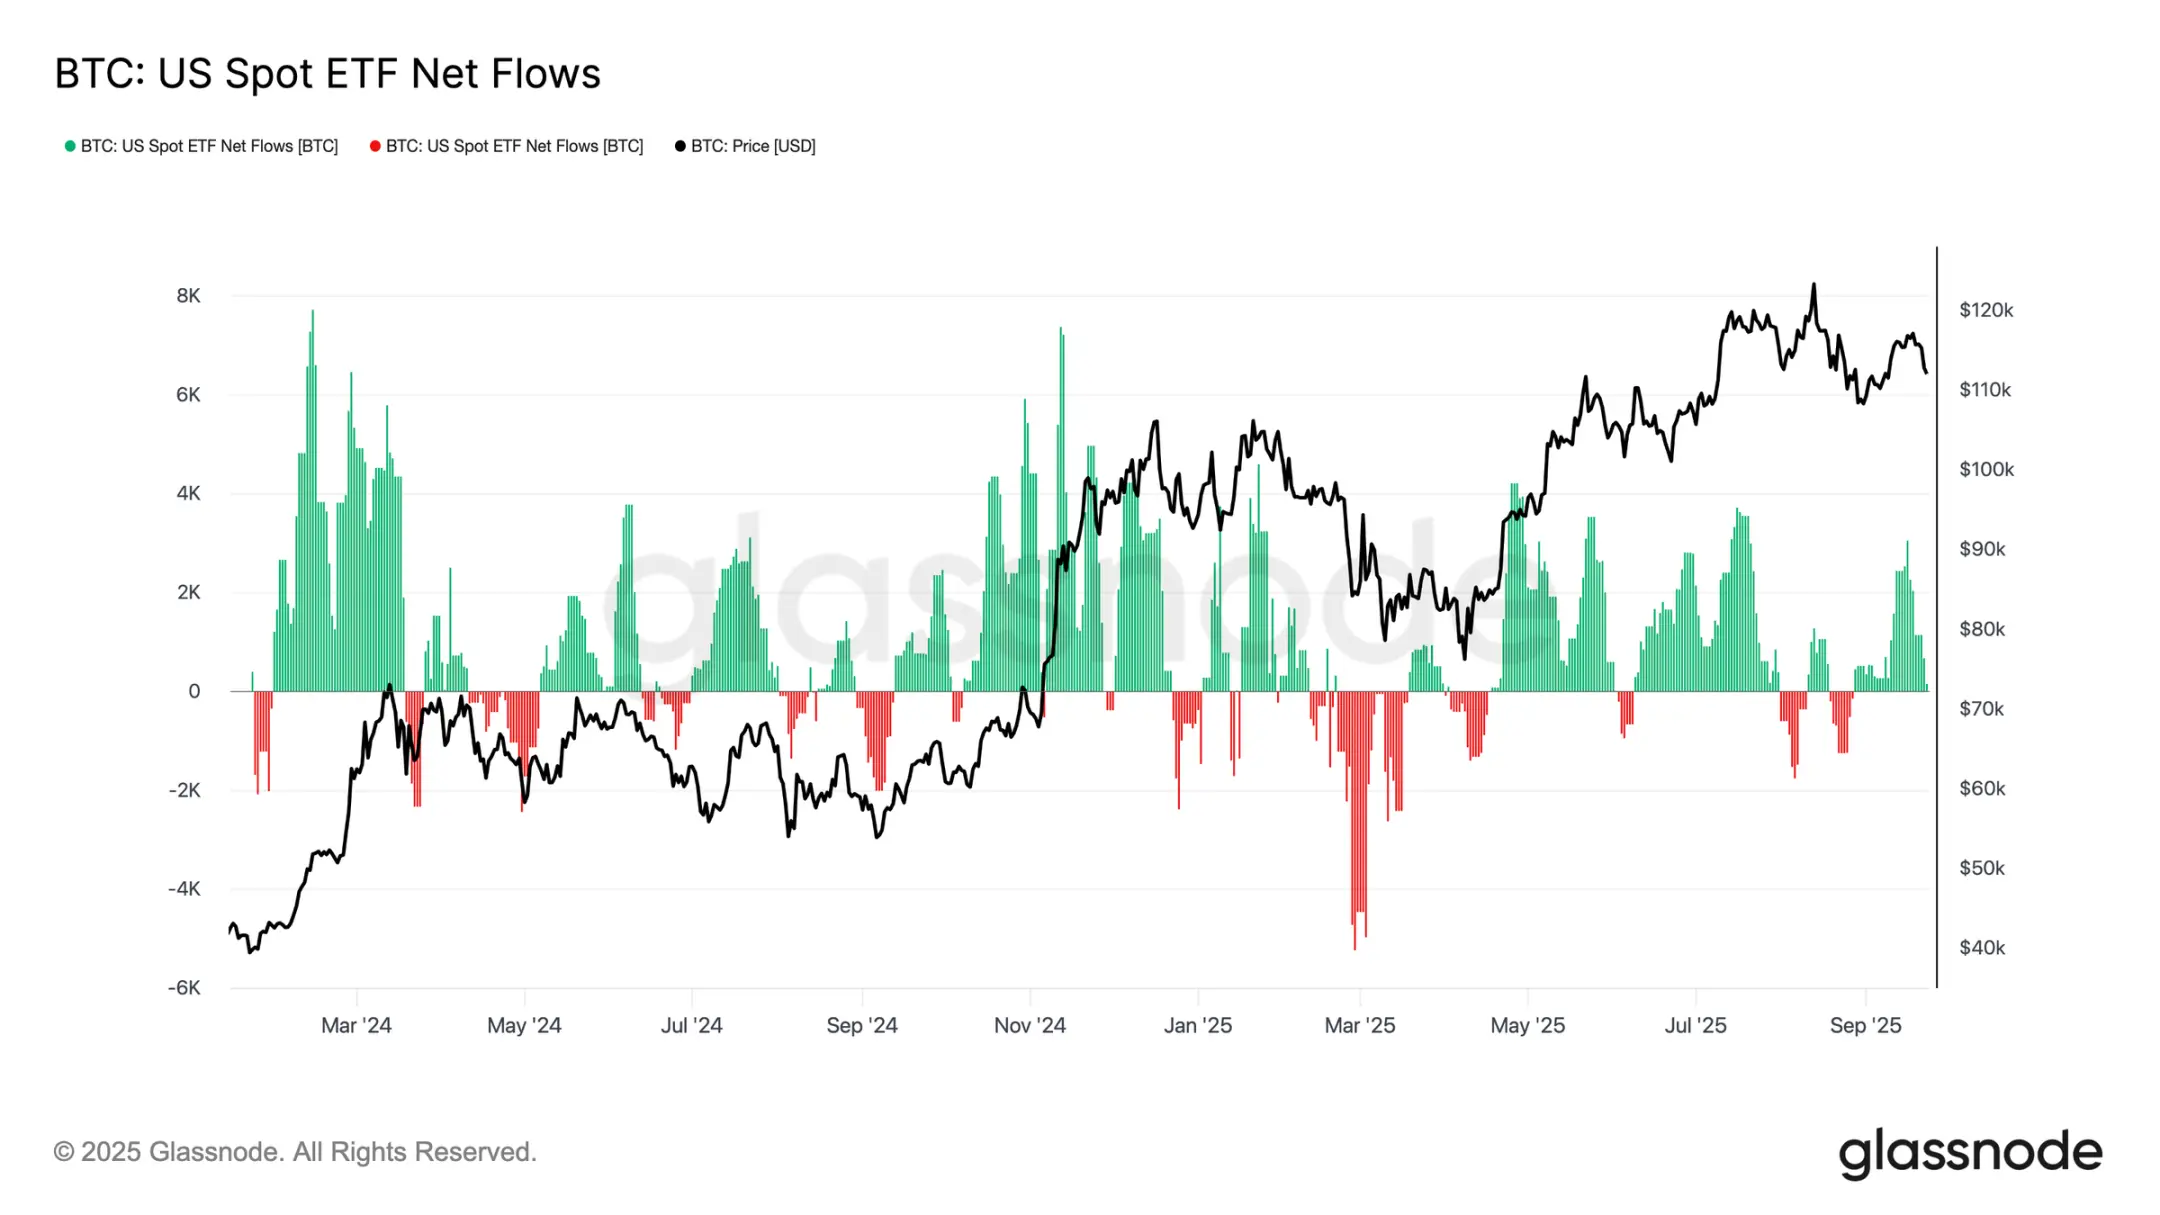
ETF Demand vs Long-Term Holders
This cycle has also been characterized by a tug-of-war between the supply from long-term holders' sell-offs and institutional demand through U.S. spot ETFs and DATs. As ETFs become a new structural force, prices now reflect this push-pull effect: the profit-taking by long-term holders limits upside potential, while ETF inflows absorb the sell-offs and sustain the cycle's progress.
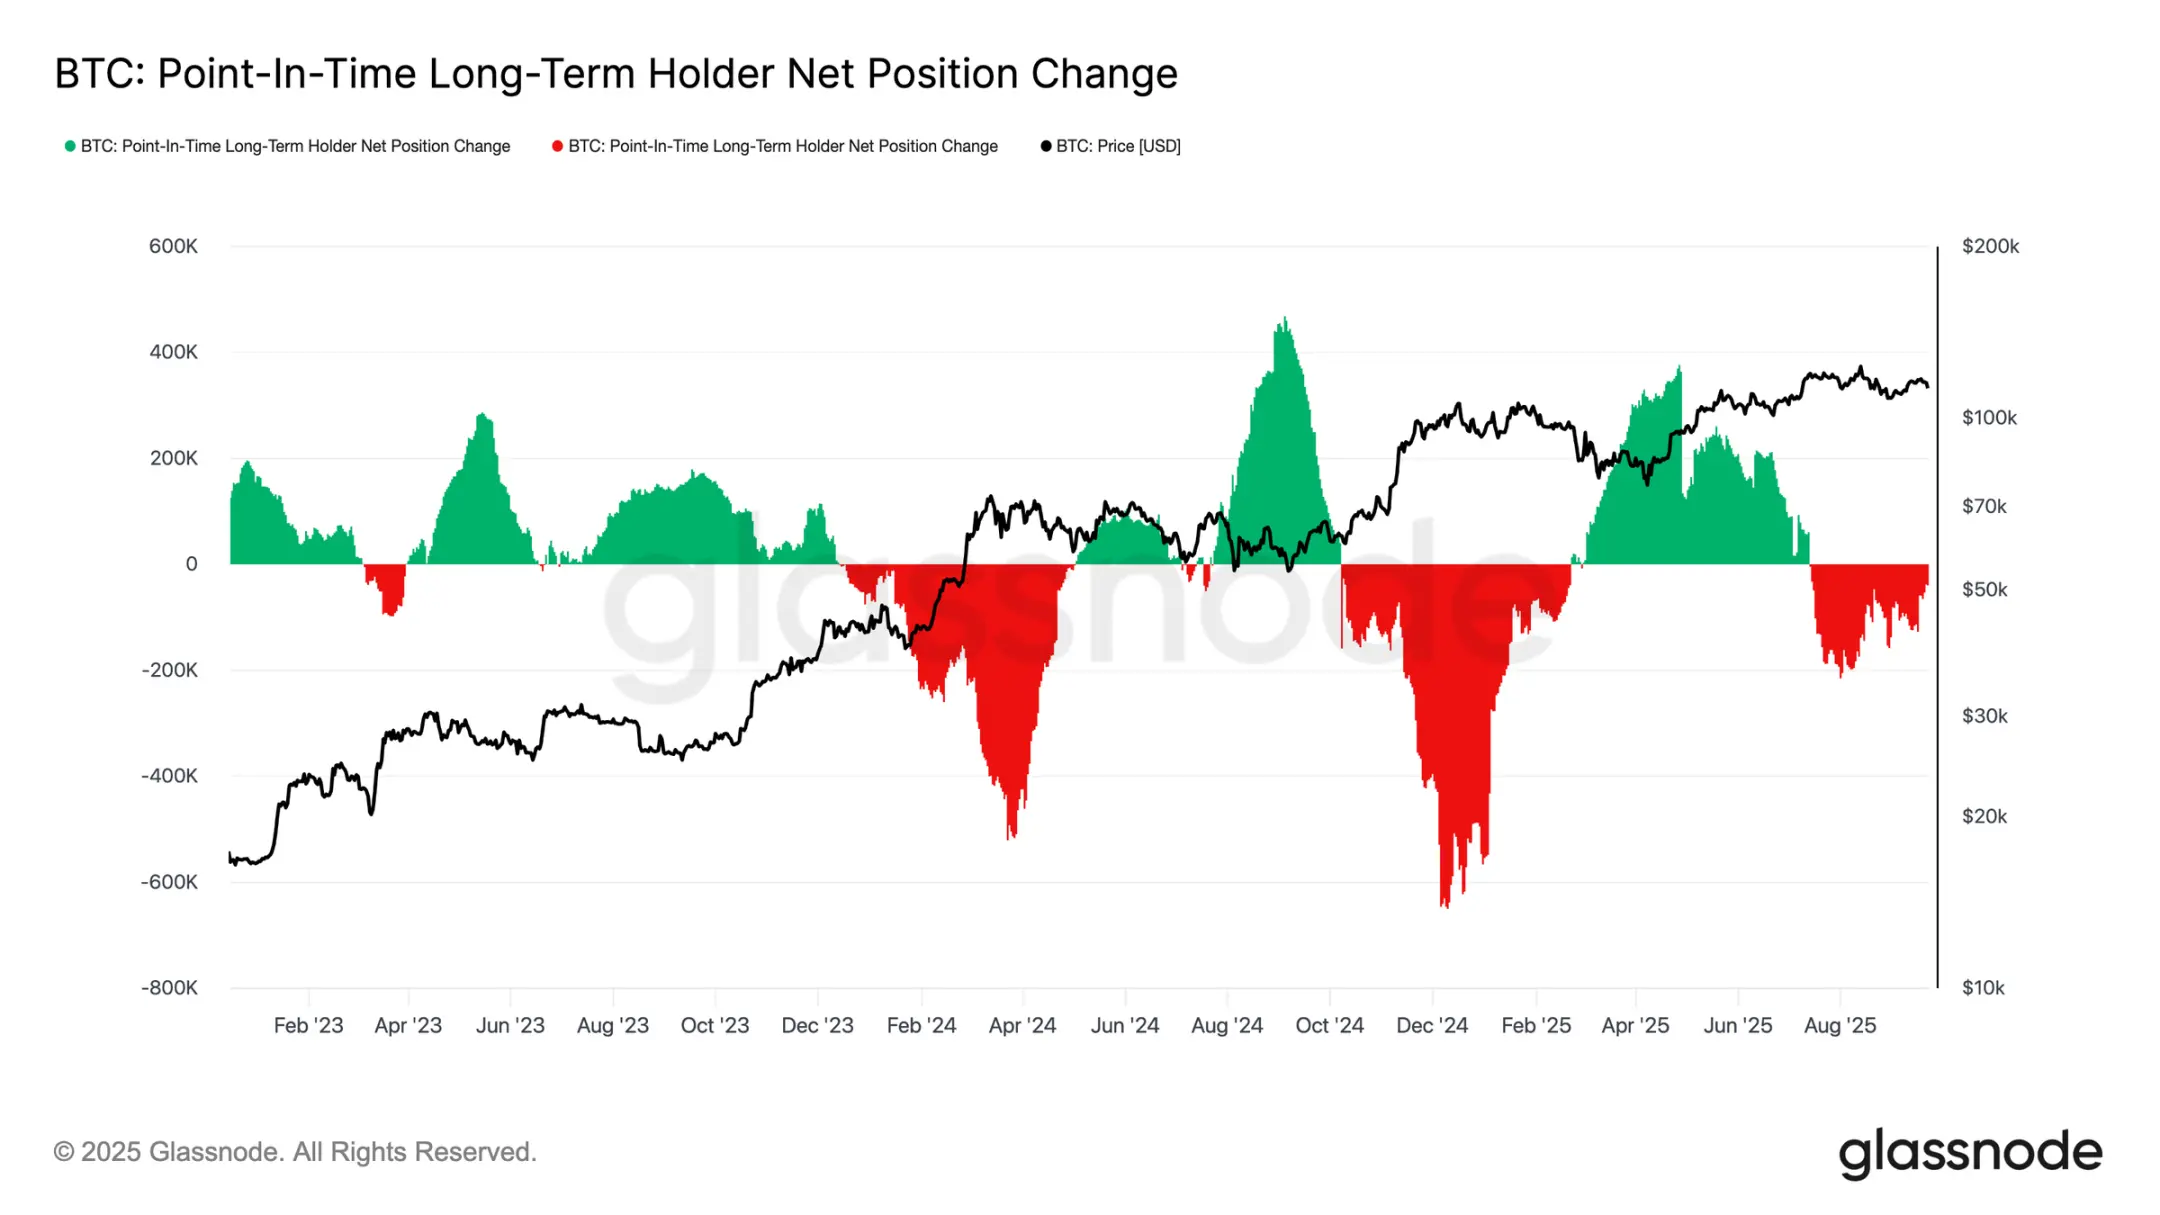
Fragile Balance
ETF inflows have so far balanced the selling from long-term holders, but the margin for error is small. Around the FOMC meeting, long-term holder sell-offs surged to 12,200 BTC/month, while ETF net inflows plummeted from 2,600 BTC/day to nearly zero. The combination of increased sell-off pressure and weakened institutional demand has created a fragile backdrop, laying the groundwork for weakness.
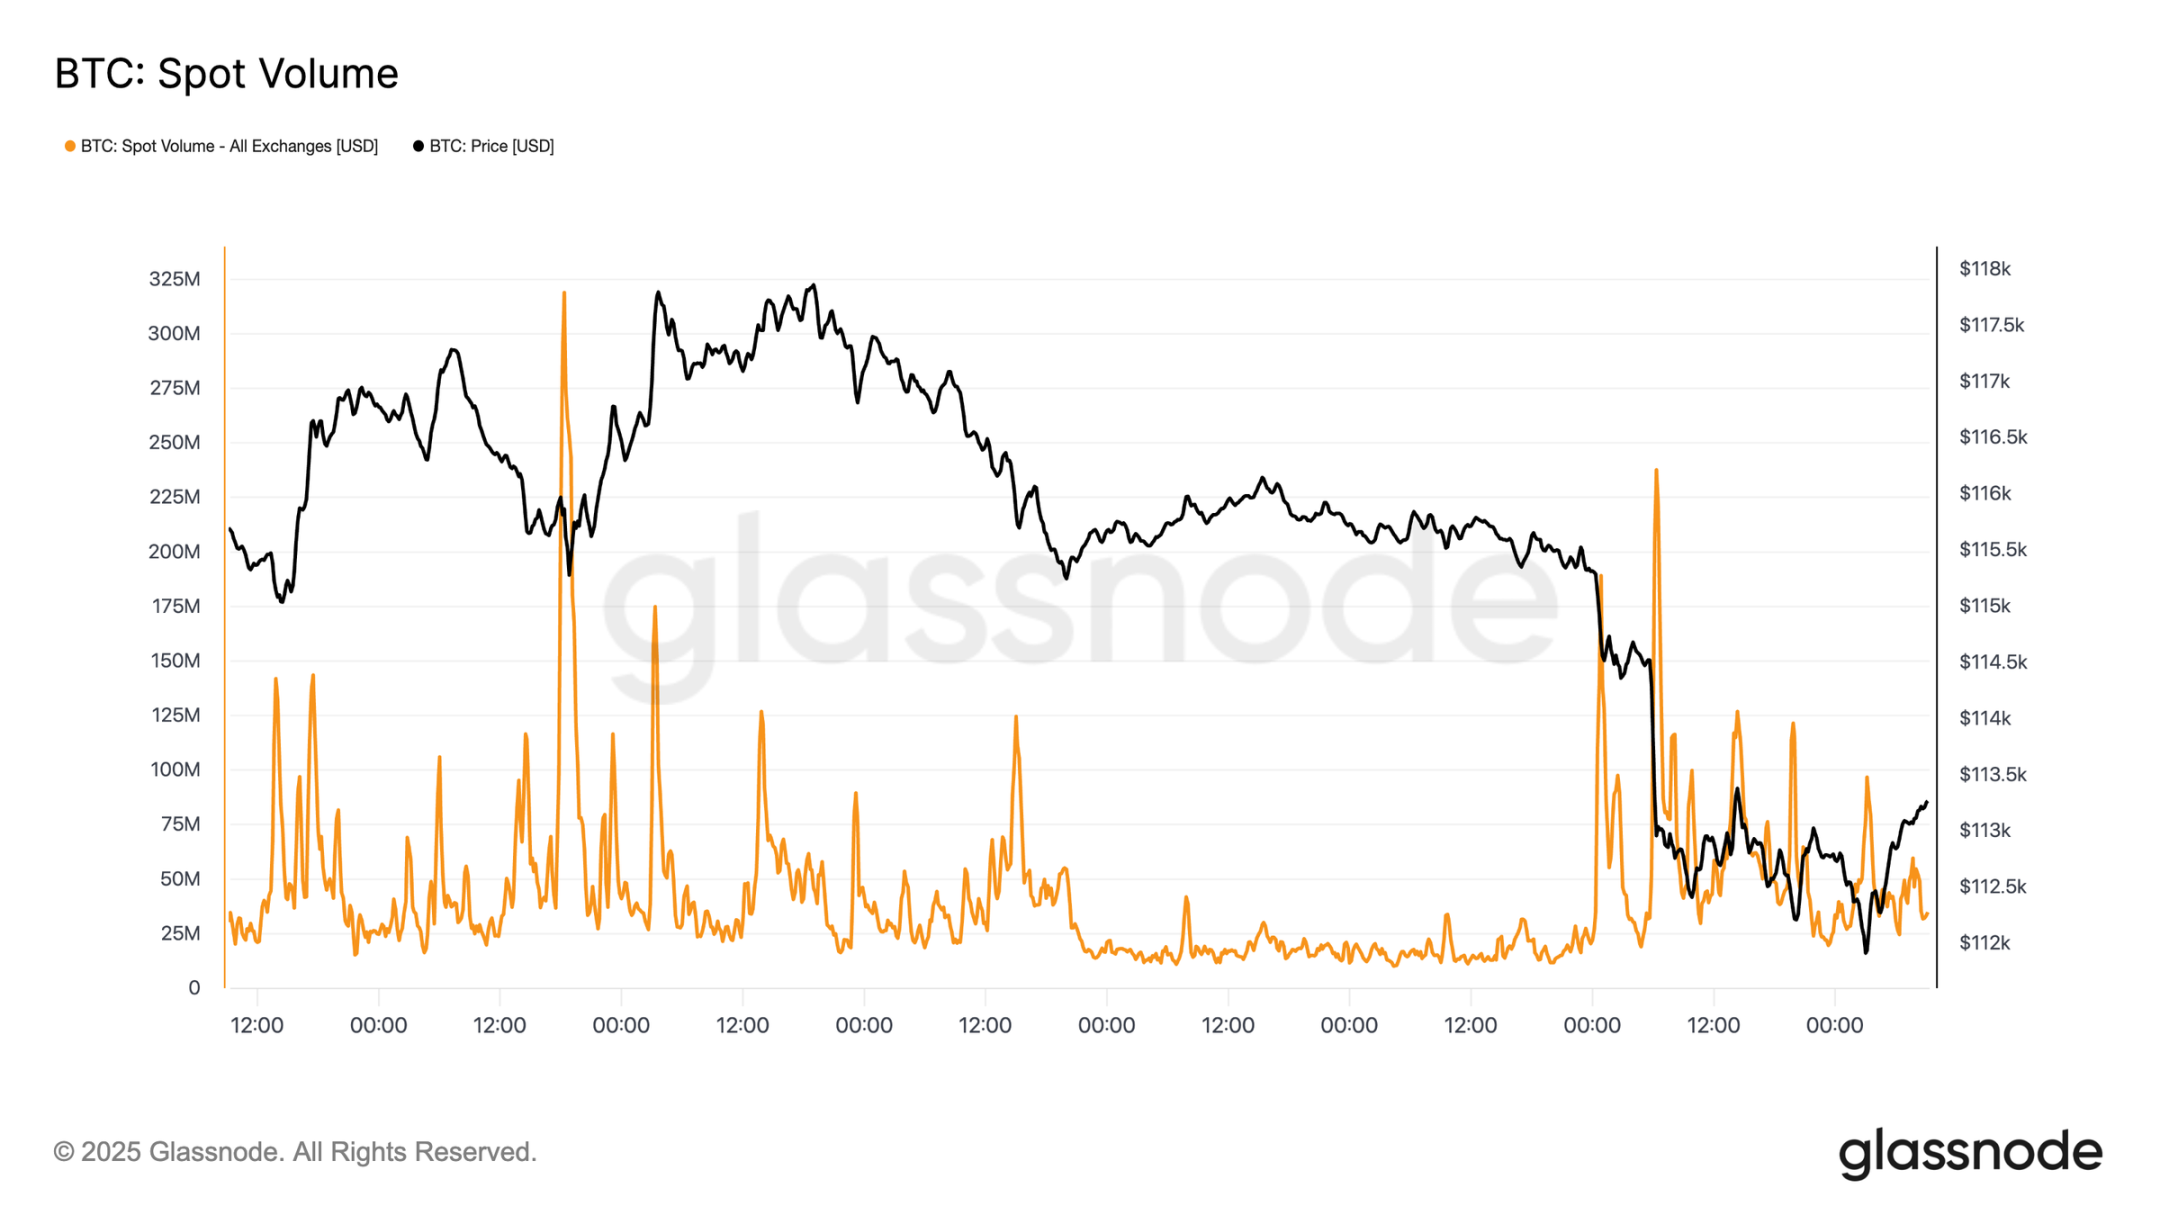
Spot Market Pressure
This fragility is evident in the spot market. During the sell-off following the FOMC meeting, trading volume surged as forced liquidations and thin liquidity amplified the downward trend. While painful, a temporary bottom formed near the short-term holder cost basis of $111,800.
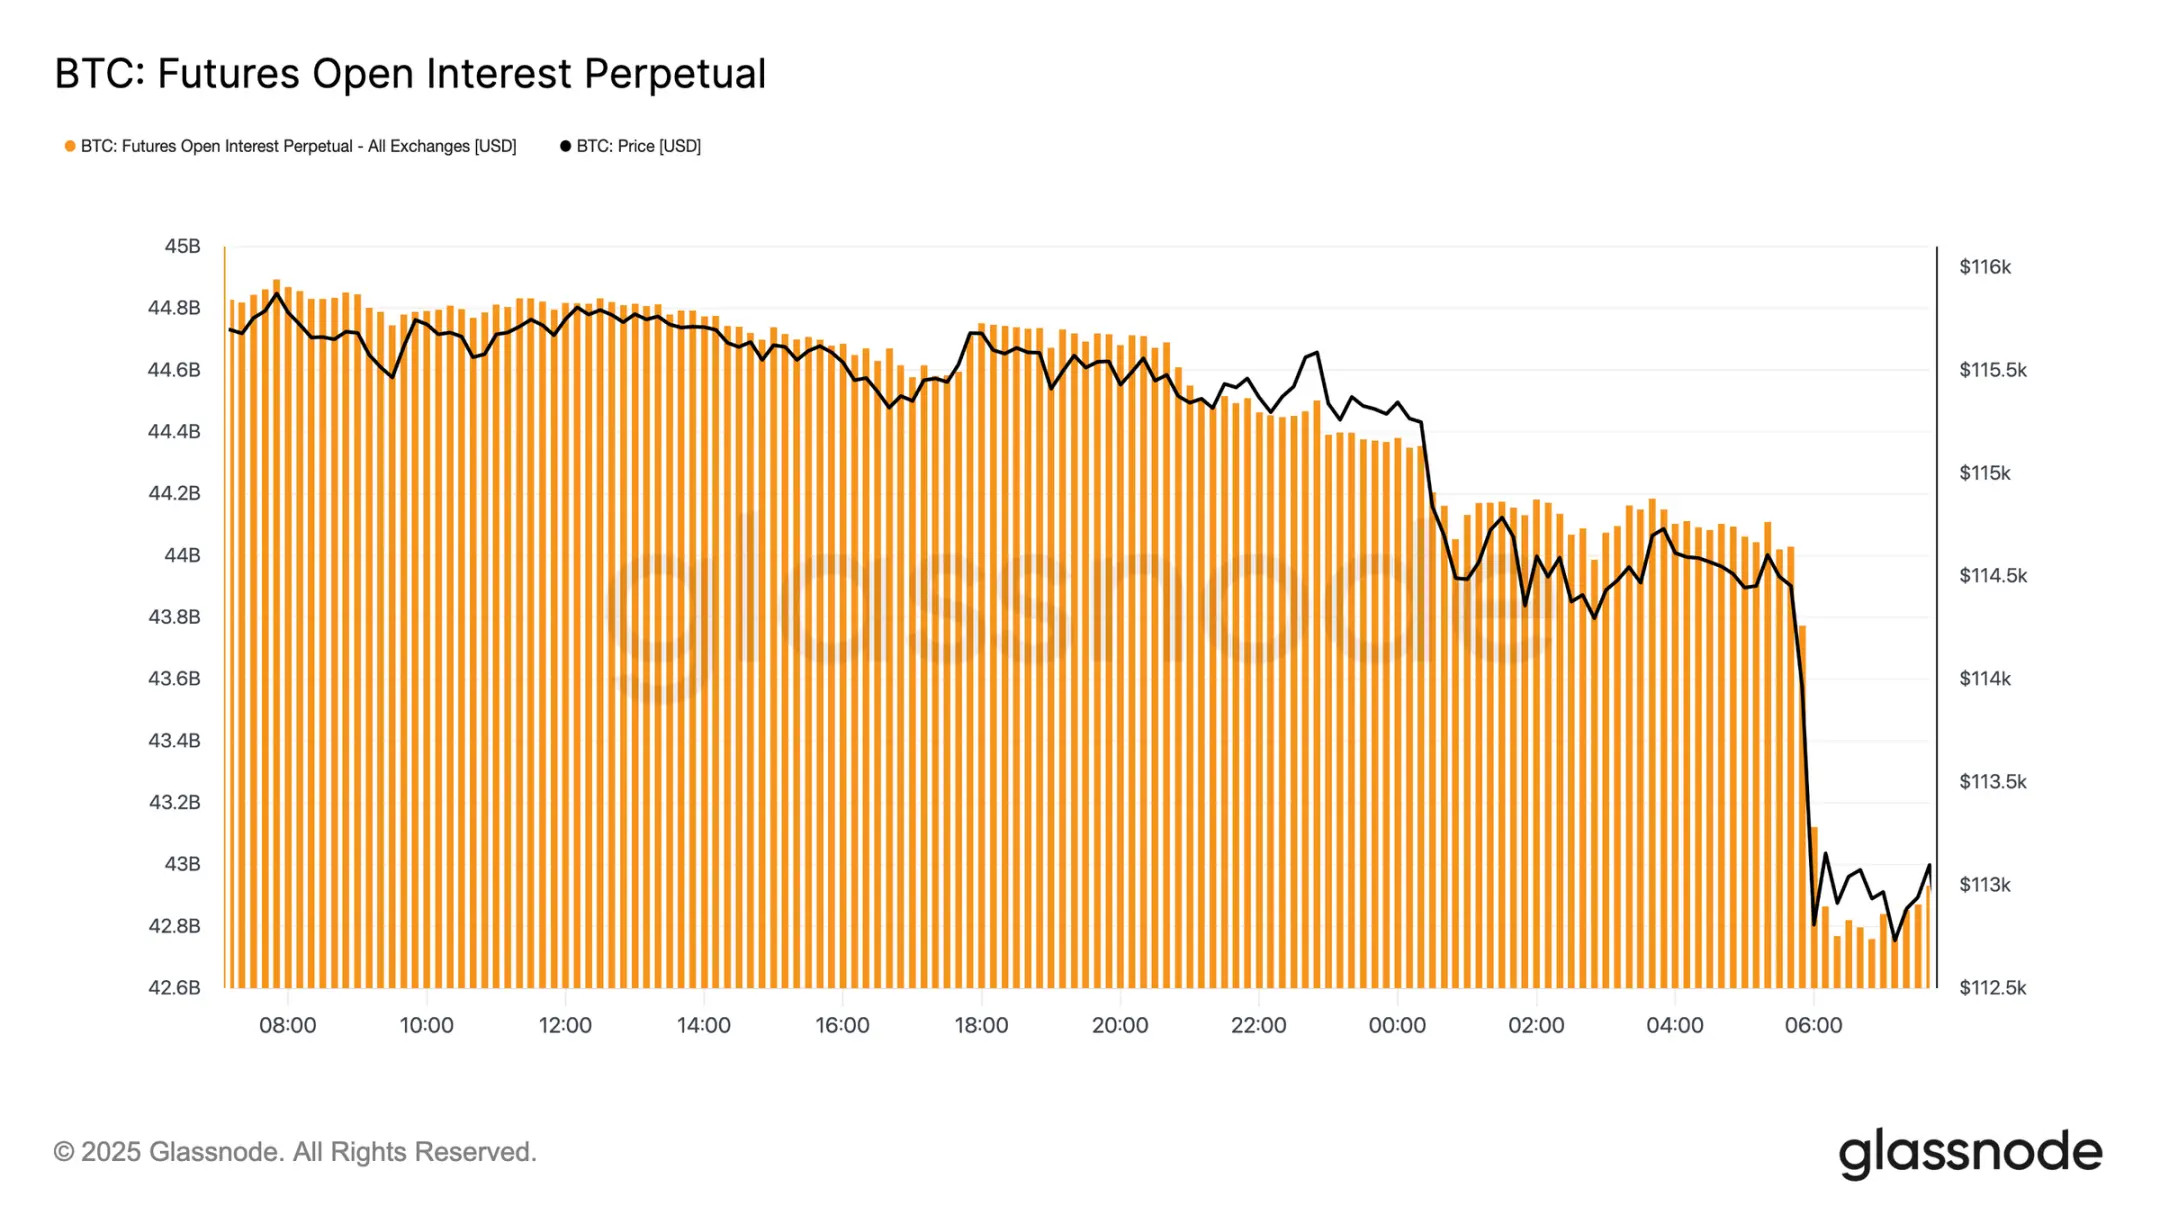
Futures Deleveraging
Meanwhile, as Bitcoin fell below $113,000, open interest in futures dropped sharply from $44.8 billion to $42.7 billion. This deleveraging event cleared leveraged long positions, amplifying downward pressure. While it currently causes instability, this reset helps eliminate excess leverage and restore balance in the derivatives market.
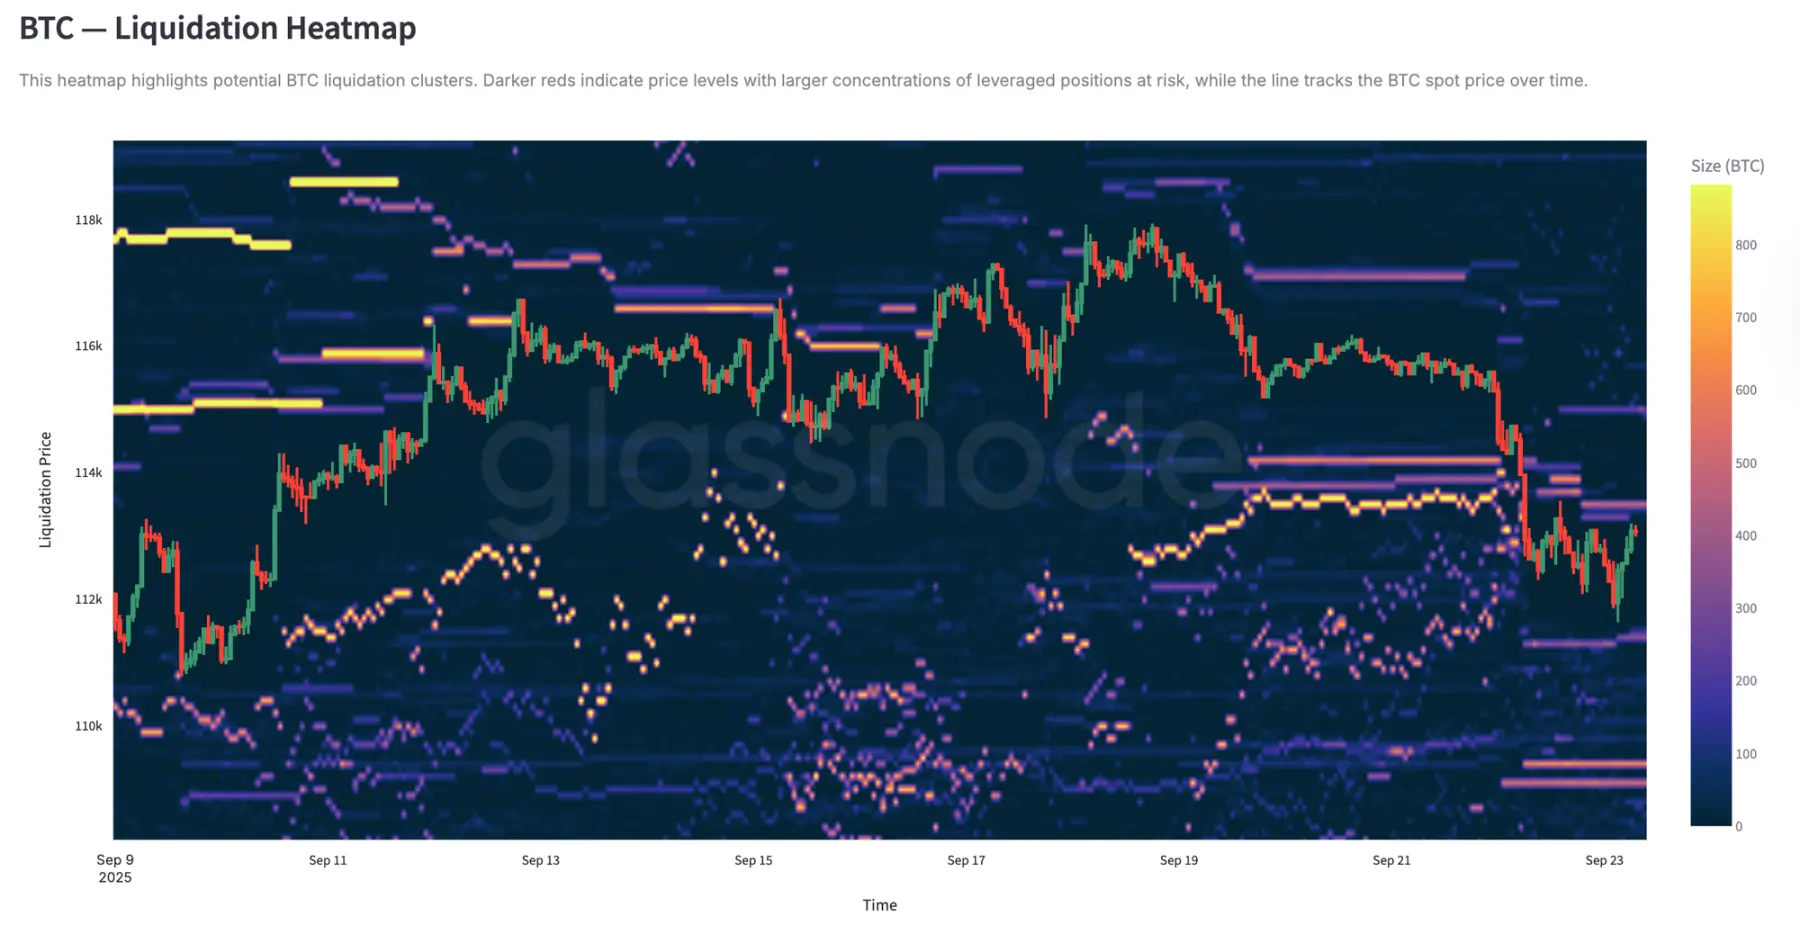
Liquidation Clusters
The perpetual contract liquidation heatmap provides more detail. When prices fell below the $114,000 to $112,000 range, dense clusters of leveraged long positions were cleared, leading to significant liquidations and accelerating the decline. Risk pockets still exist above $117,000, making the market vulnerable to liquidity-driven fluctuations in both directions. Without stronger demand, the vulnerability around these levels increases the risk of further severe volatility.
Options Market
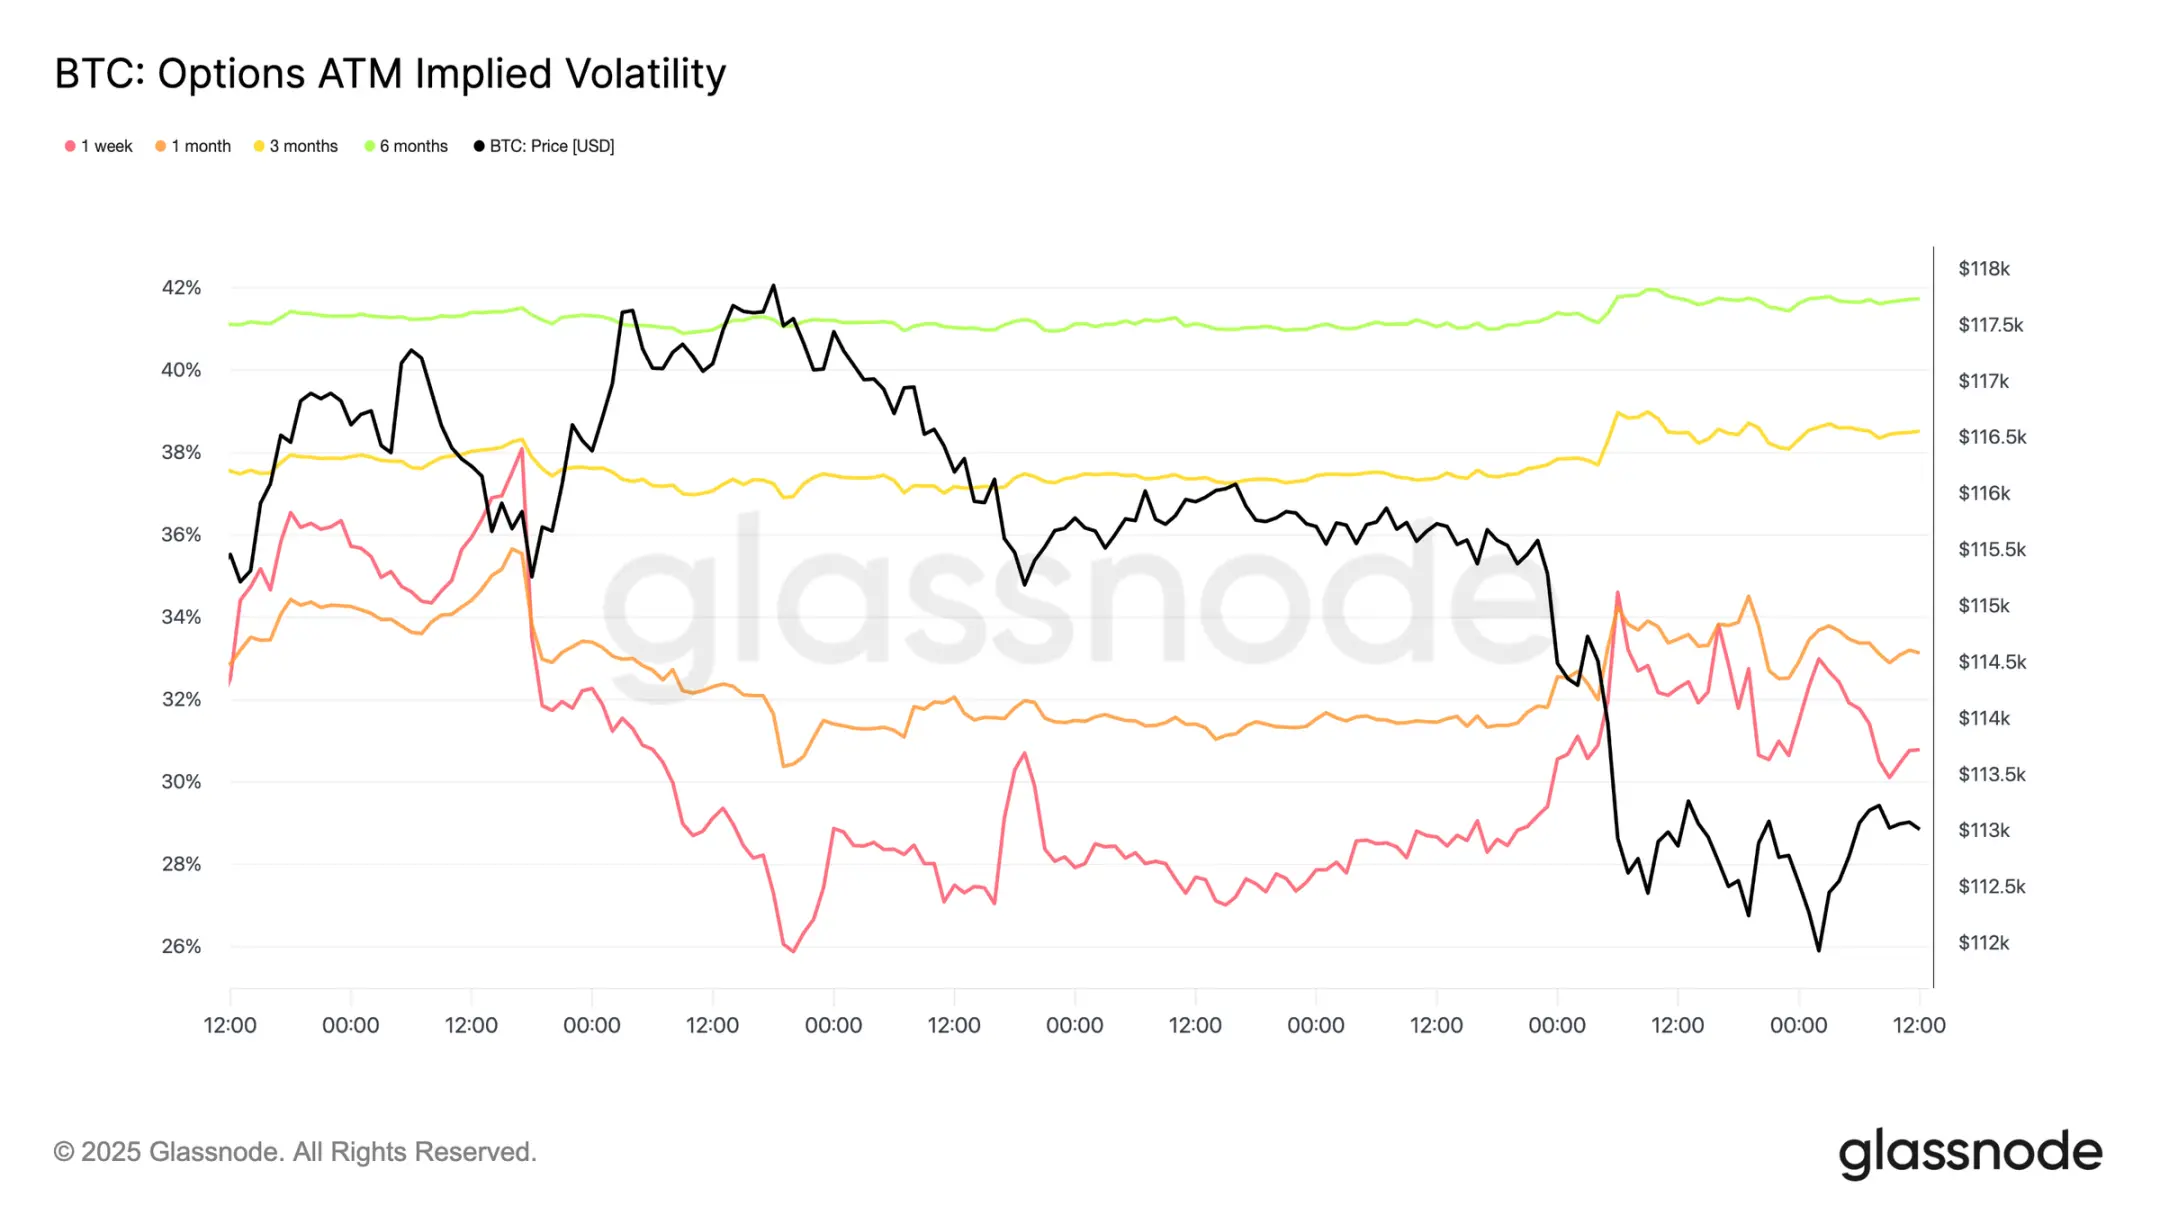
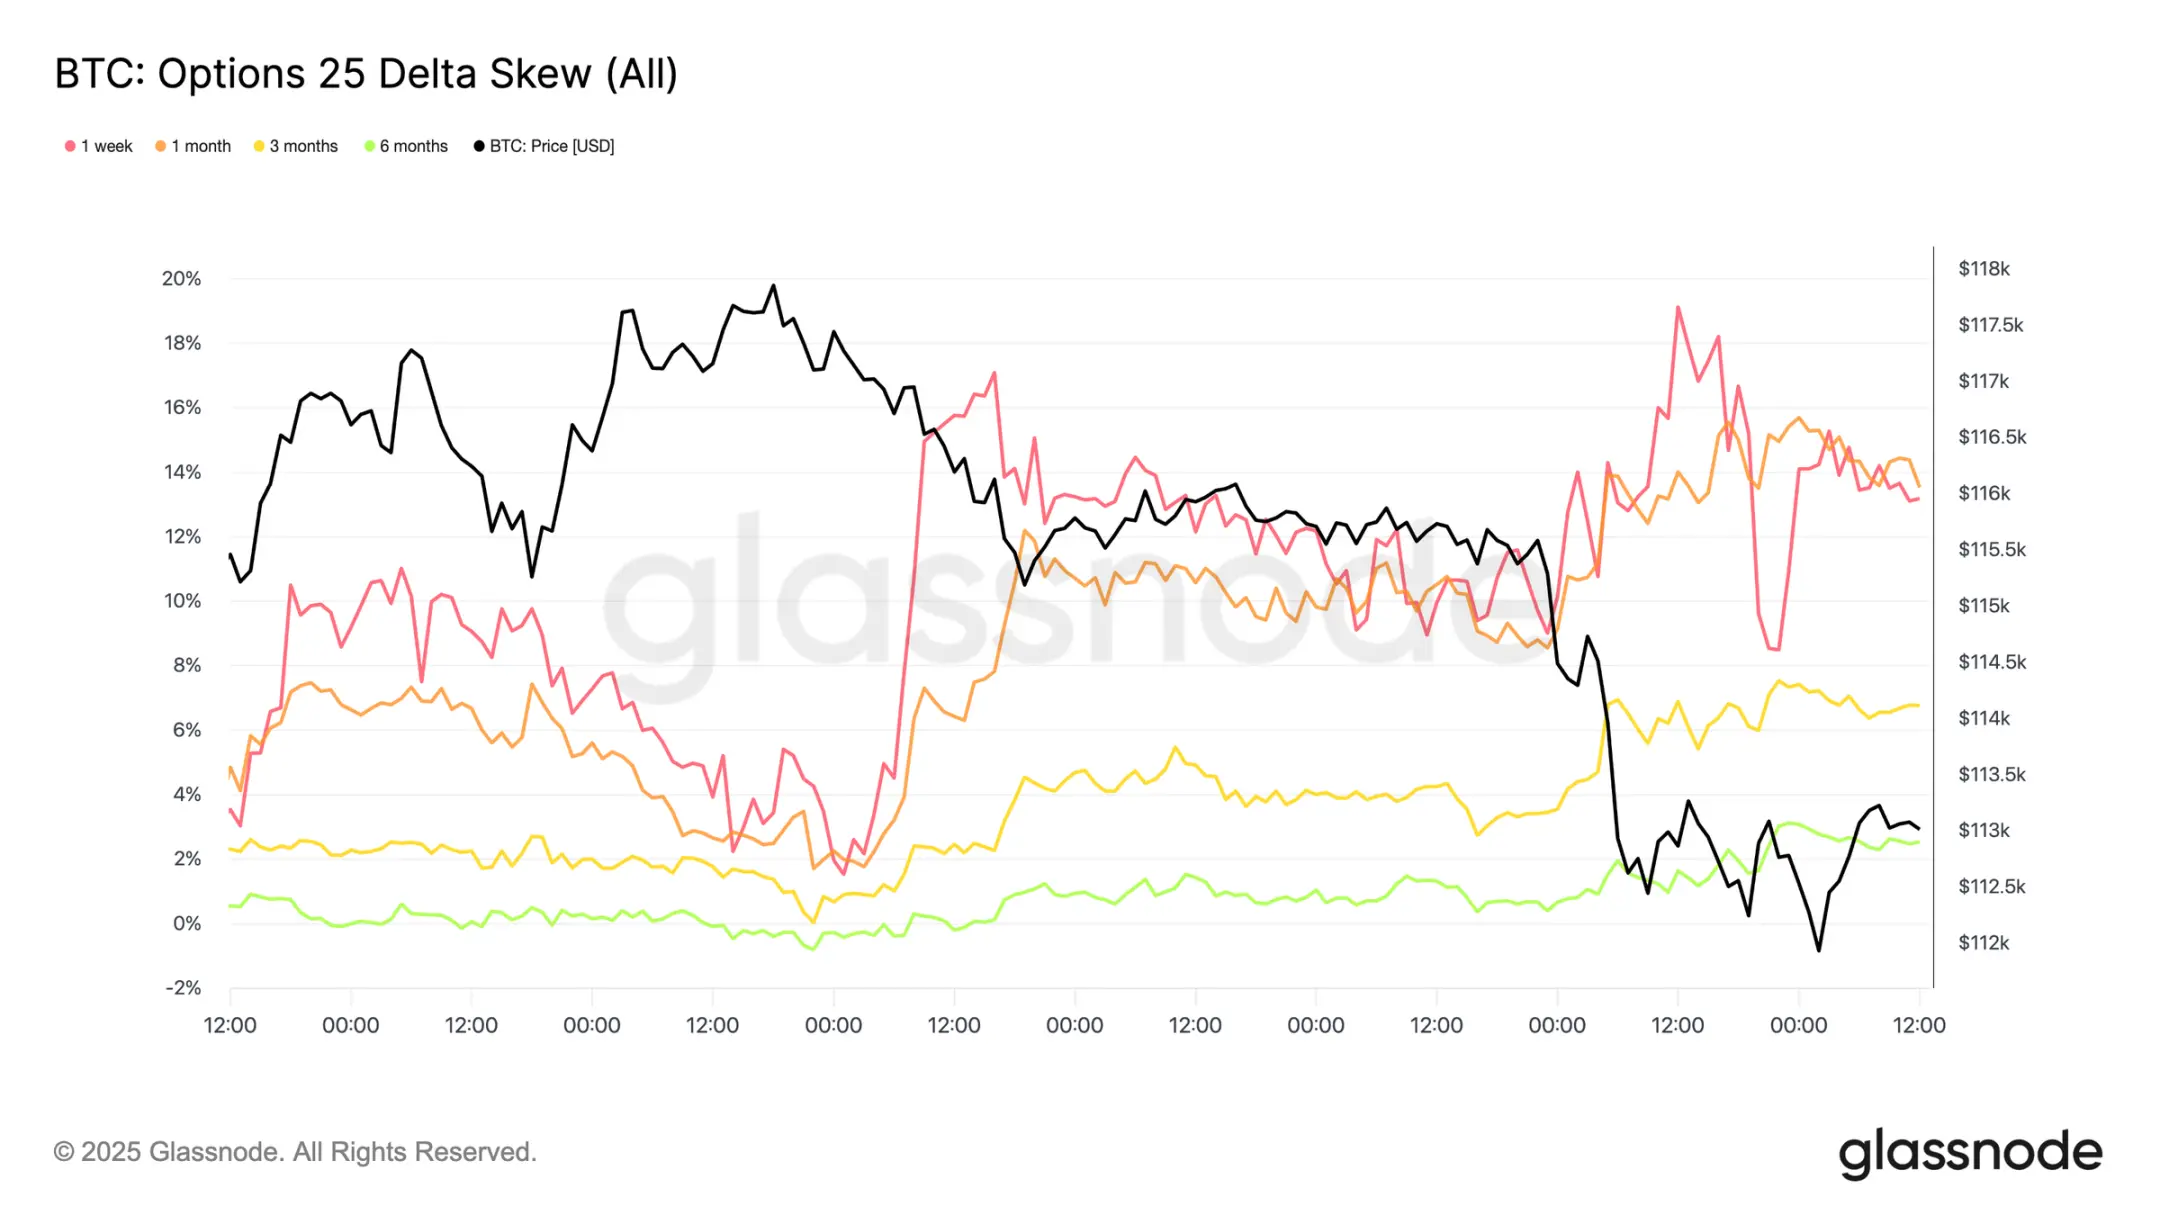
Volatility
Turning to the options market, implied volatility provides a clear view of how traders navigated a tumultuous week. Two main catalysts shaped the market landscape: the first interest rate cut of the year and the largest liquidation event since 2021. As hedging demand built up, volatility surged before the FOMC meeting but quickly faded after the rate cut was confirmed, indicating that this move had largely been priced in. However, the violent liquidation in futures on Sunday night reignited demand for protection, leading to a rebound in one-week implied volatility, which strongly extended across various maturities.
Market Repricing Rate Cuts
After the FOMC meeting, there was aggressive demand for put options, either as protection against sharp declines or as a way to profit from volatility. Just two days later, the market realized this signal with the largest liquidation event since 2021.
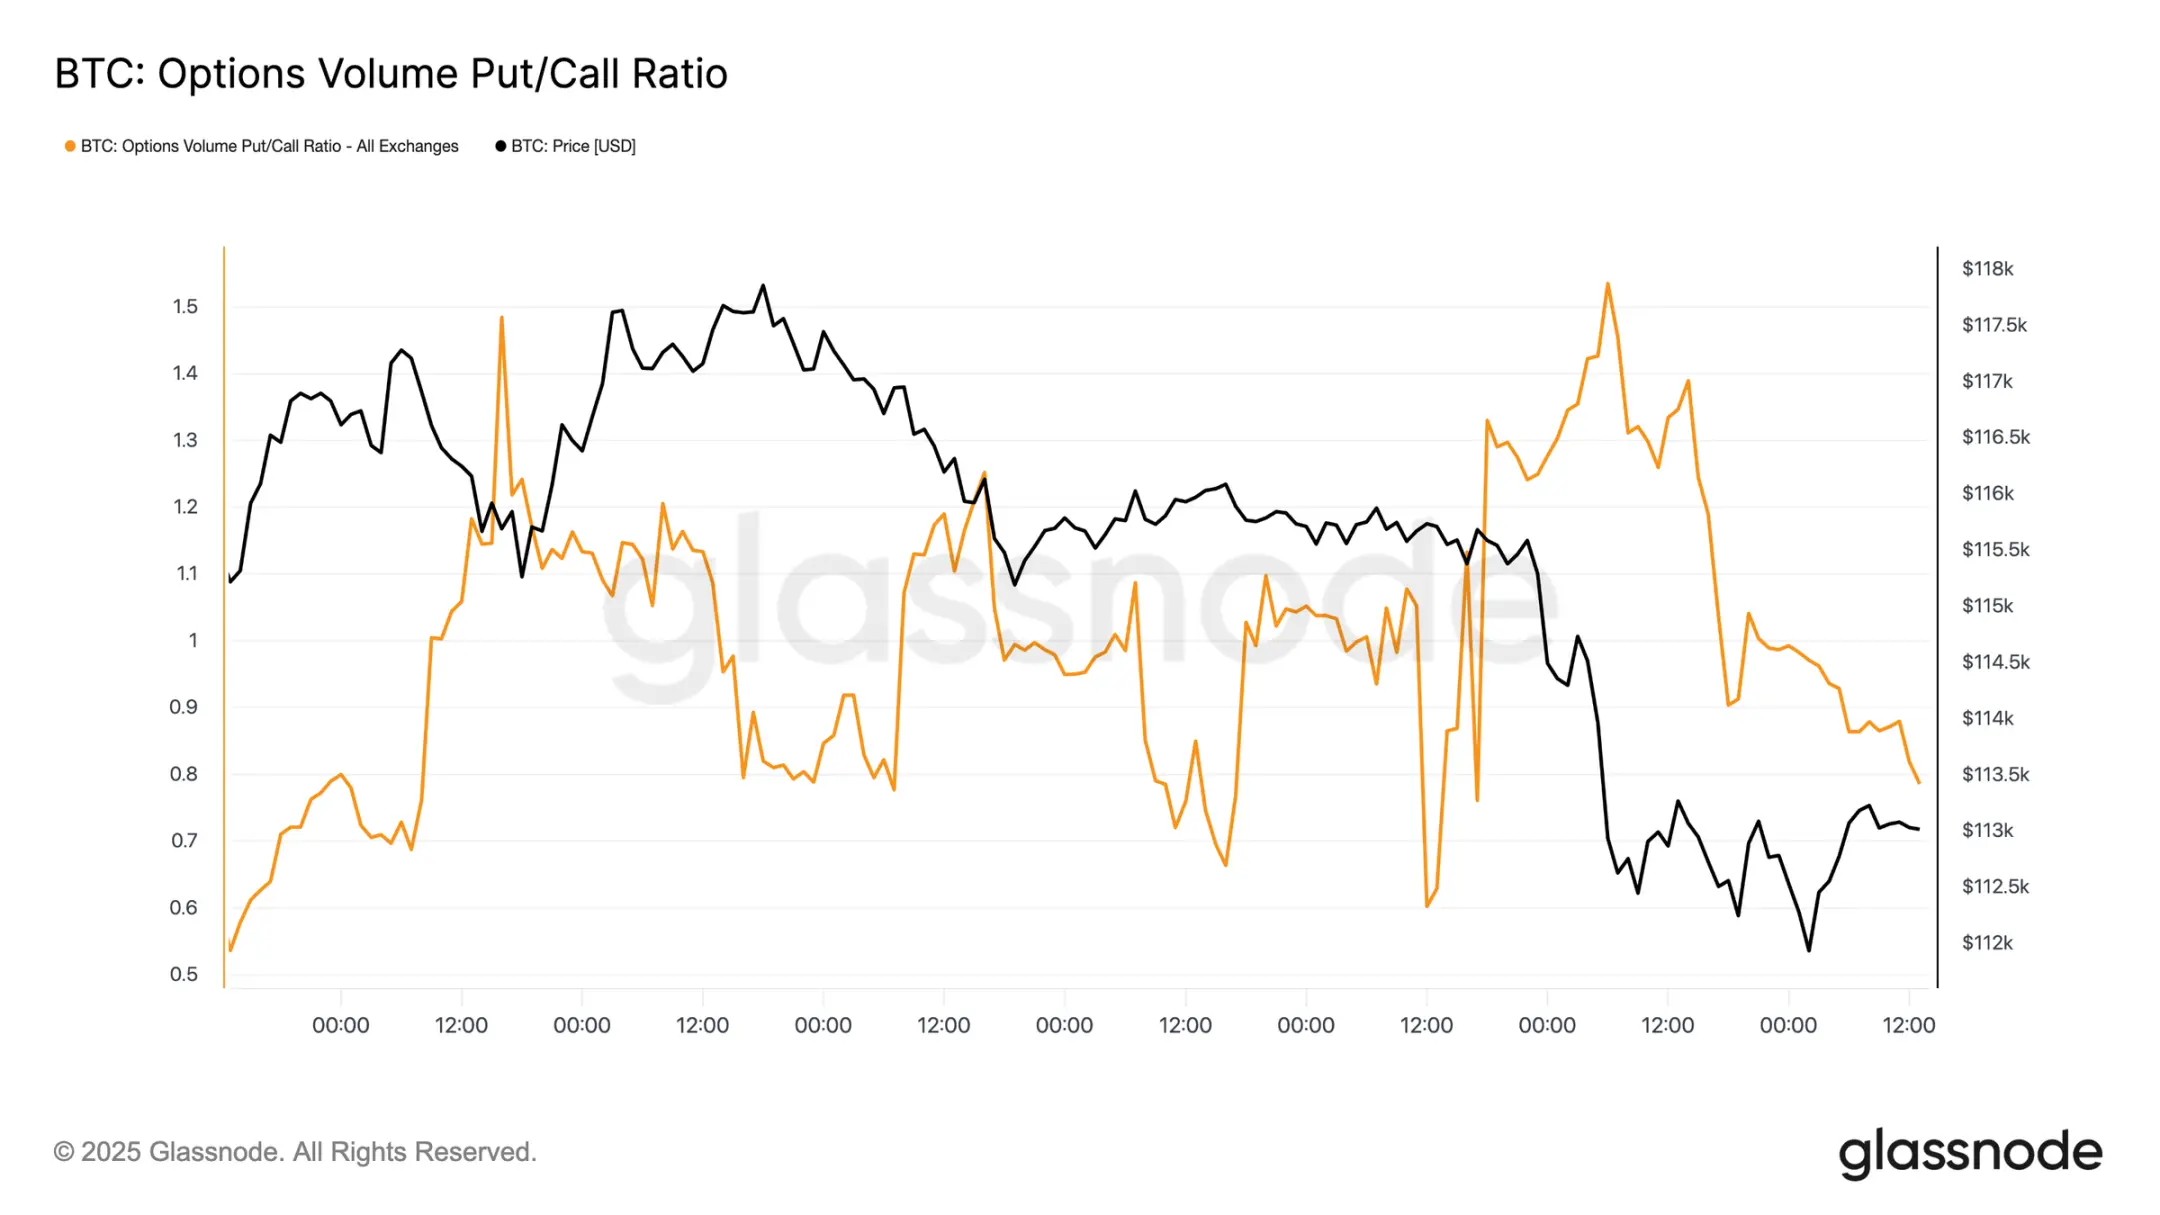
Put/Call Option Fund Flows
After the sell-off, the put/call option volume ratio trended downward as traders locked in profits on in-the-money puts, while others rotated into cheaper calls. Short- and medium-term options still heavily favor puts, making downside protection costly relative to upside. For participants holding a constructive view towards the end of the year, this imbalance creates opportunities—either to accumulate calls at relatively low costs or to finance their positions by selling expensive downside risk exposure.
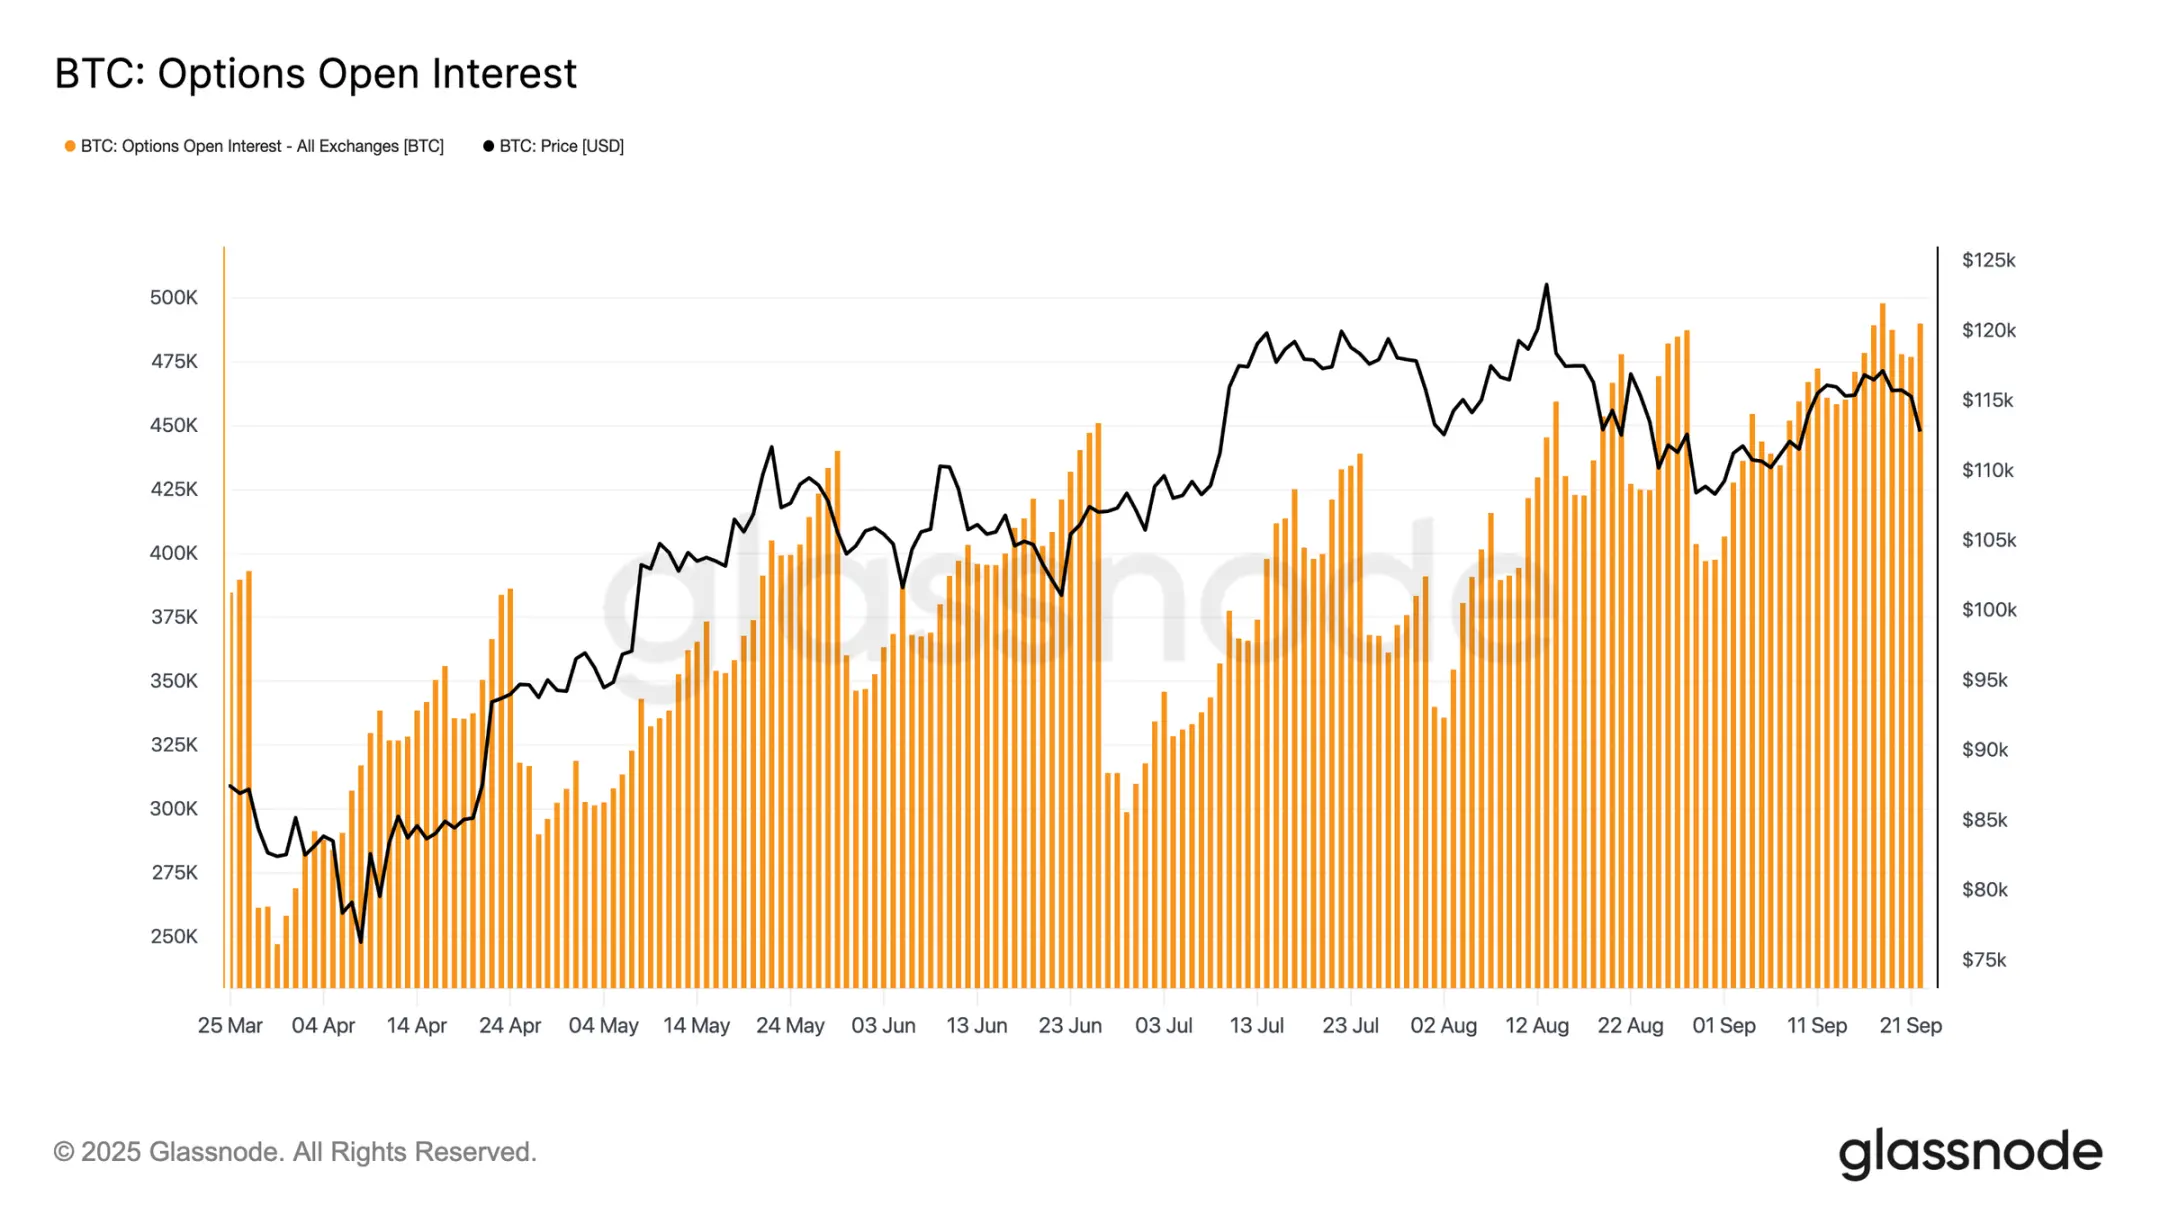
Options Open Interest
Total open interest in options hovers near historical highs and will sharply decrease when it expires on Friday morning, then rebuild the market before December. Currently, the market is in a peak area, where even minor price fluctuations will force market makers to hedge aggressively. Market makers are short on the downside and long on the upside, a structure that amplifies sell-offs while limiting rebounds. This dynamic tilts recent volatility risk to the downside, exacerbating vulnerability until expiration clears and positions reset.
Conclusion
Bitcoin's retreat following the FOMC meeting reflects a typical "buy the rumor, sell the news" pattern, but the broader context points to increasing fatigue. The current 12% decline is relatively mild compared to past cycles, but it follows three major waves of capital inflows that have increased realized market cap by $678 billion, nearly double that of the previous cycle. Long-term holders have realized profits of 3.4 million BTC, highlighting the significant sell-off and maturity of this rally.
Meanwhile, the previously absorbing supply from ETF inflows has slowed, creating a fragile balance. Spot trading volume surged due to forced selling, and futures experienced severe deleveraging, with the options market pricing in downside risk. These signals collectively indicate that market momentum is waning, with liquidity-driven volatility dominating.
Unless institutional and holder demand aligns again, the risk of a deeper cooling remains high.
免责声明:本文章仅代表作者个人观点,不代表本平台的立场和观点。本文章仅供信息分享,不构成对任何人的任何投资建议。用户与作者之间的任何争议,与本平台无关。如网页中刊载的文章或图片涉及侵权,请提供相关的权利证明和身份证明发送邮件到support@aicoin.com,本平台相关工作人员将会进行核查。


