If history rhymes, the next 6-12 months may be a critical window.
Written by: David, Deep Tide TechFlow
"Let's take a break and wait for the Federal Reserve's decision before making any moves." Recently, there has been a noticeable sentiment of caution in the investment community.
At 2 AM Beijing time on September 18, the Federal Reserve will announce its latest interest rate decision. This will be the fifth meeting since the rate cut last September. The market expects a further reduction of 25 basis points, bringing the current rate down from 4.5% to 4.25%.
A year ago, everyone was waiting for the beginning of the rate-cutting cycle. Now, we are already halfway through it.
Why is everyone waiting for this shoe to drop? Because history tells us that once the Federal Reserve enters a rate-cutting phase, various assets often experience a surge.
So where will Bitcoin go this time? How will the stock market and gold perform?
By reviewing the Federal Reserve's rate-cutting cycles over the past 30 years, we may find answers in historical data.
What kind of rate-cutting cycle are we at the starting point of?
Historically, the Federal Reserve's rate cuts have never been a simple action.
Sometimes, a rate cut acts as a shot in the arm for the economy, causing the market to soar; but at other times, a rate cut is merely the prelude to a storm, indicating that a larger crisis is imminent, and asset prices may not necessarily rise in response.
In 1995, it was a preventive rate cut.
At that time, Federal Reserve Chairman Alan Greenspan faced a "happy dilemma": the economy was growing steadily, but there were signs of overheating. So he chose a "preventive rate cut," reducing the rate from 6% to 5.25%, a total cut of only 75 basis points.
What was the result? The U.S. stock market entered the most glorious five-year bull market of the internet era, with the Nasdaq index rising fivefold over the next five years. It was a textbook example of a soft landing.
In 2007, it was a rescue rate cut.
As depicted in the movie "The Big Short," the trend of the subprime mortgage crisis had already emerged, but few realized the scale of the storm. In September of that year, when the Federal Reserve began cutting rates from 5.25%, the market was still in a frenzy, with the S&P 500 index just hitting an all-time high.
But everyone knows the subsequent script: Lehman Brothers collapsed, a global financial tsunami ensued, and the Federal Reserve had to cut rates from 5.25% to 0.25% within 15 months, a total reduction of 500 basis points. This late rescue could not prevent the economy from plunging into the most severe recession since the Great Depression.
In 2020, it was a panic rate cut.
No one could have predicted the "black swan" of COVID-19. On March 3 and March 15, the Federal Reserve made two emergency rate cuts, dropping from 1.75% to 0.25% in just ten days. At the same time, it initiated "unlimited quantitative easing," expanding its balance sheet from $4 trillion to $9 trillion.
This unprecedented level of liquidity created one of the most surreal scenes in financial history: the real economy came to a standstill, yet financial assets were in a frenzy. Bitcoin surged from $3,800 in March 2020 to $69,000 in November 2021, an increase of over 17 times.
Looking back at these three rate-cutting models, we can see three types of asset changes that are similar in outcome but different in process:
Preventive rate cut: A small rate cut, soft landing for the economy, steady asset growth.
Rescue rate cut: A large rate cut, hard landing for the economy, assets fall before rising.
Panic rate cut: An emergency rate cut, extreme volatility, assets experience a V-shaped reversal.
So in 2025, which script are we at the beginning of?
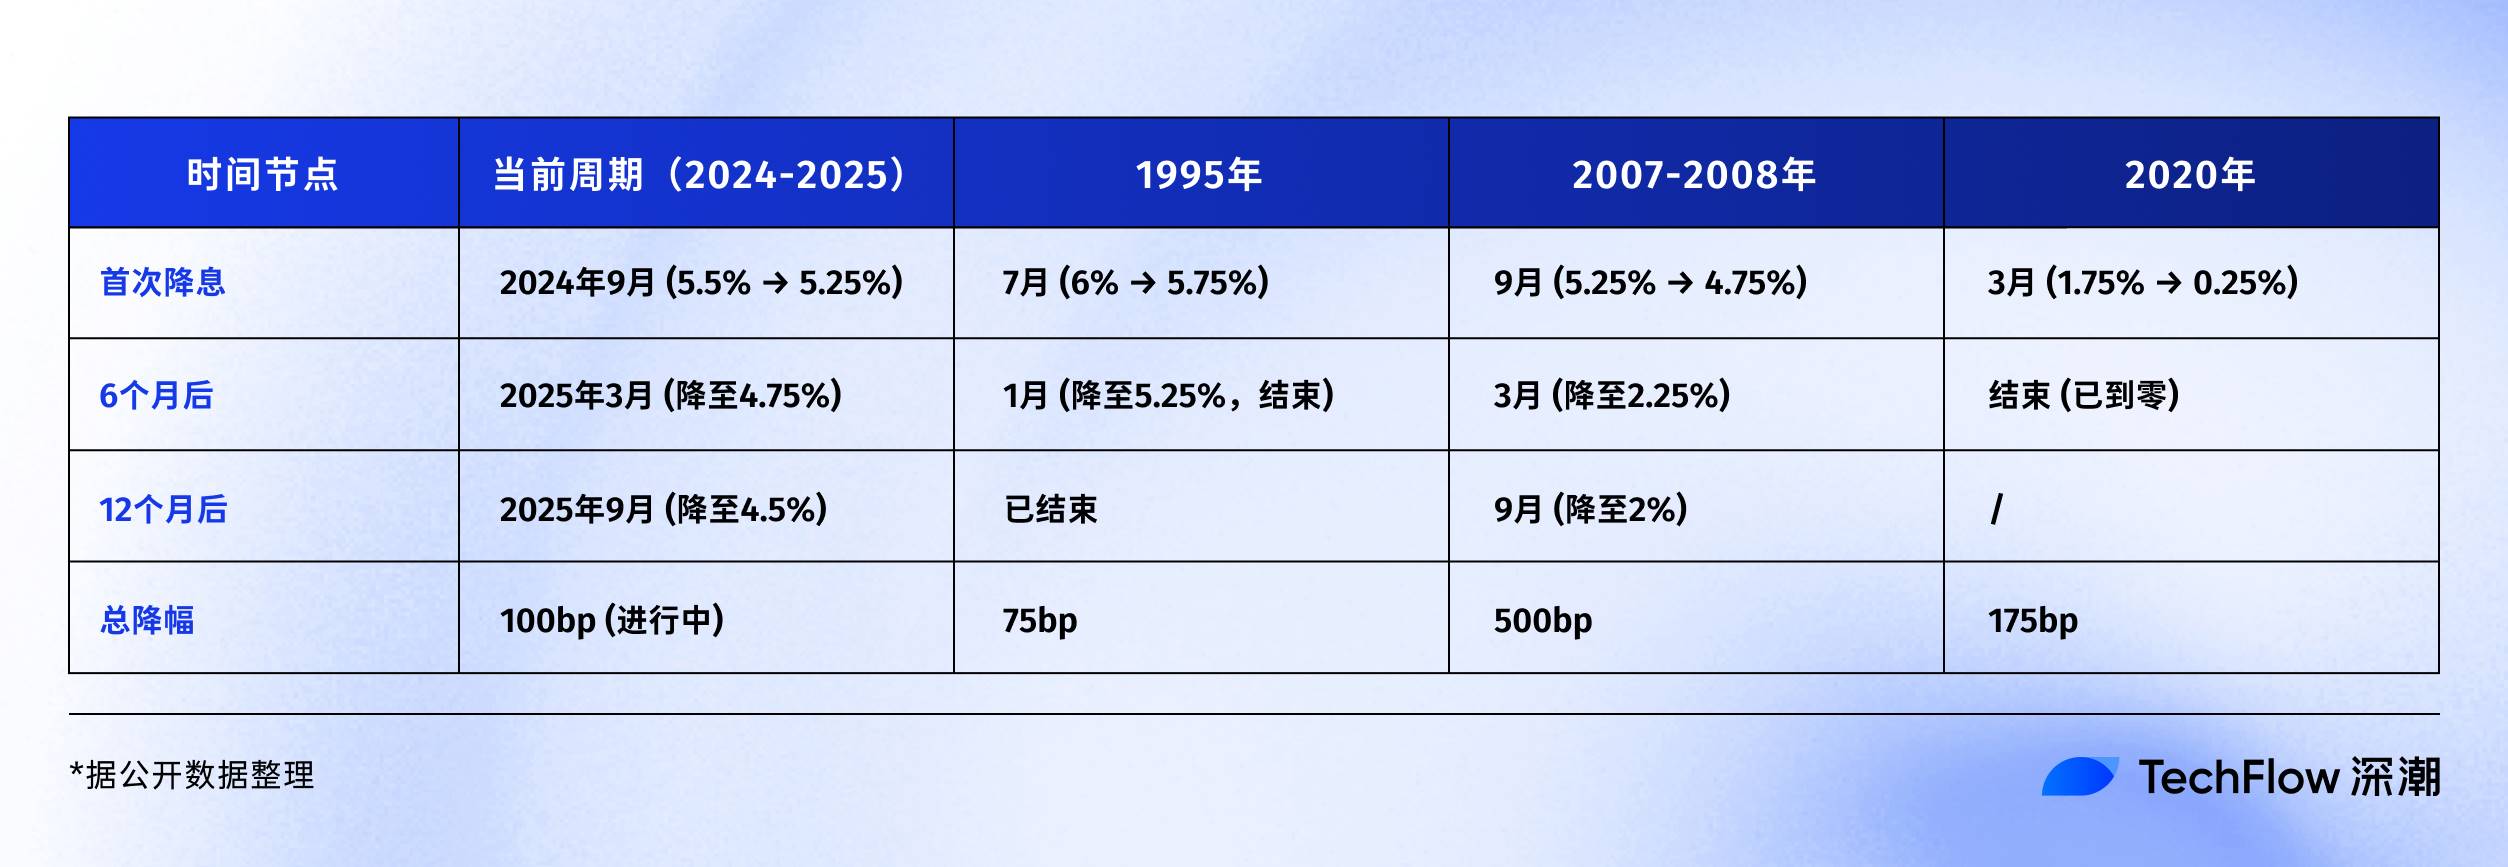
From the data, it currently resembles the preventive rate cut of 1995. The unemployment rate is 4.1%, not particularly high; GDP is still growing, with no recession; inflation has fallen from a peak of 9% in 2022 to around 3%.
However, there are several unsettling details worth noting:
First, the stock market is already at historical highs at the time of this rate cut, with the S&P 500 up over 20% this year.
Historically, when rates were cut in 1995, the stock market had just recovered from a low; whereas in 2007, the stock market was at a high before it crashed. Secondly, the U.S. government debt as a percentage of GDP has reached 123%, far exceeding the 64% in 2007, which also limits the space for government fiscal stimulus.
But regardless of which rate-cutting model it is, one thing is certain: the liquidity floodgates are about to open.
The rate-cutting script for the crypto market
This time, when the Federal Reserve opens the floodgates again, what will happen in the crypto market?
To answer this question, we first need to understand what the crypto market experienced during the last rate-cutting cycle.
From 2019 to 2020, when a market with a valuation of only $200 billion suddenly welcomed a trillion dollars in liquidity, the entire asset appreciation process was not instantaneous.
- 2019 rate-cutting cycle: Thunder with little rain
On July 31 of that year, the Federal Reserve cut rates for the first time in ten years. For the crypto market at that time, this should have been a significant positive.
Interestingly, Bitcoin seemed to have received the news early. At the end of June, Bitcoin started rising from $9,000 and reached $13,000 by mid-July. The market was betting that the rate cut would bring about a new bull market.
However, when the rate cut actually arrived, the trend was unexpected. On the day of the rate cut, July 31, Bitcoin fluctuated around $12,000, and then instead of rising, it fell. By August, it dropped below $10,000, and by December, it had retreated to around $7,000.
Why did this happen? Looking back, there may be several reasons.
First, the 75 basis point cut was relatively mild, and the release of liquidity was limited. Secondly, the crypto market had just emerged from the 2018 bear market, and investor confidence was low.
Most importantly, traditional institutions were still on the sidelines, and the funds from this rate cut primarily flowed into the stock market, with the S&P 500 rising nearly 10% during the same period.
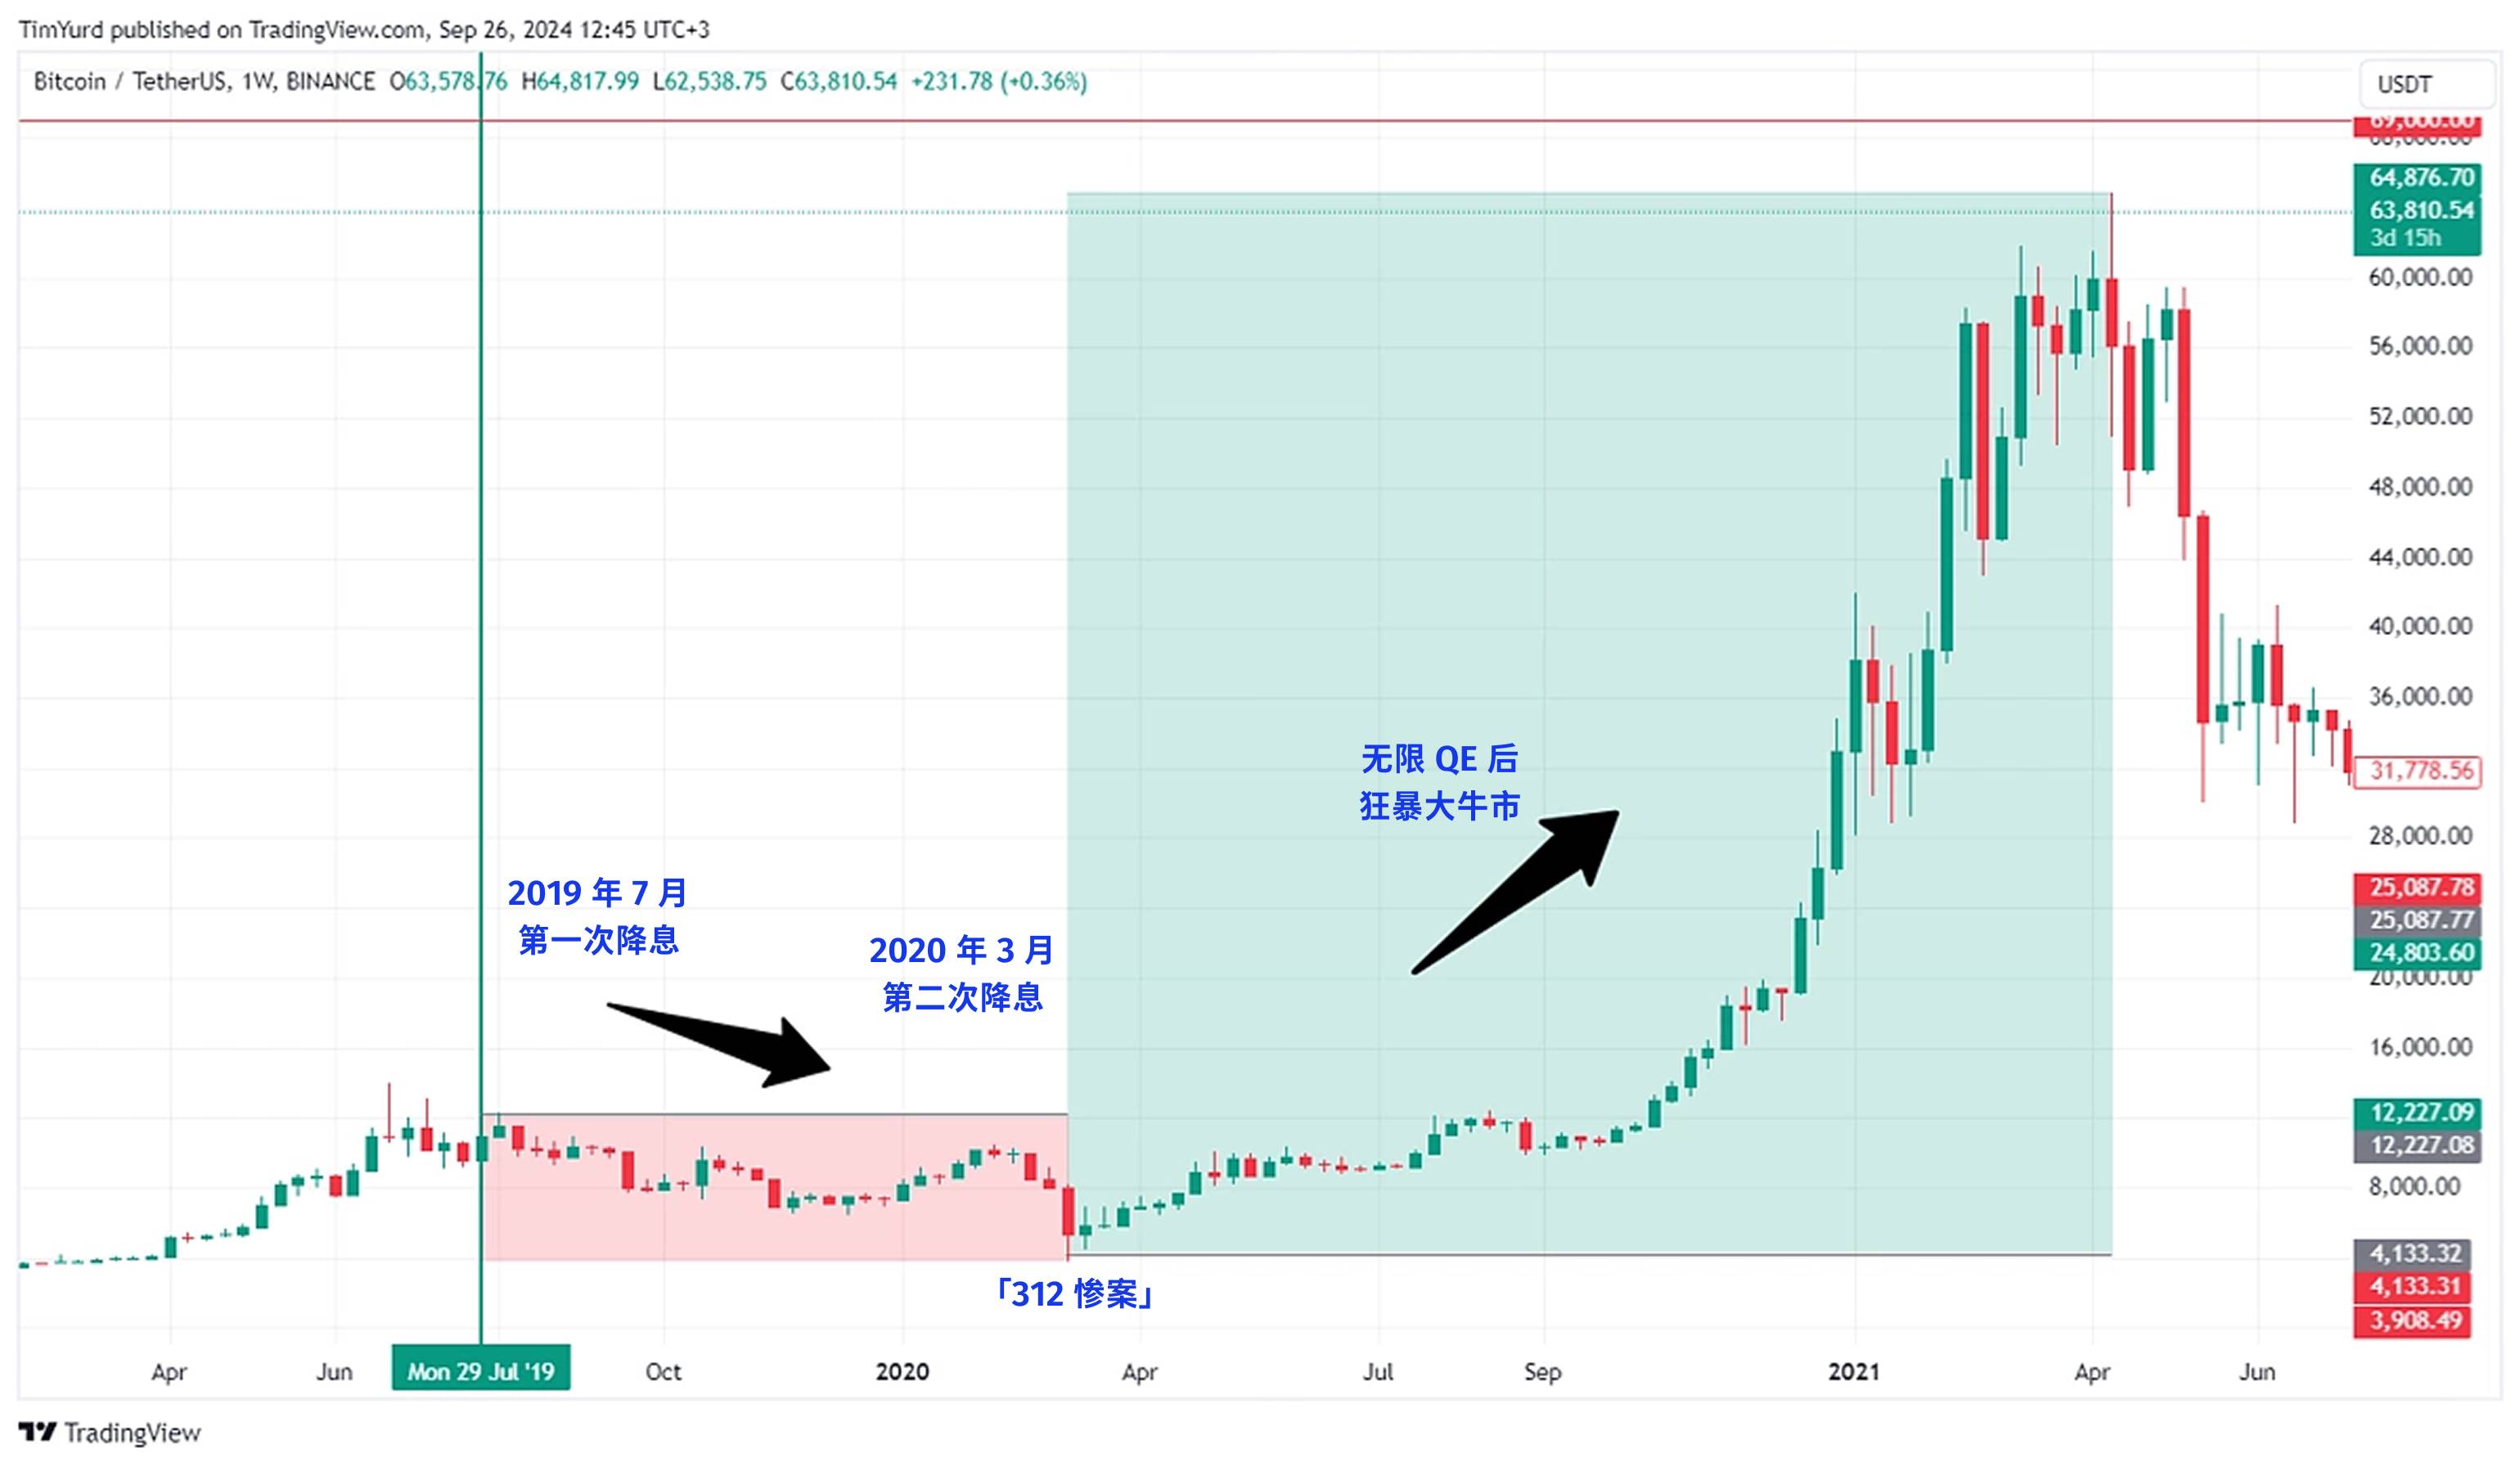
- 2020 rate-cutting cycle: The super roller coaster after the "312" disaster
In the first week of March, the market had already sensed the taste of crisis. On March 3, the Federal Reserve made an emergency rate cut of 50 basis points, and Bitcoin not only did not rise but fell from $8,800 to $8,400. The market's logic was: emergency rate cut = big economic problems = better to run first.
The following week was the darkest moment for the crypto market. On March 12, Bitcoin plummeted from $8,000 to $3,800, with a drop of over 50% in 24 hours. Ethereum fared even worse, dropping from $240 to $90.
The classic "312" disaster became a collective traumatic memory for the crypto market.
The crash that day was actually part of a global liquidity crisis. Amid the panic of the pandemic, all assets were being sold off—stock market circuit breakers, gold prices falling, and U.S. Treasuries also declining. Investors frantically sold everything for cash, and even "digital gold" Bitcoin could not escape.
Worse still, the high leverage in the crypto market amplified the declines. On derivatives exchanges like BitMEX, a large number of 100x leveraged long positions were liquidated, leading to a cascading effect. Within hours, the total liquidation amount across the network exceeded $3 billion.
But just when everyone thought it was going to zero, the turning point came.
On March 15, the Federal Reserve announced a rate cut to 0-0.25% and initiated a $700 billion quantitative easing (QE). On March 23, the Federal Reserve even unleashed the "infinite QE" move. After bottoming at $3,800, Bitcoin began an epic rebound:
March 13, 2020: $3,800 (low)
May 2020: $10,000 (up 160% in 2 months)
October 2020: $13,000 (up 240% in 7 months)
December 2020: $29,000 (up 660% in 9 months)
April 2021: $64,000 (up 1580% in 13 months)
November 2021: $69,000 (up 1715% in 20 months)
Not just Bitcoin, the entire crypto market was in a frenzy. Ethereum rose from $90 to a peak of $4,800, an increase of 53 times. Many DeFi tokens surged by hundreds of times. The total market capitalization of the crypto market expanded from $150 billion in March 2020 to $3 trillion in November 2021.
Comparing 2019 and 2020, why was the market's reaction so drastically different despite both being rate cuts?
Looking back, the answer is very simple: the magnitude of the rate cut determines the scale of liquidity.
In 2020, the rate was cut directly to zero, along with unlimited QE, which was equivalent to opening the floodgates. The Federal Reserve's balance sheet expanded from $4 trillion to $9 trillion, suddenly adding $5 trillion in liquidity to the market.
Even if only 1% flows into the crypto market, that would be $50 billion. This is equivalent to one-third of the total market capitalization of the entire crypto market at the beginning of 2020.
Additionally, the players in 2020 also experienced a shift in mentality from extreme panic to extreme greed. In March, everyone was selling off all assets for cash, but by the end of the year, everyone was borrowing money to buy assets. This dramatic fluctuation in sentiment amplified the price volatility.
More importantly, institutions also entered the market.
MicroStrategy began buying Bitcoin in August 2020, accumulating over 100,000 coins. Tesla announced in February 2021 that it had purchased $1.5 billion in Bitcoin. The holdings of the Grayscale Bitcoin Trust (GBTC) grew from 200,000 coins at the beginning of 2020 to 650,000 coins by the end of the year.
These institutional purchases not only brought real capital but, more importantly, brought a backing effect.
- 2025, will history repeat itself?
In terms of the magnitude of the rate cut, the market expects a 25 basis point cut on September 17, which is just the beginning. If we extrapolate based on current economic data, the entire rate-cutting cycle (over the next 12-18 months) could accumulate to a total cut of 100-150 basis points, with the final rate potentially dropping to around 3.0-3.5%. This magnitude lies between the 75 basis points in 2019 and the cut to zero in 2020.
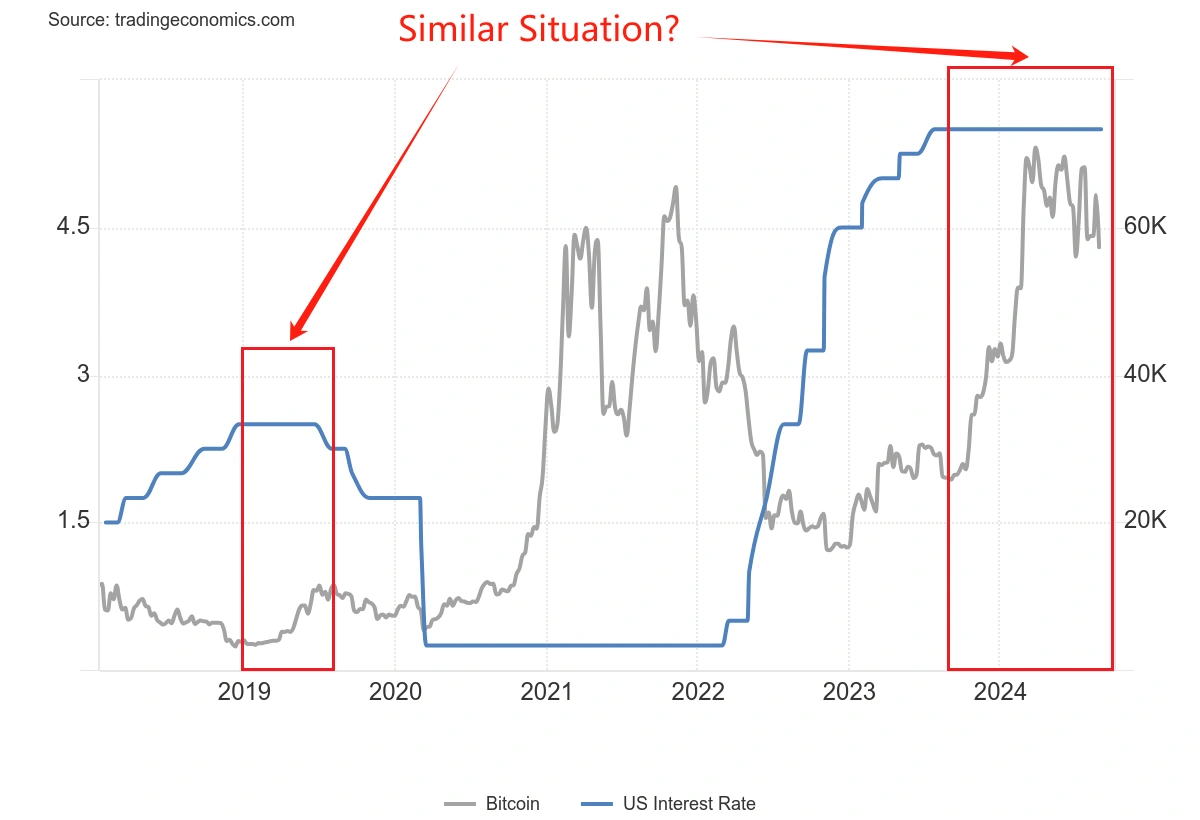
From the market position, Bitcoin is already near its historical high of $115,000, lacking the significant upside potential seen in March 2020. On the other hand, it is not like 2019 when it had just emerged from a bear market, and market confidence is relatively strong.
In terms of institutional participation, the approval of Bitcoin ETFs marks a watershed moment. In 2020, institutions were tentatively buying in, but now there are standardized investment tools. However, institutions have also become smarter and will not chase prices like they did in 2020-2021.
Perhaps in 2024-2025, we will see a third scenario, one that is neither the dullness of 2019 nor the madness of 2020, but rather a "rational prosperity." Bitcoin may not see a 17-fold increase again, but a steady rise as liquidity gates open is a more convincing logic.
The key will also depend on the performance of other assets. If the stock market and gold are both rising, funds will be diverted.
Performance of Traditional Assets During Rate-Cutting Cycles
The rate-cutting cycle not only affects the crypto market but also the performance of traditional assets is worth paying attention to.
For crypto investors, understanding the historical performance patterns of these assets is crucial, as they are both sources of capital and competitors.
U.S. Stocks: Not All Rate Cuts Lead to Bull Markets
According to BMO's research data, we can see the detailed performance of the S&P 500 during rate-cutting cycles over the past 40 years:
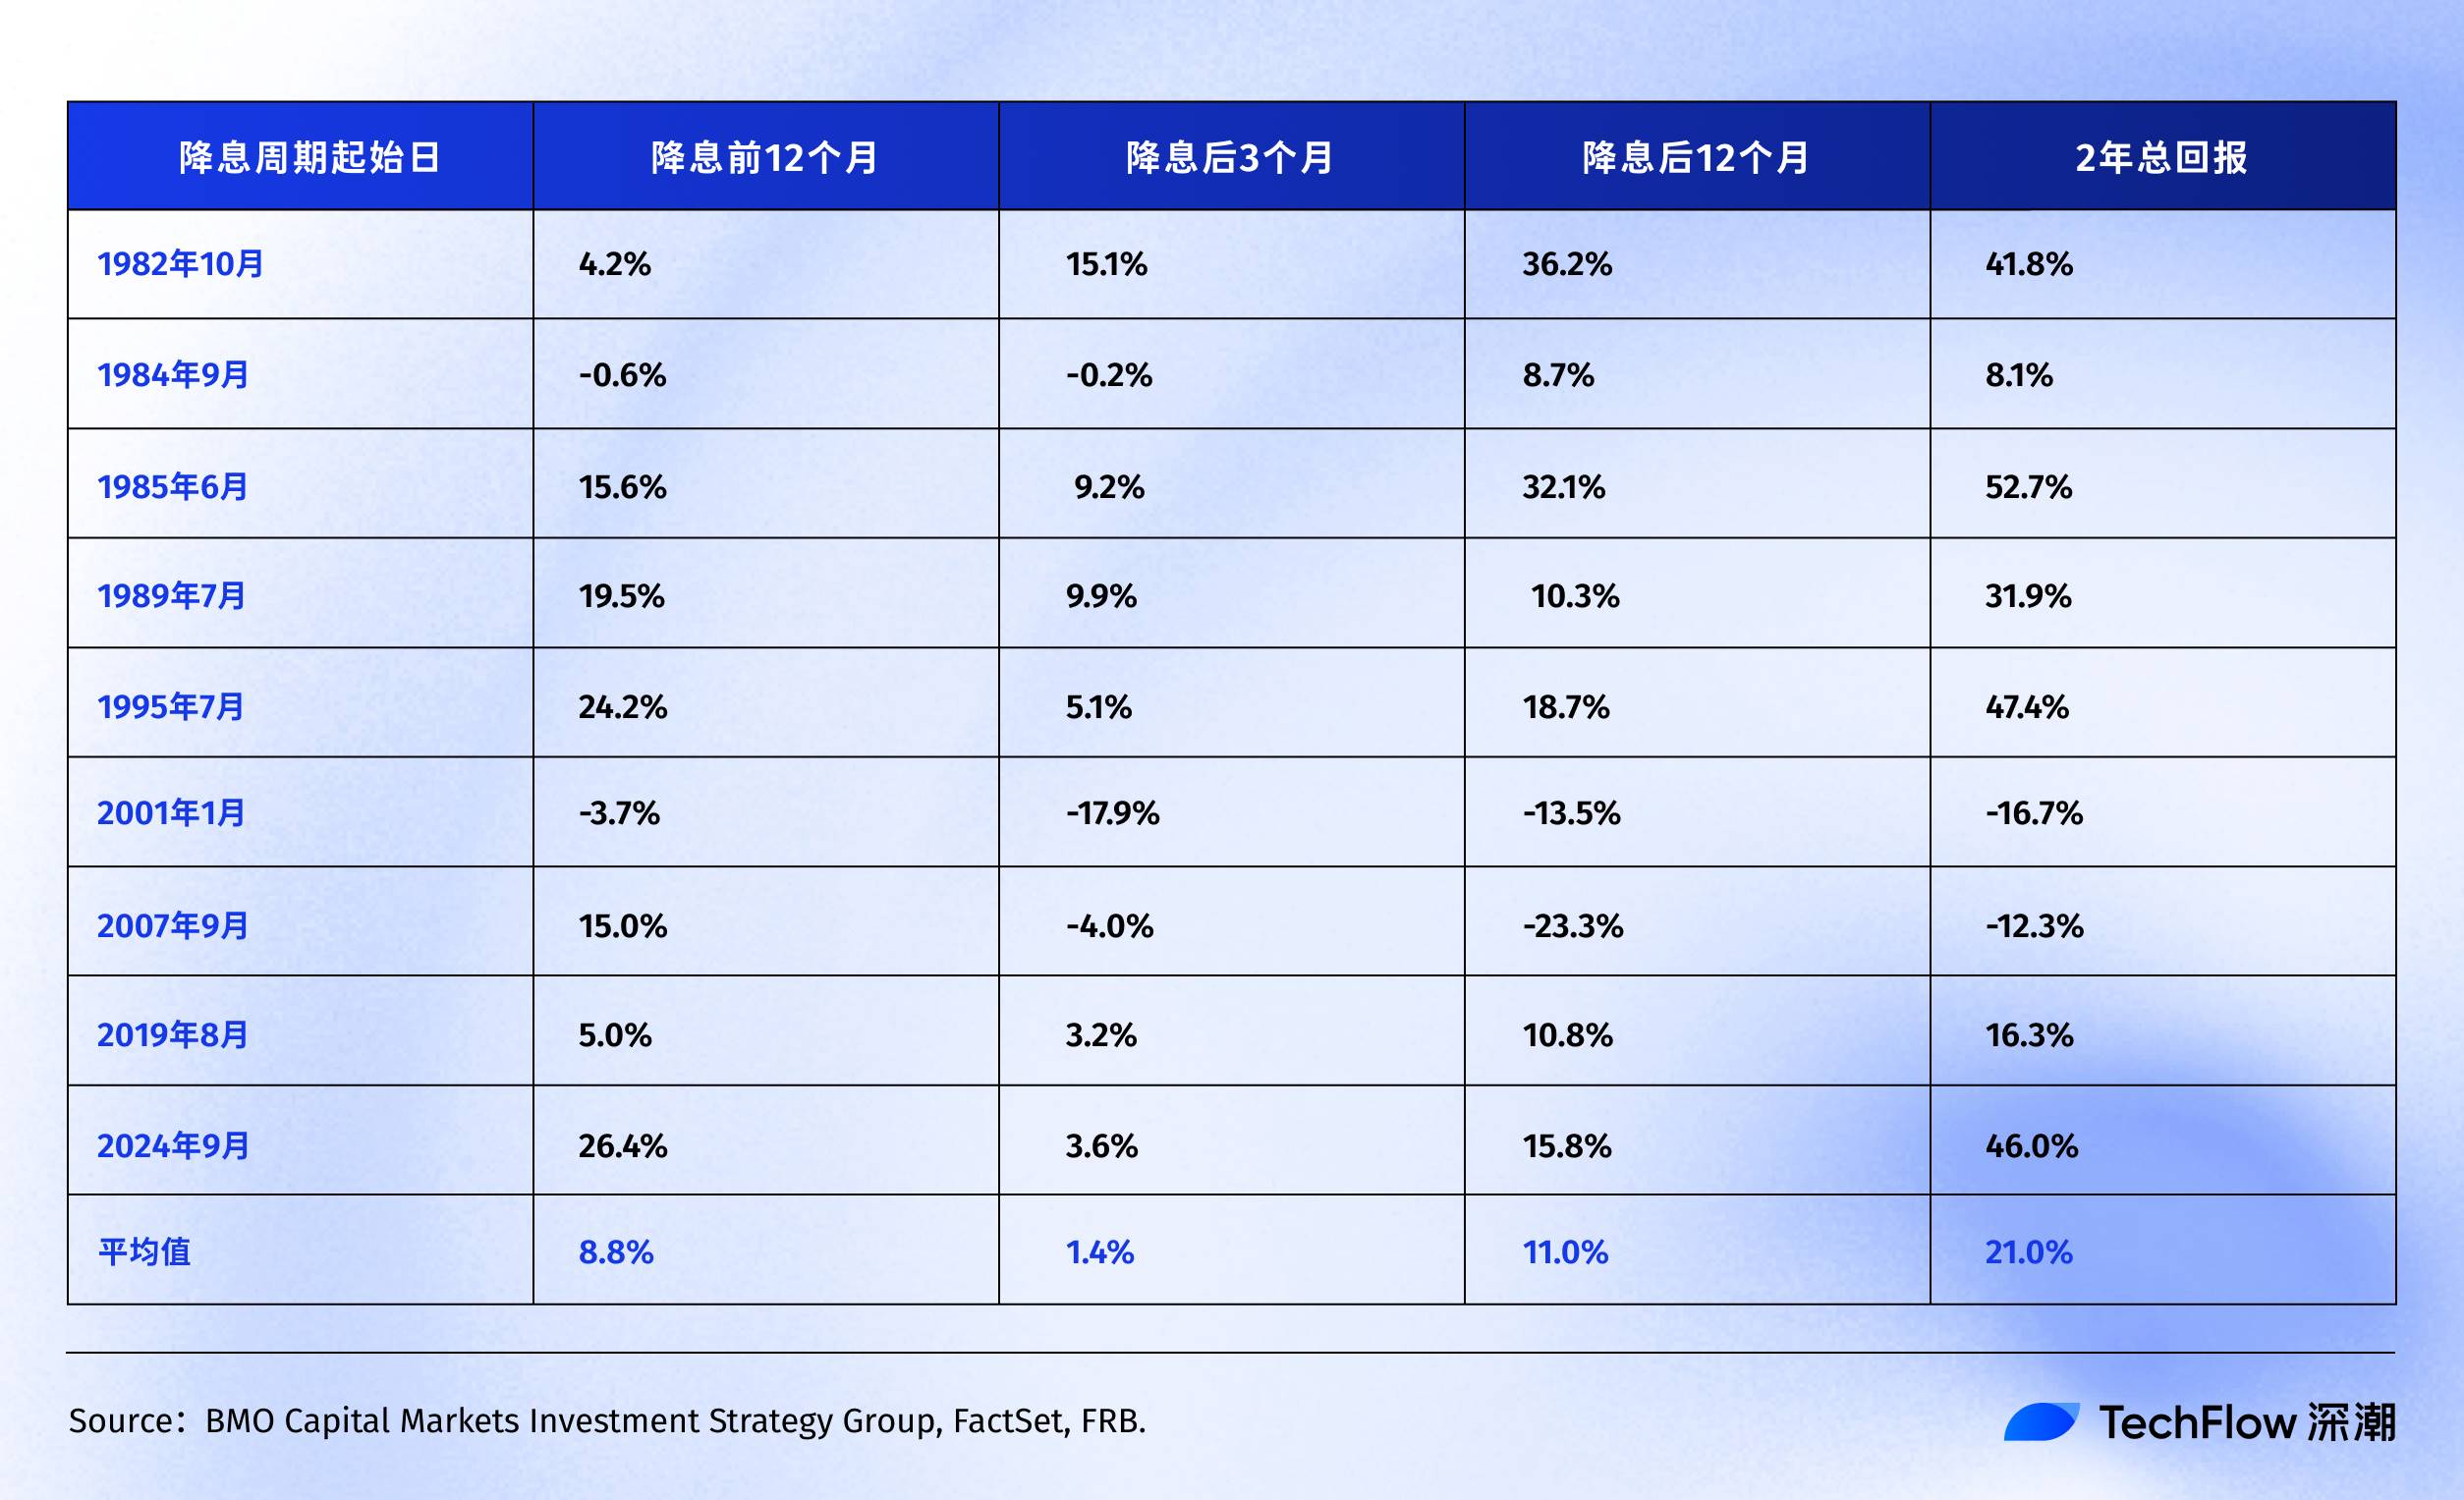
History shows that the S&P 500 index generally experiences positive returns within 12 to 24 months after the Federal Reserve's first or restarted rate cut.
Interestingly, if we exclude the tech bubble (2001) and the financial crisis (2007) as two "black swan" events, the average returns of the S&P 500 before and after rate cuts would be even higher.
This precisely illustrates the issue: the average return of the S&P 500 is merely a reference; the actual performance of the stock market after a rate cut entirely depends on the reasons for the cut. If it is a preventive rate cut like in 1995, the market performs well; if it is a rescue rate cut (like during the 2007 financial crisis), the stock market will also fall before rising, with a painful process.
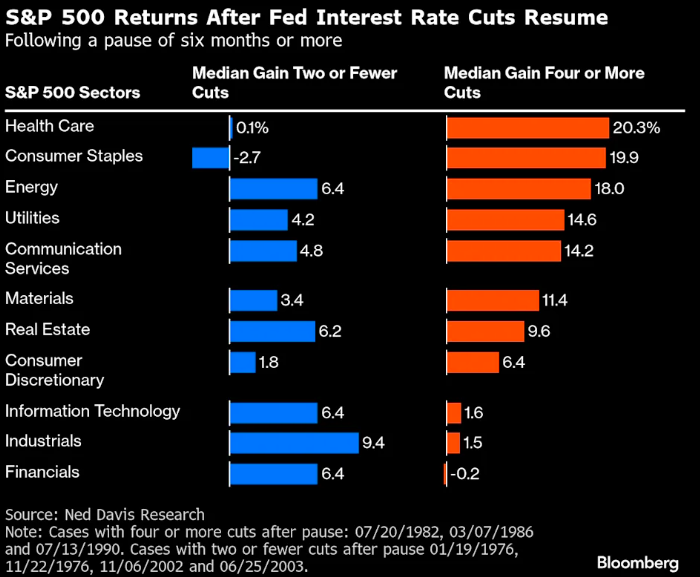
Looking further into individual stocks and sector structures, research from Ned Davis shows that defensive sectors in U.S. stocks tend to perform better during rate cuts:
In four cycles where the economy was relatively strong and the Federal Reserve only implemented one or two rate cuts, cyclical sectors like financials and industrials outperformed the market.
However, in cycles where the economy was relatively weak and required four or more significant rate cuts, investors leaned towards defensive sectors, with healthcare and consumer staples having the highest median return rates of 20.3% and 19.9%, respectively. In contrast, the much-anticipated tech stocks only had a meager 1.6%.
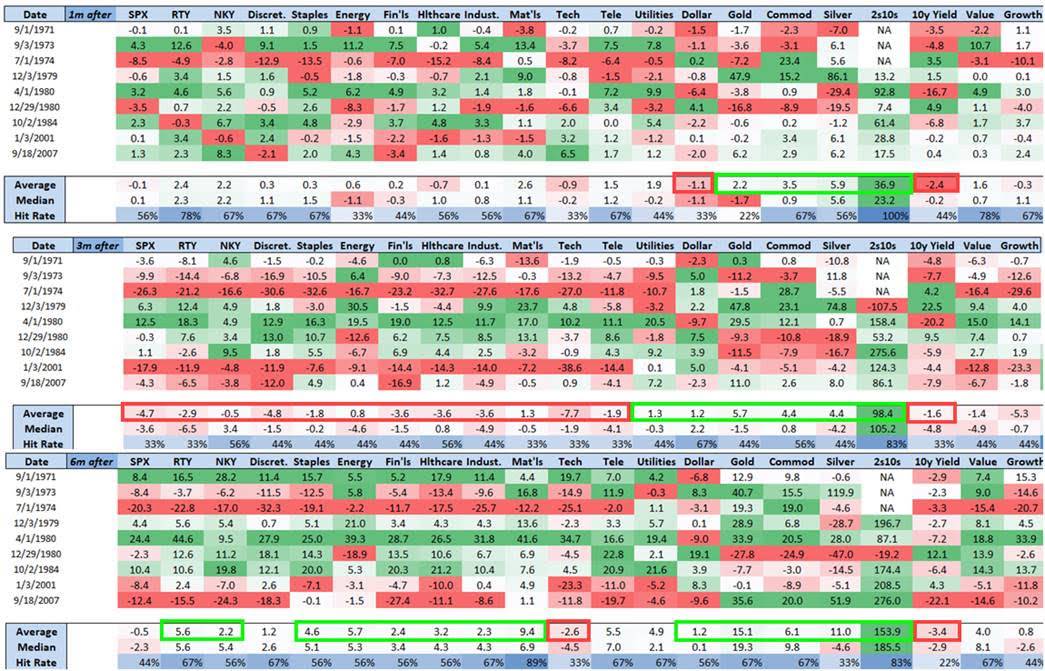
Additionally, according to Nomura's research, after a 50 basis point rate cut, the S&P 500 hardly changed in the following three months, while the small-cap Russell 2000 index averaged a 5.6% increase.
This also makes sense. Small companies are more sensitive to interest rates; their borrowing costs are higher, and the marginal improvement from a rate cut is greater. Moreover, small-cap stocks often represent "risk appetite," and when they start to outperform the market, it indicates a shift in market sentiment towards optimism.
Returning to the present, since the rate cut in September 2024:
S&P 500: Increased from 5,600 to 6,500 (+16%)
Nasdaq: Increased from 17,000 to 22,000 (+30%)
Comparing historical data, the current annualized increase of 16% has already surpassed the average of 11% following previous Federal Reserve rate cuts. More importantly, the signal that the Nasdaq's increase is nearly double that of the S&P 500 is significant. The S&P 500 was already at a historical high before the rate cut, which is relatively rare in past rate-cutting cycles.
Bond Market: The Most Stable but Also the Most Boring
Bonds are the most "honest" asset during a rate-cutting cycle. When the Federal Reserve cuts rates, bond yields fall, and bond prices rise, with almost no surprises.
According to Bondsavvy's analysis, the decline in the yield of 10-year U.S. Treasuries during different rate-cutting cycles has been quite stable:
2001-2003: Decreased by 129 basis points
2007-2008: Decreased by 170 basis points
2019-2020: Decreased by 261 basis points (due to the pandemic)
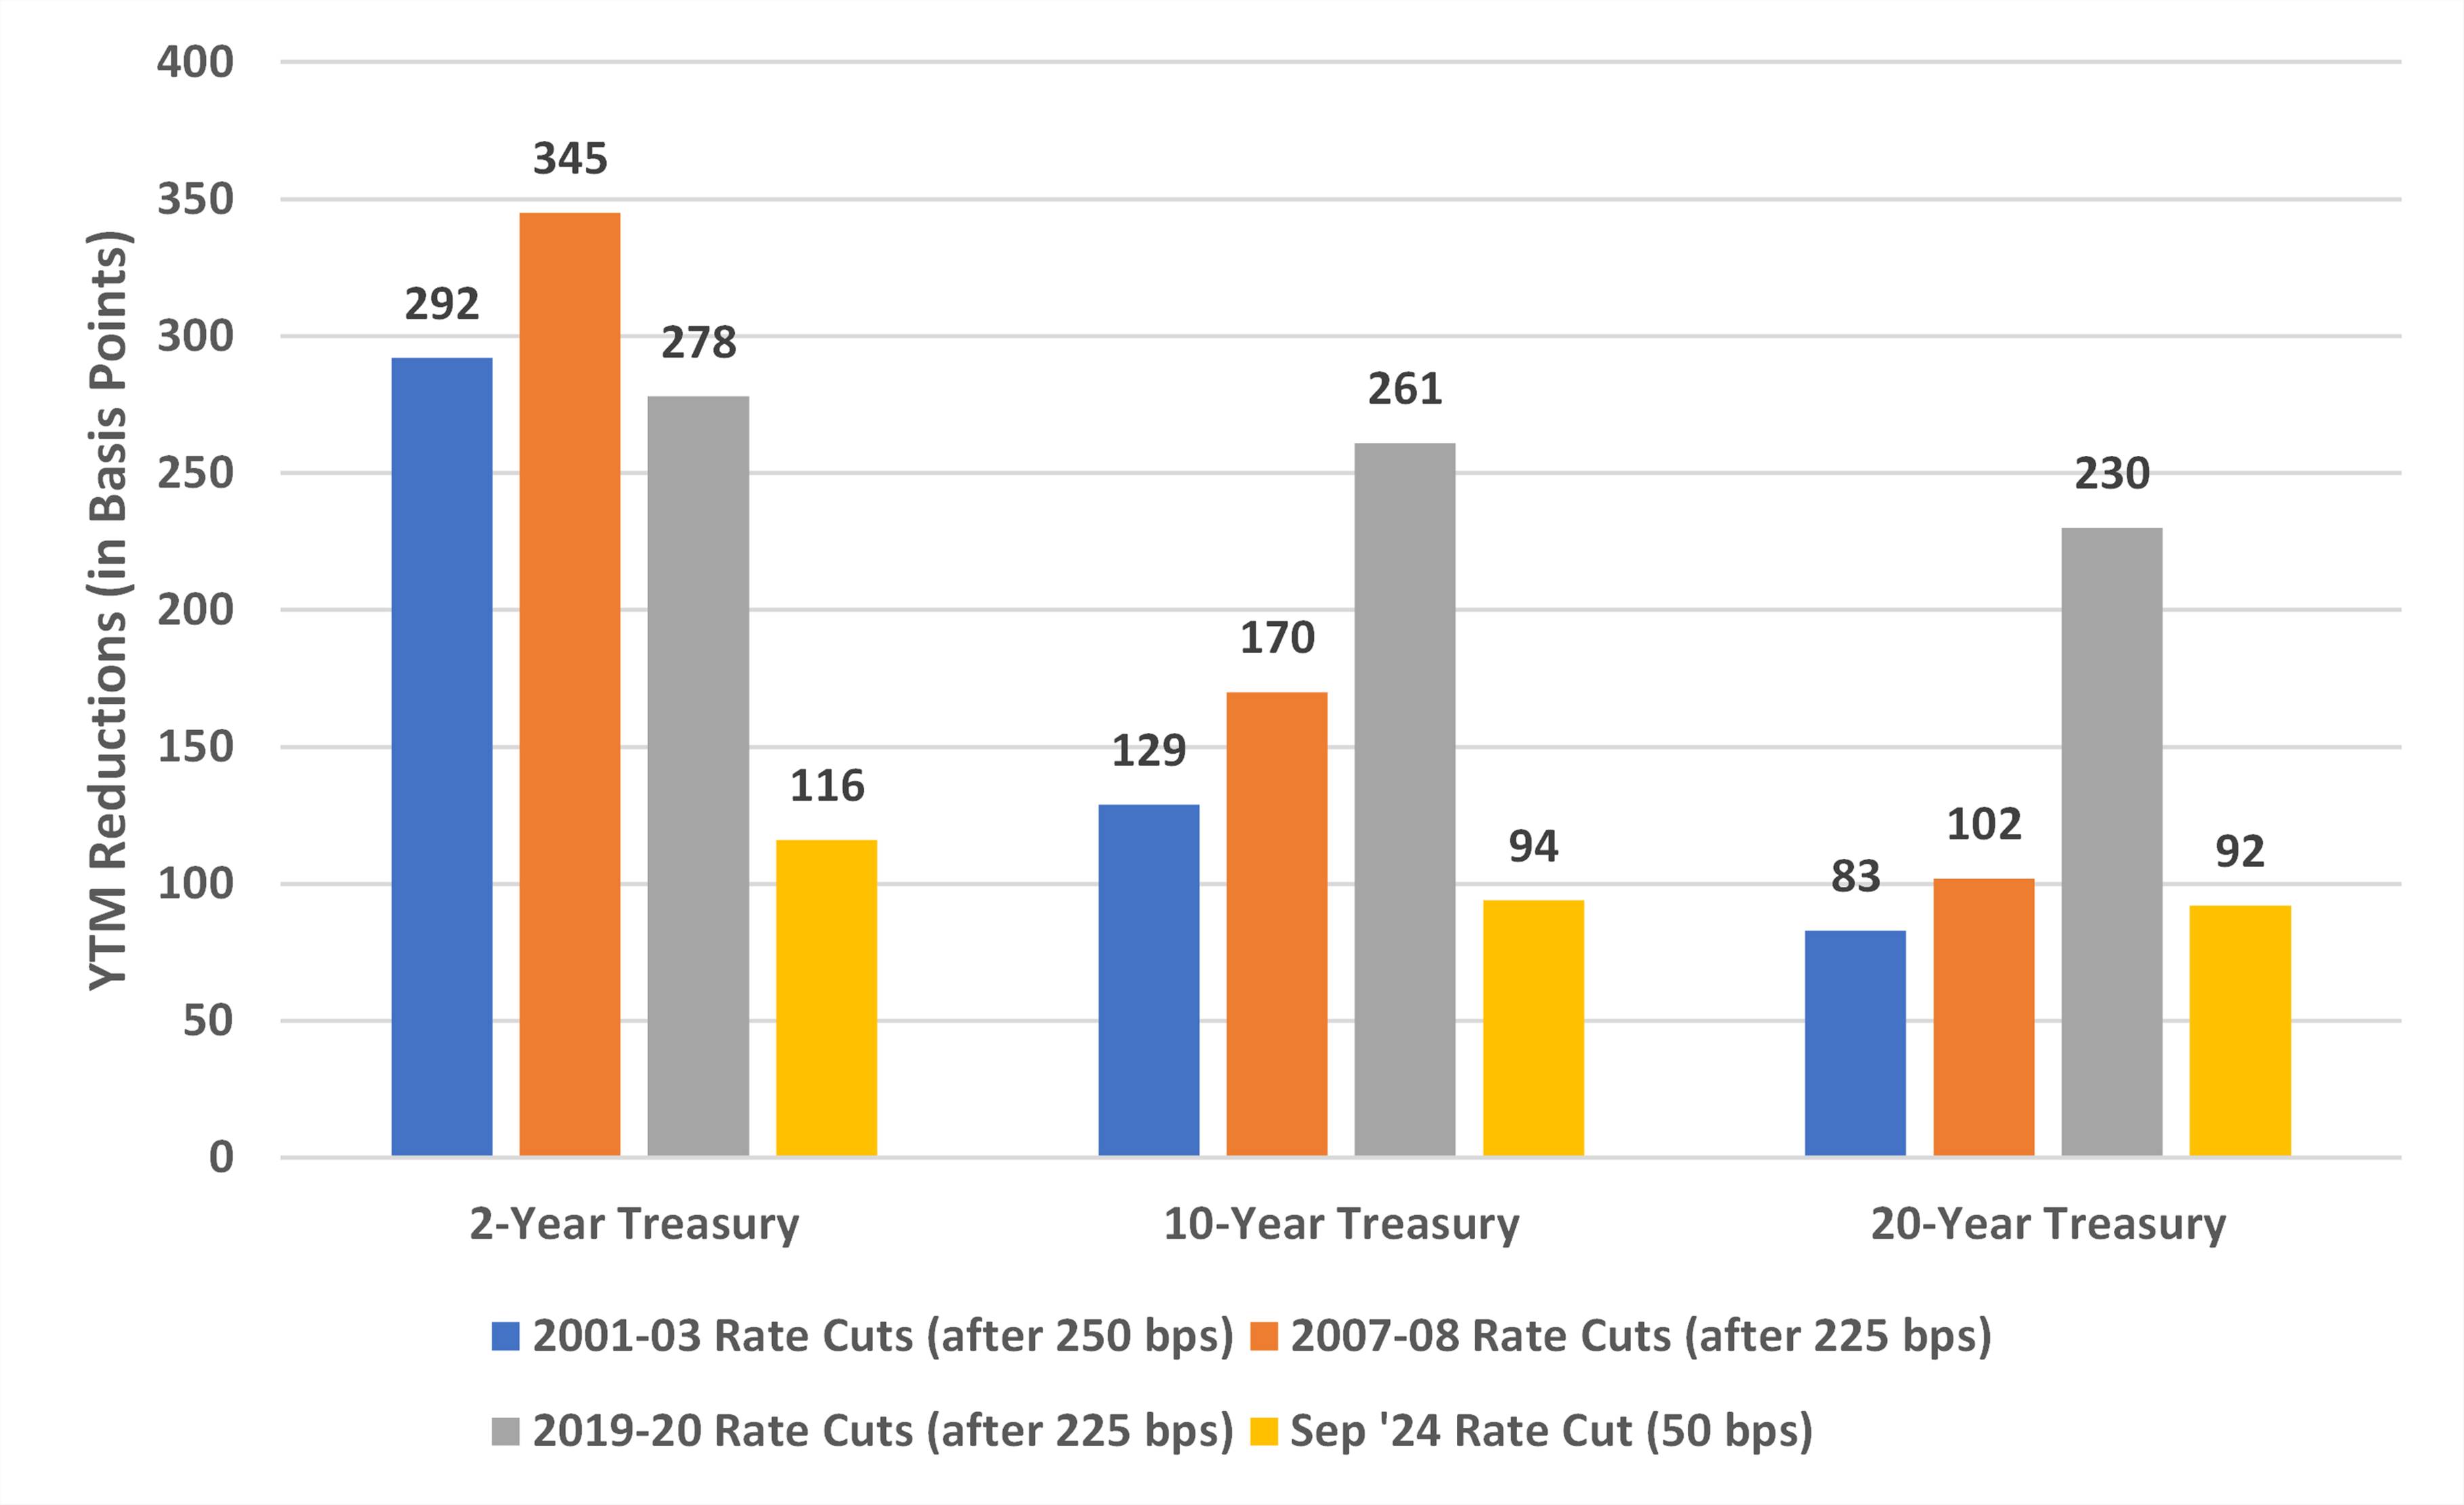
Why was the decline so significant in 2019-2020? Because the Federal Reserve not only cut rates to zero but also implemented "unlimited QE," effectively buying bonds directly and artificially lowering yields. Such unconventional operations are not typical in normal rate-cutting cycles.
- Progress of the Current Cycle

Based on the experiences of 2001 and 2007, the total decline in the yield of 10-year U.S. Treasuries should be between 130-170 basis points. It has already decreased by 94 basis points, leaving a potential range of 35-75 basis points.
In terms of price, if the yield on 10-year Treasuries drops another 50 basis points to around 3.5%, investors holding 10-year Treasuries could see about a 5% capital gain. This is decent for bond investors, but for crypto players accustomed to doubling their investments, it may seem low.
However, for investors in risk assets, bonds serve more as an "anchor" for funding costs. If we see Treasury yields plummet while corporate bond yields rise, it indicates that the market is seeking safe assets. In such cases, the likelihood of risk assets like Bitcoin being sold off increases.
Gold: A Stable Winner in Rate-Cutting Cycles
Gold may be the asset that understands the Federal Reserve the best. Over the past few decades, gold has rarely disappointed during rate-cutting cycles.
According to Auronum's research, the performance of gold during the last three rate-cutting cycles was as follows:
2001 rate-cutting cycle: Increased by 31% within 24 months
2007 rate-cutting cycle: Increased by 39% within 24 months
2019 rate-cutting cycle: Increased by 26% within 24 months
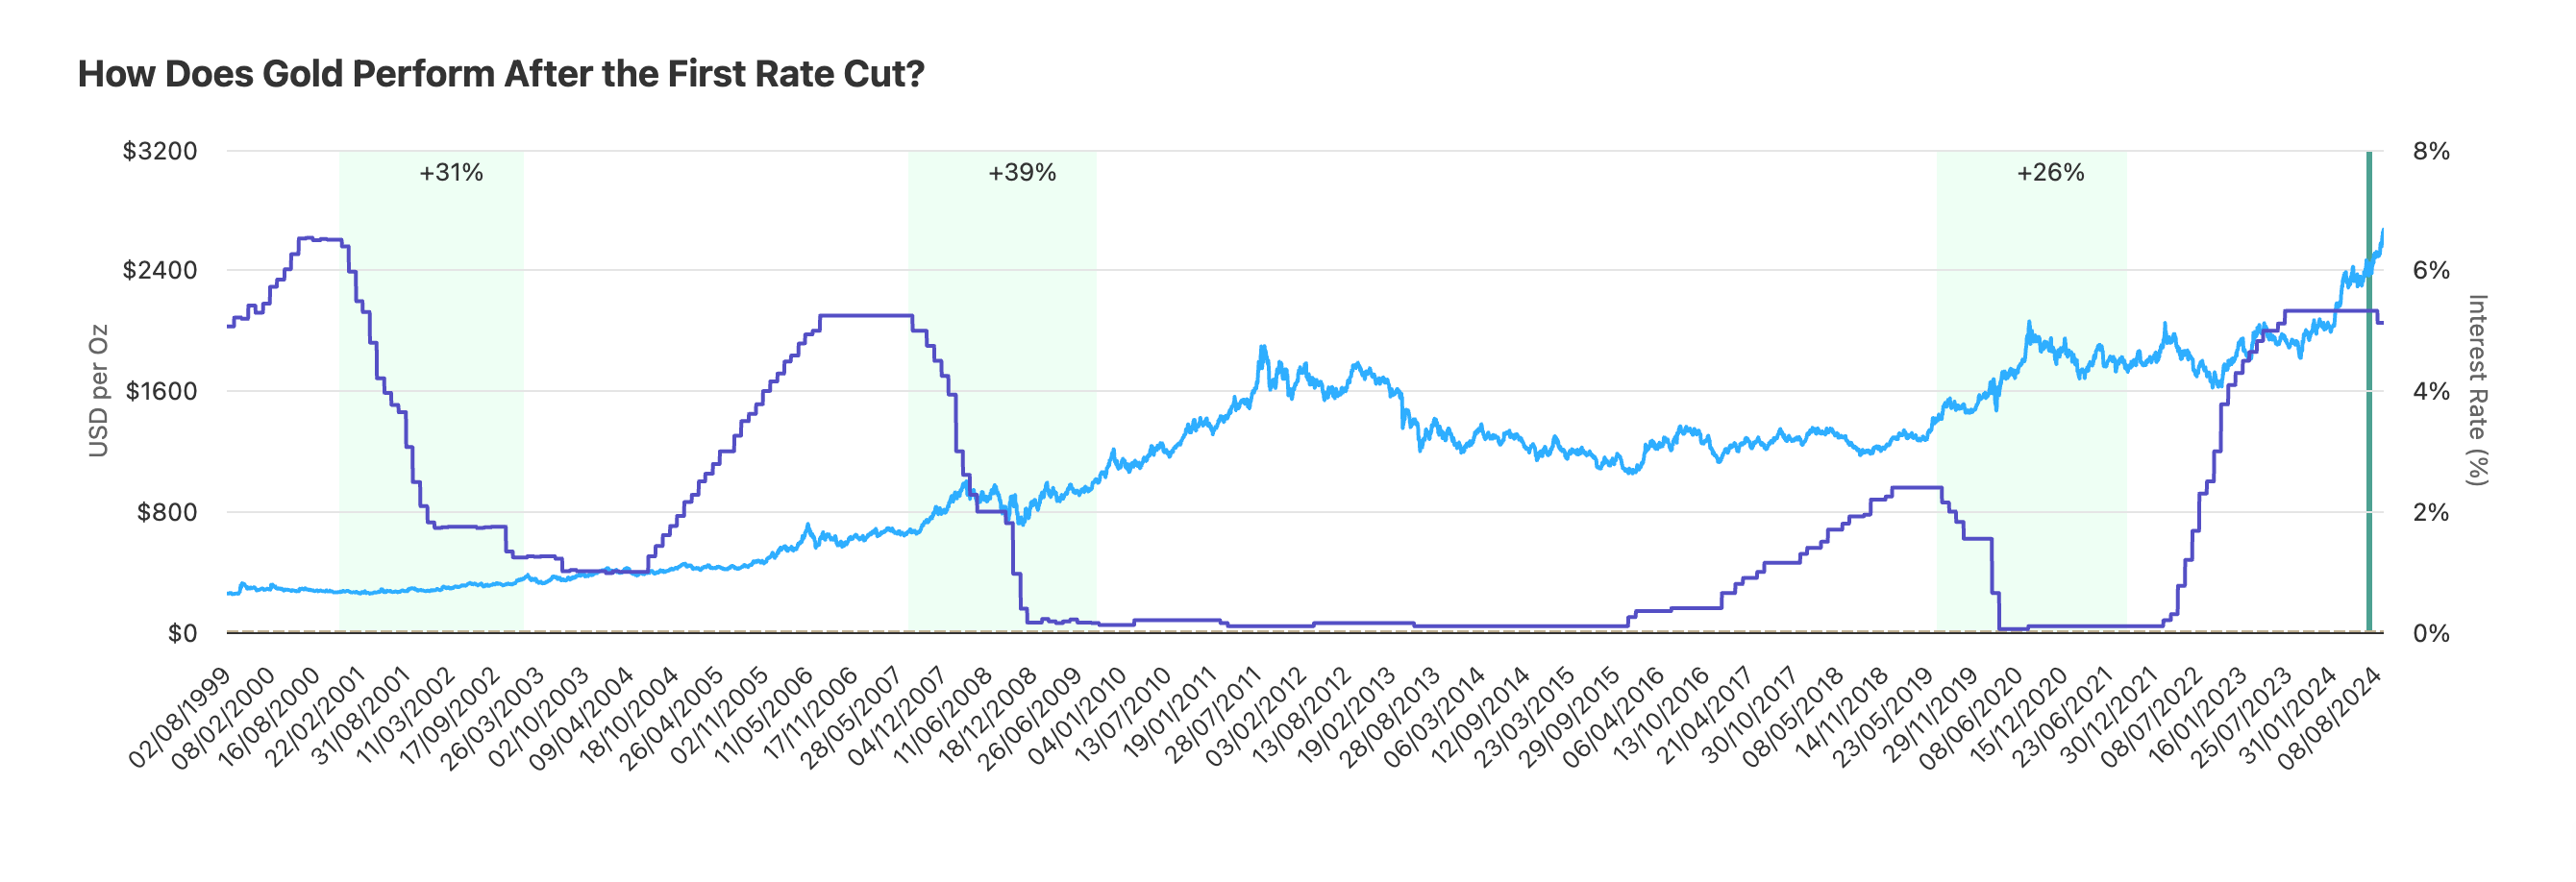
On average, gold has increased by about 32% in the two years following a rate cut. This return rate is not as stimulating as Bitcoin's, but it is stable. All three instances yielded positive returns, without exception.
- Current Cycle: Outperforming Expectations
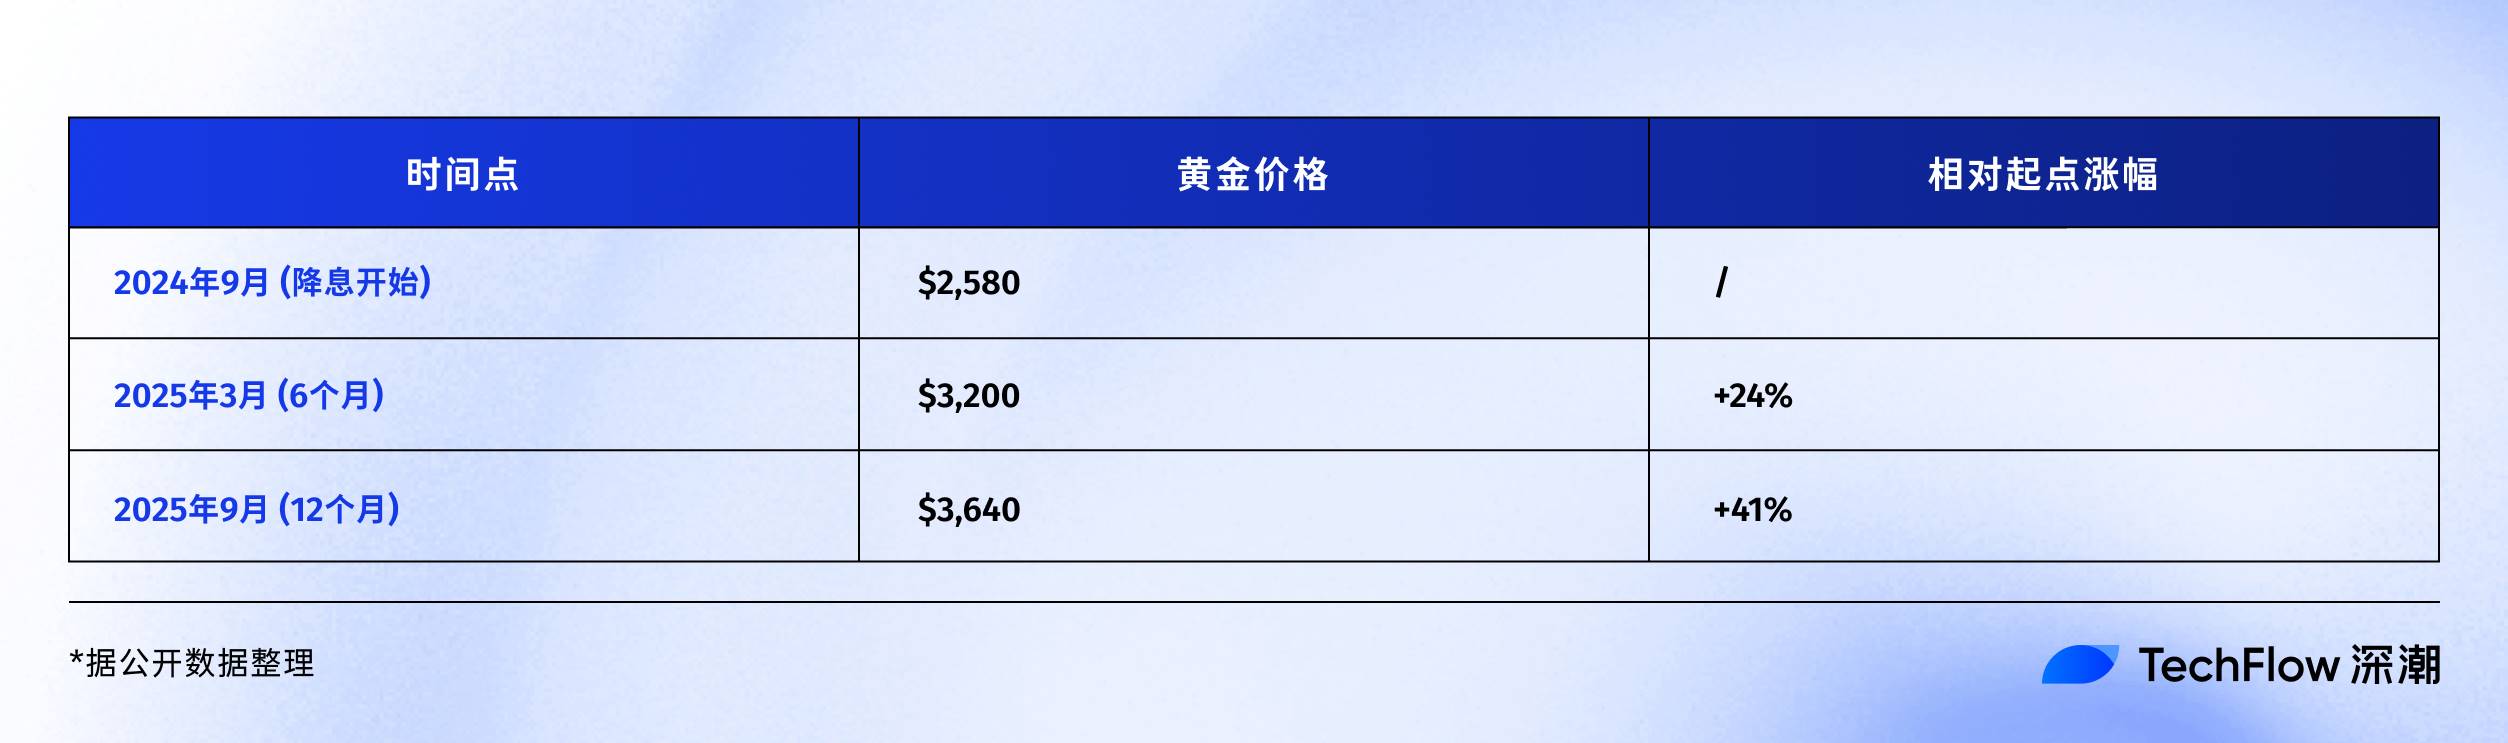
With a 41% increase in one year, it has already surpassed the performance of any previous rate-cutting cycle during the same period. Why is it so strong?
First, central bank buying. In 2024, global central banks purchased over 1,000 tons of gold, setting a record. Countries like China, Russia, and India are increasing their holdings. This is because they do not want to keep all their foreign exchange reserves in U.S. dollars, a process known as "de-dollarization."
Second, geopolitical risks. The Ukraine crisis and conflicts in the Middle East have made certain regions of the world increasingly unstable, and the rise in gold prices increasingly reflects a "war premium."
Third, expectations to offset inflation. Currently, U.S. government debt exceeds 120% of GDP, with an annual fiscal deficit of $2 trillion. Where does this money come from? It can only be printed. Gold is a traditional tool for hedging against currency devaluation. When investors worry about the purchasing power of the dollar, gold rises. This logic also applies to Bitcoin, but the market still trusts gold more.
Comparing the performance over the past year:
Gold: +41% ($2,580 → $3,640)
Bitcoin: +92% ($60,000 → $115,000)
On the surface, Bitcoin seems to have won decisively. However, considering the market capitalization difference, with gold at $15 trillion and Bitcoin at $2.3 trillion, the actual amount of capital absorbed by gold's 41% increase is larger. Historically, when gold's increase during a rate-cutting cycle exceeds 35%, it usually enters a consolidation phase. The reason is simple—profit-taking needs to be digested.
Final Thoughts
In September 2025, we find ourselves at an interesting juncture.
The rate-cutting cycle has been ongoing for a year, neither fast nor slow. Bitcoin is at $115,000, neither high nor low. Market sentiment is greedy but not crazy, cautious but not panicked. This intermediate state is the hardest to judge and tests patience the most.
Historical experience tells us that the second half of a rate-cutting cycle is often more exciting. After the last two rate cuts in 1995, the U.S. stock market entered the internet bull market. Six months after the rate cuts in 2020, Bitcoin truly took off.
If history rhymes, the next 6-12 months may be a critical window.
But history also tells us that there are always surprises. Perhaps this time the surprise is an explosion of productivity brought by AI, leading to the complete disappearance of inflation, allowing the Federal Reserve to cut rates indefinitely. Or perhaps the surprise is an escalation of geopolitical conflicts or a new financial crisis.
The only change we can be certain of is change itself.
The dollar-dominated monetary system is changing, the way value is stored is changing, and the speed of wealth transfer is changing.
Cryptocurrency represents not just an investment category but a small reflection of this changing era. So rather than obsessing over whether Bitcoin will rise to $150,000 or $200,000, it is better to ask yourself:
In the context of this change, am I ready?
If your answer is yes, then congratulations. The rate-cutting cycle is just the beginning; the real drama is yet to come.
免责声明:本文章仅代表作者个人观点,不代表本平台的立场和观点。本文章仅供信息分享,不构成对任何人的任何投资建议。用户与作者之间的任何争议,与本平台无关。如网页中刊载的文章或图片涉及侵权,请提供相关的权利证明和身份证明发送邮件到support@aicoin.com,本平台相关工作人员将会进行核查。


