Summary
- The on-chain ecosystem is accelerating its differentiation, with Solana maintaining high-frequency dominance, while Ethereum consolidates its high-value position. The structure of capital flow is evolving towards "the strong get stronger," with emerging public chains performing well, while some sidechains and L2s face pressure from capital withdrawal.
- Ethereum continues to hold a core position in public chains with over $2 billion in net capital inflow and record highs in both price and institutional allocation. Emerging public chains are rising in capital attraction, while sidechains like Polygon are experiencing significant capital outflows, reflecting a "the strong get stronger" dynamic.
- After reaching a peak of $124,000, Bitcoin's capital inflow has slowed, but selling pressure is mild, and the cost basis remains solid, preventing realized losses from rising. Overall, this indicates that the current pullback is a phase correction rather than a trend reversal.
- Aave continues to dominate the decentralized lending space and has entered the institutional-grade RWA collateral lending market through the launch of the Horizon platform, further strengthening its core position in the integration of DeFi and traditional finance.
- BIO is rapidly rising in the DeSci track thanks to its V2 upgrade and ecosystem expansion, with both token market cap and staking volume soaring, and on-chain capital accelerating its inflow, showcasing its potential to lead decentralized research.
On-Chain Data Summary
Overview of On-Chain Activity and Capital Flow
In addition to analyzing overall on-chain capital flow, we have selected several key on-chain activity indicators to assess the real usage heat and activity levels of various blockchain ecosystems. These indicators include daily transaction volume, daily gas fees, daily active addresses, and net flow of cross-chain bridges, covering multiple dimensions such as user behavior, network usage intensity, and asset liquidity. Compared to merely observing capital inflows and outflows, these on-chain native data can more comprehensively reflect the fundamental changes in public chain ecosystems, helping to determine whether capital flows are accompanied by actual usage demand and user growth, thus identifying networks with sustainable development potential.
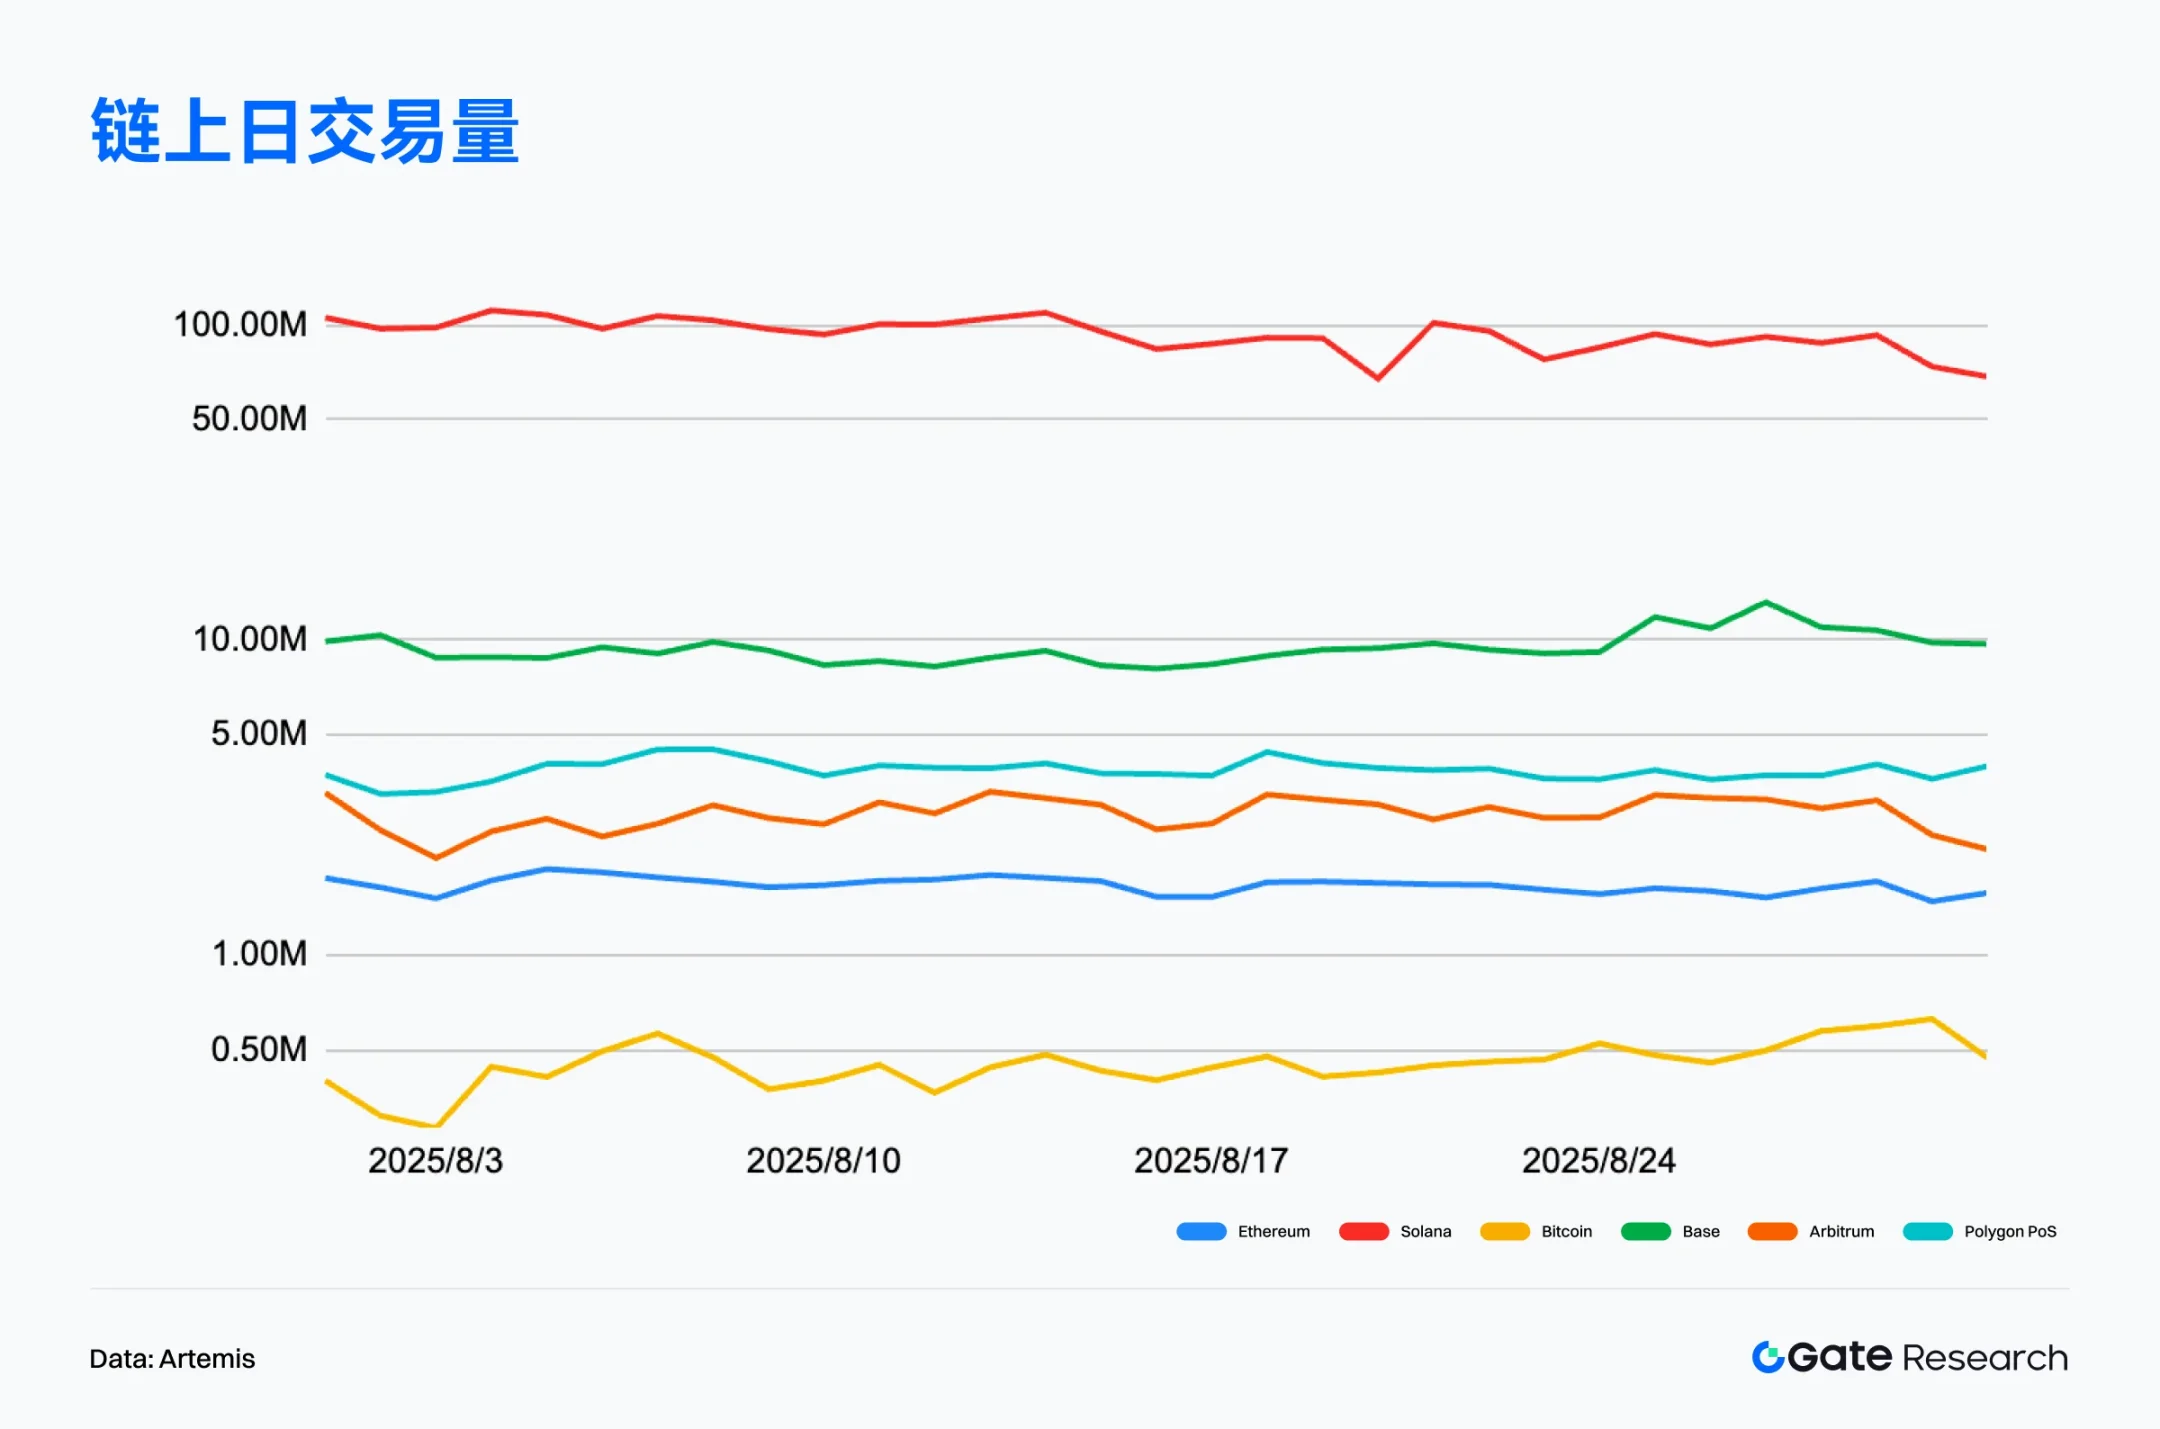
Transaction Volume Analysis: Ethereum Continues to Hit New Highs, Solana Remains at the Top
According to Artemis data, as of August 31, 2025, Solana continues to lead mainstream public chains with a monthly transaction volume exceeding 29 billion, maintaining a daily average transaction volume between 9 million and 10 million, demonstrating strong on-chain interaction stickiness and high-frequency application structure. Despite slight fluctuations at the end of the month, overall activity remains far superior to other public chains, reflecting its ecological vitality and efficient architecture.
Ethereum's on-chain transaction volume has hit new highs for two consecutive months, surpassing 51.77 million transactions, marking a nearly four-year record, indicating that mainnet activity remains strong despite the diversion to Layer 2. Although the value of individual transactions is high and gas costs remain limiting factors, the overall transaction structure is robust, with the interaction effect between the mainnet and Layer 2 continuing to strengthen.
Additionally, according to DefiLlama data, Ethereum's on-chain DEX monthly transaction volume reached $140.1 billion in August 2025, setting a historical record; the current TVL is $92.58 billion, still about 17% lower than the peak in 2021. Transaction volume and user activity are climbing in tandem, indicating a significant increase in capital utilization, with user behavior shifting from static locking to more frequent trading and liquidity use, showing a trend structure of "active trading surpassing TVL recovery."
Overall, Solana continues to demonstrate strong performance with its high-frequency interaction and high stickiness structure, maintaining dominance in the on-chain transaction landscape; Base is steadily establishing itself as a key player in the Layer 2 camp; Ethereum showcases resilience and value-carrying capacity under the dual model of continuous highs on the mainnet and progress in Layer 2. The on-chain transaction ecosystem is accelerating towards a structural differentiation trend of "high-frequency public chains" and "low-frequency high-value chains."
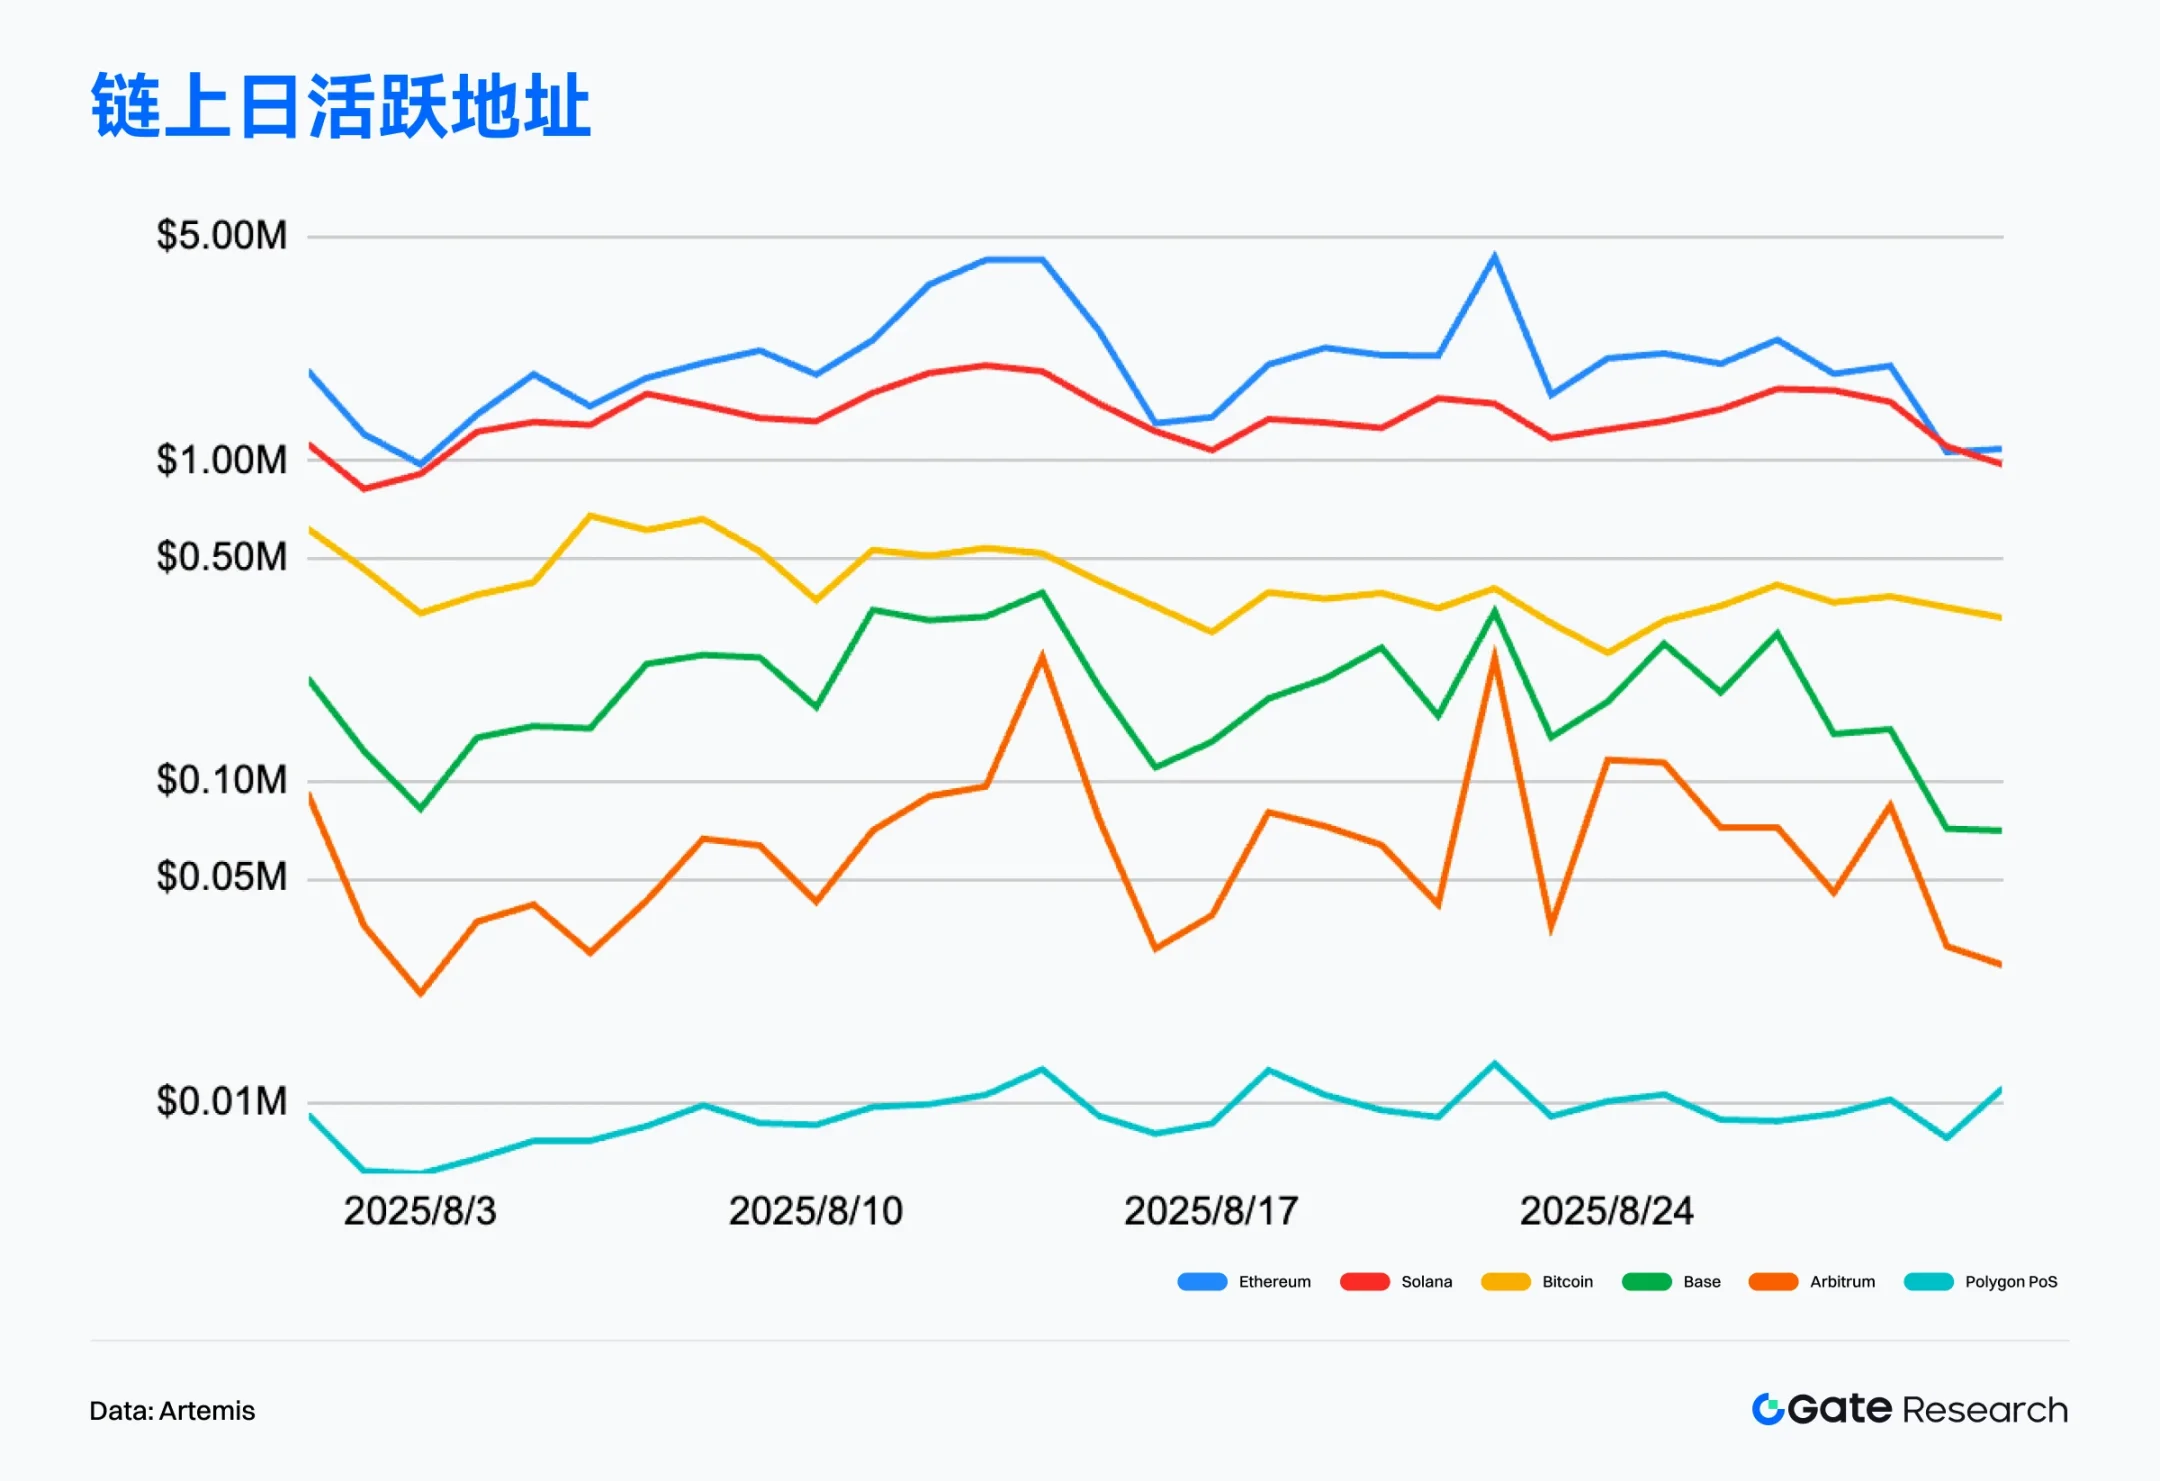
Active Address Analysis: Solana Leads, Ethereum Hits New Highs
According to Artemis data, as of August 31, 2025, the daily active addresses on Ethereum's mainnet averaged about 543,000, showing a steady upward trend, with the total monthly active addresses surpassing 16 million, setting a new historical high, indicating that its user base is steadily expanding.
Solana continues to maintain an absolute lead in active addresses, with an average of 3.587 million daily, demonstrating strong user stickiness and high-frequency usage scenarios; Base ranks second with 1.206 million, reflecting significant results in its native ecosystem construction and application attraction.
Overall, Solana maintains an absolute lead in active addresses, while Base rapidly rises to show latecomer advantages, and Ethereum, with its "mainnet + L2" composite structure, forms a more complete ecological interaction system. The on-chain user structure has clearly differentiated into "high-frequency user chains" and "value-carrying chains," with ecological positioning becoming increasingly clear.
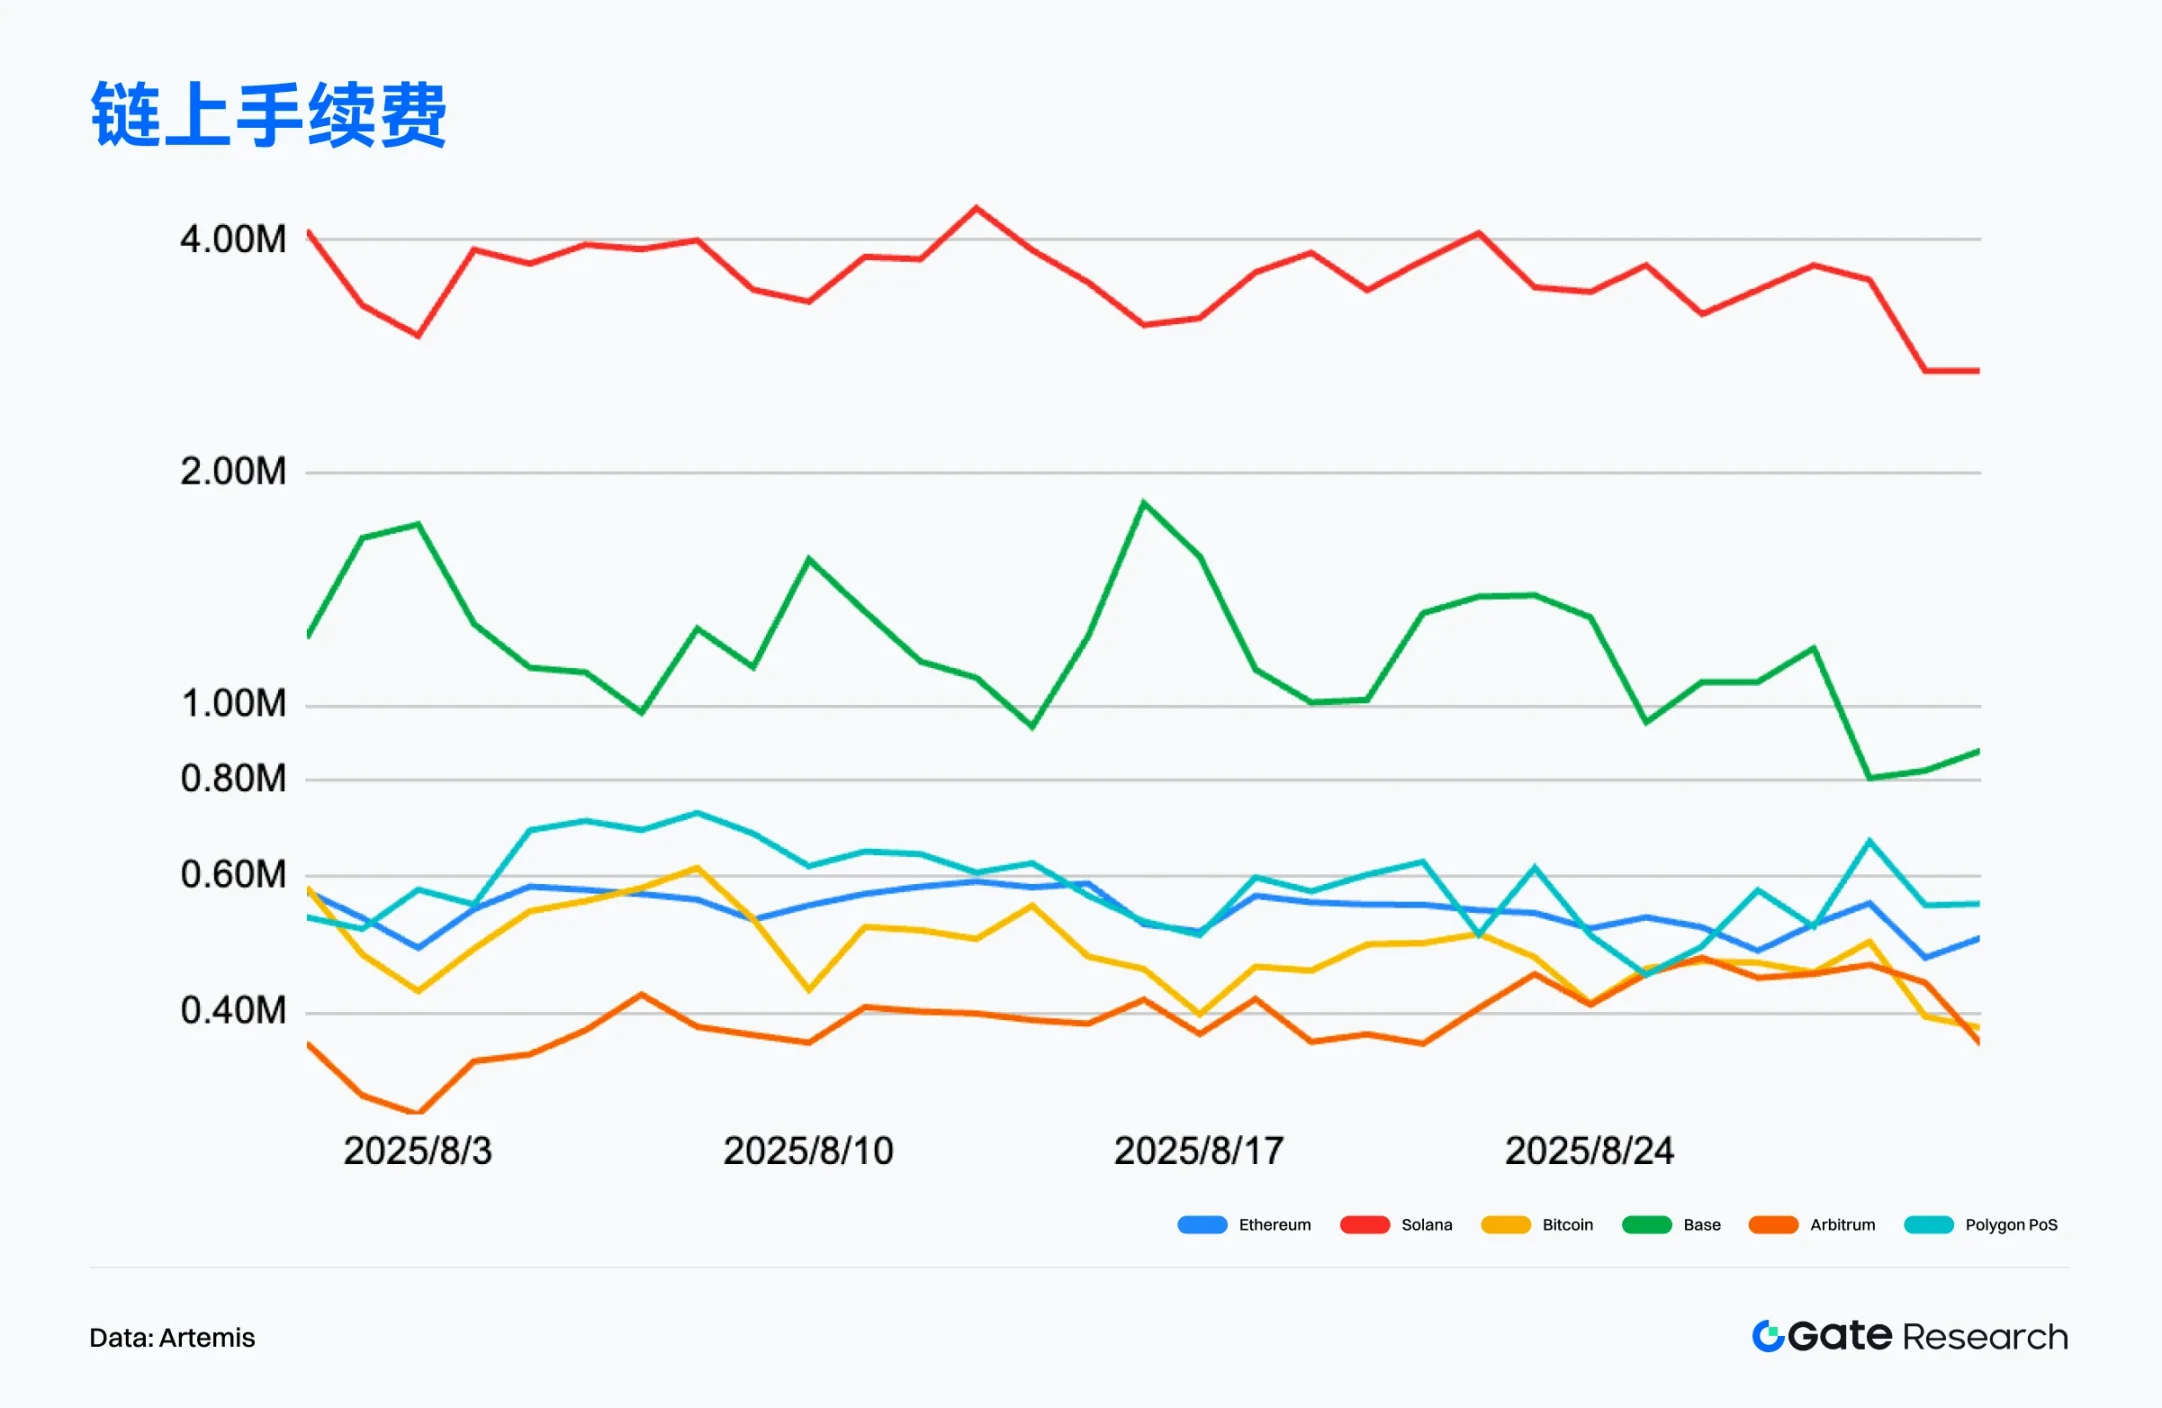
On-Chain Fee Revenue Analysis: Ethereum Continues to Dominate High-Value Scenarios, Solana Performs Steadily
According to Artemis data, as of August 31, 2025, Ethereum's total on-chain fee revenue was approximately $65 million. Although it slightly declined from the previous month, it still far outpaces other public chains. A peak of nearly $5 million was recorded in the middle of the month, indicating that the mainnet's trading activity remains high, driven by DEX activity and new project deployments. Although Layer 2 networks handle a significant amount of daily trading volume, the high-value interaction demand on Ethereum's mainnet continues to be the main support for its fee revenue.
Solana has shown remarkable stability, with fee trends remaining steady throughout the month, with daily revenue generally maintained in the range of $1 million to $1.5 million, overall performing second only to Ethereum. Solana's high-frequency micro-interaction mechanism results in extremely low unit fees, but the large number of transactions still supports a considerable revenue volume, highlighting that its commercialization foundation in high-frequency scenarios is gradually maturing.
Overall, Ethereum still firmly occupies the dominant position in on-chain fee revenue, with Solana performing steadily and driven by high frequency, while Base steadily rises with its native ecosystem. The differentiation trend in fee revenue is becoming increasingly evident, corresponding to the different positioning and development paths of each chain between "value-type interactions" and "frequency-type interactions."
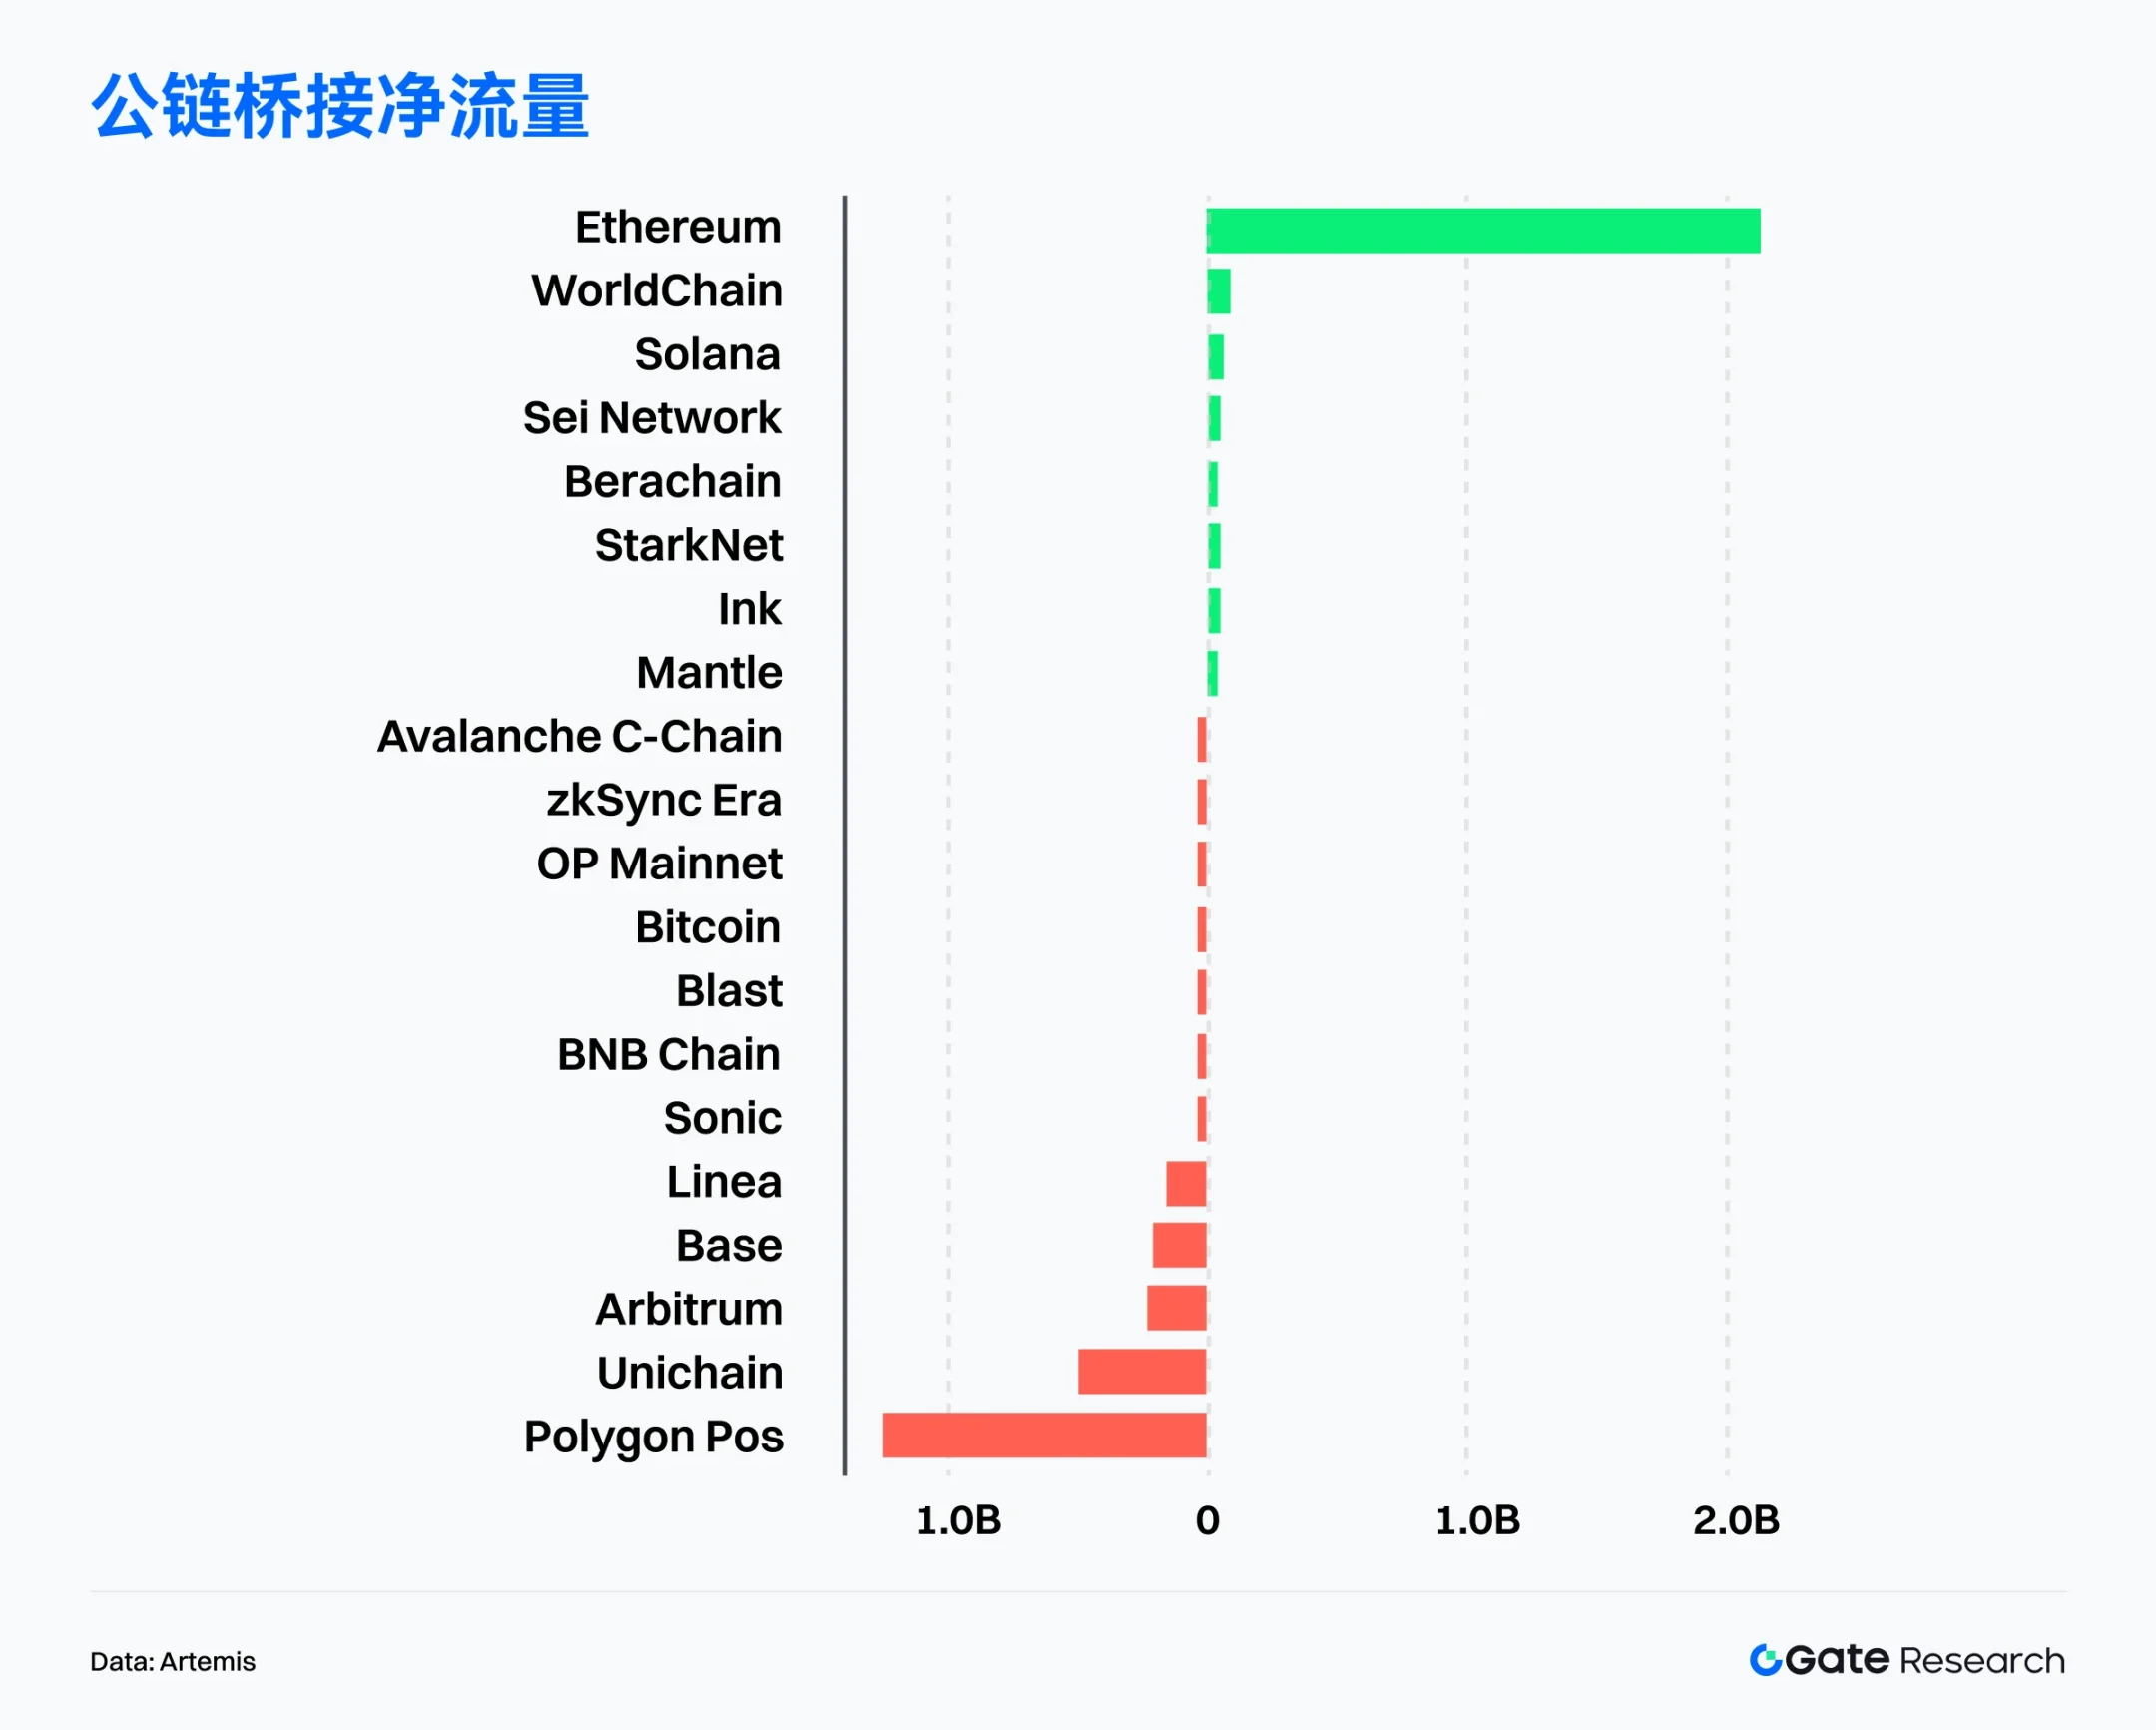
Public Chain Capital Flow Analysis: Ethereum Dominates, Polygon Sees Significant Outflows
According to Artemis data, Ethereum recorded over $2 billion in net inflow, continuing to lead public chain capital flows, demonstrating its overwhelming advantage in institutional allocation and ecological depth. Driven by the Federal Reserve's "dovish" signals and institutional buying, the price of ETH broke through the historical high of $4,956, with a market cap exceeding $580 billion and ETF management scale surpassing $30.5 billion, with a net inflow of nearly $2.8 billion in a single month. Institutional holdings have also risen, with BitMine acquiring 690,000 ETH in a month, accounting for nearly 1% of the global supply, becoming the largest publicly held company, further highlighting ETH's dual value of "capital appreciation + cash flow."
Meanwhile, on-chain applications continue to expand, with Robinhood and Ondo Finance promoting the implementation of stock and stock tokenization trading, and USDC monthly transfer amounts reaching $748.3 billion. The TVL of the DeFi protocol Pendle also surpassed $10 billion, indicating that Ethereum's core position in compliant finance and DeFi infrastructure continues to strengthen.
Aside from Ethereum, WorldChain and Solana recorded net inflows of $98.8 million and $72.7 million, respectively, showing that both emerging and mature public chains have capital attraction. In contrast, several mainstream public chains experienced significant capital outflows, with Polygon PoS seeing a net outflow of over $1 billion in a single month, while Unichain and Arbitrum recorded net outflows of $490 million and $230 million, respectively, and Base also saw an outflow of $190 million, reflecting a market rebalancing of valuations and heat for some L2s and sidechains.
Overall, the capital flow pattern is trending towards "the strong get stronger," with Ethereum's leading position in capital absorption, institutional deployment, and ecological construction further amplified. Emerging public chains like WorldChain and Solana continue to attract capital through ecological overlay effects, while some early popular L2s and sidechains face pressure from capital withdrawal, with market hotspots switching and liquidity games becoming increasingly frequent.
Bitcoin Key Indicator Analysis
After Bitcoin reached a historical high of $124,000 in August, upward momentum has significantly slowed, with prices entering a phase of high-level fluctuations and corrections. As a core anchor asset in the market, its on-chain structural indicators are also releasing multiple signals, revealing deep adjustments in capital behavior and market structure. As capital inflow slows and demand momentum weakens, the distribution of on-chain supply and the status of investor holdings are gradually becoming key criteria for judging future trends.
To systematically assess the support logic and risk evolution in the current high-level range, this article will focus on three core on-chain indicators: capital inflow and outflow with realized market cap (Realized Cap & Net Position Change), profit-taking pressure and market absorption capacity (Volatility Adjusted Realized Profit/Loss), and cost basis and risk pressure levels (Cost Basis Distribution & Relative Unrealized Loss). Through these cross-observations, a clearer picture of the market's chip distribution, capital absorption capacity, and potential risks at high levels can be drawn, providing a forward-looking on-chain perspective for analyzing subsequent market trends.
BTC Capital Inflow Slows, High-Level Demand Momentum Insufficient
According to Glassnode data, after Bitcoin broke through the historical high of $124,000, its realized market cap has continued to rise, but the speed of capital inflow has significantly slowed. Compared to the situations in March and December 2024 when historical highs were breached, capital net inflow significantly expanded at that time, while the peak of green capital inflow in this round is far below previous levels. This indicates that even with new price highs, there has not been a substantial influx of new capital into the market, and investors' willingness to enter at high levels has clearly weakened, overall reflecting insufficient demand-side momentum and relatively weak capital support.
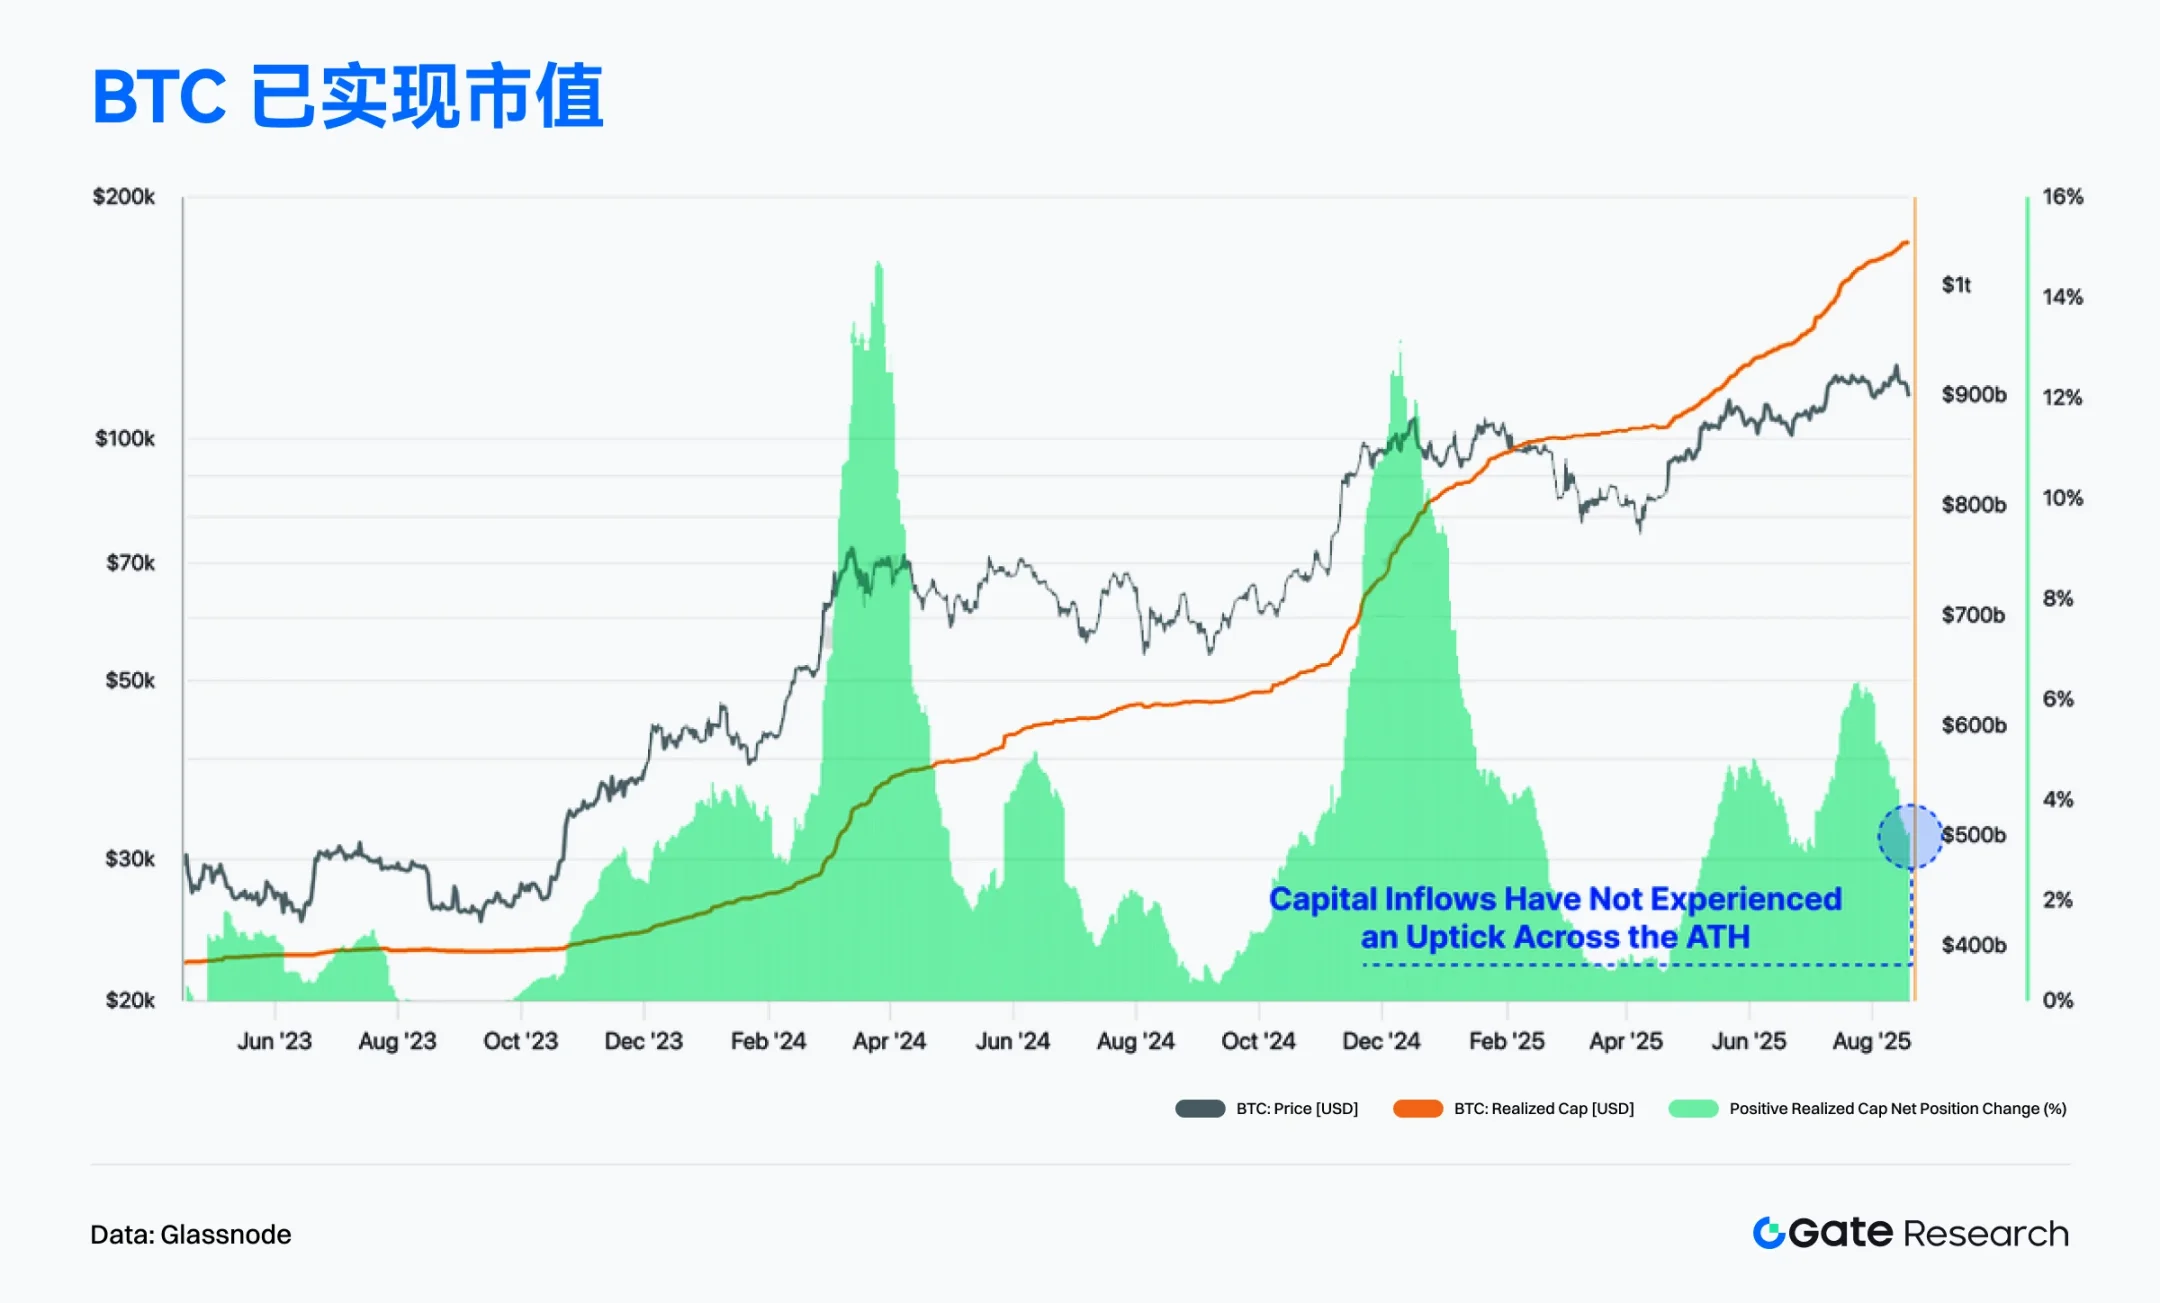
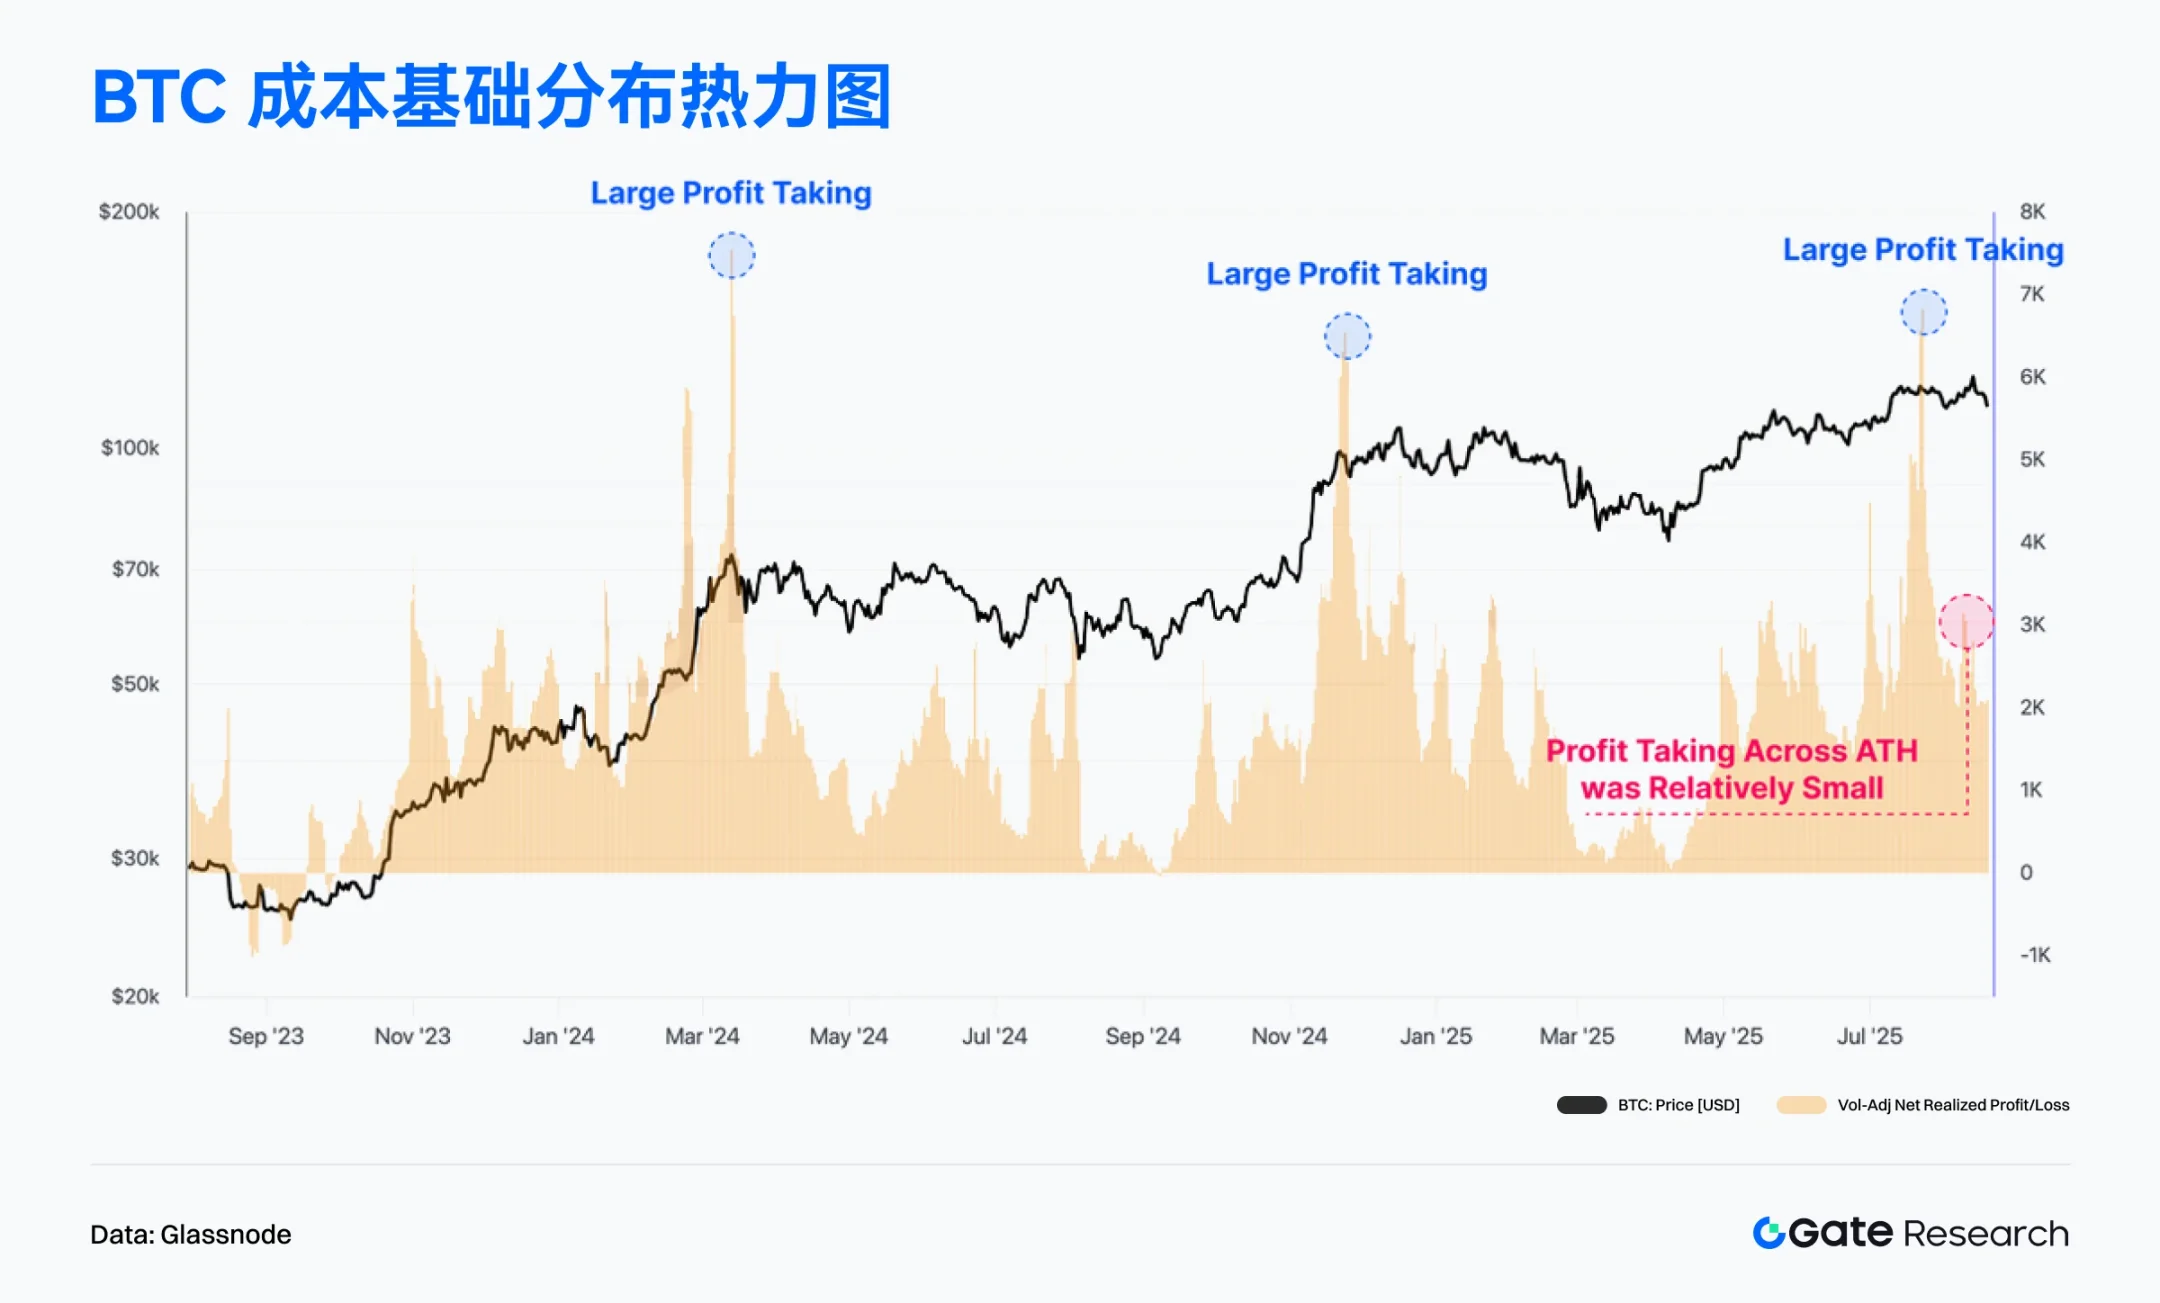
At the same time, the volatility adjusted net realized profit/loss (7d) shows that significant profit-taking waves often accompany Bitcoin's historical high point (ATH) breakthroughs. However, during the process of breaking through the new high of $124,000 in August 2025, the scale of profit-taking in the market was relatively mild, with only limited capital outflows, not reaching the extreme levels seen in the previous two ATHs. 【9】
This indicates that at the current stage, investors are more inclined to hold rather than rush to cash out, resulting in lighter selling pressure in this round of market activity and a more robust market structure. Overall, although insufficient short-term capital inflow limits further upward space, the lower profit-taking pressure helps maintain market consolidation at high levels rather than quickly falling into a deep correction.
BTC Cost Basis Intensively Accumulated, Key Support Zone Gradually Solidifying
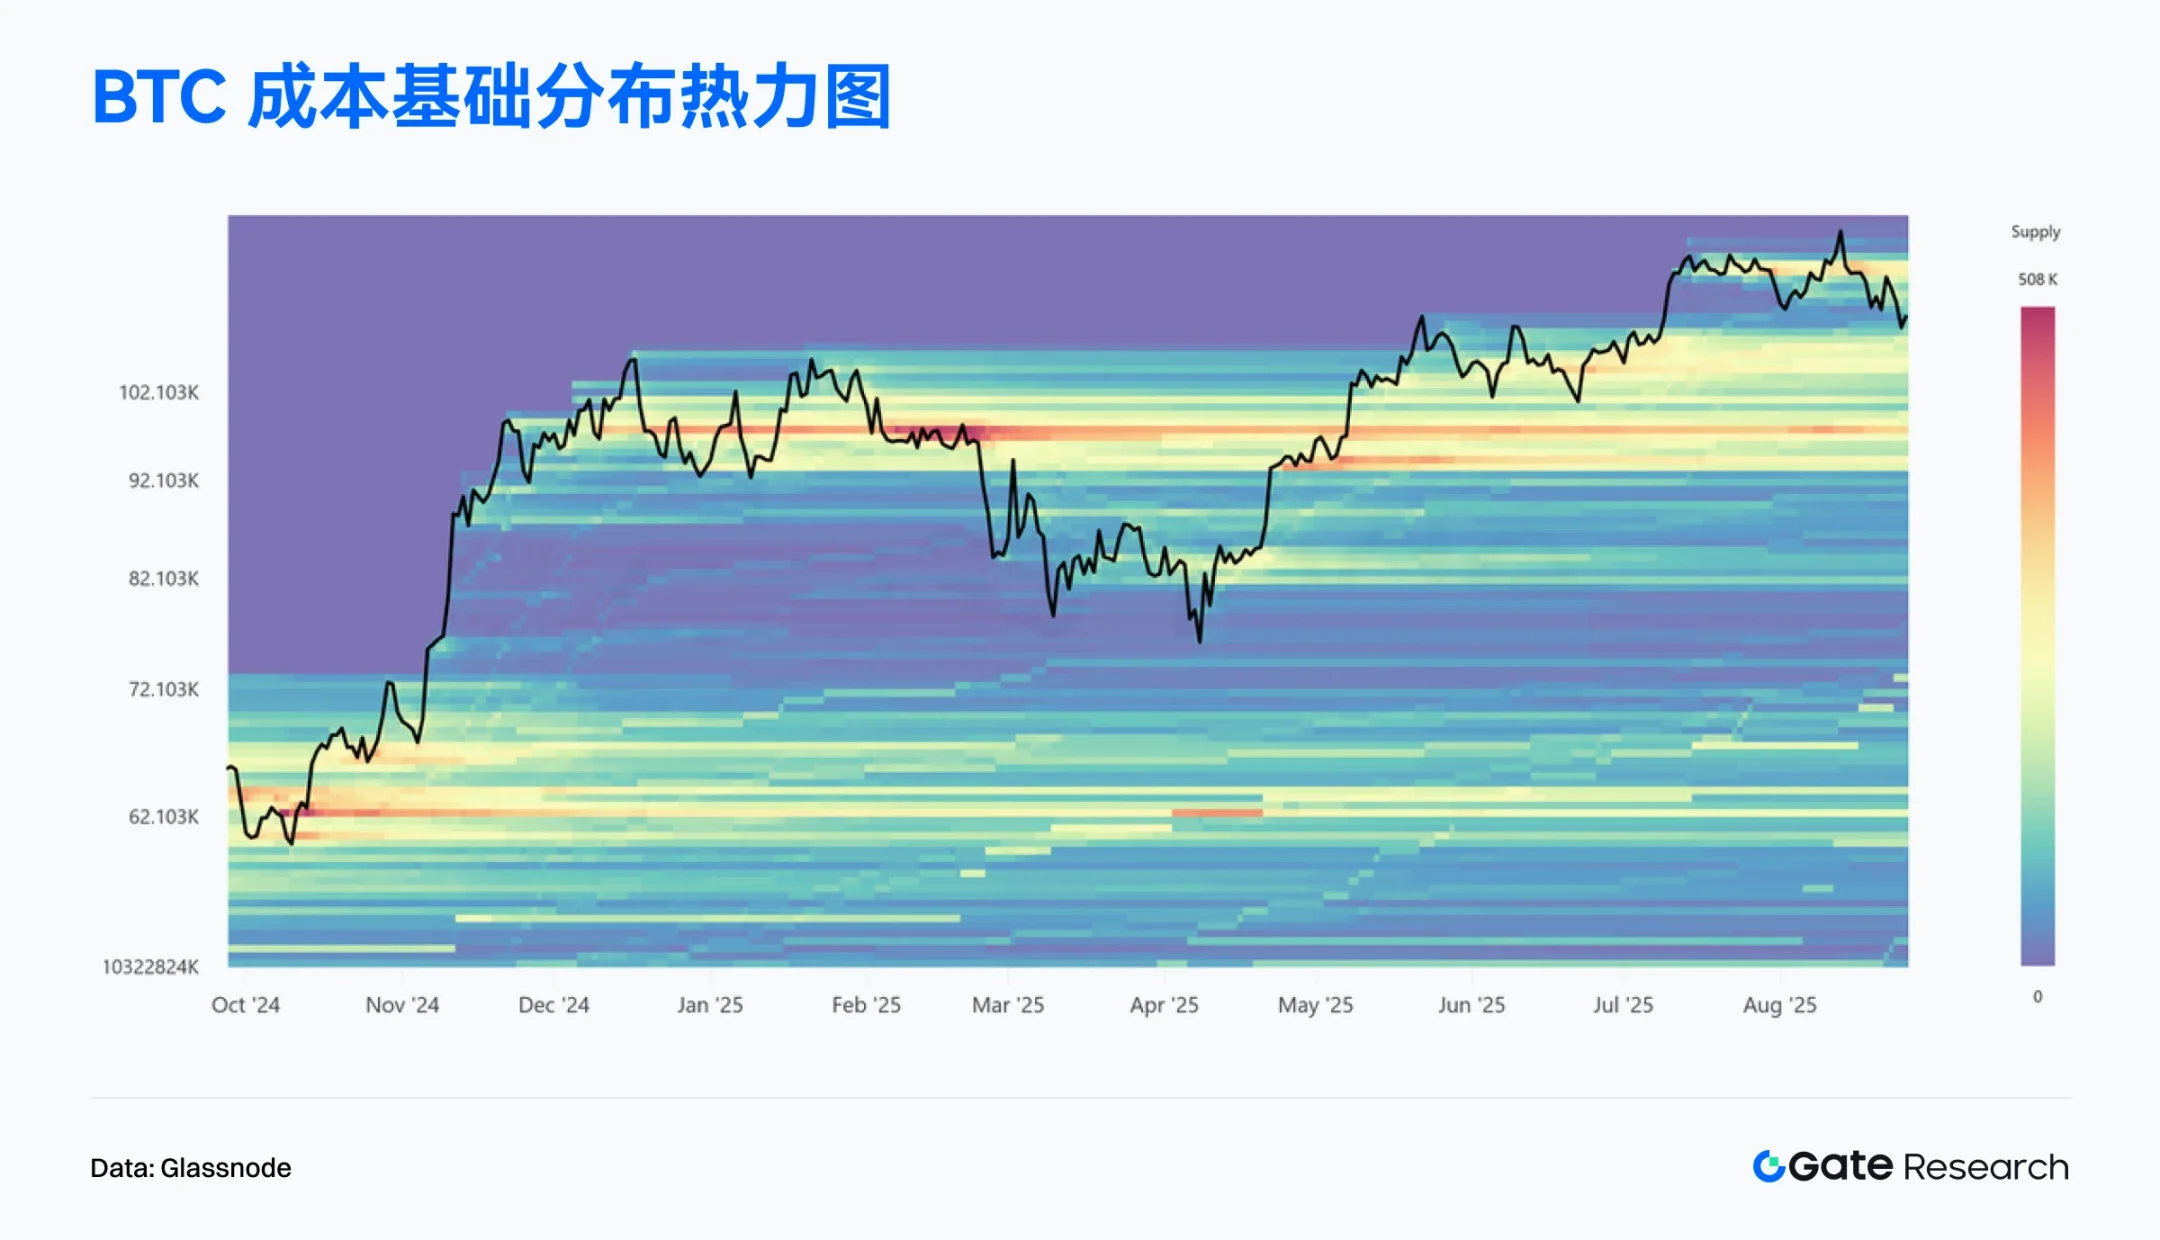
According to Glassnode data, the cost basis distribution heatmap for BTC shows a significant supply concentration zone forming in the $93,000–$110,000 range, which has been accumulating since December 2024, gradually becoming an important support area in the current market. Although recent prices have retreated from the $124,000 high, they still operate above this supply zone, indicating strong support. 【10】
Meanwhile, the area above $110,000 is relatively sparse in supply, forming what is known as a "blank zone," where prices lack stable support or pressure, resulting in higher volatility. Currently, the market hovers around $111,000; if it continues to pull back, the thick cost basis below may provide support. If it can hold steady, it indicates that market capital is continuously accumulating in this range, laying the foundation for future rebounds. Overall, this heatmap highlights the supply concentration and potential bottoming effect of BTC in the $93,000–$110,000 range, while also revealing that the current market is on the edge of a key support state.
BTC Unrealized Losses Remain Low, Market Pressure Limited
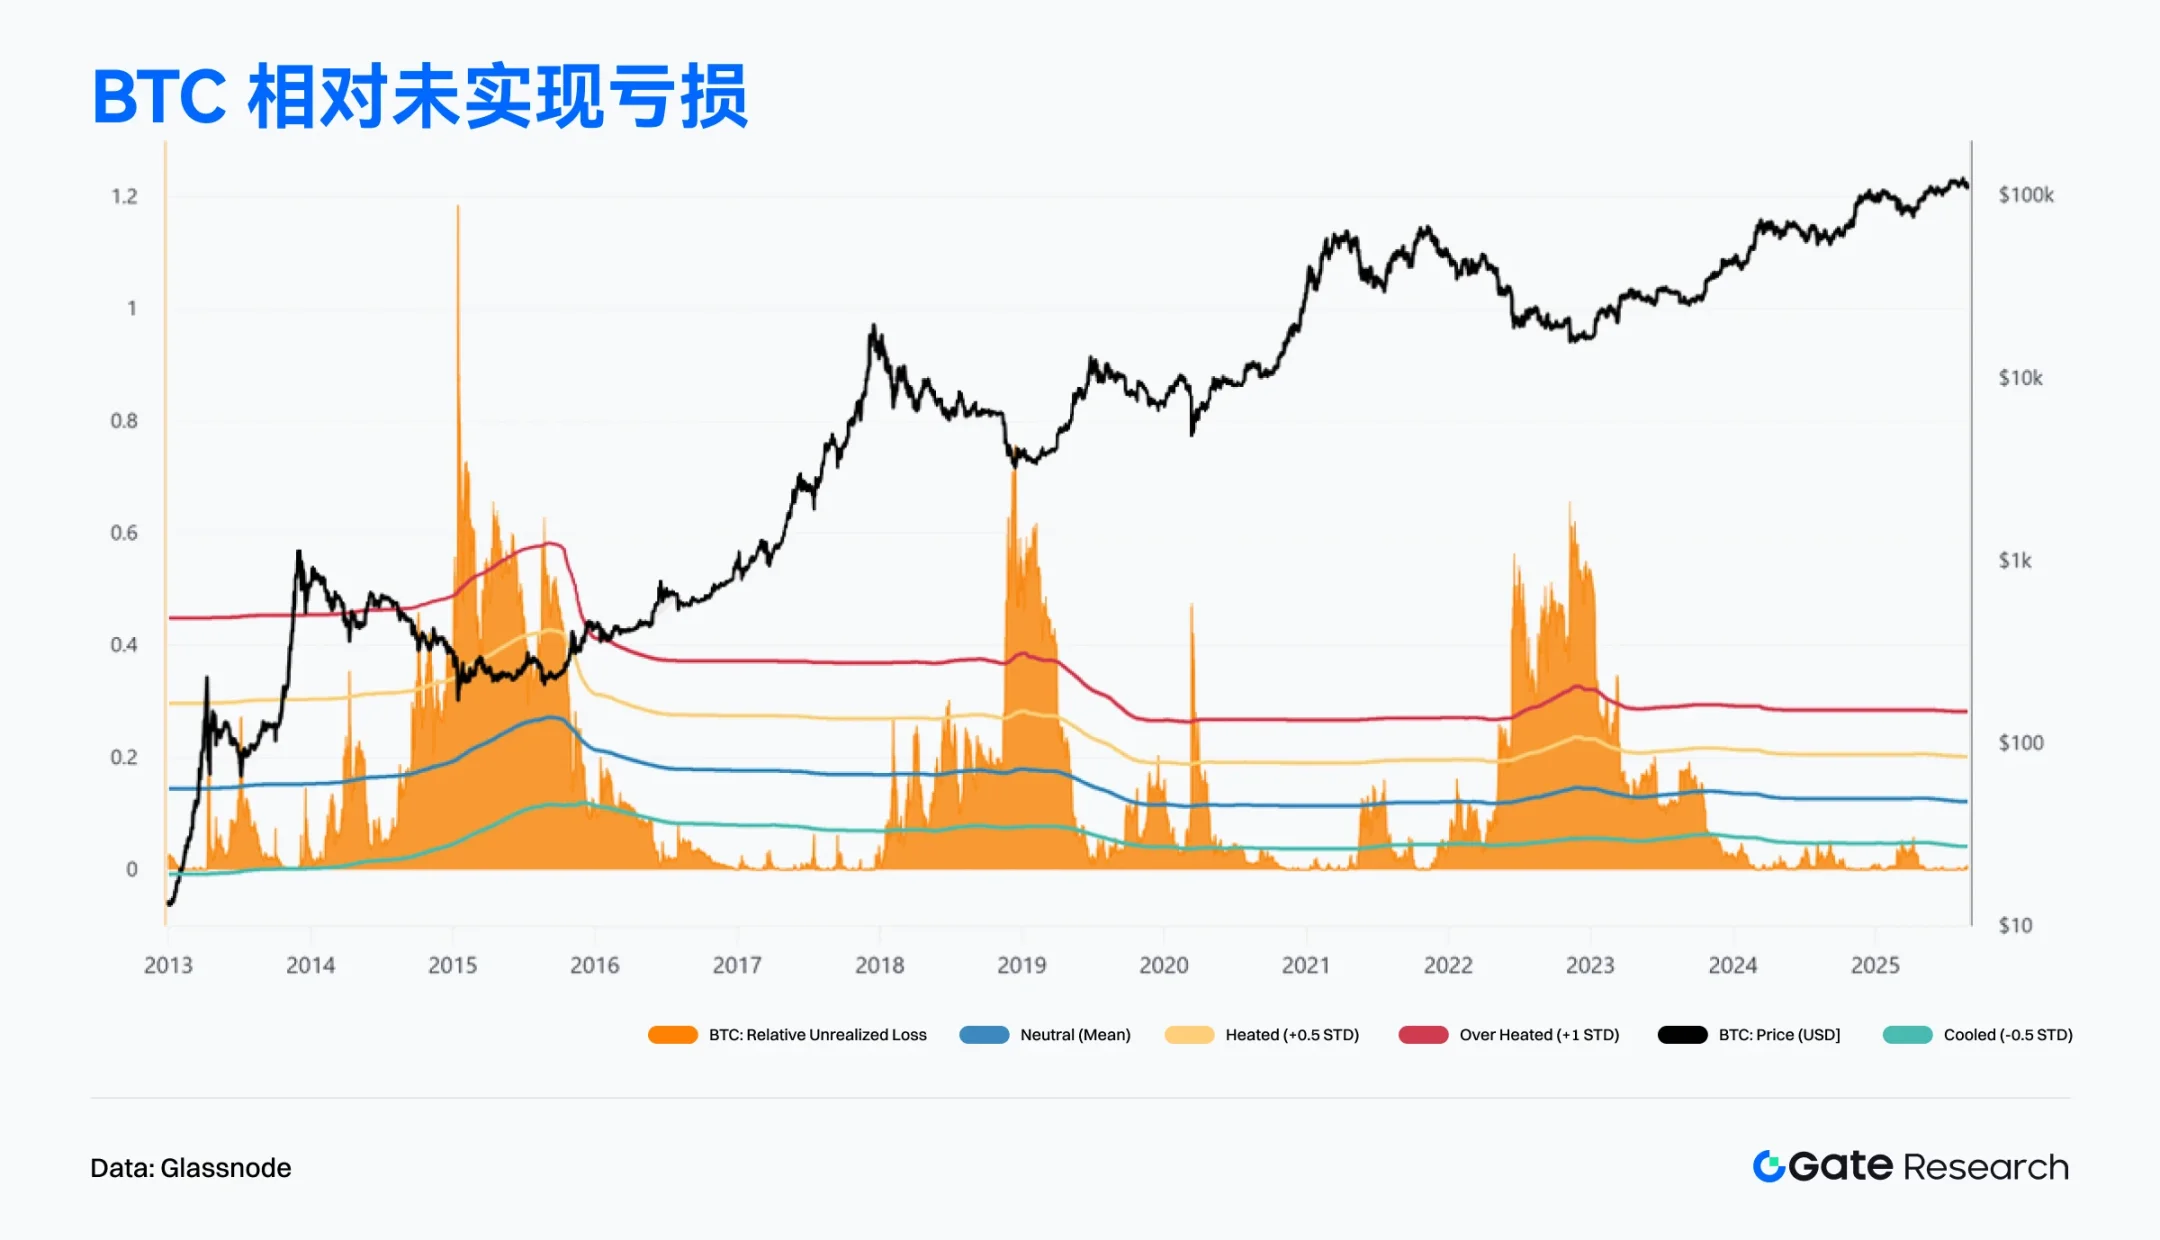
According to Glassnode data, the relative unrealized loss indicator for BTC surged significantly during the bear market of 2023, reflecting the immense loss pressure investors faced at that time. However, since the end of 2023, this indicator has rapidly declined and has remained low between 2024 and 2025, consistently staying below -0.5 standard deviations. 【11】
Compared to historical cycles, the current level of relative unrealized losses is only about 0.5%, far below the extreme values exceeding 30% during the bear markets of 2018–2020 and 2022–2023. This means that although BTC has recently pulled back from the $124,000 high, the unrealized losses for short-term holders have increased somewhat, but the overall market's loss pressure is not severe. Overall, this indicator shows that the market has not entered an extreme panic phase similar to past deep bear markets, and the investor structure remains relatively healthy. In other words, the current pullback resembles a phase correction in the upward process rather than a trend reversal.
Popular Projects and Token Dynamics
On-chain data indicates that capital and users are gradually concentrating on ecosystems with interactive foundations and application depth, while projects with topicality and technological innovation capabilities are becoming new focal points for capital pursuit. The following sections will focus on recently outstanding popular projects and tokens, analyzing the logic and potential impacts behind them.
Overview of Popular Project Data
Aave
Aave is a decentralized lending platform that eliminates traditional financial intermediaries using smart contract technology, allowing users to trade directly. The platform is known for its innovative lending products, supporting multiple cryptocurrencies and employing Layer 2 solutions to enhance efficiency. Aave's operational mechanisms include collateral loans and flash loans, along with a security module to protect the protocol from capital losses. Aave V4 will introduce new features such as a unified liquidity layer and blurred control over interest rates. Additionally, the proposal for Aave Network will enable it to execute various functions as an application chain, including charging fees using GHO and integrating Aave V4.
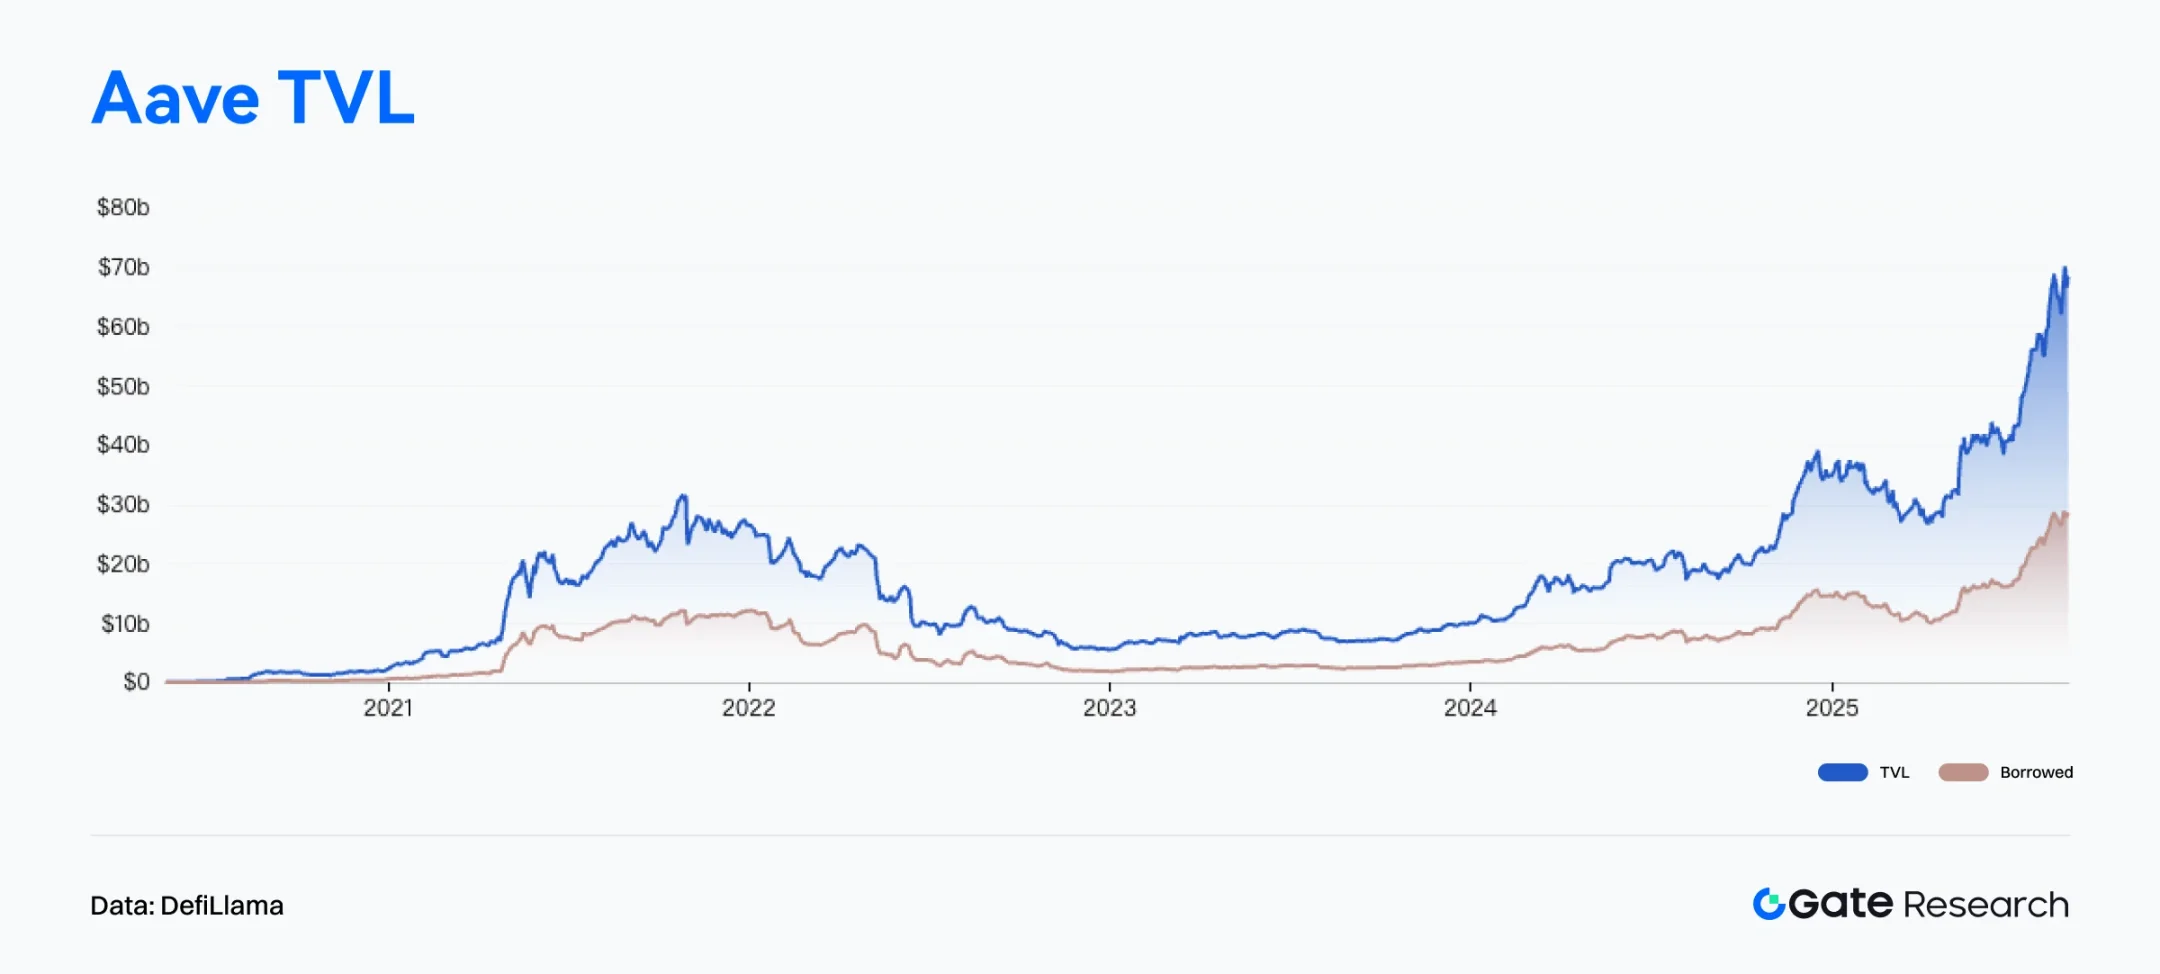
According to DefiLlama data, the total value locked (TVL) in the decentralized lending protocol Aave has surpassed $41.1 billion, setting a new historical high. 【12】 If the outstanding loans of $28.9 billion on that day are included, Aave's total capital scale would exceed $70 billion, ranking it among the top 37 banks in the U.S. (in the top 1.7%). 【13】 Aave founder Stani Kulechov stated that Aave is an open financial network capable of providing institutions with income sources without relying on the Federal Reserve, highlighting DeFi's structural potential to replace traditional financial systems. Currently, Aave continues to lead in the DeFi lending space, holding about 50% of the market TVL, nearly six times the size of the second-largest competitor, Morpho, reflecting a high concentration of user and institutional funds in its safety and stability.
Aave Labs recently launched a new platform, Horizon, aimed at providing institutional investors with lending services using tokenized real-world assets (RWA) as collateral to obtain stablecoins. In the initial launch phase, qualified institutions can use tokenized assets such as treasury bonds and cryptocurrency-holding funds as collateral to borrow stablecoins like USDC, RLUSD, and GHO. The first batch of supported assets includes Superstate short-term U.S. Treasury funds, Circle yield funds, and tokenized products launched by Centrifuge. 【14】
The launch of Horizon marks Aave's accelerated layout in the institutional-grade RWA financing market. By introducing traditional financial assets such as treasury bonds as DeFi collateral, Aave broadens the issuance and usage scenarios of stablecoins while providing institutions with tools that combine liquidity and yield management. This not only enhances the market demand and liquidity for stablecoins and RWAs but also promotes the integration of DeFi and TradFi.
In summary, Aave not only maintains its leading position in the decentralized lending field, but its continuous innovation in institutional services also demonstrates clear strategic foresight. As compliance pathways become increasingly clear and the types of collateral assets continue to expand, Horizon is expected to become a key entry point for institutions entering DeFi, further strengthening Aave's core position in the global financial architecture.
Overview of Popular Token Data
$BIO
BIO is the native token of Bio Protocol, a blockchain project focused on the decentralized science (DeSci) track, aiming to create an open research collaboration network involving researchers, patients, and investors through on-chain governance and token incentives. The BIO token can be used for participating in BioDAO governance, project incubation support, and intellectual property revenue distribution, and it provides voting rights and reward eligibility through a staking mechanism. Bio Protocol promotes the on-chain transformation and commercialization of research results through IP tokenization, research task incentives, and incubation mechanisms, becoming one of the most representative projects in the DeSci ecosystem.
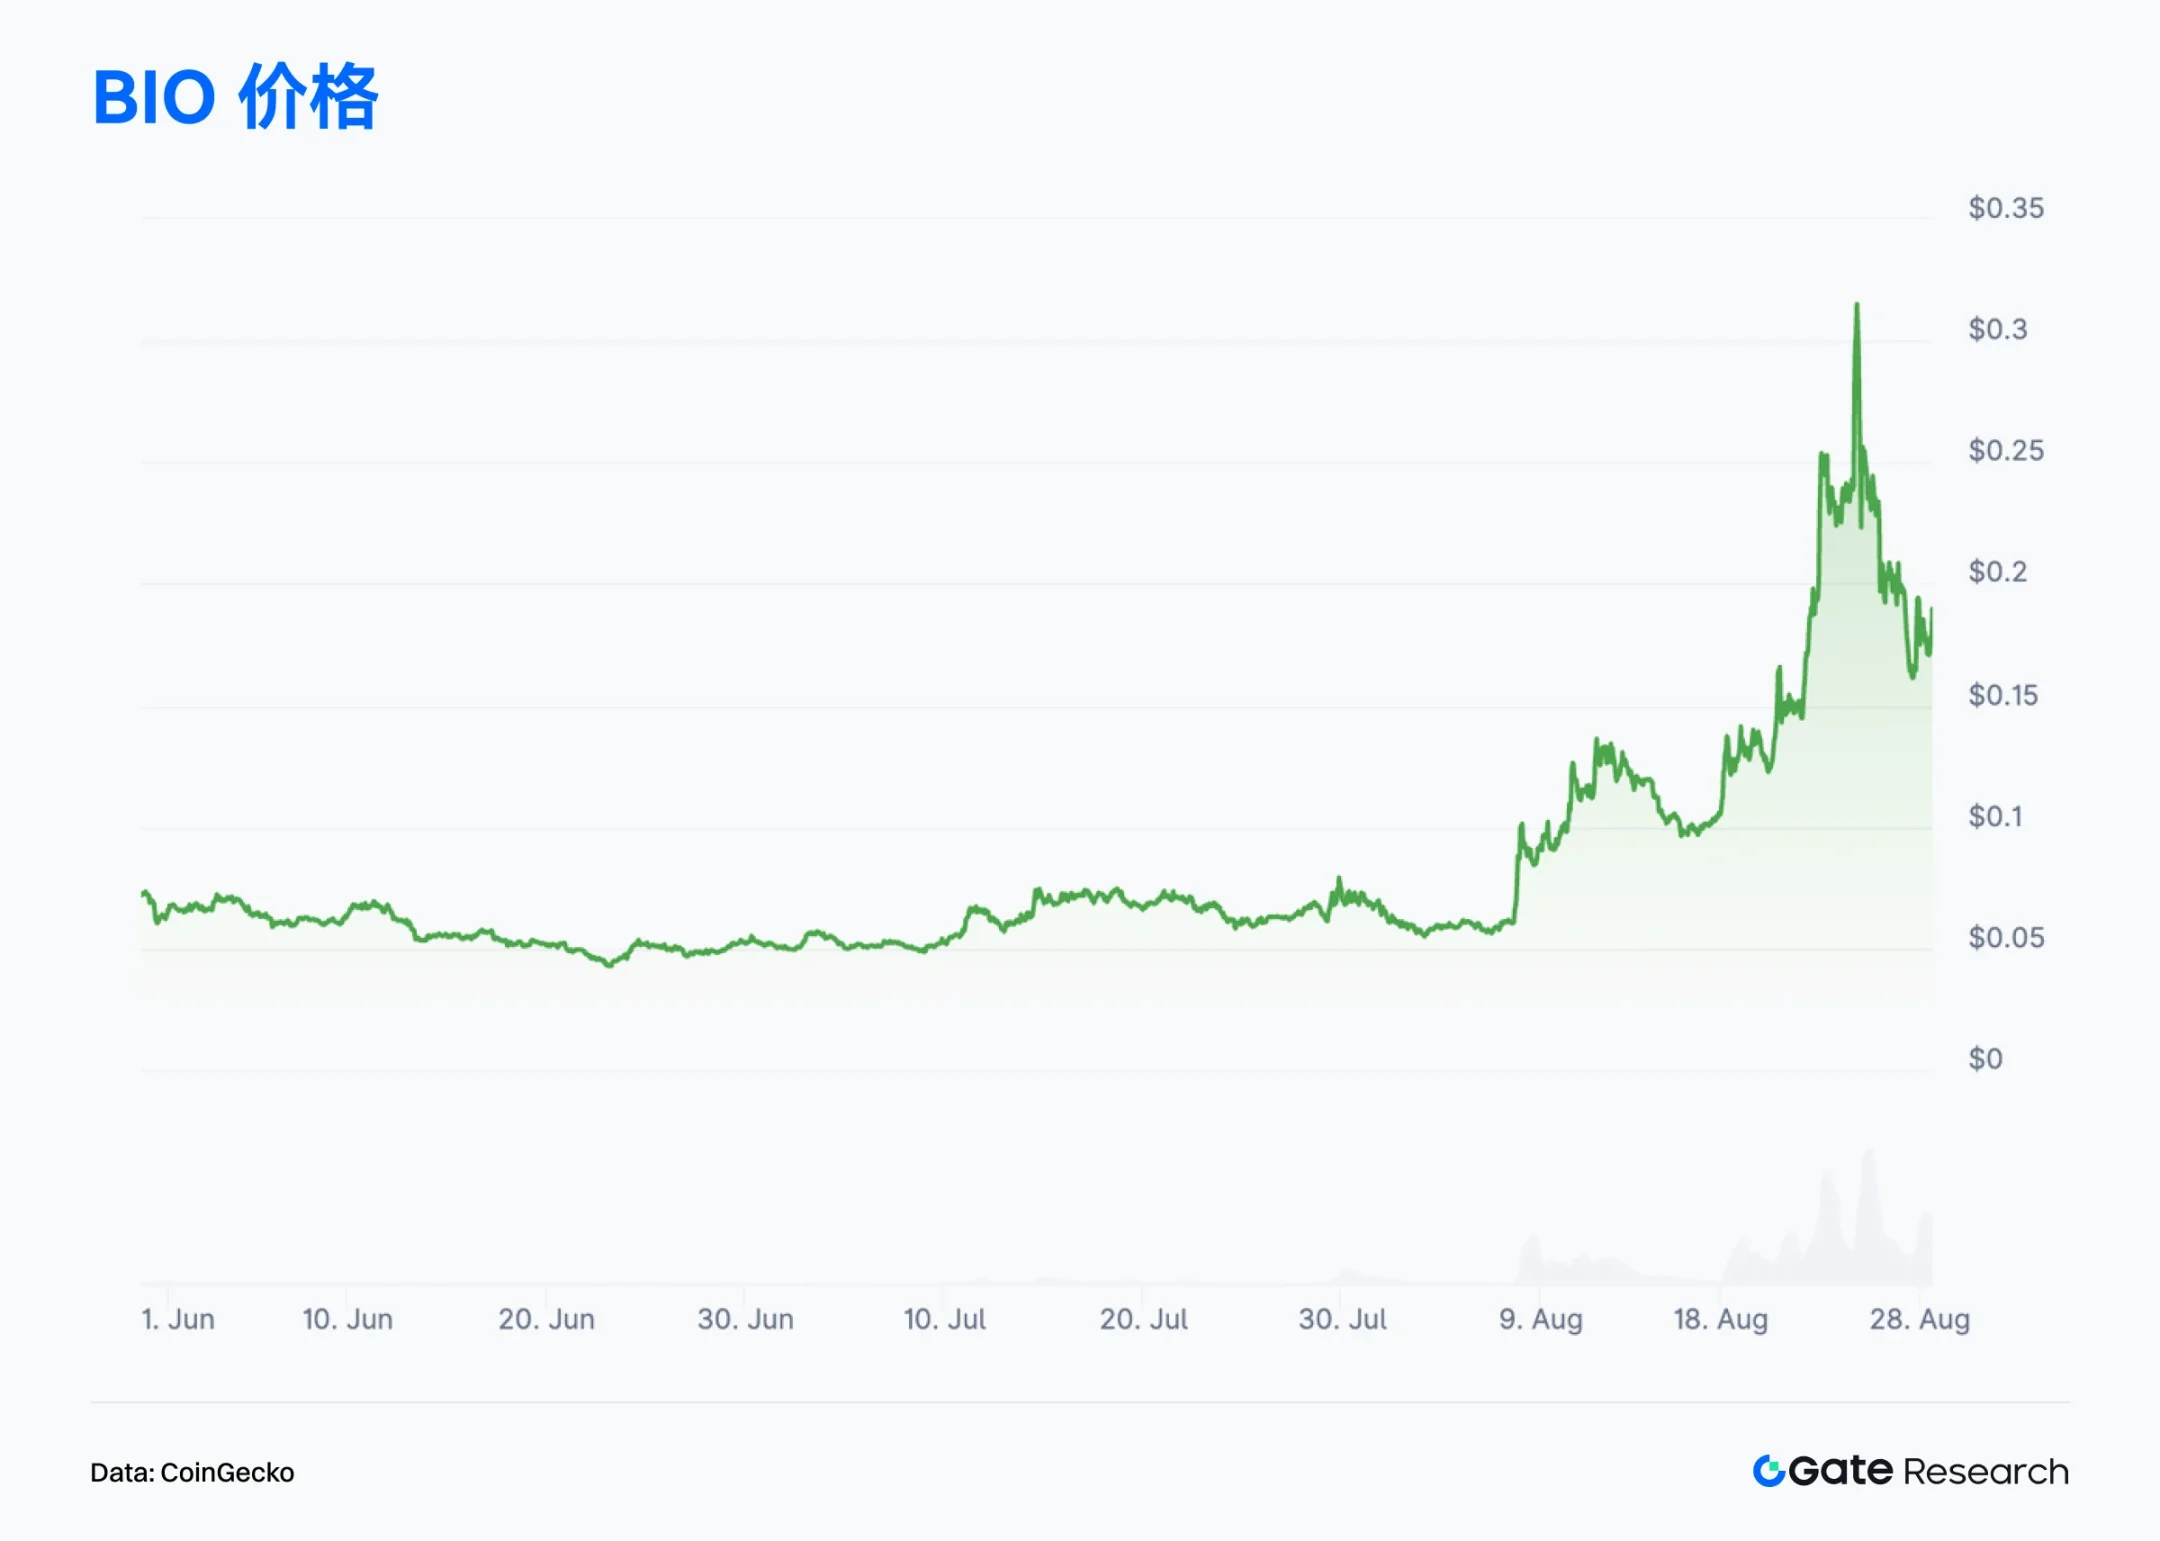
With the official launch of Bio Protocol V2, new mechanisms such as Launchpad, staking point systems, and liquidity engines have been introduced. In the first week after launch, the total amount staked exceeded 10 million BIO, and the token market cap rapidly doubled to $200 million, reigniting market interest in the DeSci track. 【15】 The price of BIO started at $0.10 on August 18 and peaked at $0.315 on August 24, with a weekly increase of nearly 200%, making it one of the best-performing assets on-chain in August.
In terms of ecosystem expansion, Bio Protocol has accumulated over $4 million in liquidity fees and is preparing to integrate with leading DeFi protocols, including launching a dedicated lending market for Bio. The team also plans to launch Bio Copilot, creating a decentralized research agent to automate research processes such as drug screening, clinical operations, and fund allocation, accelerating research into a high-frequency, intelligent iterative phase.
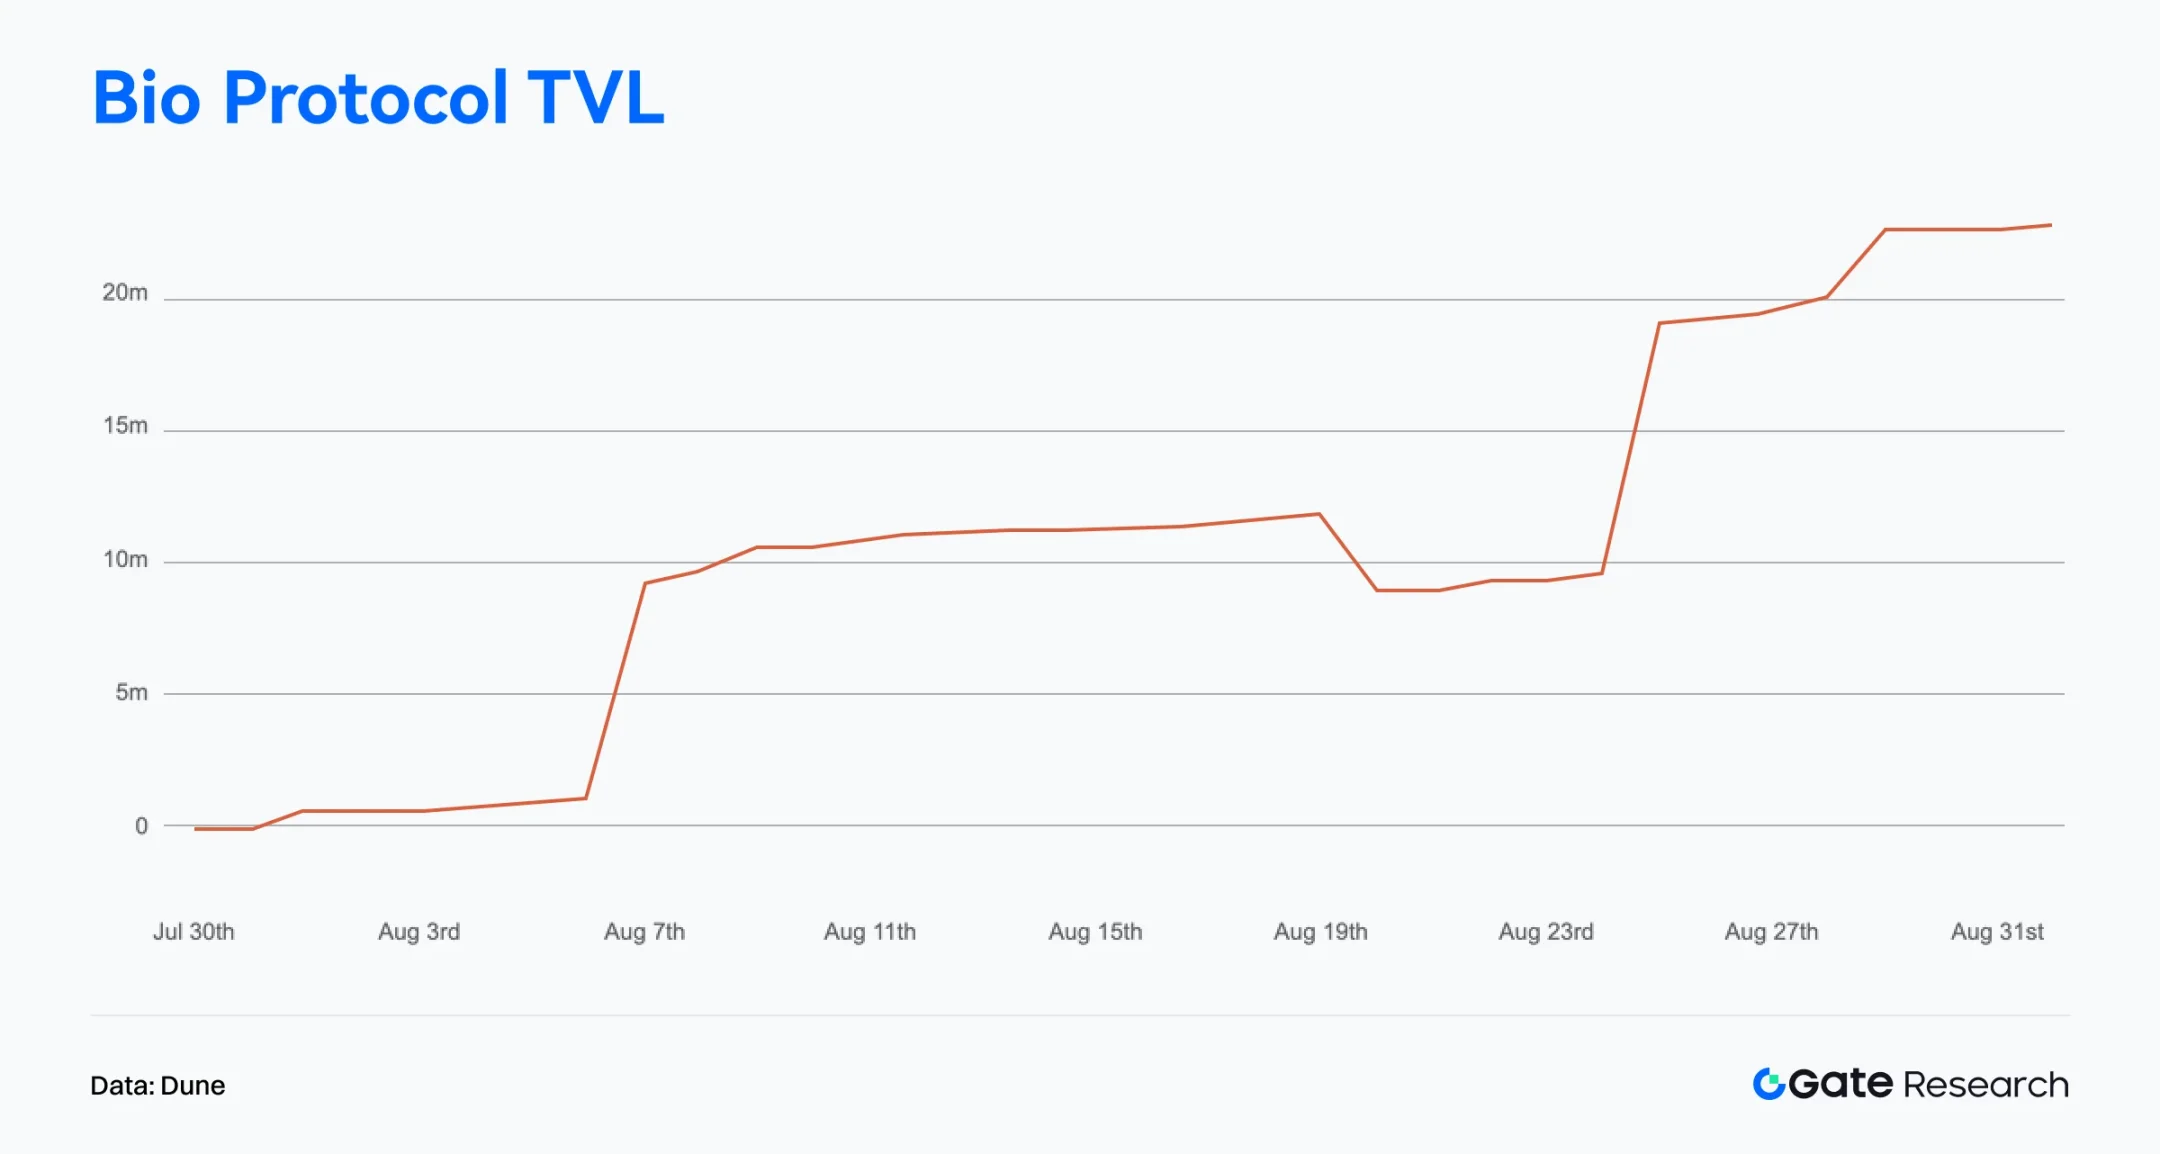
On-chain data also shows that capital is accelerating its inflow; according to Dune data, Bio Protocol's TVL has surpassed $22 million, rising over 110% in the past week. Analysts believe that the increase in the medium to long-term locked position ratio is expected to bring sustained upward momentum for BIO, but the high proportion of short-term positions may still trigger phase selling pressure; if long-term capital continues to flow in, BIO is likely to enter a new upward cycle. 【16】
In summary, Bio Protocol, with its precise positioning and continuous innovation in the decentralized science (DeSci) field, has not only achieved remarkable breakthroughs in on-chain data and market performance but has also successfully attracted deep participation from capital and communities through V2 upgrades, liquidity mechanism optimization, and ecosystem layout. As products like Bio Copilot continue to advance, the project is expected to make substantial progress in pushing the research industry chain on-chain and empowering research automation. If subsequent capital inflows and locked position structures are further optimized, Bio Protocol may continue to lead in the DeSci track, becoming a key bridge connecting research innovation and on-chain finance.
Conclusion
In August 2025, on-chain activity and capital flow structures continued to diverge. Solana maintained its position at the top of the trading charts with over 29 billion monthly transactions, showcasing its dominance in high-frequency interactions. Meanwhile, Ethereum not only achieved record high transaction volumes on its mainnet for several consecutive months but also led significantly in fee income and net capital inflows, solidifying its core position in high-value interaction scenarios and institutional deployments. Base steadily rose, with active addresses surpassing one million, continuously expanding its influence within the Layer 2 camp. In terms of capital, Ethereum recorded over $2 billion in net inflows in a single month, driving both ETH prices and ETF management scales to new highs, while WorldChain and Solana also ranked among the top capital attractors. In contrast, sidechains like Polygon and Unichain, along with some L2s, faced capital withdrawal pressures, further evolving the on-chain landscape towards a "stronger getting stronger" dynamic.
Regarding Bitcoin, on-chain indicators displayed a robust structure amid high-level fluctuations, with a slowdown in capital inflow speed, but relatively mild profit-taking pressure and limited market selling pressure. A solid support was formed in the $93,000–$110,000 range, and the short-term pullback did not damage the key support zone. Unrealized losses remained low, indicating limited overall pressure. Overall, this round of adjustment leans more towards a phase correction rather than a trend reversal, and after digesting the high-level fluctuations, there remains a structural basis for continued upward movement.
In terms of project hotspots, Aave and Bio Protocol have become the current focal points. Aave, as the leader in DeFi lending, saw its TVL surpass $41.1 billion, with an overall capital volume exceeding $70 billion. It accelerated its layout in RWA collateral and institutional services through Aave V4 and the Horizon platform, reinforcing its position in the integration of DeFi and TradFi. Bio Protocol, on the other hand, doubled its market cap to $200 million due to the V2 upgrade, with its price soaring nearly 200% in a single week, and plans to launch Bio Copilot to promote research automation, showcasing the strong growth potential of the DeSci track.
References:
DefiLlama, https://defillama.com/chain/ethereum?activeAddresses=false&tvl=false&groupBy=monthly&dexsVolume=true
DefiLlama, https://defillama.com/protocol/pendle
Glassnode, https://studio.glassnode.com/charts/ba1ec93d-85f4-41fe-5606-798a2f30013a?a=BTC
Glassnode, https://studio.glassnode.com/charts/22ef95fa-bed1-4a18-5e56-a74093870d1a?a=BTC
Glassnode, https://studio.glassnode.com/charts/e710c5a0-3f26-4e8b-7fa2-28ef87c92b73
DefiLlama, https://defillama.com/protocol/aave?events=false&borrowed_tvl=true
Aaverank, https://aaverank.com/
Dune, https://dune.com/tk-research/bio-launchpad
免责声明:本文章仅代表作者个人观点,不代表本平台的立场和观点。本文章仅供信息分享,不构成对任何人的任何投资建议。用户与作者之间的任何争议,与本平台无关。如网页中刊载的文章或图片涉及侵权,请提供相关的权利证明和身份证明发送邮件到support@aicoin.com,本平台相关工作人员将会进行核查。


