The fluctuations in the cryptocurrency market are like the waves in a turbulent sea, making people feel anxious. But its charm lies in the fact that it never looks at your past report card. Stop saying "I'll enter the market when it stabilizes"; opportunities in the crypto world never lie in "stability." The real dividends always belong to those who dare to position themselves amid uncertainty. Market volatility is not a risk; not understanding the trend is the biggest risk.
After the PPI data was released last night, Bitcoin broke through 113,600, reaching a high of 114,400, confirming a bullish "inverted head and shoulders" pattern, which usually indicates that the downward trend from the historical high may be ending and a new upward trend may be restarting. According to the measurement of the increase method, the theoretical target may point to around 120,000 USD.
Short-term technical signals show that the moving average system has formed a golden cross, with prices breaking through the short-term moving average, combined with the appearance of an engulfing pattern, indicating a potential bullish reversal in the short term. The daily K-line has formed consecutive bullish candles, and the market is currently in an upward trend, but the 2-hour K-line has broken the previous high and then retreated, currently in a consolidation phase with strong resistance above. The 2-hour MACD may show a top divergence signal, the daily momentum is biased towards the bullish side, and the 2-hour EMA has seen a significant short-term increase, indicating a need for a pullback.
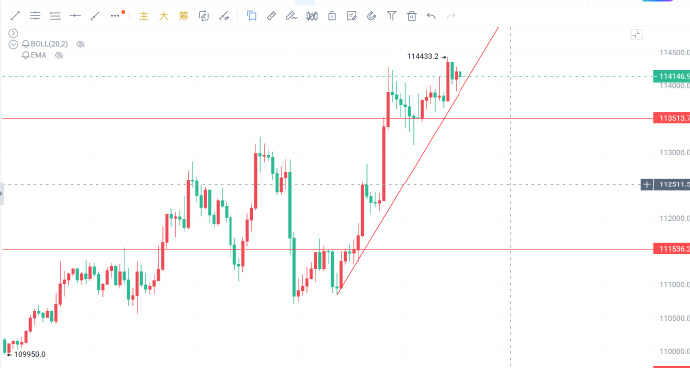
Suggested trading range: In the 111,500-112,500 range, consider entering positions in batches, targeting the 114,000-115,000 range.
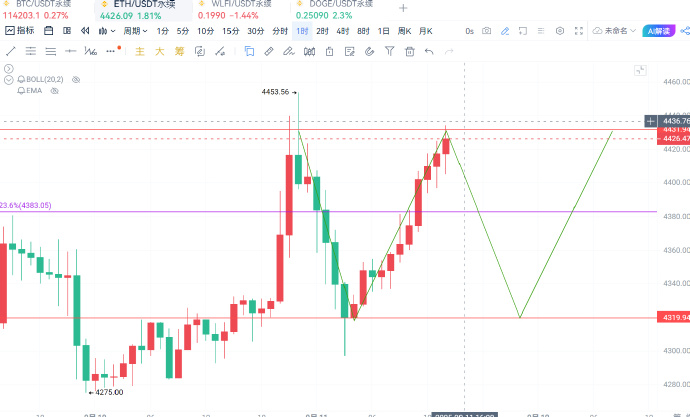
Ethereum mainly fluctuated in the range of 4,300 to 4,450 USD after last night, with strong resistance at 4,450/4,500 above. Similar to Bitcoin, its trading volume is also shrinking, indicating insufficient market participation to support a sustained rise.
The technical pattern is still weak; although a series of small bullish candles have formed on the daily chart, there is heavy selling pressure above. The 1-hour chart shows a rise followed by a retreat, with insufficient short-term rebound momentum. Notably, a "evening star" pattern has appeared on the technical chart, which is a short-term bearish reversal signal that requires caution. The 2-hour MACD also shows signs of divergence, indicating a need for a pullback.
Suggested trading range:
When the price approaches the upper resistance of the range and the volume is insufficient, consider shorting at 4,450-4,580; target at 4,360.
When the price pulls back to the lower support of the range, consider going long in the 4,280-4,330 range; target at 4,400-4,430.
Due to the time-sensitive nature of price points, there may be delays in post review; specific operations should be based on real-time market conditions. The above trading range analysis is for reference only; the cryptocurrency market is highly risky, so please manage your risk and make cautious decisions when investing. If you are interested in specific indicator analysis or the impact of new market dynamics on prices, feel free to scan the QR code for the public account in the article below. You are welcome to visit.

Friendly reminder: The content of the above article is original to the author, and the advertisements at the end of the article and in the comments section are unrelated to the author; please be cautious!
免责声明:本文章仅代表作者个人观点,不代表本平台的立场和观点。本文章仅供信息分享,不构成对任何人的任何投资建议。用户与作者之间的任何争议,与本平台无关。如网页中刊载的文章或图片涉及侵权,请提供相关的权利证明和身份证明发送邮件到support@aicoin.com,本平台相关工作人员将会进行核查。