币圈市场的波动犹如汹涌大海中的波涛,让人心惊胆战。但是它的魅力就在于它从不看你过去的成绩单。别总说 “等市场稳定了再入场”,加密世界的机会从来不在 “稳定” 里。真正的红利,永远属于那些在不确定性中敢于布局的人。市场波动不是风险,看不懂趋势才是最大的风险。
比特币现价 117300 美元,市场处于区间震荡格局。技术面显示,价格在支撑与阻力之间反复波动,日线形成多根阳线,市场情绪偏强,EMA 各均线呈现多头排列,多头趋势明显。2 小时图中,价格在 117000 美元附近震荡后突破上行,高点接近前期波段高位 117865 美元,短期有一定压力,MACD2 小时动能增强。
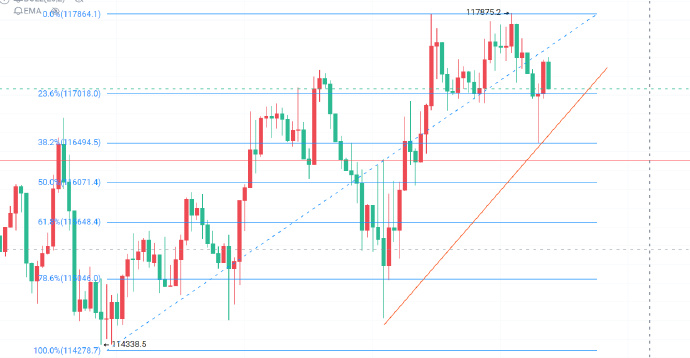
操作区间建议:短线做多点可在 116300-116800 美元附近,目标 117500-117800 美元
以太坊现价 4600 美元,呈现典型的区间震荡格局,价格运行在 4436 美元支撑与 4768 美元阻力之间。 尽管均线系统呈现多头排列,暗示市场仍有一定的看涨动能,但成交量的极度萎缩形成了量价背离,削弱了上涨的健康性,且近期 K 线形成的看跌吞没形态增加了短期回调的风险。不过,2 小时低点逐步抬高,高点不断试探 4600 美元以上区域,日线收阳,形成反弹结构,MACD2 小时动能增强,日线短期转强迹象显现。
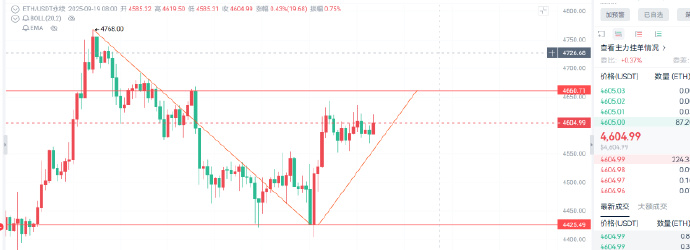
操作区间建议:4530-4570区间分批做哆,目标看4630-4660。
因价格点位具有时效性,帖子审核有延迟,具体操作还是实时行情为主。以上述操作区间分析仅供参考,加密货币市场风险高,做好风控,希望你在投资时谨慎决策。若你对特定指标分析或市场新动态对价格影响感兴趣,可随时扫描下方文章的公众号二维码,欢迎来访。

温馨提示:以上文章内容为笔者原创,文章末尾及评论区广告均与笔者无关,请注意甄别!
免责声明:本文章仅代表作者个人观点,不代表本平台的立场和观点。本文章仅供信息分享,不构成对任何人的任何投资建议。用户与作者之间的任何争议,与本平台无关。如网页中刊载的文章或图片涉及侵权,请提供相关的权利证明和身份证明发送邮件到support@aicoin.com,本平台相关工作人员将会进行核查。