Price Trend Analysis
- K-line Pattern:
The daily level shows that the recent price has gradually narrowed after significant fluctuations, forming a consolidation pattern. On September 4, a long lower shadow appeared, indicating some buying support below.
On the 4-hour level, the K-line shows a series of small bullish candles rebounding, but overall it has not yet broken through the previous high resistance level (the 4350-4375 range).
Technical Indicators:
MACD: In the 4-hour cycle, both DIF and DEA are below the zero axis, with green bars shortening, indicating a weakening of bearish strength and signs of a golden cross; however, the daily level is still running with a death cross, showing a weak trend.
RSI: The 4-hour RSI value is around 45, close to the neutral zone, not yet entering overbought or oversold territory; the daily RSI is slightly below 50, indicating cautious market sentiment.
EMA: The current price is constrained by EMA30 (around 4376) in the 4-hour cycle, while EMA7 and EMA30 are converging, making the short-term direction unclear; the daily EMA120 (around 4380) exerts strong pressure on the price.
Trading Volume:
The daily trading volume significantly increased on September 4, indicating intensified divergence between bulls and bears, followed by a noticeable decrease in volume on September 5, reflecting strong wait-and-see sentiment.
The trading volume in the 4-hour cycle is gradually decreasing, reflecting limited strength in the current rebound and insufficient bullish confidence.
1. Bullish Strategy (Key Support Zone Layout)
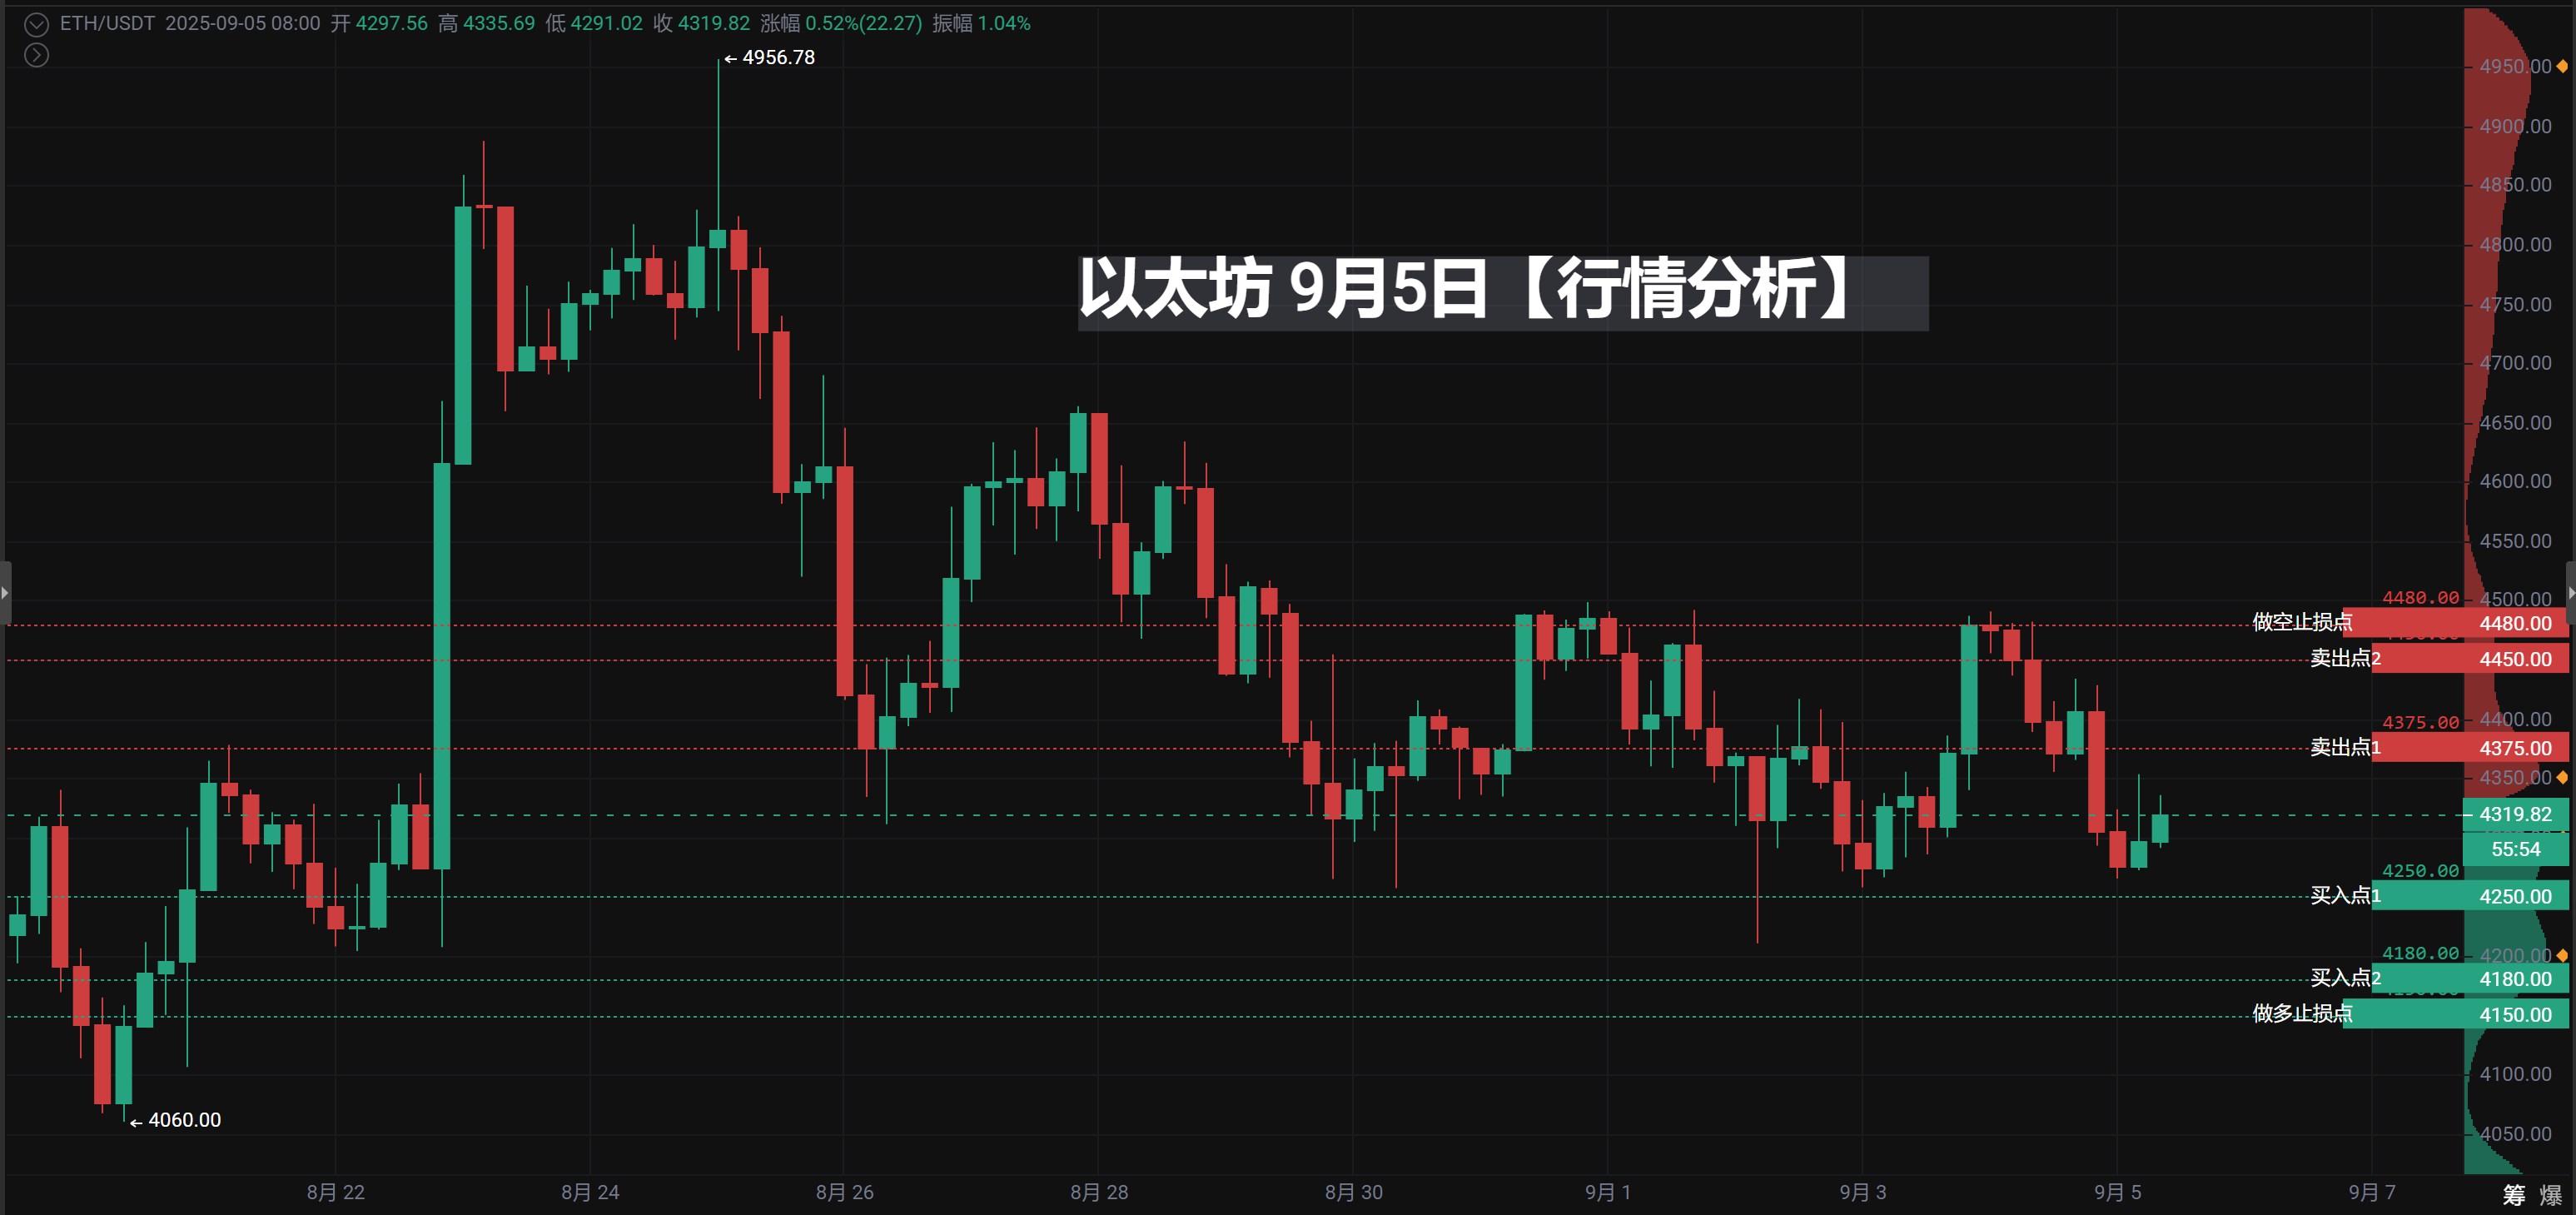
📍 Bullish Entry Point 1: 4,250 USDT
Reasoning: This position combines previous lows, round numbers, and long lower shadow support, making it an important technical support zone.
Optimization Suggestion: Enter for the first time at this position, suggest using 40% of the planned bullish funds. After entering, closely monitor the price reaction; if it rebounds quickly, hold; if it lingers or slowly declines, wait for the second entry point.
📍 Bullish Entry Point 2: 4,180 USDT
Reasoning: This is a deeper support level, close to the important psychological level of 4200, which theoretically will have stronger buying power.
Optimization Suggestion: This is a better entry point with a higher risk-reward ratio. If the price falls back to this level, invest the remaining 60% of funds to effectively average down the cost.
🛑 Bullish Stop-Loss Point: 4,150 USDT
- Reasoning and Emphasis: Setting a stop-loss is very critical and reasonable. Set the final defense line for all bulls below the 4,180 support zone; if it breaks, it proves that all support logic has failed, and the trend may further turn bearish, must decisively stop loss, do not harbor illusions.
🎯 Bullish Target Levels:
Target 1: 4,375 USDT (reduce position or close half to lock in profits)
Target 2: 4,450 USDT (close all remaining bullish positions)
2. Bearish Strategy/Bullish Take-Profit Strategy (Key Resistance Zone Game)
📍 Bearish Entry Point / Bullish Take-Profit Point 1: 4,375 USDT
Reasoning: This position is a dual pressure zone of the EMA30 moving average and previous highs, making it the first important resistance technically, and also the primary take-profit point for bulls.
Operational Suggestion: Bulls can actively reduce positions here. If attempting to short here, it should be accompanied by bearish K-line signals (such as long upper shadows, bearish engulfing), and the position should be light.
📍 Bearish Entry Point / Bullish Take-Profit Point 2: 4,450 USDT
Reasoning: This is a stronger resistance range, being the top of the previous consolidation box. If the price rebounds to this level, it will encounter stronger selling pressure.
Operational Suggestion: This is the ideal clearing position for bulls, and also a point with a higher probability for bears to test.
🛑 Bearish Stop-Loss Point: 4,480 USDT
- Reasoning: The stop-loss is placed above the strong resistance level, allowing space for potential false breakouts in the market. If the price strongly breaks through 4,480, it means that the upward space may be opened, and bears must immediately stop loss.
Key Risk Alerts and Position Management
Head and Shoulders Pattern Risk: The "head and shoulders" pattern you mentioned is the current core risk. The neckline (around the 4,350-4,375 area) is the dividing line between bulls and bears. If the price rebounds but cannot effectively break through and stabilize in this area, the downside risk still exists.
Volume Confirmation: "Volume-less rebounds are all illusions." If the price rebounds to 4,375 or 4,450, and the trading volume does not significantly increase, it is an excellent take-profit or short signal. Conversely, if it drops to the support level with reduced volume, the probability of a rebound increases.
Priority Strategy: In the current environment, the win rate and risk-reward ratio of "buying on dips" are better than "selling on highs." This is because going long is in line with the trend (betting on a rebound), while going short is against the trend (betting on a trend reversal), which is more difficult and risky. It is recommended to focus main efforts on bullish strategies.
Position Management: Be sure to adhere to the principles of gradual entry and gradual take-profit. Do not go all in at 4,250, and do not fantasize about selling everything at the highest point at 4,375.
Please note: The above analysis is only a summary and discussion of your plan and does not constitute any investment advice. The market changes rapidly; please make final decisions based on real-time market conditions, and always prioritize risk control.
Wishing you successful trading!
- Live streaming of real-time strategies at irregular hours
#Tencent Meeting: 919-948-0091
[The above analysis and strategies are for reference only. Risks are to be borne by yourself. The article review and publication may have delays, and the strategies may not be timely. Specific operations should follow the real-time strategies of the crypto expert.]
Join the group chat to discuss and learn professional knowledge in the crypto space, so as not to be the chives under the scythe (you can receive a position allocation guide that teaches you how to make money in a bull market and earn coins in a bear market).
——Crypto Expert Community, a community focused on technical analysis. Anyone with questions about operations or trends can communicate and learn operations with me! Let's share and profit together! Remember the crypto expert, available 24 hours a day, follow the crypto expert to avoid getting lost!

Scan the QR code with WeChat to follow my public account
免责声明:本文章仅代表作者个人观点,不代表本平台的立场和观点。本文章仅供信息分享,不构成对任何人的任何投资建议。用户与作者之间的任何争议,与本平台无关。如网页中刊载的文章或图片涉及侵权,请提供相关的权利证明和身份证明发送邮件到support@aicoin.com,本平台相关工作人员将会进行核查。


