【Price Trend Analysis】
- Candlestick Pattern:
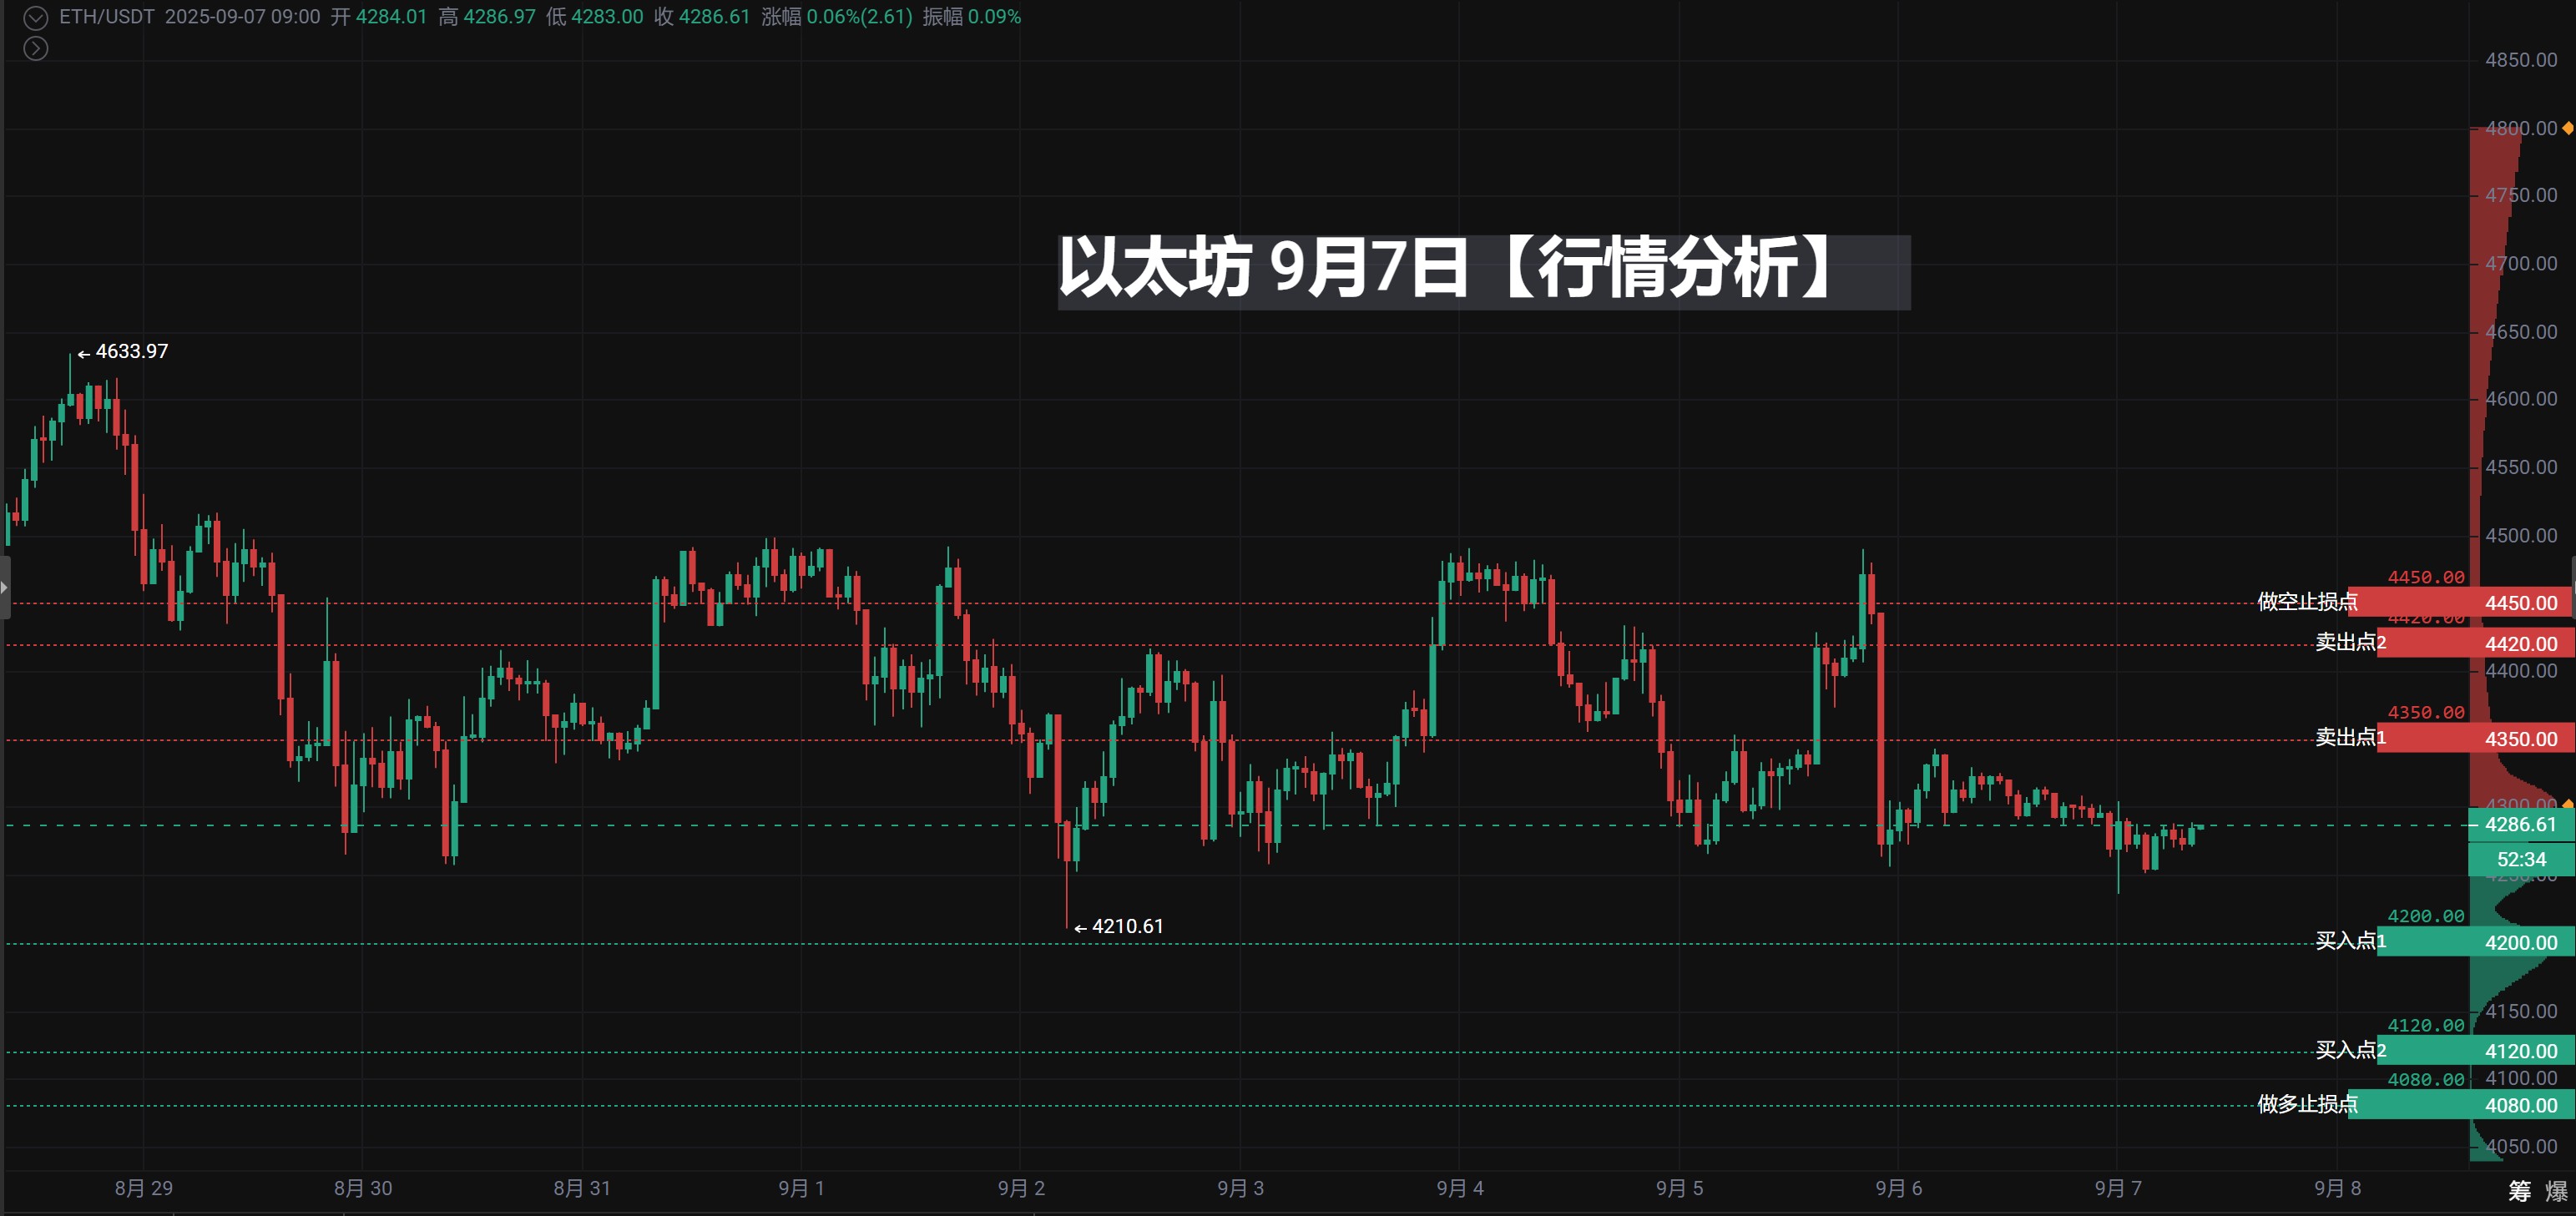
The daily chart shows recent prices oscillating around 4300, entering a consolidation phase after significant fluctuations. On September 5, a long upper shadow appeared, indicating heavy selling pressure above.
The 4-hour candlestick chart shows alternating small bearish and bullish candles, overall leaning weak, with the current price close to the short-term high point area (4288-4300), facing certain pressure.
Technical Indicators:
MACD: In the 4-hour cycle, both DIF and DEA are below the zero line, with green bars shortening, but no clear golden cross signal has formed yet. Bearish strength is weakening but has not yet turned strong.
RSI: The current value is around 44, in a neutral to weak range, not entering oversold or overbought areas, indicating relatively cautious market sentiment.
EMA: The price is running below EMA7, and EMA7 < EMA30 < EMA120, with short, medium, and long-term moving averages showing a bearish arrangement, indicating a bearish trend; at the same time, EMA7 (4287) is very close to the current price, which may constitute short-term resistance.
Trading Volume:
Daily trading volume is gradually shrinking, falling from a significant increase on September 5 to the current low level, indicating strong wait-and-see sentiment from both bulls and bears.
The 4-hour trading volume has also significantly decreased, with market activity declining and lacking clear directional momentum in the short term.
Trading Strategy Analysis and Optimization Suggestions
Technical Point Evaluation
Ethereum trading plan, I have conducted a professional evaluation of each key point:
Operation Direction
Price Level (USDT)
Technical Basis
Risk Assessment
Recommended Position
Buy Point One
4,200
Previous low area + round number
⭐⭐☆☆☆
30% of funds
Buy Point Two
4,120
Strong support range
⭐⭐⭐⭐⭐
50% of funds
Long Stop Loss
4,080
Trend break protection
⭐⭐⭐⭐☆
Strict execution
Sell/Take Profit One
4,350
EMA30 resistance + round number
⭐⭐⭐☆☆
Reduce position by 50%
Sell/Take Profit Two
4,420
Strong resistance area
⭐⭐⭐⭐⭐
Close all positions
Short Stop Loss
4,450
Breakout protection
⭐⭐⭐⭐☆
Light position operation
Execution Strategy Suggestions
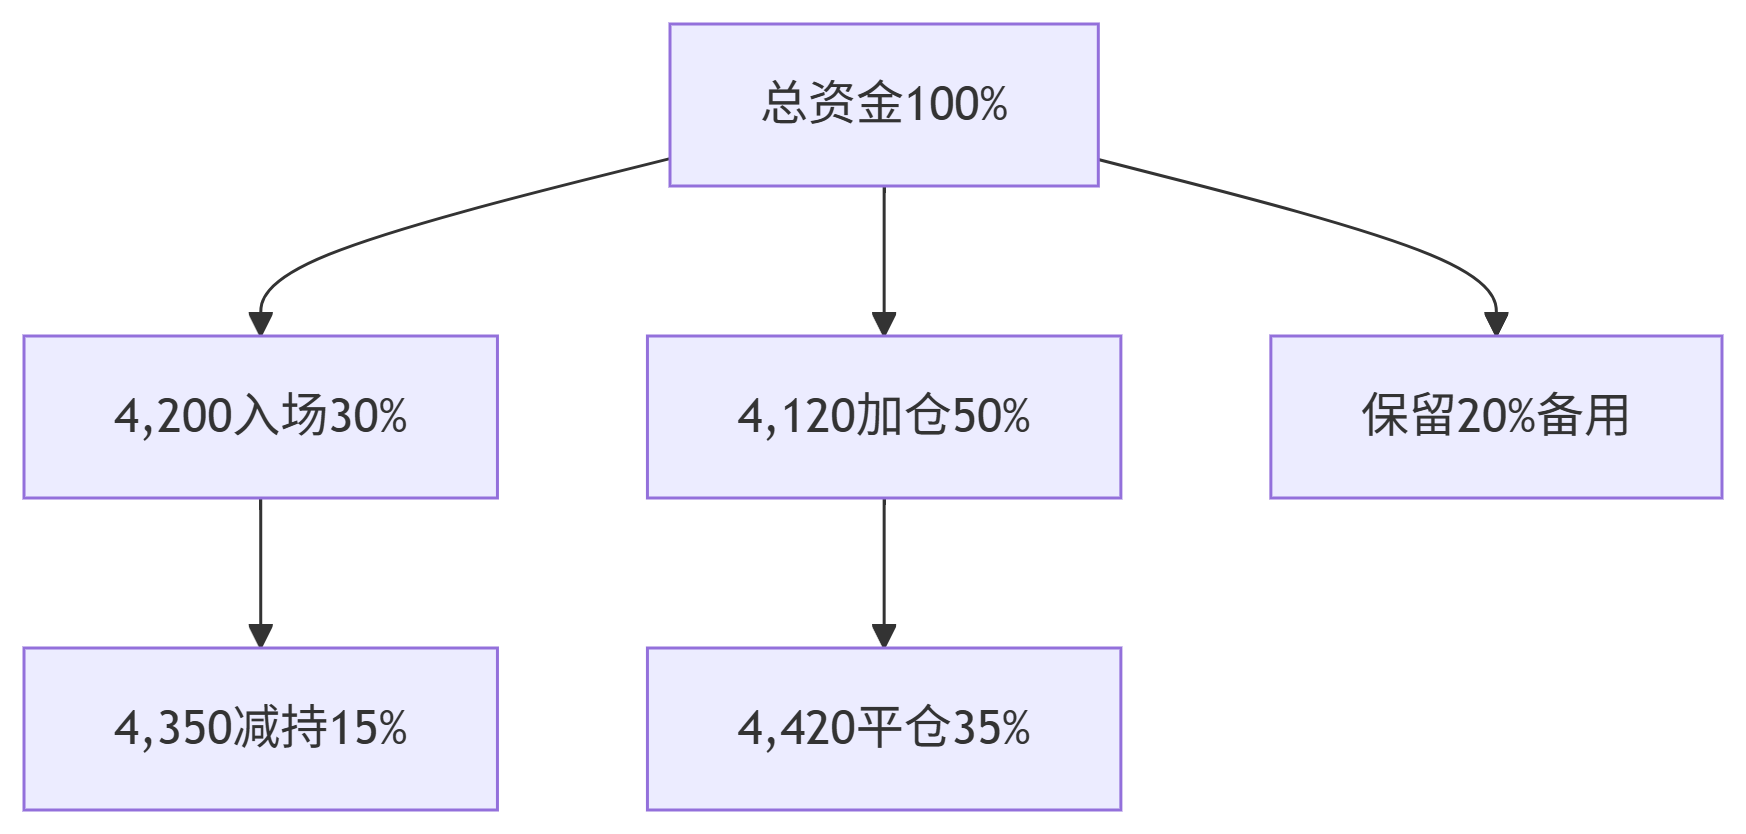
- Position Management Plan
Key Technical Level Analysis
4,120 Support: Near the low point of August 29, exhibiting strong support characteristics
4,350 Resistance: EMA30 moving average resistance + round number, an important resistance level
4,420 Strong Resistance: 4400-4430 resistance area, difficult to break through
Risk-Reward Ratio Calculation
Bullish Strategy: Risk of 120 points, potential return of 300 points, risk-reward ratio of 1:2.5
Bearish Strategy: Risk of 30 points, potential return of 70 points, risk-reward ratio of 1:2.33
Optimization Suggestions
Entry Timing Optimization
Wait for a bullish engulfing or pin bar signal near 4,200
Look for signals of a second test not breaking near 4,120
Use RSI oversold signals as auxiliary confirmation
Take Profit Strategy Adjustment
It is recommended to reduce position by 50% at 4,350
Close all positions at 4,420
Consider using trailing stop loss to protect profits
Alternative Plan Preparation
If there is a direct breakout above 4,450, consider going long
If it breaks below 4,080, consider light shorting
Reserve 20% of funds for unexpected situations
Risk Warning
Main Risk Points
Divergence between volume and price leading to support failure
Sudden news events impacting the market
Insufficient market liquidity
Risk Control Measures
Control the risk of a single trade within 2% of total funds
Set both hard stop loss and psychological stop loss as double insurance
Avoid holding heavy positions overnight
Summary
This trading plan has the following advantages: ✅ Sufficient technical basis ✅ Reasonable risk-reward ratio ✅ Clear stop loss settings ✅ Scientific position management
Execution Focus Suggestions:
Prioritize monitoring the performance of the strong support level at 4,120
Gradually take profit at 4,350 and 4,420
Strictly execute stop loss discipline at 4,080
Maintain light and cautious positions for short trades
Please note that all market analysis and strategies carry uncertainties. The above content is merely a summary based on the information you provided and does not constitute any investment advice. Please make your own judgments based on real-time market conditions and always prioritize risk control.
Wishing you successful trading!
- Live explanations of real-time strategies at irregular hours
#Tencent Meeting: 919-948-0091
【The above analysis and strategies are for reference only. Risks are to be borne by yourself. The article review and publication may have delays, and strategies may not be timely. Specific operations should follow the real-time strategies of the crypto expert】
Join the group chat to discuss and learn professional knowledge in the crypto space, so as not to be the chives under the scythe (you can receive position allocation strategies, teaching you how to make money in a bull market and earn coins in a bear market)
——Crypto Expert Community, a community focused on technical analysis. Anyone with questions about operations or trends can communicate and learn with me! Share and profit together! Remember the crypto expert, available 24/7, follow the crypto expert to avoid getting lost!

Scan the QR code with WeChat to follow my public account
免责声明:本文章仅代表作者个人观点,不代表本平台的立场和观点。本文章仅供信息分享,不构成对任何人的任何投资建议。用户与作者之间的任何争议,与本平台无关。如网页中刊载的文章或图片涉及侵权,请提供相关的权利证明和身份证明发送邮件到support@aicoin.com,本平台相关工作人员将会进行核查。


