How much funding rate has been earned in the crypto market?
Author: Basit | Σ:
Translation: Deep Tide TechFlow
20 hours of research turned into a 5-minute read.
TL;DR
The amount paid in funding rates on the Hyperliquid platform has reached millions of dollars.
On Binance, this figure has even reached hundreds of millions of dollars, while data from other platforms remains unclear.
The calculation method is overly simplistic; if you don't understand it, feel free to skip it.
Mechanisms once used to facilitate fair market participation have now become a harvest ground for arbitrageurs.
Introduction
Funding rates are fees paid periodically between traders (longs/shorts) to balance the premium price of perpetual contracts with the spot price.
This seemingly insignificant sporadic payment has been transformed by savvy players (yield operators) into millions of dollars in fee income.
Therefore, I conducted a study to explore how much people have "arbitraged" through funding rates. This also means, "How much funding rate has been paid in total among traders?"
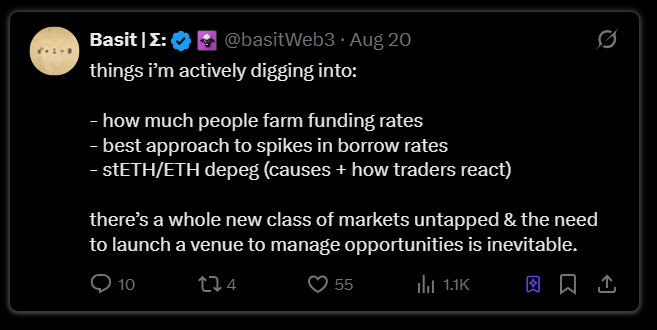
“I am actively researching the following:
How much people have earned through funding rate arbitrage
The best strategies to cope with extreme fluctuations in borrowing rates
The reasons for the decoupling of stETH/ETH and traders' reactions
A brand new market domain has yet to be developed, and launching a platform to manage these opportunities is imperative.”
Original tweet link: Click here
To clarify this, we need to explain the following:
The total amount of funding rates paid historically in the cryptocurrency perpetual contract market (this figure may be shocking, reaching hundreds of millions of dollars or more).
The total amount of funding rates for a specific exchange (e.g., Binance, Bybit, Hyperliquid, dYdX, etc.).
The total amount of funding rates for a single asset (e.g., the total amount for ETH perpetual contracts since launch or annual data).
The short answer is: Currently, there are no publicly available statistics that can show the "total funding rate payments for all cryptocurrency perpetual contracts." Most exchanges and data providers publish funding rates, open interest, and historical data, but no one aggregates the funding payment data from each platform into an official total.
But next, I will:
Explain why an exact global total cannot exist;
Show a simple and correct method to estimate this number;
Provide a transparent rough estimate (range), including:
→ The total annual funding rate globally;
→ A reasonable estimate for Binance;
→ A reasonable estimate for Hyperliquid.
Why is there no single "historical total funding rate payment" statistic?
Funding rate payments are peer-to-peer transfers between longs and shorts, recorded differently across various centralized exchanges (CEX), decentralized exchanges (DEX), and on-chain systems.
Although data providers (like @coinglass_com) offer funding rates, open interest, and historical charts, they do not publish a "total funding payment amount" statistic that covers all platforms and markets. This is because funding payments occur between traders, not directly processed by the platform.
To generate this data, we need to extract time series of funding rates × open interest from all relevant platforms and perform reasonable and assumable calculations.
In this study, I used the $ETH perpetual contract as the analysis subject.

Figure: ETH open interest statistics across different platforms
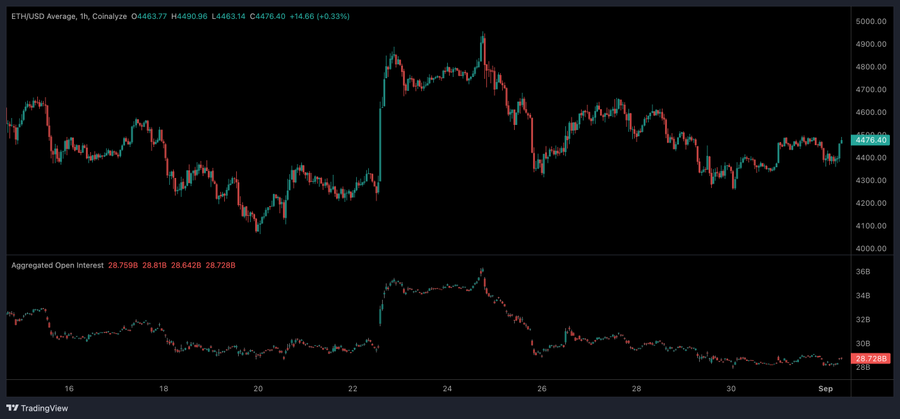
Figure: Summary of ETH open interest
Correct Method: How to Calculate Total Funding Rate
For any perpetual contract market and time window, we can calculate as follows:
Total funding rate payments ≈ Funding rate(t) × Open interest(t) × Δt
Where:
Funding rate(t) is the actual funding rate at timestamp (t);
Open interest(t) is the nominal open interest amount (in USD) at timestamp (t);
Δt is the length of the funding rate payment interval (usually 8 hours → Most centralized exchanges have 3 payment intervals per day).
By integrating historical data series from CoinGlass, we can calculate an accurate total funding rate.
My Estimation Method: Transparent and Based on Assumptions
I used assumptions ranging from conservative to liberal to obtain a range rather than a false single number:
Common Parameters:
Current date/time period: From the beginning of this year, i.e., January 1, 2025 → August 27, 2025, a total of 239 days (3 funding payment intervals per day → a total of 717 intervals).
Funding payment interval: Every 8 hours (3 times a day, applicable to Binance and many perpetual contracts).
Broad market open interest for ETH perpetual contracts (nominal value): I used three scenarios: average open interest amounts of $20 billion, $27.6 billion, and $30 billion (these numbers show low to high historical averages based on market cycles and whether all exchanges are included).
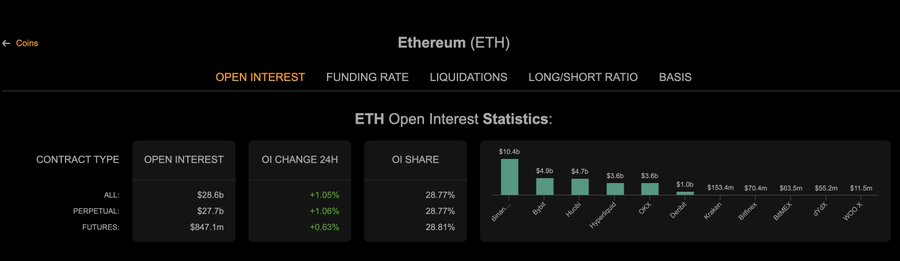
Figure: As you can see, the average open interest for ETH across all perpetual contracts is $27.7 billion.
- Average funding rate per interval (weighted by open interest):
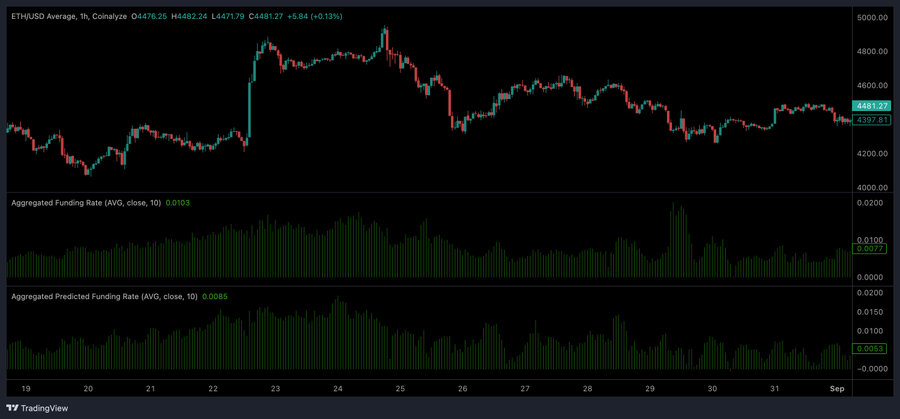
For this, I used the aggregated funding rate: 0.000103 (0.0103%) per 8-hour interval.
The funding rate is positive for longs and negative for shorts (usually close to zero, but occasionally peaks). These assumptions yield conservative to aggressive results.
Using the formula (for annual window):
Annual total funding rate ≈ Average open interest × Average funding rate per interval × (239 × 3)
Results - Global (Annual Rough Range)
(Based on the calculations from the above formula, for a period of 239 days)
Low scenario (open interest of $20 billion, average funding rate of 0.000103) → ≈ $1.48 billion
Medium scenario (current $ETH open interest of $27.6 billion, average funding rate of 0.000103) → ≈ $2.04 billion
High scenario (open interest of $30 billion, average funding rate of 0.000103) → ≈ $2.2 billion
Interpretation:
The real-world median range (current $ETH open interest) is about several billion dollars annually; during extreme leverage periods (high funding rates + high open interest), the annual total could reach hundreds of billions of dollars.
This is just a summary estimate (not an exact measurement) because we used average assumed values in the market (for $ETH). The above method and examples are also applicable to other markets, such as $BTC or $HYPE.
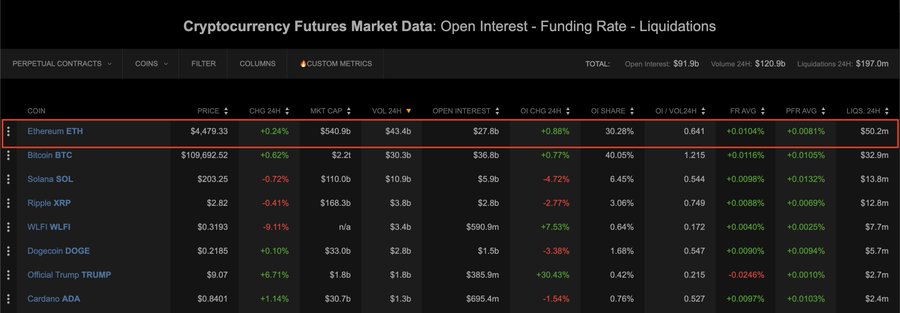
Figure: Average funding rate - $ETH
Results - Binance (Possible Market Share)
Binance holds a significant share of perpetual contract trading (I used about 17% market share as a reference; you can adjust this ratio as needed):
Applying the 17% market share to the above global estimate scenarios:
Low scenario → ≈ $251 million (239 days)
Medium scenario → ≈ $347 million
High scenario → ≈ $377 million
It seems like a huge number, but it is indeed very reasonable.
Results - Hyperliquid
Hyperliquid's scale is much smaller than Binance (though I believe this may change soon).
Assuming that the average open interest for Hyperliquid's $ETH perpetual contracts is about 5.3% (a very rough estimate). Using the same global estimate scenarios:
Calculations (Global Estimate Scenarios × Market Share of about 5.3%):
Low scenario ($1.48B) → ≈ $78.3 million (239 days)
Medium scenario ($2.04B) → ≈ $108 million
High scenario ($2.22B) → ≈ $117.4 million
Conclusion
Currently, there is no single public number that accurately describes the total funding rate; anyone claiming "total funding rate payments are $X" is actually basing it on multiple sources and assumptions (just like I did).
The actual annual global funding rate payments may range from several billion dollars to hundreds of billions of dollars, depending on market conditions (my median estimate is about $2 billion to $5 billion/year, under reasonable assumptions).
Binance's annual funding rate payments (or the transfer of funds involved) could reach hundreds of millions of dollars, depending on market share and fluctuations in funding rates.
In contrast, Hyperliquid is smaller in scale, with its annual payments potentially ranging from several million to hundreds of millions, depending on its average open interest.
This is an interesting study full of assumptions.
If you made it this far, you are a true research enthusiast. Many people might not have even finished reading the first summary.
Your brain might be "overheating"… Sorry about that :)
免责声明:本文章仅代表作者个人观点,不代表本平台的立场和观点。本文章仅供信息分享,不构成对任何人的任何投资建议。用户与作者之间的任何争议,与本平台无关。如网页中刊载的文章或图片涉及侵权,请提供相关的权利证明和身份证明发送邮件到support@aicoin.com,本平台相关工作人员将会进行核查。


