ETH/BTC MACD Crossover: Why $5K for Altcoin and $112K Bitcoin Matter?
The crypto market is buzzing with one question: Will the ETH/BTC MACD Crossover bullish signal bring another 4.5x rally?
Last time this pattern appeared, Ethereum crushed Bitcoin’s performance and pulled the whole altcoin market into a strong uptrend.
Now, the same pattern is back on the charts. Traders are asking—could history repeat in 2025–26? Let’s break down what’s coming next.
What Is the $ETH/BTC MACD Crossover and Why It Matters
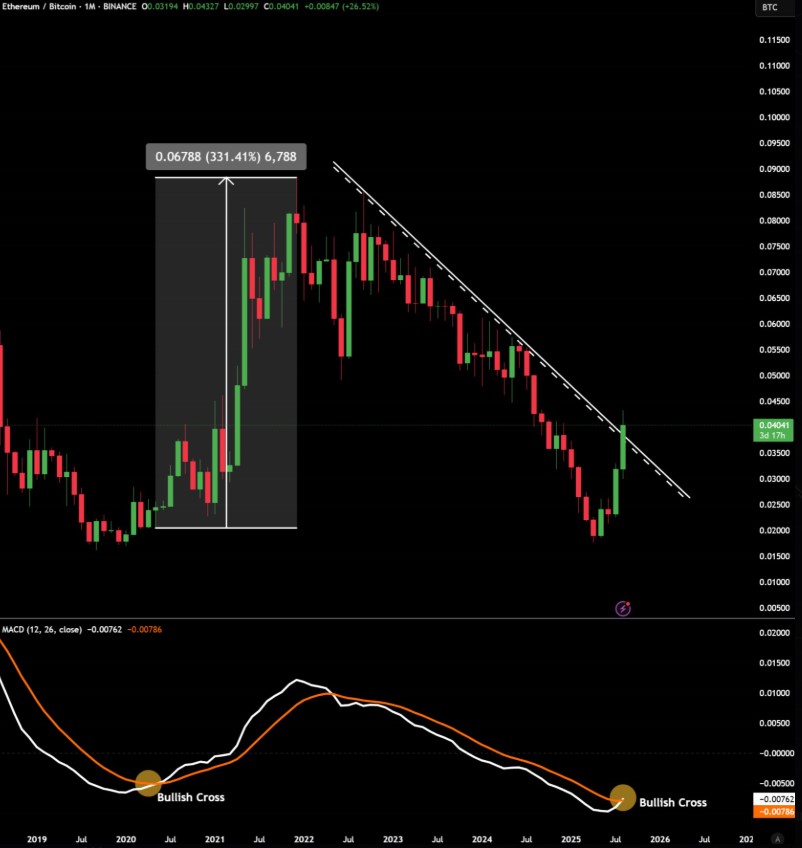
The ETH/BTC MACD Crossover has once again triggered excitement across the crypto landscape. Analyst ASH Crypto shared a chart on X showing the pair breaking its long downtrend while confirming this bullish cross.

The last time this happened Ethereum spiked 4.5x against Bitcoin in under a year, triggering a serious altcoin rally.
This is not just another chart pattern - it historically signaled a shift in ETH vs BTC market dominance and set the stage for Altseason 2025 news to unfold .
Ethereum’s Price Setup: Eyes on the $5,000 Breakout
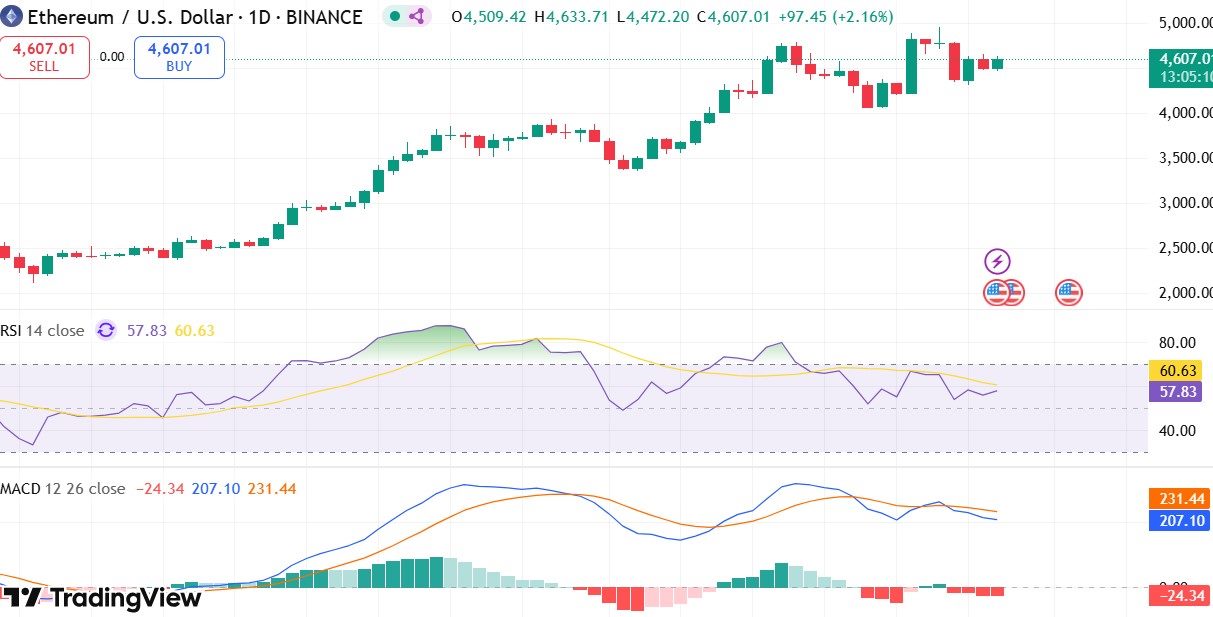
At the time of writing, the token is trading at $4,607 (+2.16%), showing strength as it nears the important $5,000 breakout level.

-
Based on my TradingView chart analysis, RSI at 57.8: Bullish, but not overextended.
-
MACD momentum: bearish pressure fading, bullish potential rising.
-
Upside targets: $6,000–$8,000 if the $5K barrier is breached.
-
Downside risk: A slip under $4,400 may drag the coin toward $4,200.
Adding urgency, analyst Wimar on his X account highlighted that over $6 billion in shorts will be liquidated if Ethereum price breakout $5,000 .
Bitcoin Resistance at $112K : The Gatekeeper for Both Coins
The world's largest cryptocurrency, meanwhile, is trading at $112,965 (+1.74%), with 24-hour trading volume up 3.42% at $64.07B. The market is watching the $109K–$112K resistance zone closely:
-
A weekly close above $112K could extend the rally.
-
Drop below $109K risks a correction toward $97K.
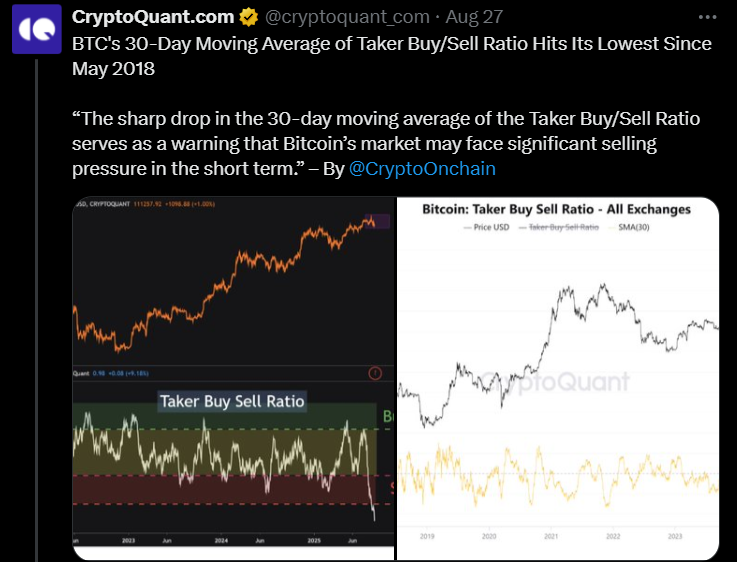
According to CryptoQuant data , its 30-day moving average of the Taker Buy/Sell Ratio has fallen to its lowest since 2018.

This shows growing selling pressure—a red flag for the token’s near-term resilience. The bitcoin chart analysis highlights a possible cooling phase if buyers fail to defend this pivot.
ETH/BTC News Today: The Hidden Driver of Altseason
The ETH/BTC ratio chart has broken multi-quarter highs, aligning with the crossover signal. Historically, when Ethereum outperforms Bitcoin, liquidity rotates into Layer-2 projects, DeFi tokens, and staking assets, expanding into a full market rally.
Supporting factors now include:
-
ETF optimism boosting institutional flows.
-
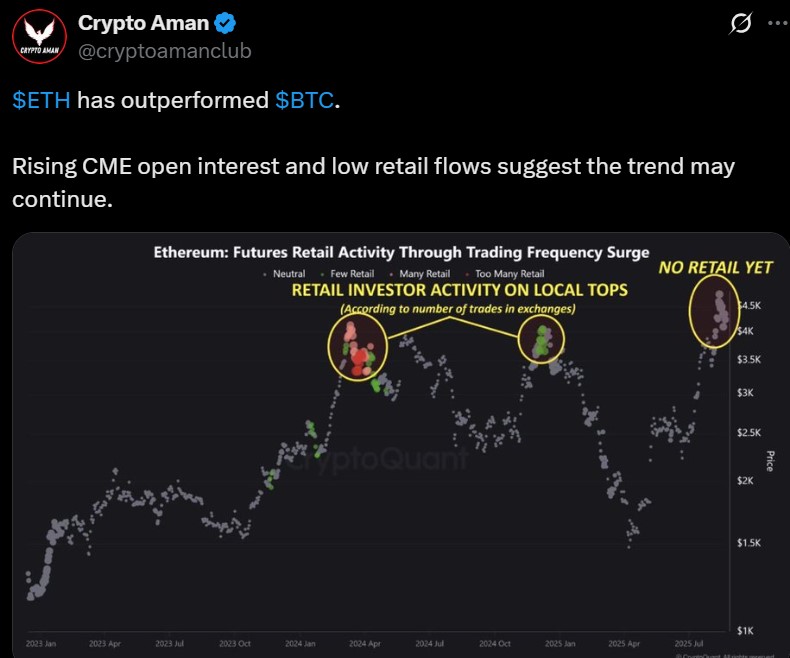
Rising CME open interest signaling higher professional exposure.
-
Reduced retail activity, meaning smart money is in control.
-
Supply lock-up on exchanges, cutting immediate sell pressure.
As seen in the below chart, ETH is already outperforming BTC , and with macro forces like ETFs at play, this trend may only strengthen.

Conclusion: Could This Be a 4.5x Rally for Both or Only One?
The central debate is whether this rally will crown Ethereum as the sole leader, or if both giants can climb together. A dual breakout could lead to one of the strongest years in history.
-
If Ethereum dominates, expect capital rotation and a wave of altcoin growth tied to its ecosystem.
-
If Bitcoin holds $112K resistance and rallies, both may deliver a bullish 4.5x ETH/BTC MACD crossover rally—a dual momentum rarely witnessed in crypto history.
So as per my analysis being a crypto expert, the next few weeks could define the entire 2025–26 cycle. Keep an eye on both the tokens and always do your own research before investing in any cryptocurrency to avoid high risks.
免责声明:本文章仅代表作者个人观点,不代表本平台的立场和观点。本文章仅供信息分享,不构成对任何人的任何投资建议。用户与作者之间的任何争议,与本平台无关。如网页中刊载的文章或图片涉及侵权,请提供相关的权利证明和身份证明发送邮件到support@aicoin.com,本平台相关工作人员将会进行核查。


