Bitcoin’s daily chart paints a distinctly bearish picture, characterized by a sequence of lower highs and lower lows. A notable price floor has formed near $110,671, evidenced by a volume spike that may indicate a temporary bottom or capitulation event. The chart also reveals a series of bearish engulfing candlesticks, with sellers dominating the recent sessions. The lack of follow-through on rebounds supports the prevailing downtrend and signals a cautionary stance for potential buyers.
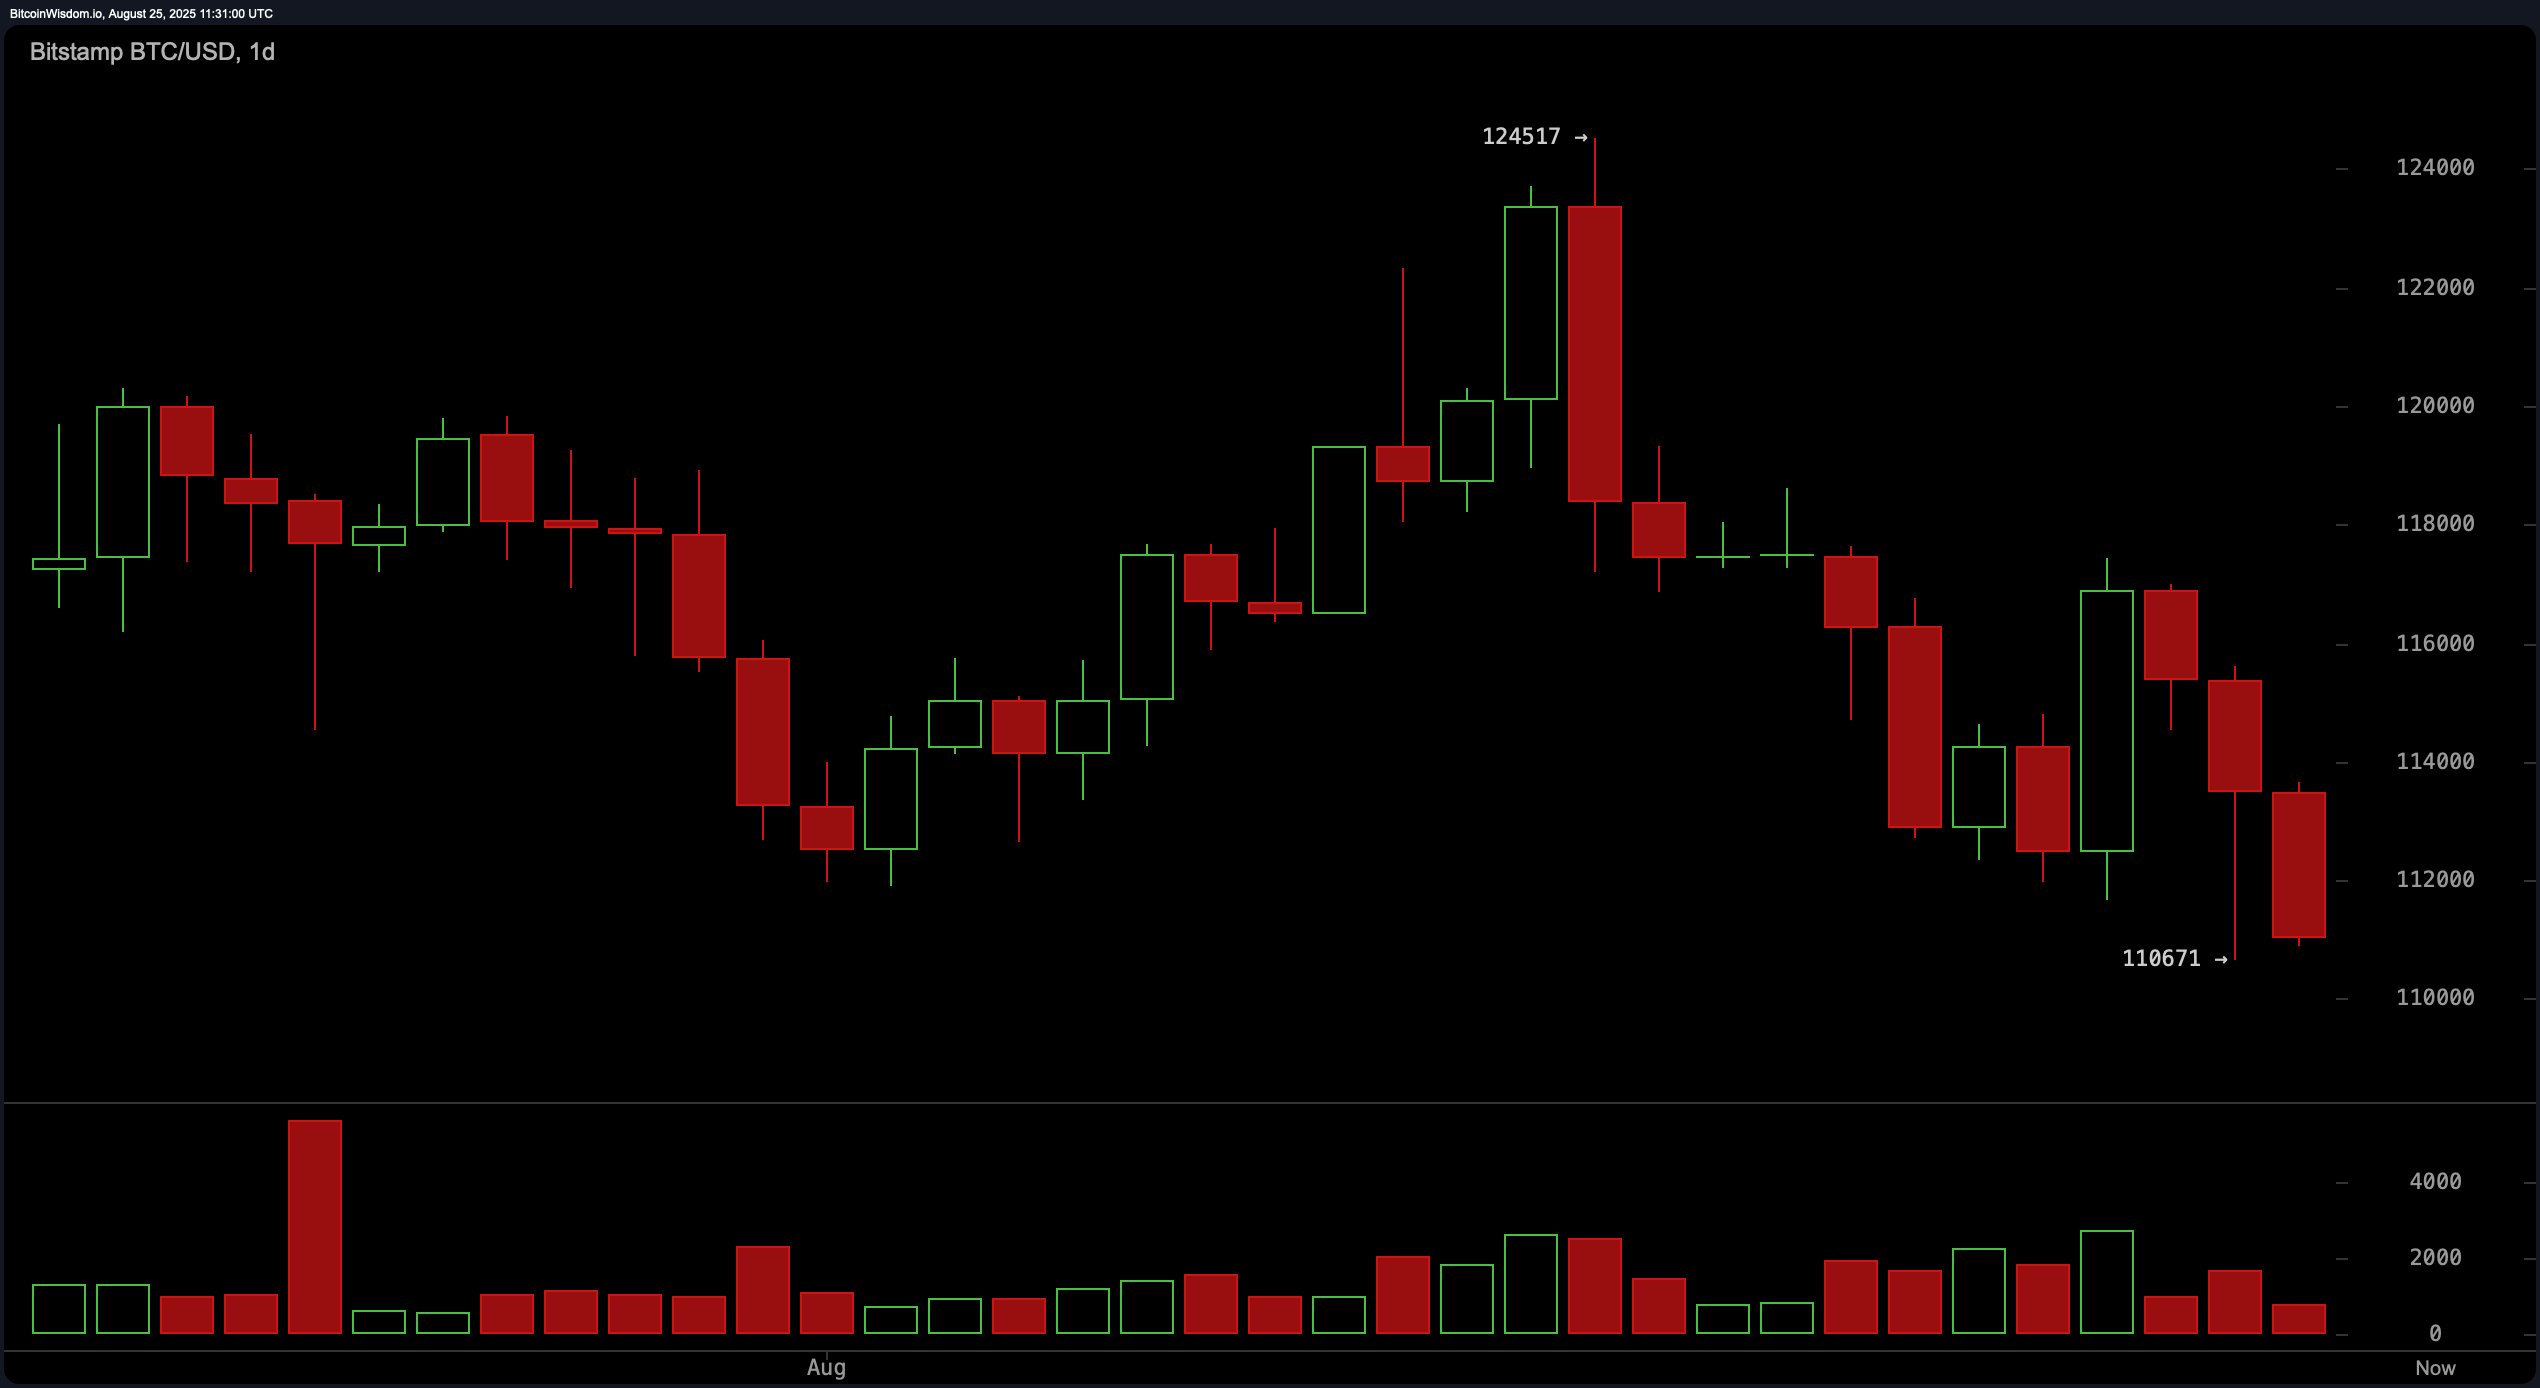
BTC/USD daily chart via Bitstamp on Aug. 25, 2025.
The 4-hour chart reinforces the daily trend, showing a sharp rejection at $117,421 followed by a sustained downward move. This timeframe reflects a failed attempt to reclaim key resistance zones, with the price structure suggesting that any bullish effort is met with immediate sell pressure. Twice revisiting the $110,671 level hints at a potential double bottom, though the muted volume on the subsequent bounce casts doubt on the strength of support. The broader structure continues to favor the bears.
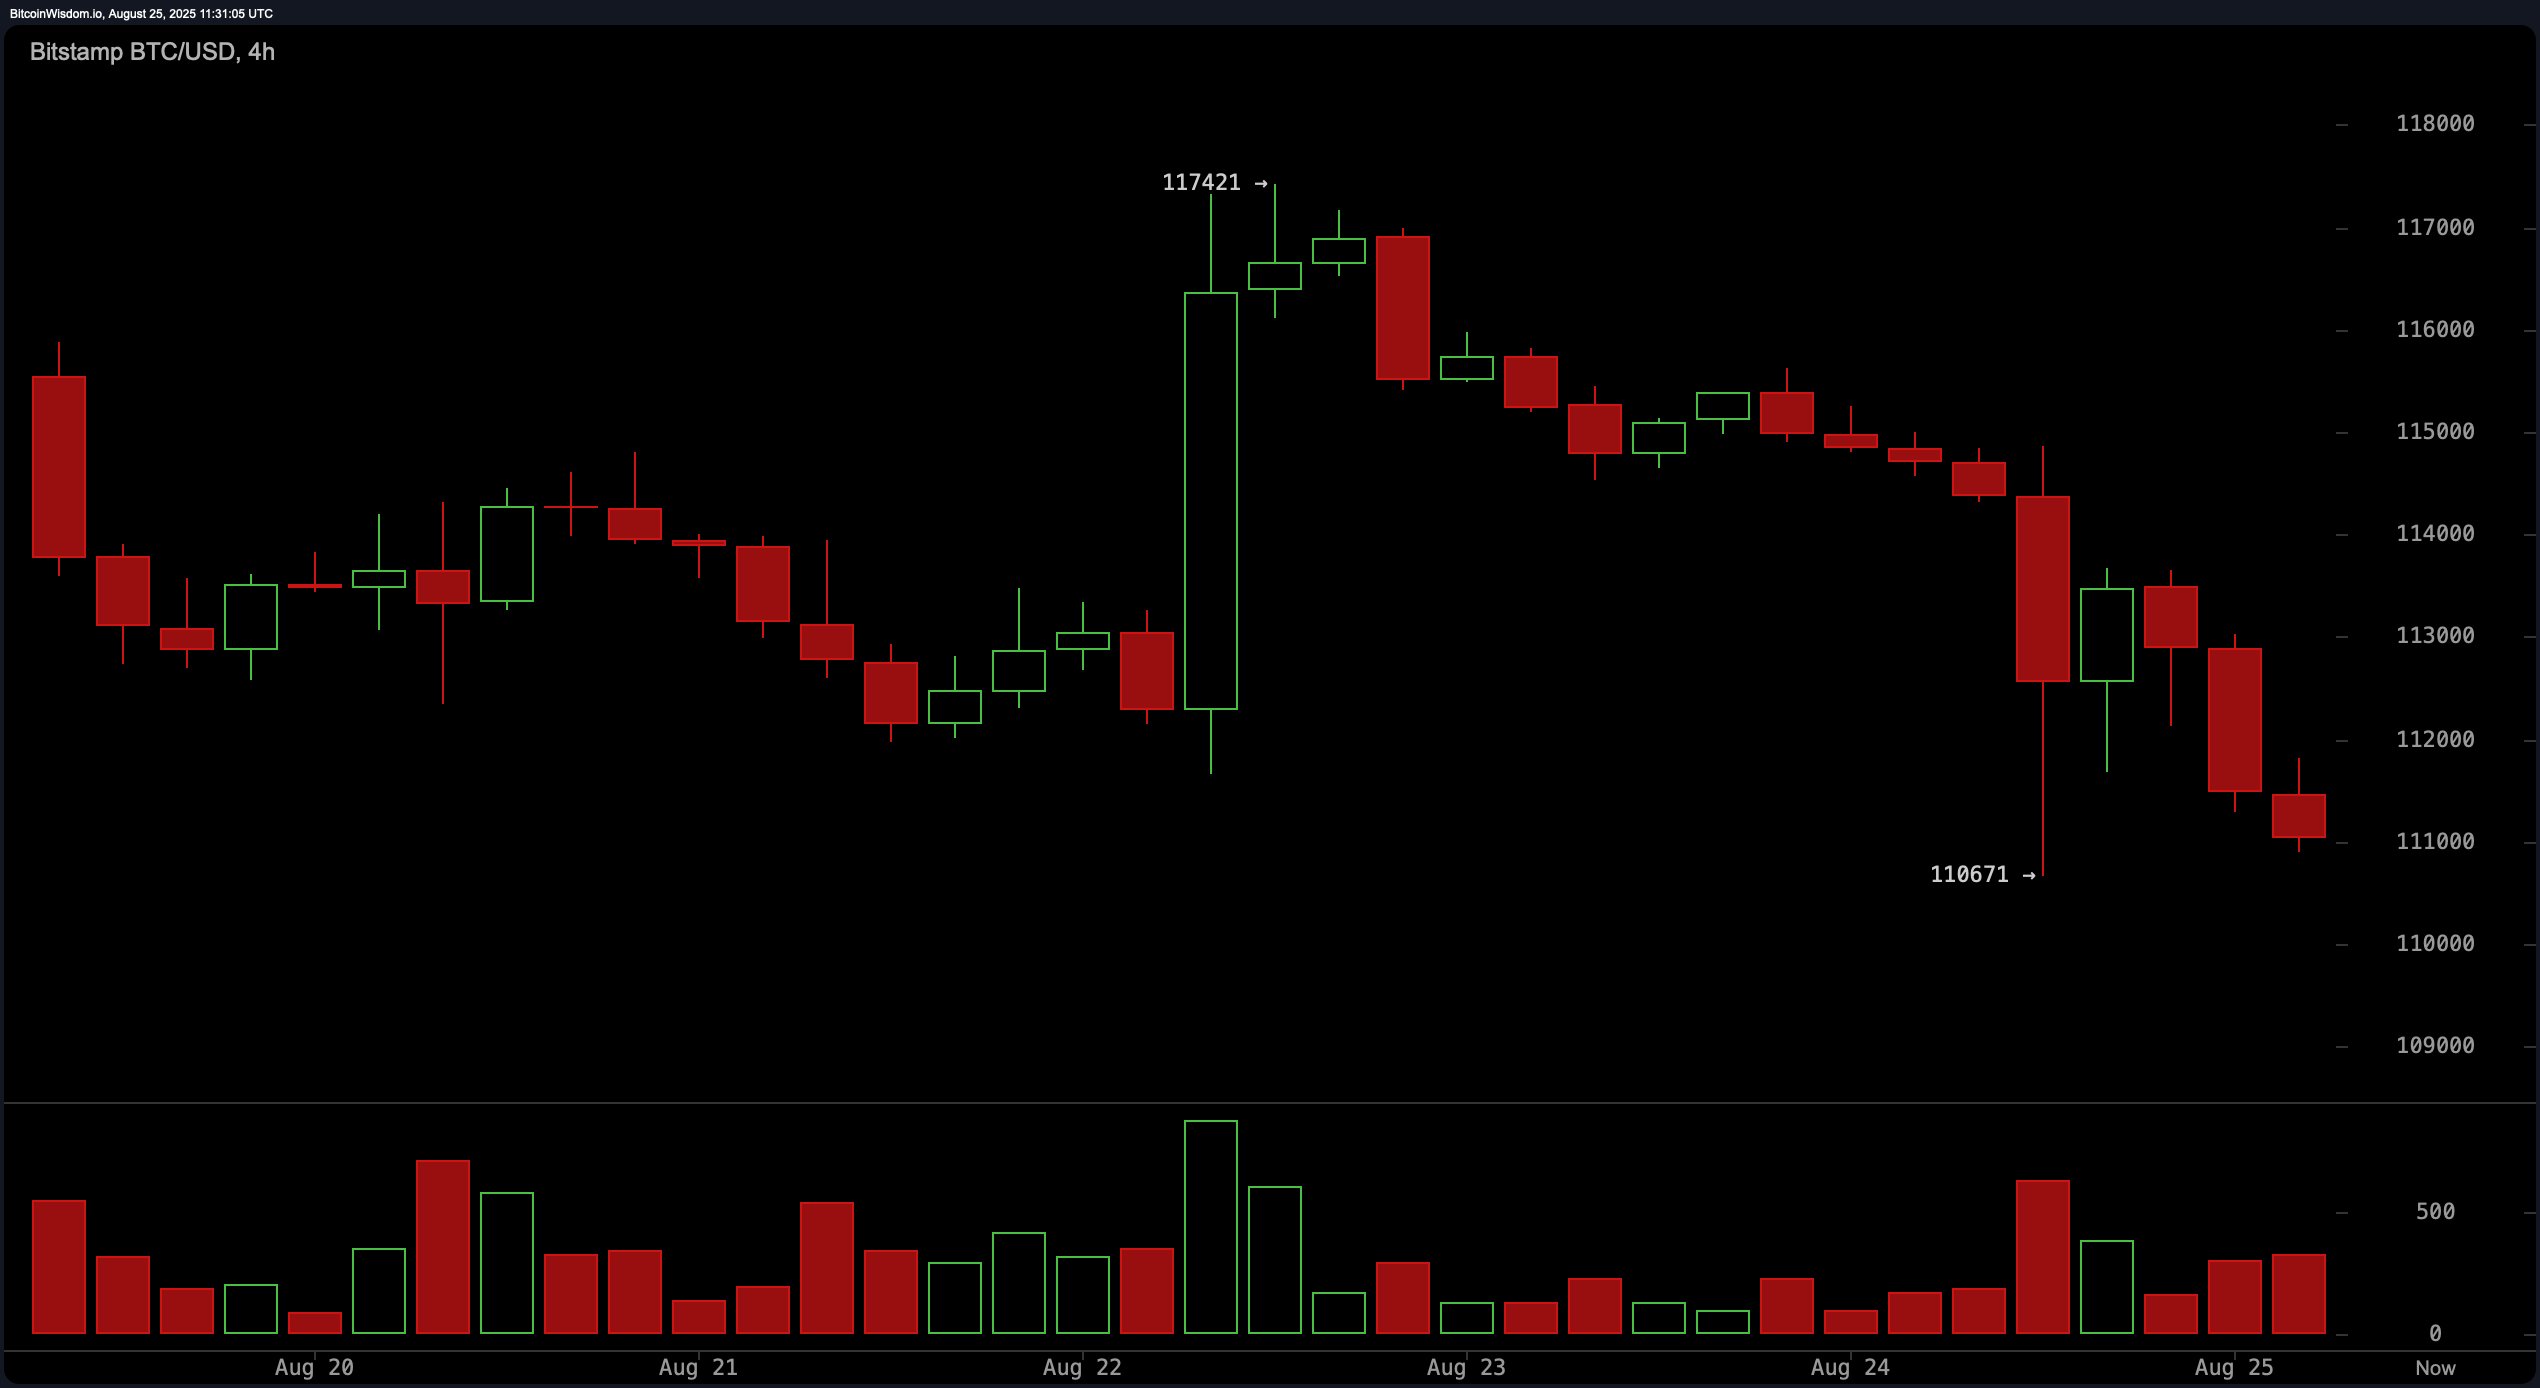
BTC/USD 4-hour chart via Bitstamp on Aug. 25, 2025.
On the 1-hour chart, a significant sell-off candle plunged bitcoin toward the $110,671 zone, followed by a cluster of indecision candles indicating hesitation among market participants. Weak rebound efforts, capped below $113,000, suggest that sellers maintain control. The volume profile aligns with a classic dead cat bounce scenario—high volume during the drop, low volume on recovery—pointing to potential distribution phases rather than accumulation.
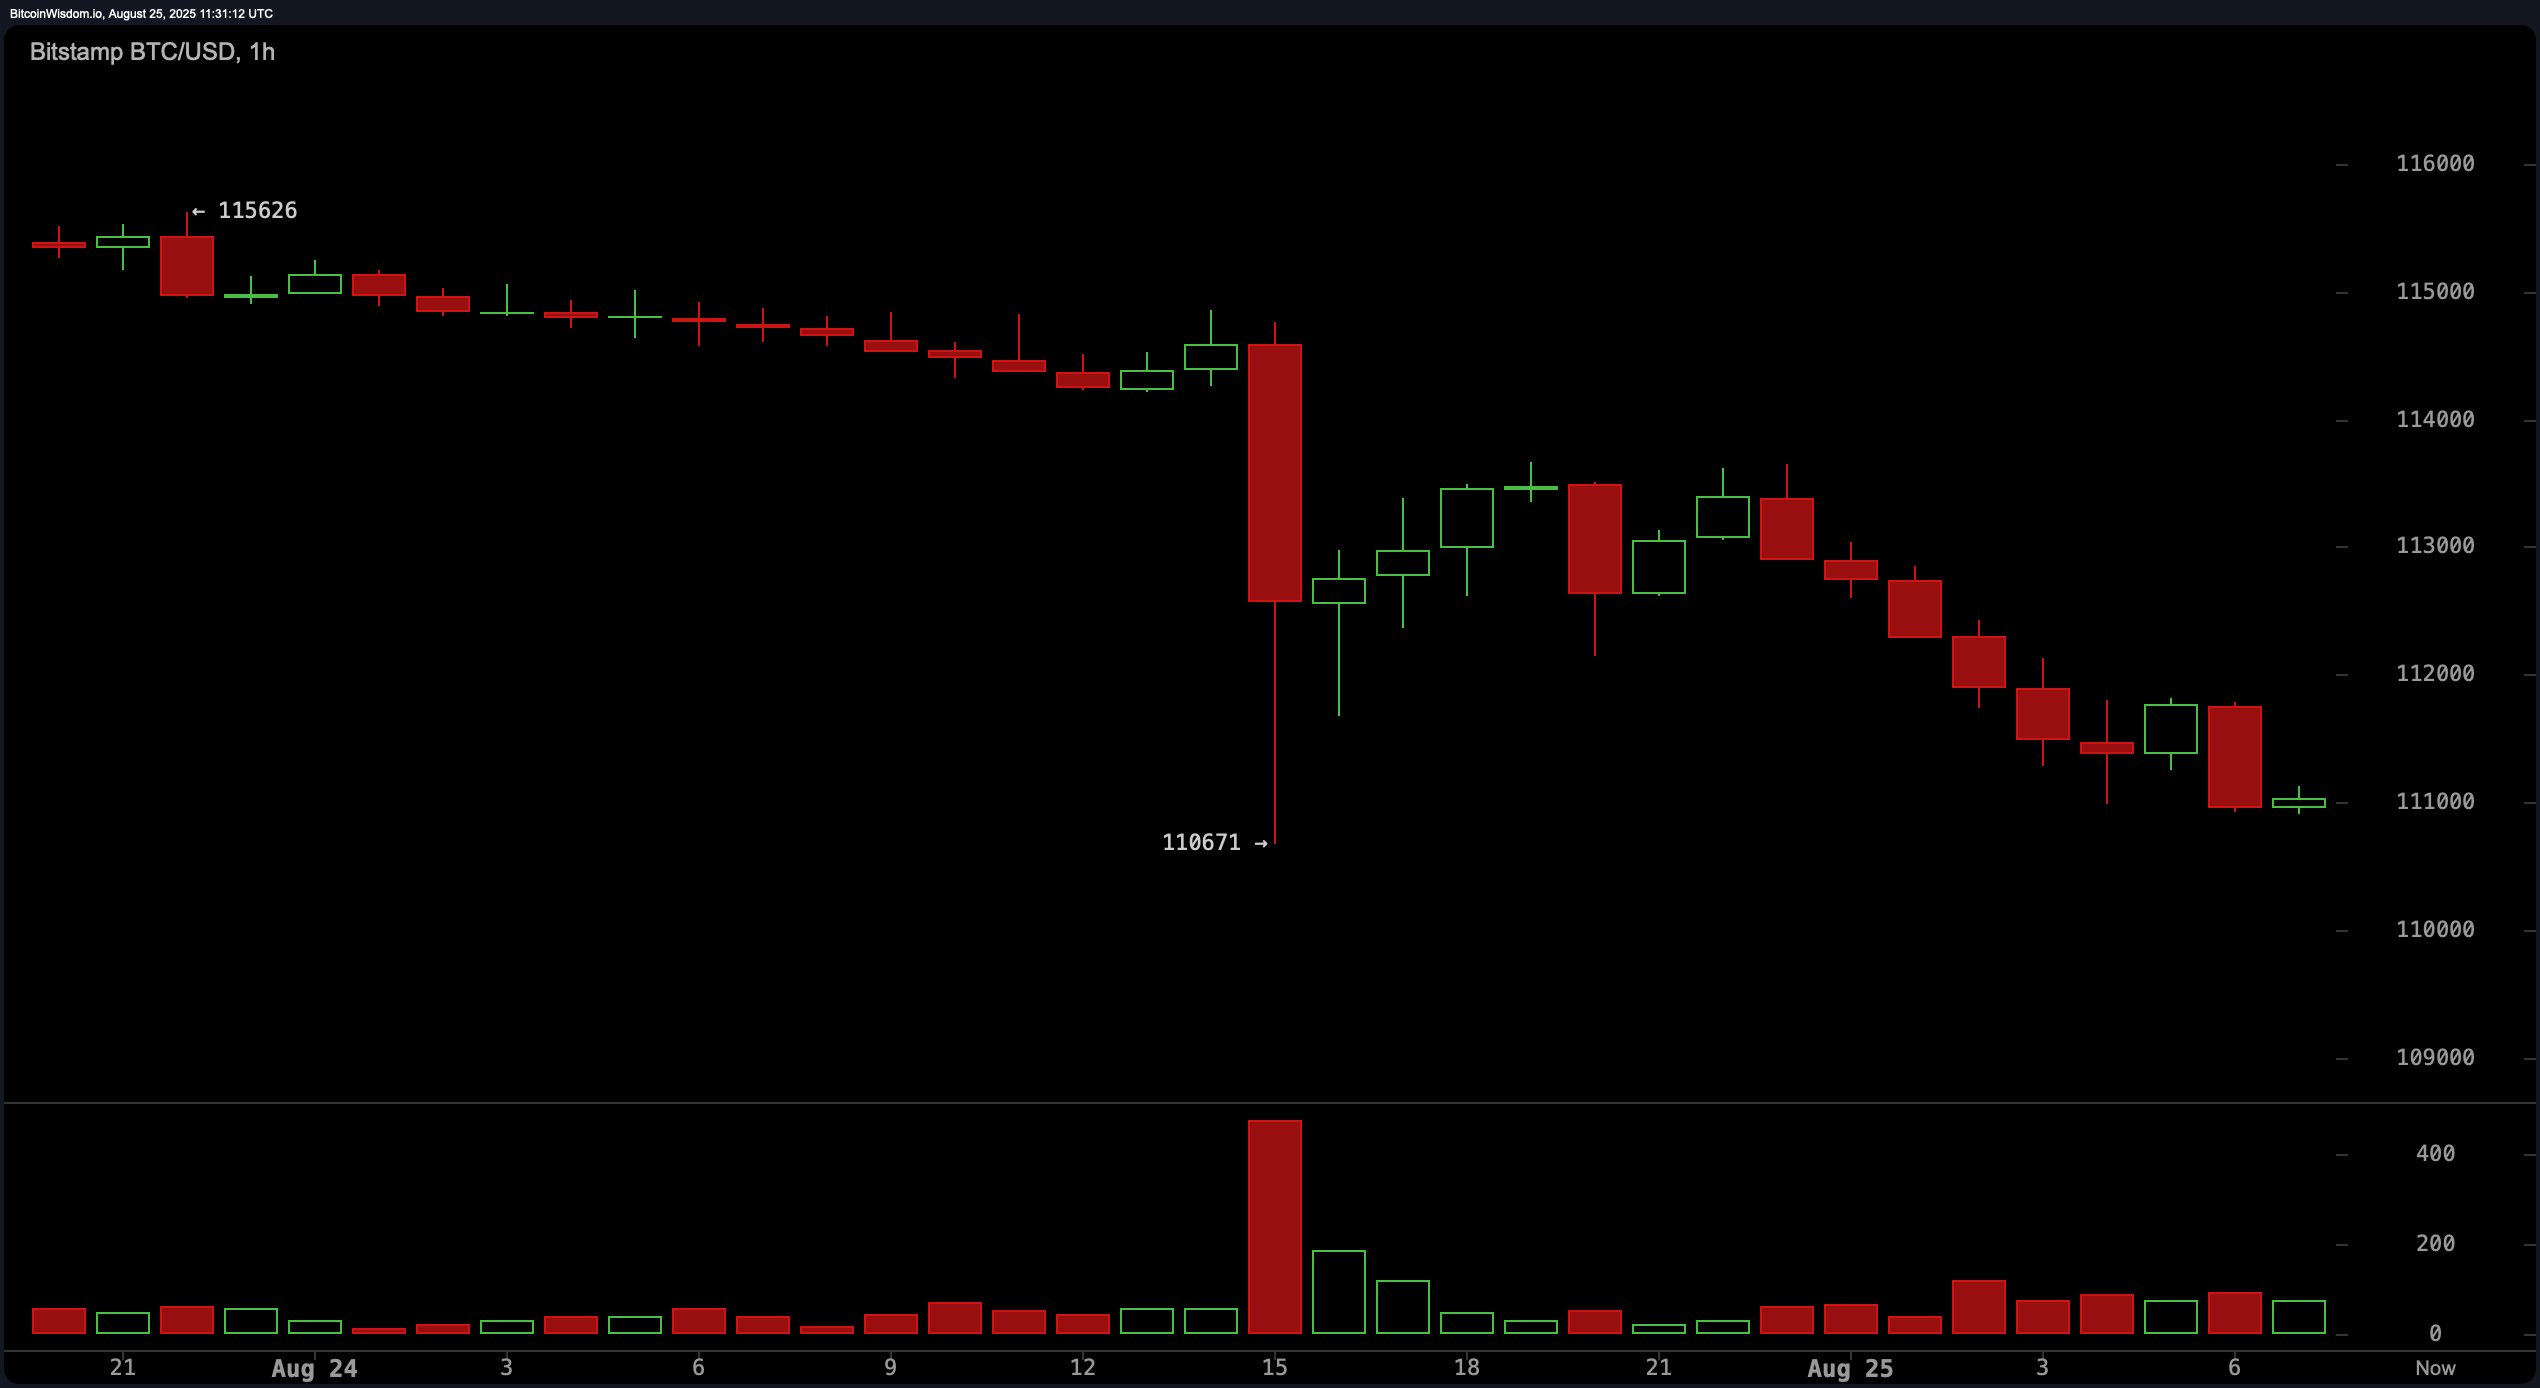
BTC/USD 1-hour chart via Bitstamp on Aug. 25, 2025.
Oscillator readings across the board highlight a neutral-to-bearish momentum setup. The relative strength index (RSI) stands at 40, and the Stochastic oscillator at 17, both reflecting neutral sentiment. The commodity channel index (CCI) at −148 and the average directional index (ADX) at 16 add to this narrative of weak trend strength. Notably, momentum registers at −6,395, and the moving average convergence divergence (MACD) level sits at −789, both in a bearish zone, confirming downward momentum.
Moving averages (MAs) provide a similarly bearish outlook. Short- to mid-term signals are overwhelmingly negative: the 10-period exponential moving average (EMA) at $114,593 and the 10-period simple moving average (SMA) at $114,763 both signal negativity, as do all EMAs and SMAs up to the 50-period range. Long-term trends offer a more mixed view, with the 100-period EMA at $110,856 suggesting positivity, while the 100-period SMA at $111,565 still leans bearish. The 200-period EMA at $103,703 and 200-period SMA at $100,866 indicate long-term support remains intact, though this has yet to influence shorter-term sentiment.
In summary, technical indicators across all major timeframes suggest that bitcoin remains under strong bearish pressure. For short positions, optimal entries lie near the $113,000 to $114,000 rejection zone or on a confirmed breakdown below $110,500, with exit targets at $111,000 and $108,000, respectively. Long positions should be approached with caution and only considered upon reclaiming $114,500 with significant volume or a confirmed double bottom at $110,000, with exit targets at $114,000 and $117,000. Until these thresholds are met, the bias remains clearly to the downside.
Bull Verdict:
Despite the prevailing bearish sentiment, long-term moving averages and the potential formation of a double bottom offer cautious optimism for bulls. A decisive reclaim of $114,500 with strong volume could shift momentum, opening a path toward $117,000 and possibly reversing the current downtrend.
Bear Verdict:
All major indicators across timeframes point to continued bearish control, with weak rebounds and sustained rejection at resistance levels. Unless bitcoin can reclaim and hold above $114,000, the path of least resistance remains to the downside, with increased risk of a drop below $110,500 toward the $108,000–$106,000 range.
免责声明:本文章仅代表作者个人观点,不代表本平台的立场和观点。本文章仅供信息分享,不构成对任何人的任何投资建议。用户与作者之间的任何争议,与本平台无关。如网页中刊载的文章或图片涉及侵权,请提供相关的权利证明和身份证明发送邮件到support@aicoin.com,本平台相关工作人员将会进行核查。


