Leverage increases, profit-taking, and intensified speculation are all characteristics of the mature stage of the market in history.
Written by: UkuriaOC, CryptoVizArt, Glassnode
Translated by: AididiaoJP, Foresight News
Abstract
Despite Bitcoin reaching a new all-time high of $124,400, its capital inflow continues to decline. This period of weak capital inflow highlights a significant decrease in investor demand willingness at this stage.
As Bitcoin's price reached its historical peak, the total open contracts of mainstream altcoins also hit a record high of $60 billion, underscoring the high level of market leverage. However, this situation is temporary, as the price correction led to a reduction of $2.6 billion in open contracts, marking the tenth largest decline on record.
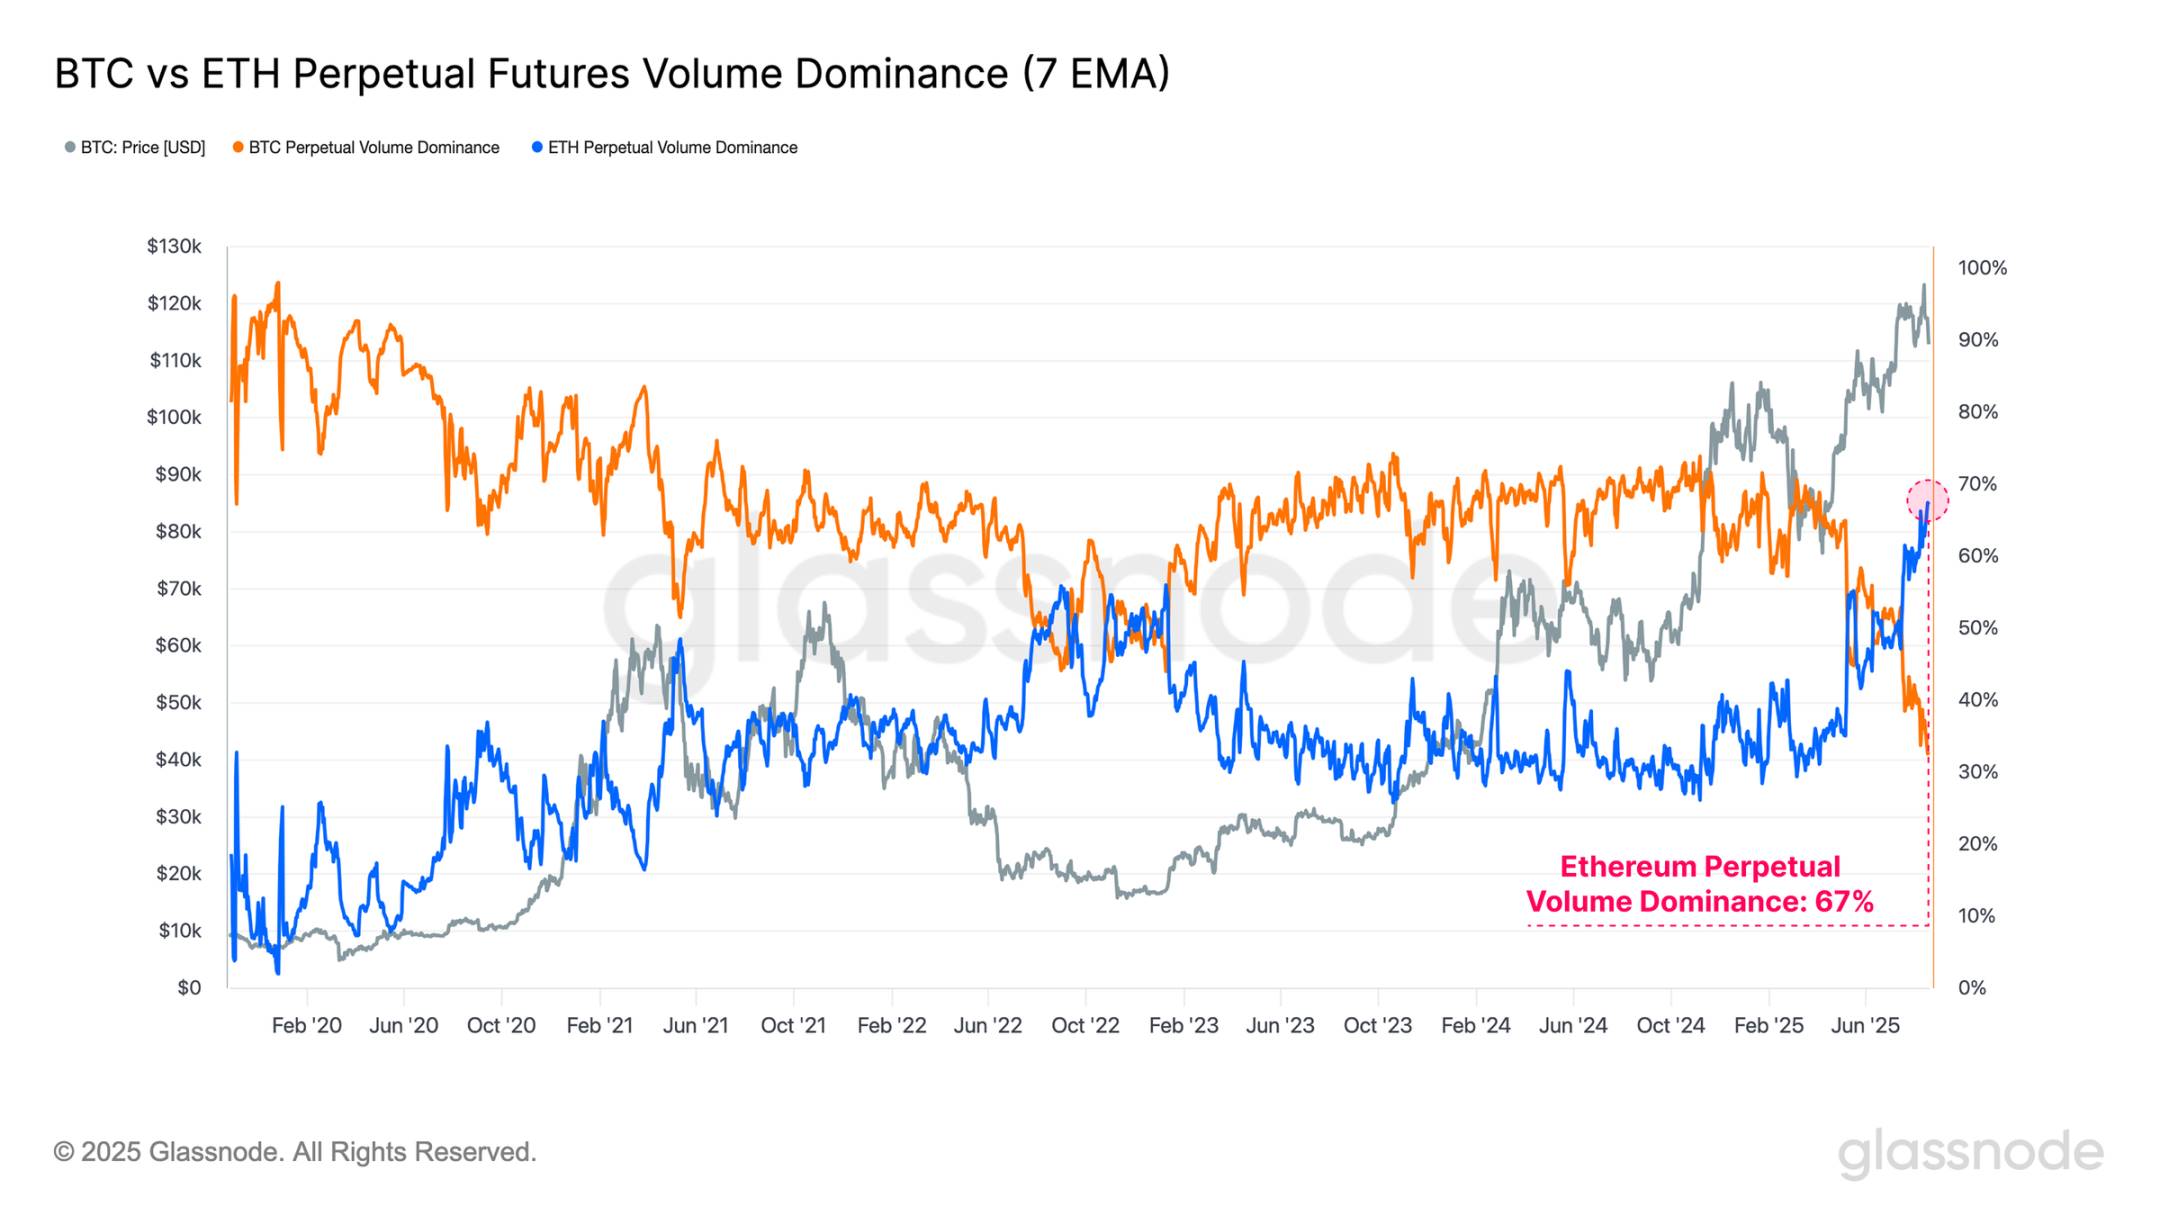
Ethereum is often seen as a bellwether asset, with its strong performance typically associated with the broader "altcoin season" phase of the digital asset market. Notably, Ethereum's dominance in open contracts has reached the fourth highest level on record, while its perpetual futures trading volume dominance has surged to a new all-time high of 67%.
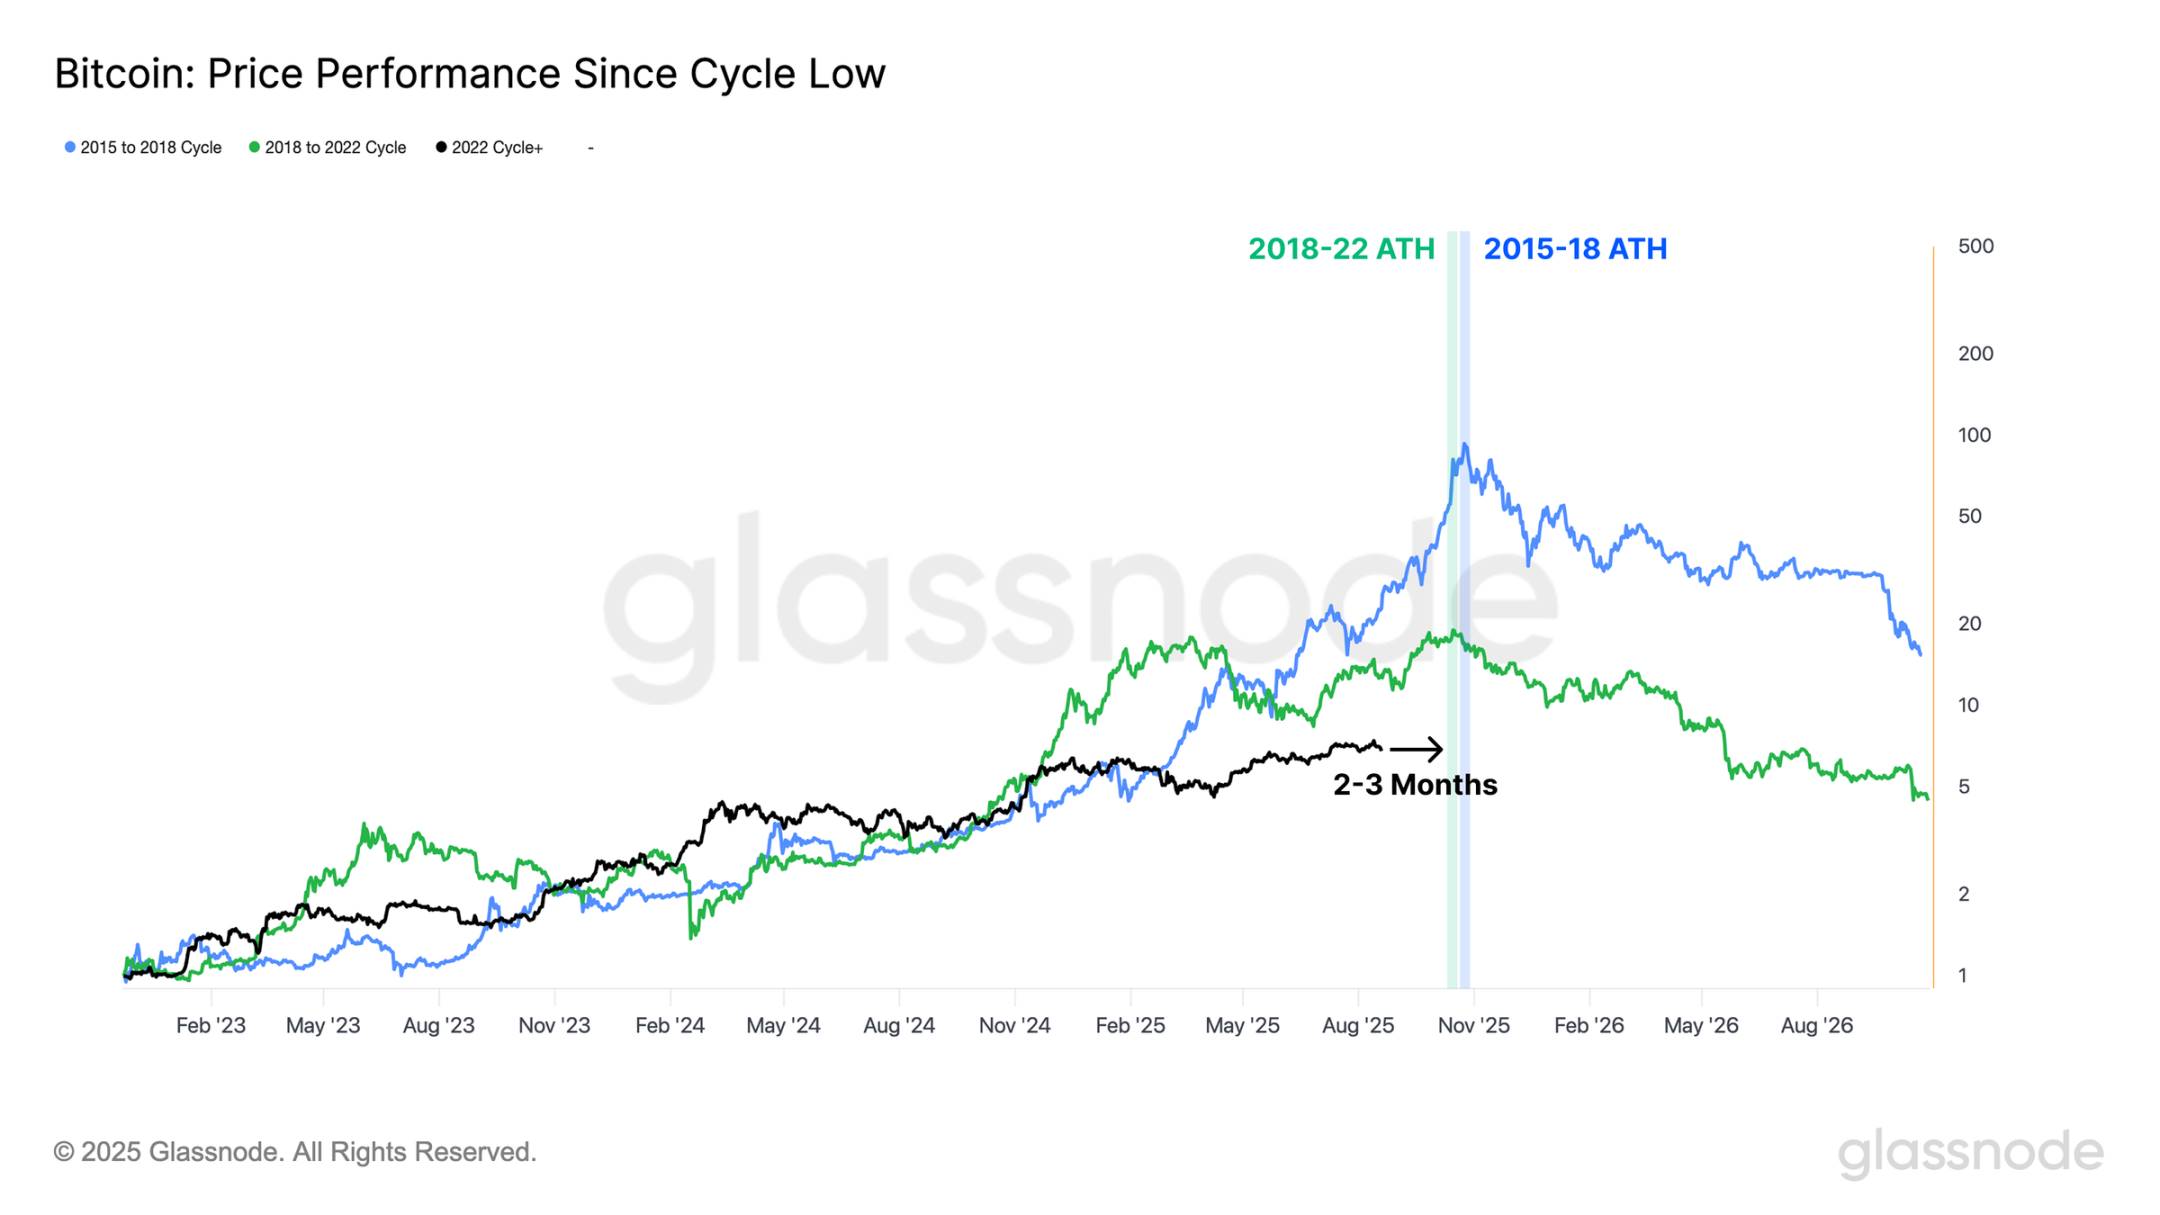
When we observe Bitcoin's performance from each cycle's low point, we can see that in the 2015-2018 and 2018-2022 cycles, the time to reach the all-time high was approximately 2-3 months later than the current cycle's timing.
Slowing Capital Flow
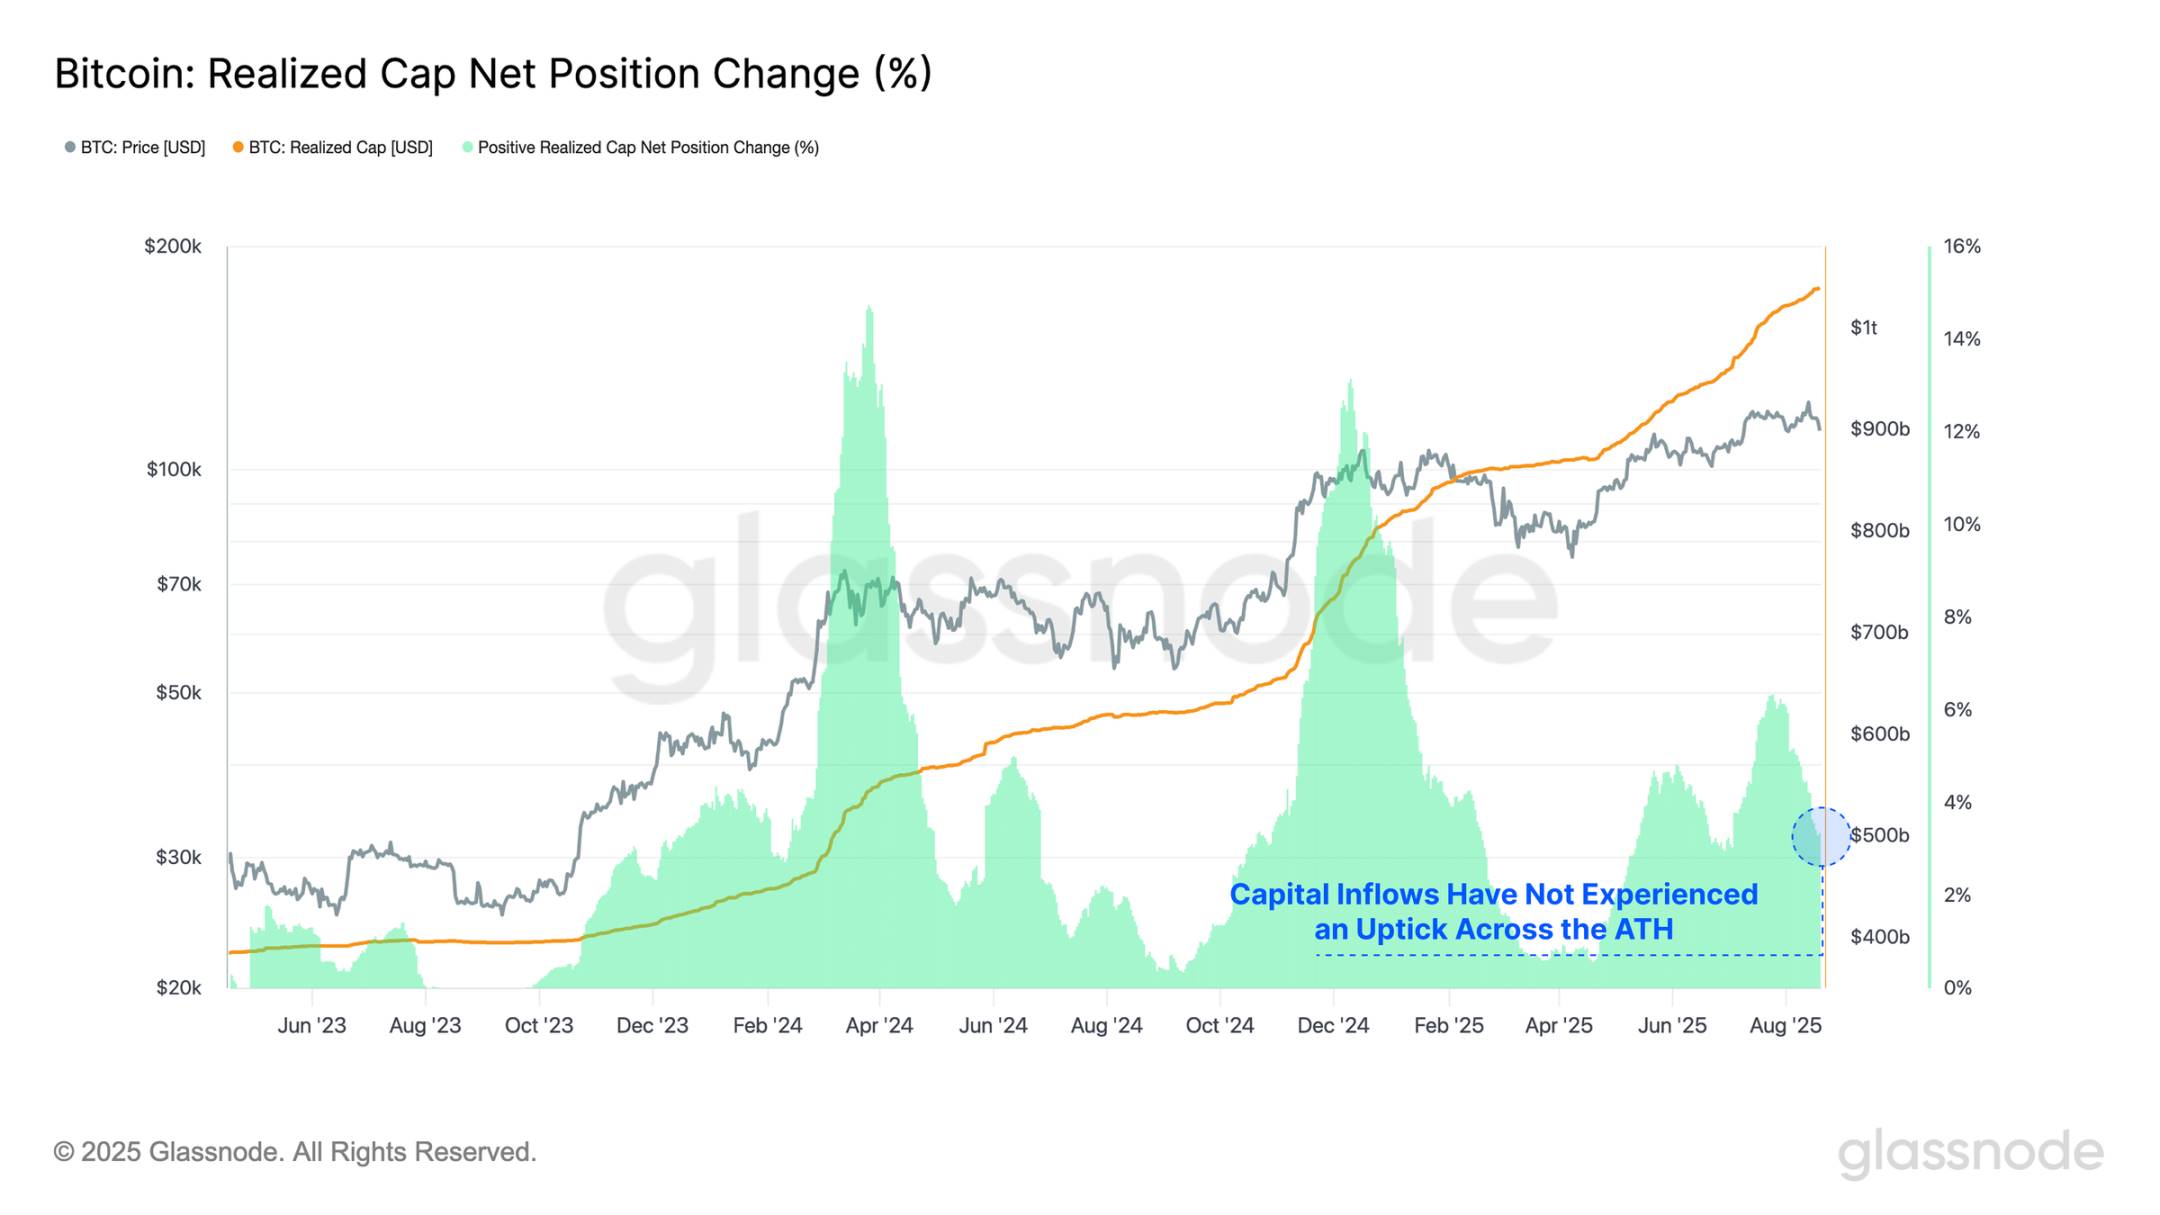
Following last week's peak of $124,400, Bitcoin's upward momentum has stalled, with the price retreating to a low of $112,900, a correction of nearly 9.2%. This decline is accompanied by a noticeable weakening of capital inflow in recent weeks, indicating that investors are unwilling to inject new funds at these high price levels.
When we compare the current capital inflow rate to previous instances when historical highs were breached, we find that the percentage growth of realized market cap is far lower than the levels seen during the breaches in March and December 2024. When it first broke $100,000 at the end of 2024, the monthly growth rate of realized market cap reached +13%, while the peak in the current environment is much lower, at only +6% per month.
This period of weak capital inflow highlights a significant decrease in investor demand willingness at this stage.
Real-time Chart
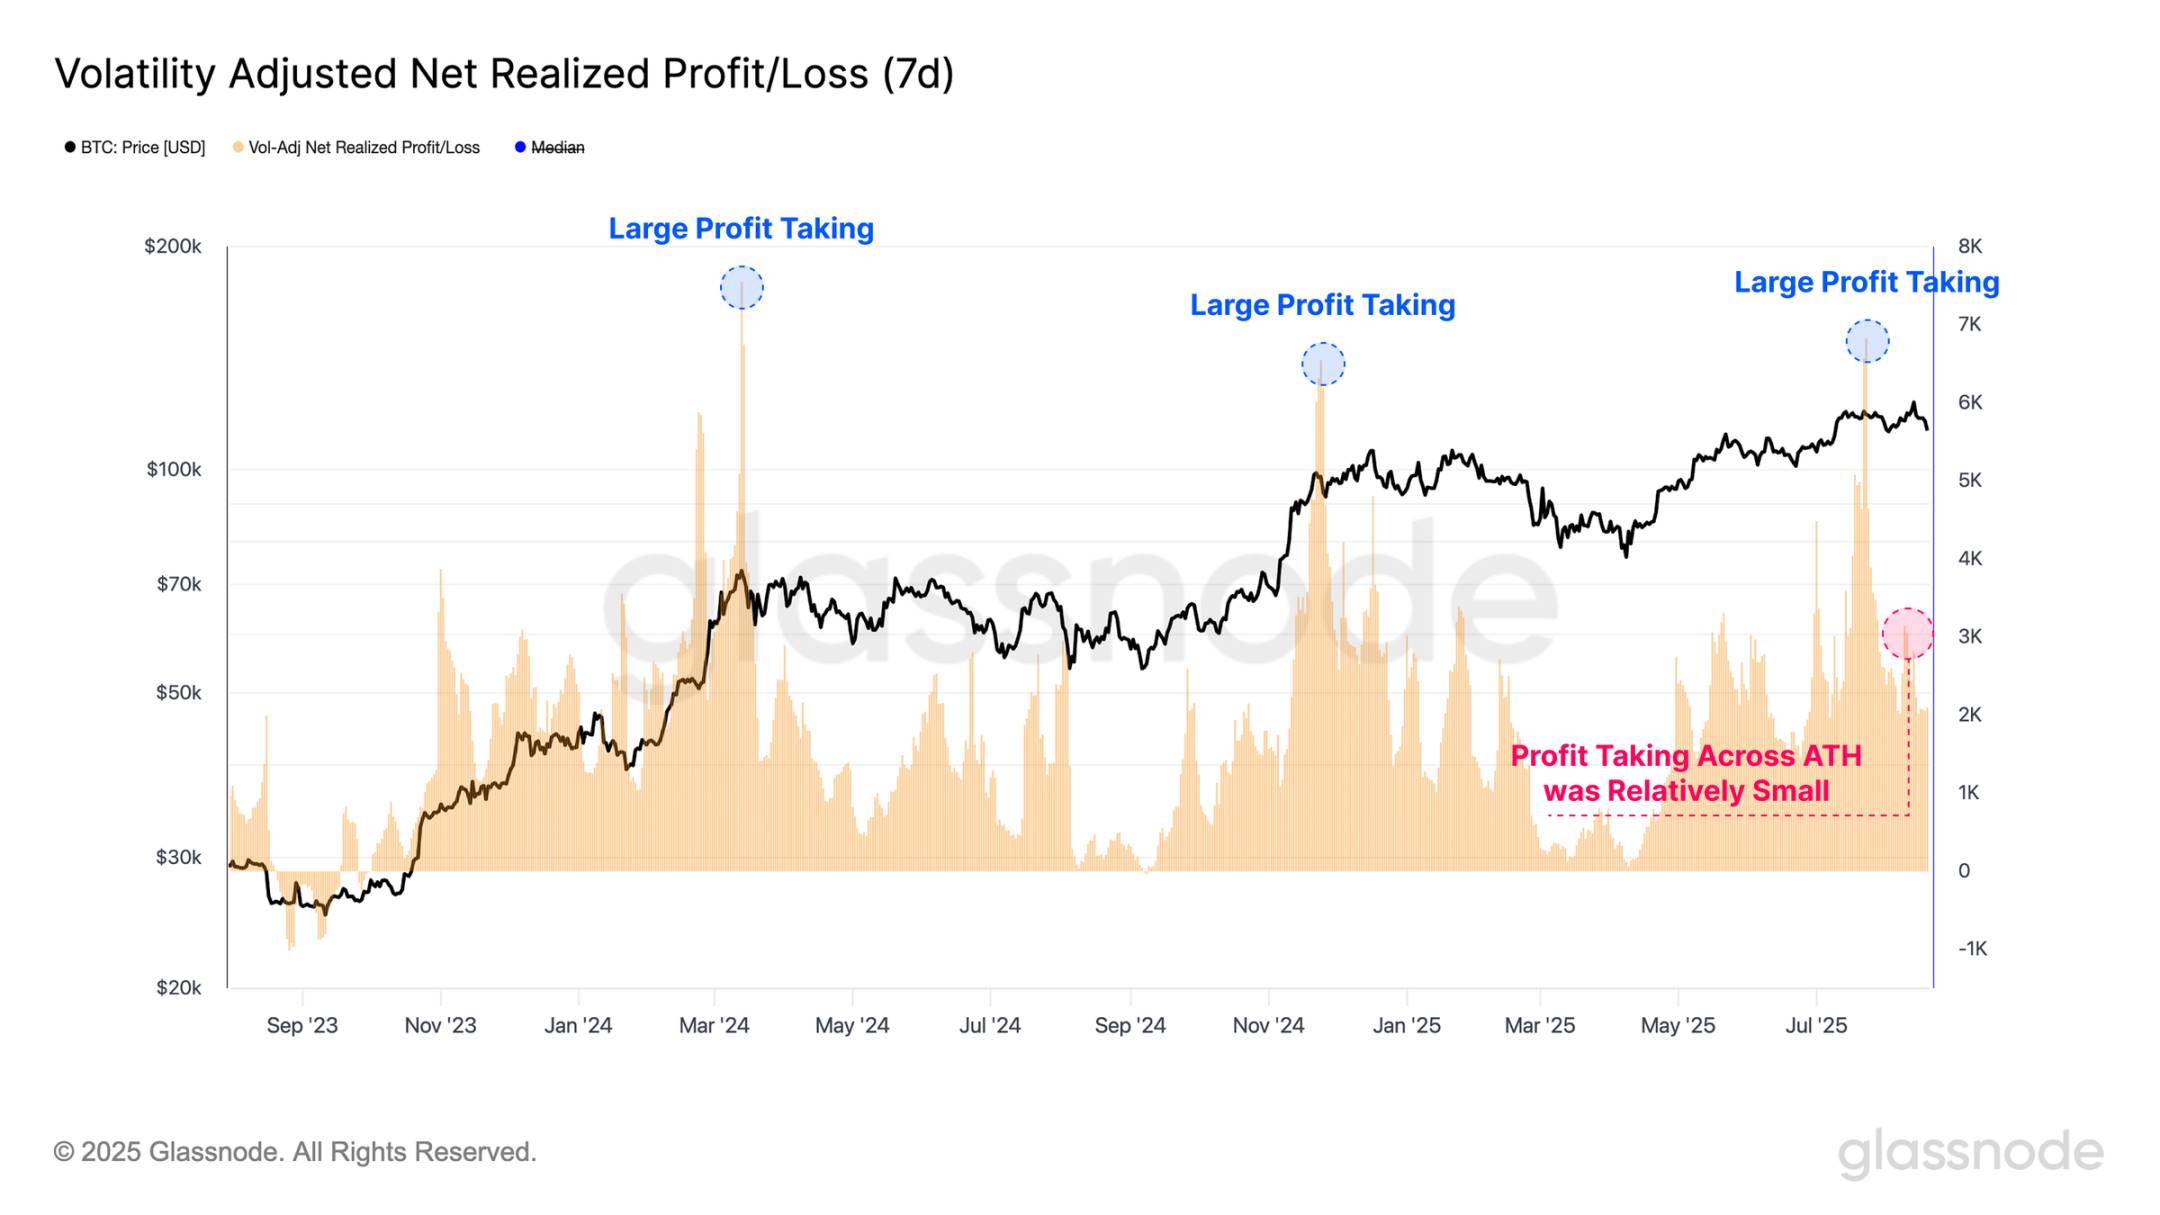
Profit-taking activity has also declined in recent weeks, which can be observed through the volatility-adjusted net realized profit/loss metric. This tool measures realized profits and losses in Bitcoin (BTC) and standardizes them based on Bitcoin's continuously growing market value across different periods. It further refines this by adjusting for 7-day realized volatility to account for diminishing returns and slowing growth rates as the asset matures.
Notably, we can observe three significant profit-taking events around the $70,000 and $100,000 breakout points, as well as near the historical high of $122,000 reached in July this year. These events indicate a strong willingness among investors to lock in substantial profits, but the demand impulse to absorb this selling supply is equally strong.
In contrast, the amount of realized profit-taking in this latest attempt at a historical high has significantly decreased. One explanation for this dynamic is that, despite lower selling pressure from existing holders, the market has failed to maintain upward momentum.
Real-time Chart
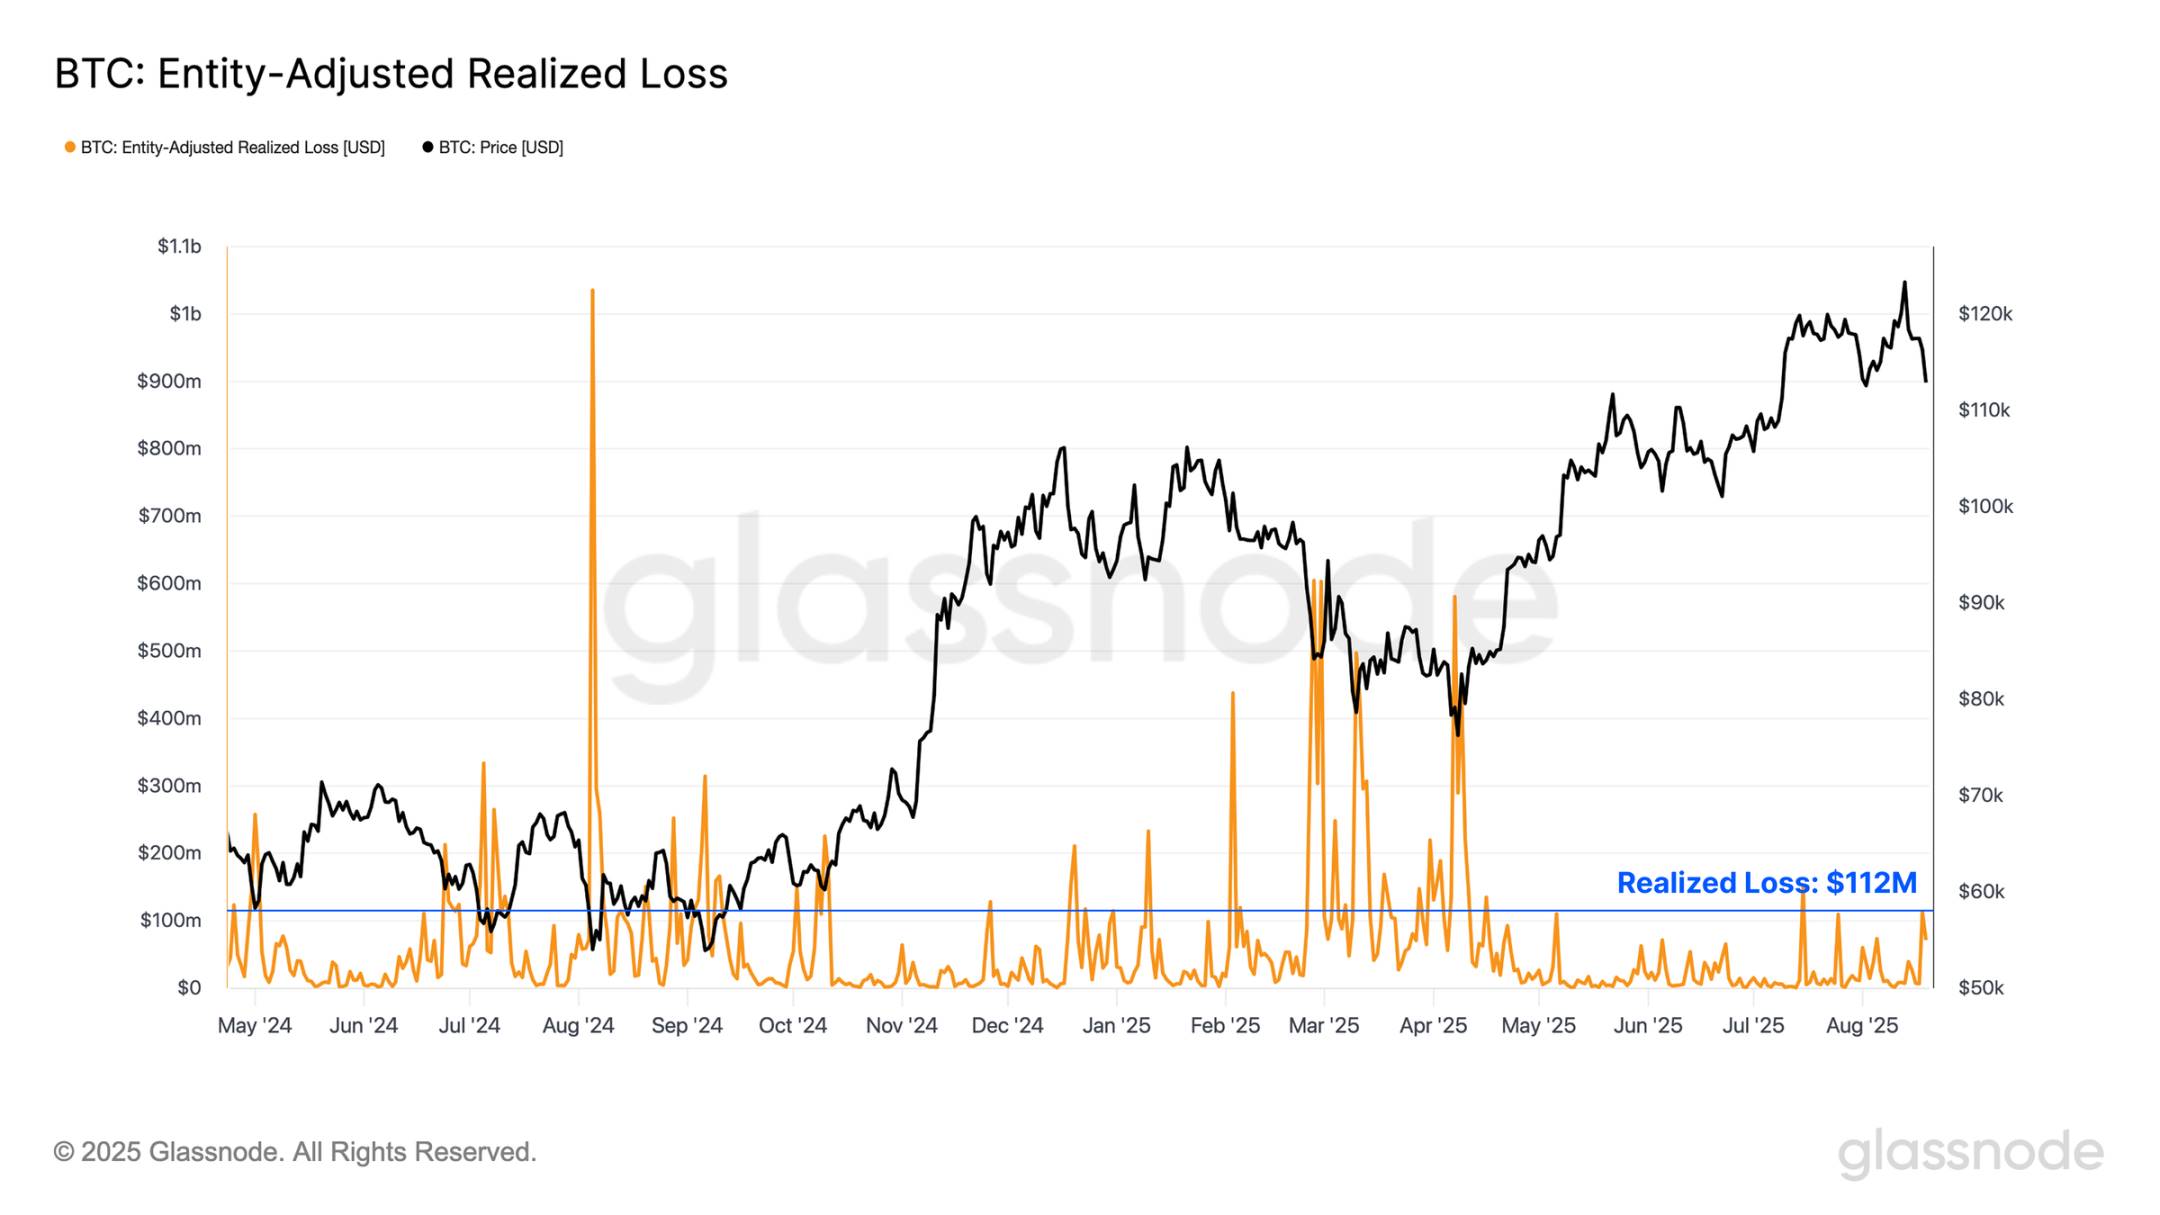
As the local market momentum reverses and prices continue to decline, we turn our attention to realized loss events to assess whether there has been any significant negative change in investor sentiment. During this local downtrend, investors' realized losses have accelerated, reaching a value of $112 million per day.
However, this remains within the typical range during local pullbacks in the overall bull market cycle, with many events, such as the yen arbitrage trade liquidation in August 2024 and the "Trump tariff panic" from March to April 2025, leading to significantly higher surrender volumes.
This suggests that, although increasing losses may begin to challenge this view, the current downtrend has not yet had a substantial impact on investor confidence.
Real-time Chart
Leverage-Driven Decline
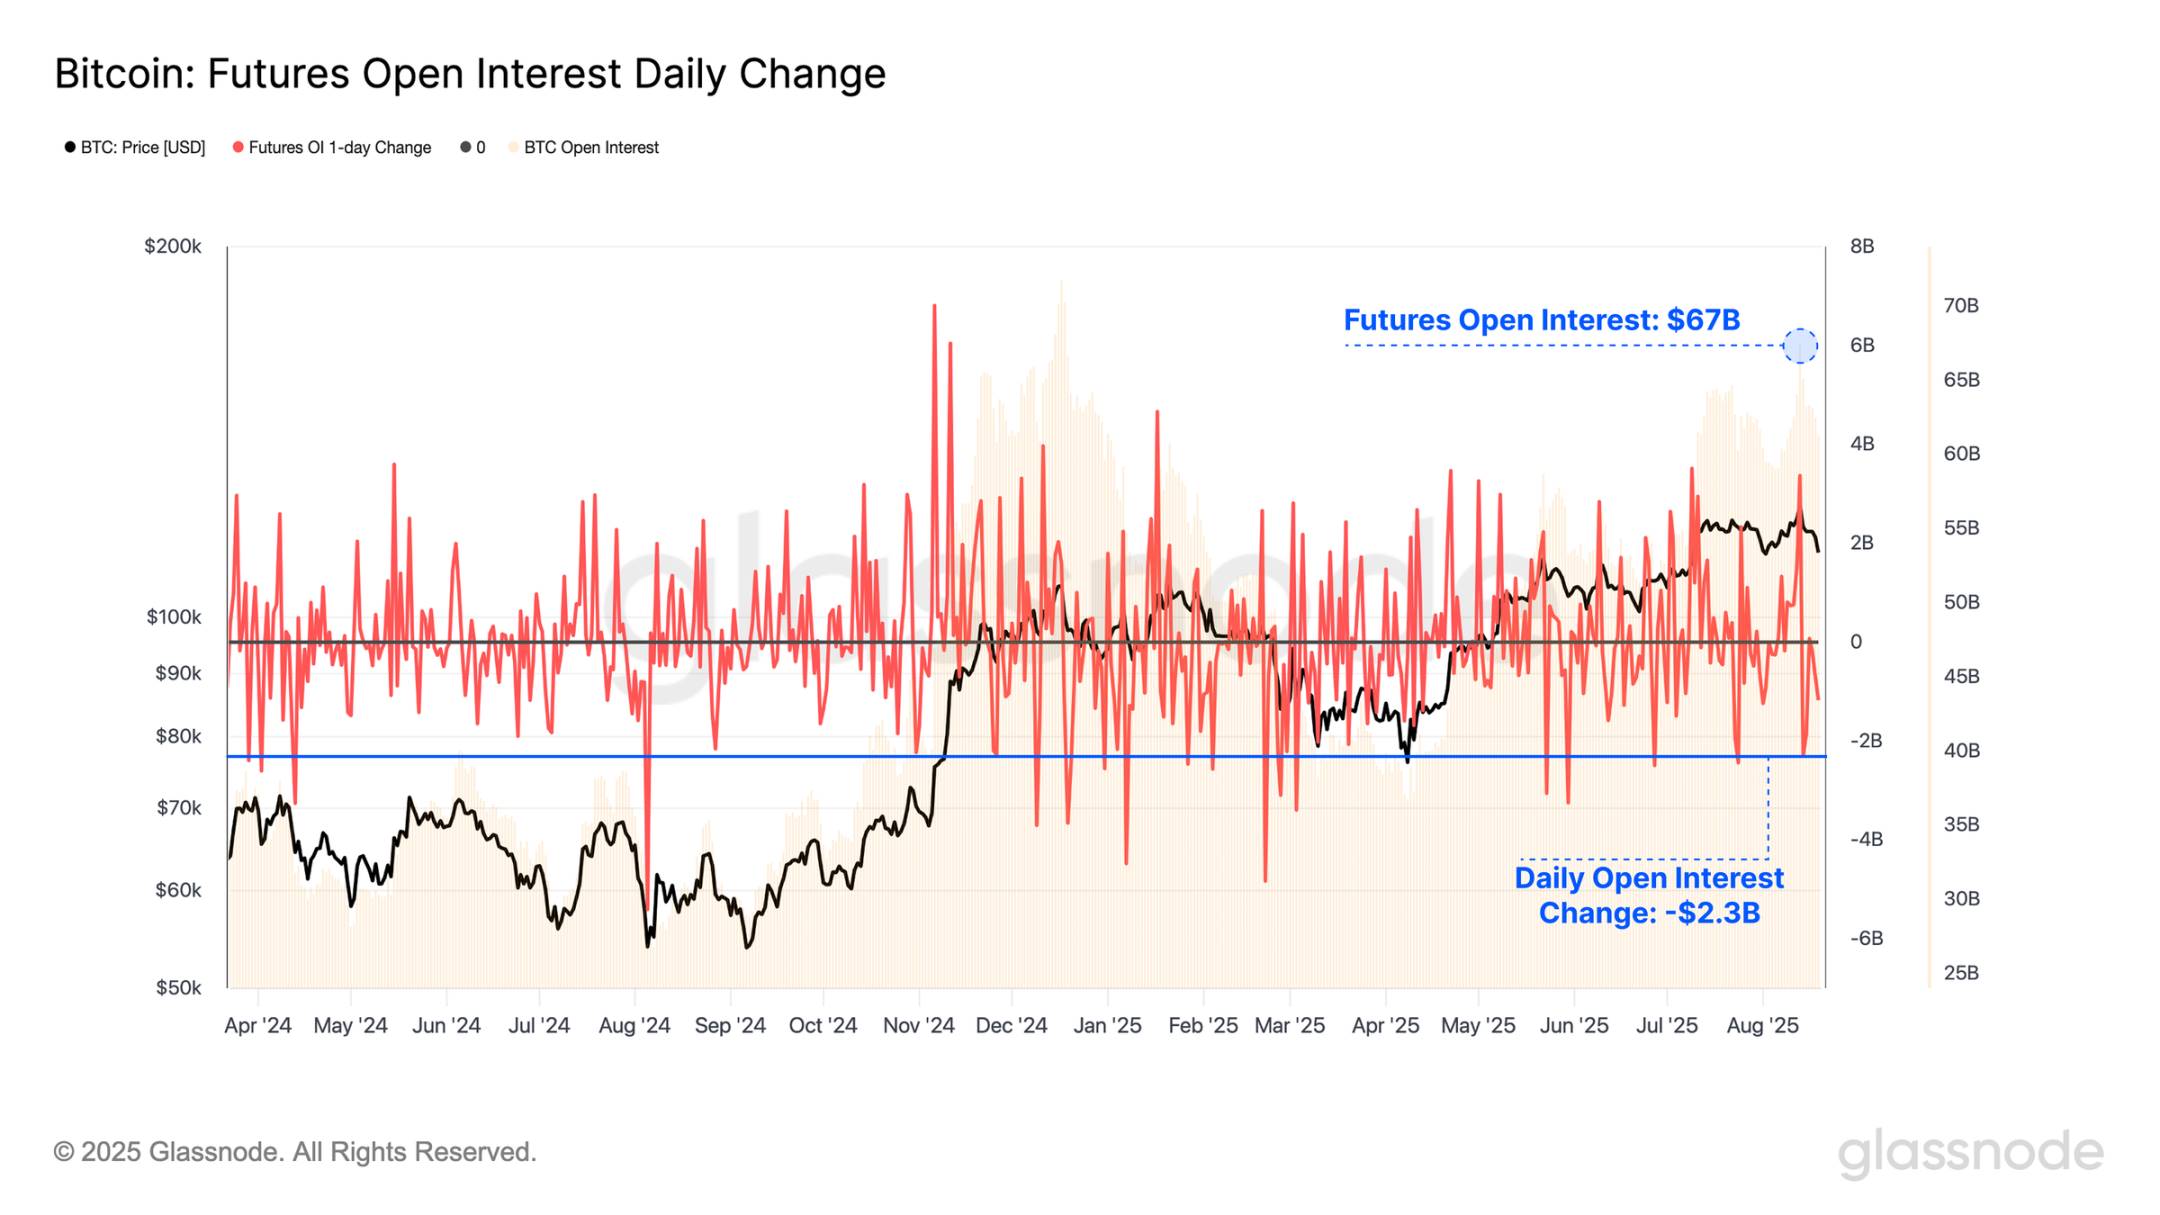
Despite relatively flat on-chain profit and loss realizations during the recent formation of historical highs and subsequent corrections, activity in the futures market has accelerated. The total open contracts for Bitcoin futures remain at a high of $67 billion, highlighting the high level of leverage present in the current market.
Notably, during the recent sell-off, over $2.3 billion in open contracts were liquidated, with only 23 trading days recording larger nominal declines. This underscores the speculative nature of the market, where even moderate price fluctuations can trigger significant contractions in leveraged positions.
Real-time Chart
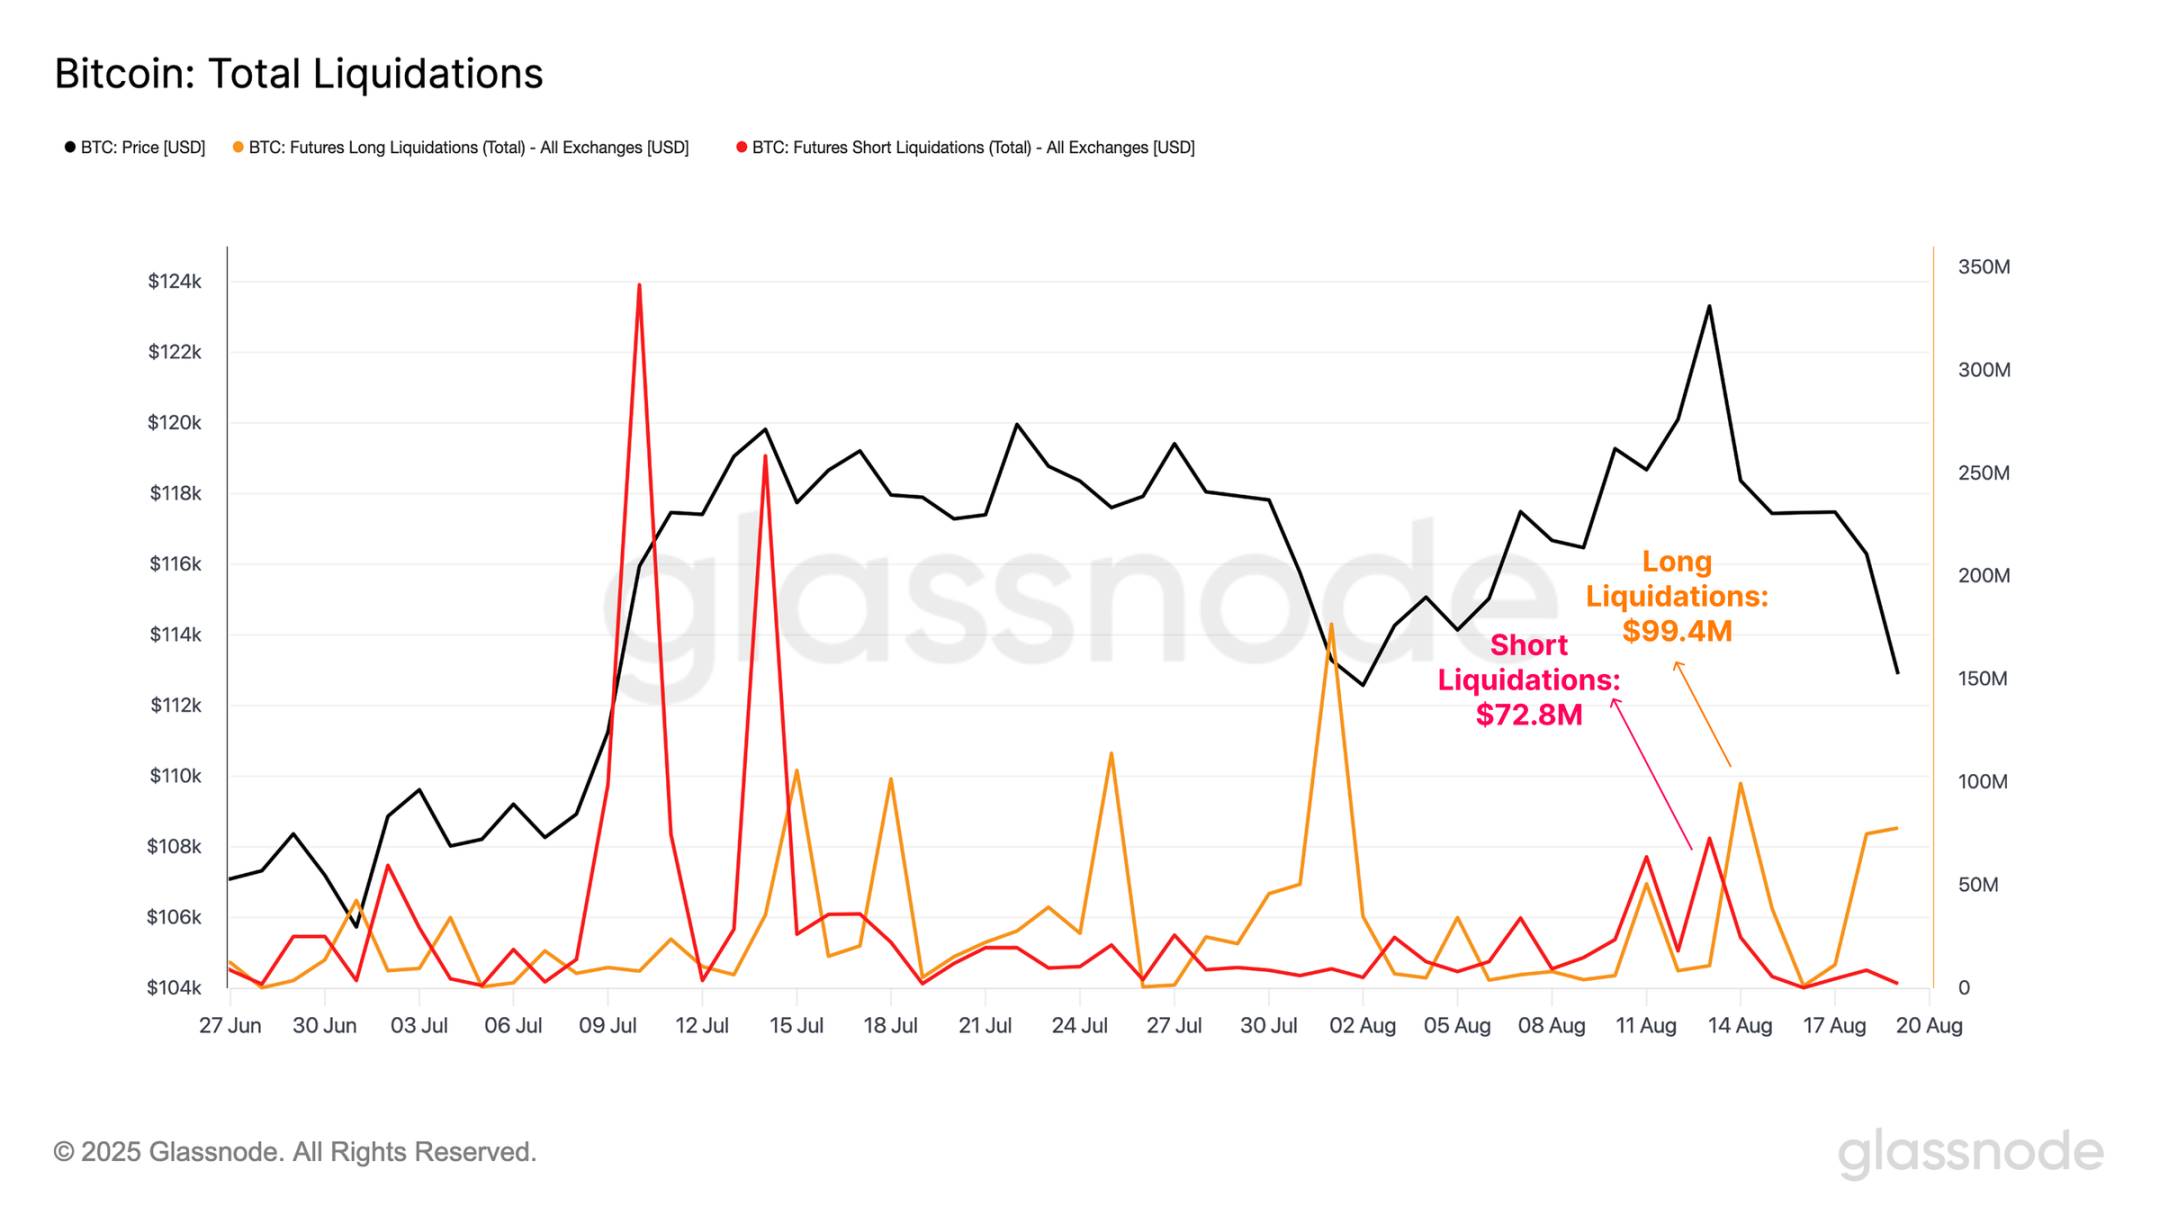
Delving deeper, we can assess the total scale of long and short liquidations during the formation of historical highs and the subsequent price contraction period.
While the liquidation volume did indeed increase during these events, with short liquidations reaching $74 million during the historical high and long liquidations hitting $99 million during the downtrend, these levels are significantly lower than those seen during similar severe price fluctuations earlier this year. This indicates that a considerable portion of recent contract liquidations may be voluntary and thus risk-managed, rather than driven by forced liquidations due to excessive leverage being cleared.
Real-time Chart
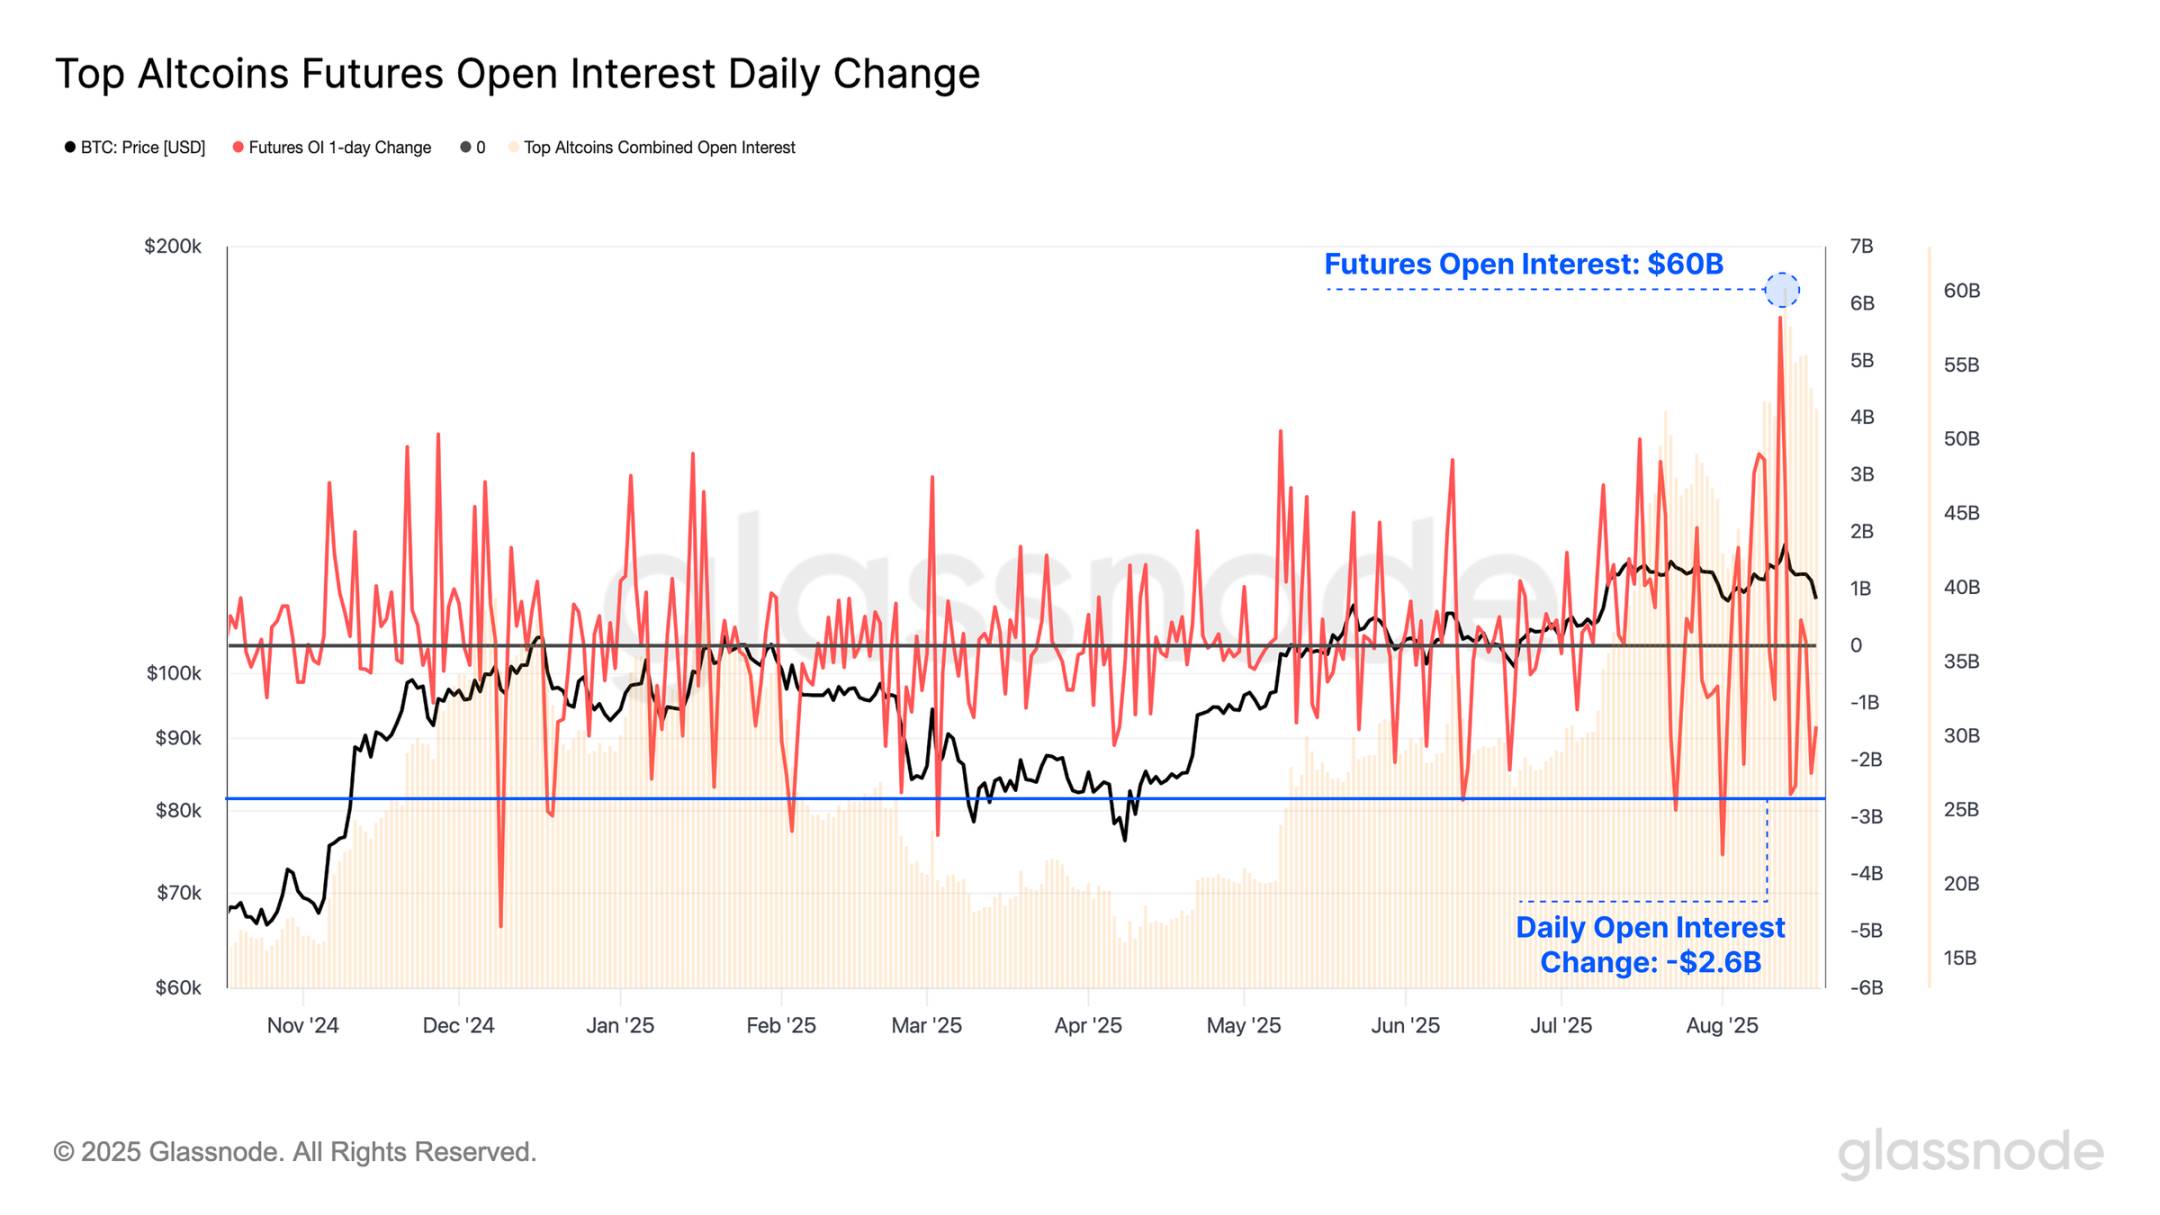
When we evaluate the futures open contracts of major altcoins (ETH, SOL, XRP, DOGE), we note that their total surged to a new all-time high of $60.2 billion over the weekend. This is nearly on par with the open contract size of Bitcoin. However, this situation is temporary, as the subsequent price correction led to a reduction of $2.6 billion in open contracts, marking the tenth largest decline on record.
These rapid fluctuations indicate that altcoins are currently attracting significant attention from investors, significantly exacerbating the reflexivity and fragility of the digital asset market.
Real-time Chart
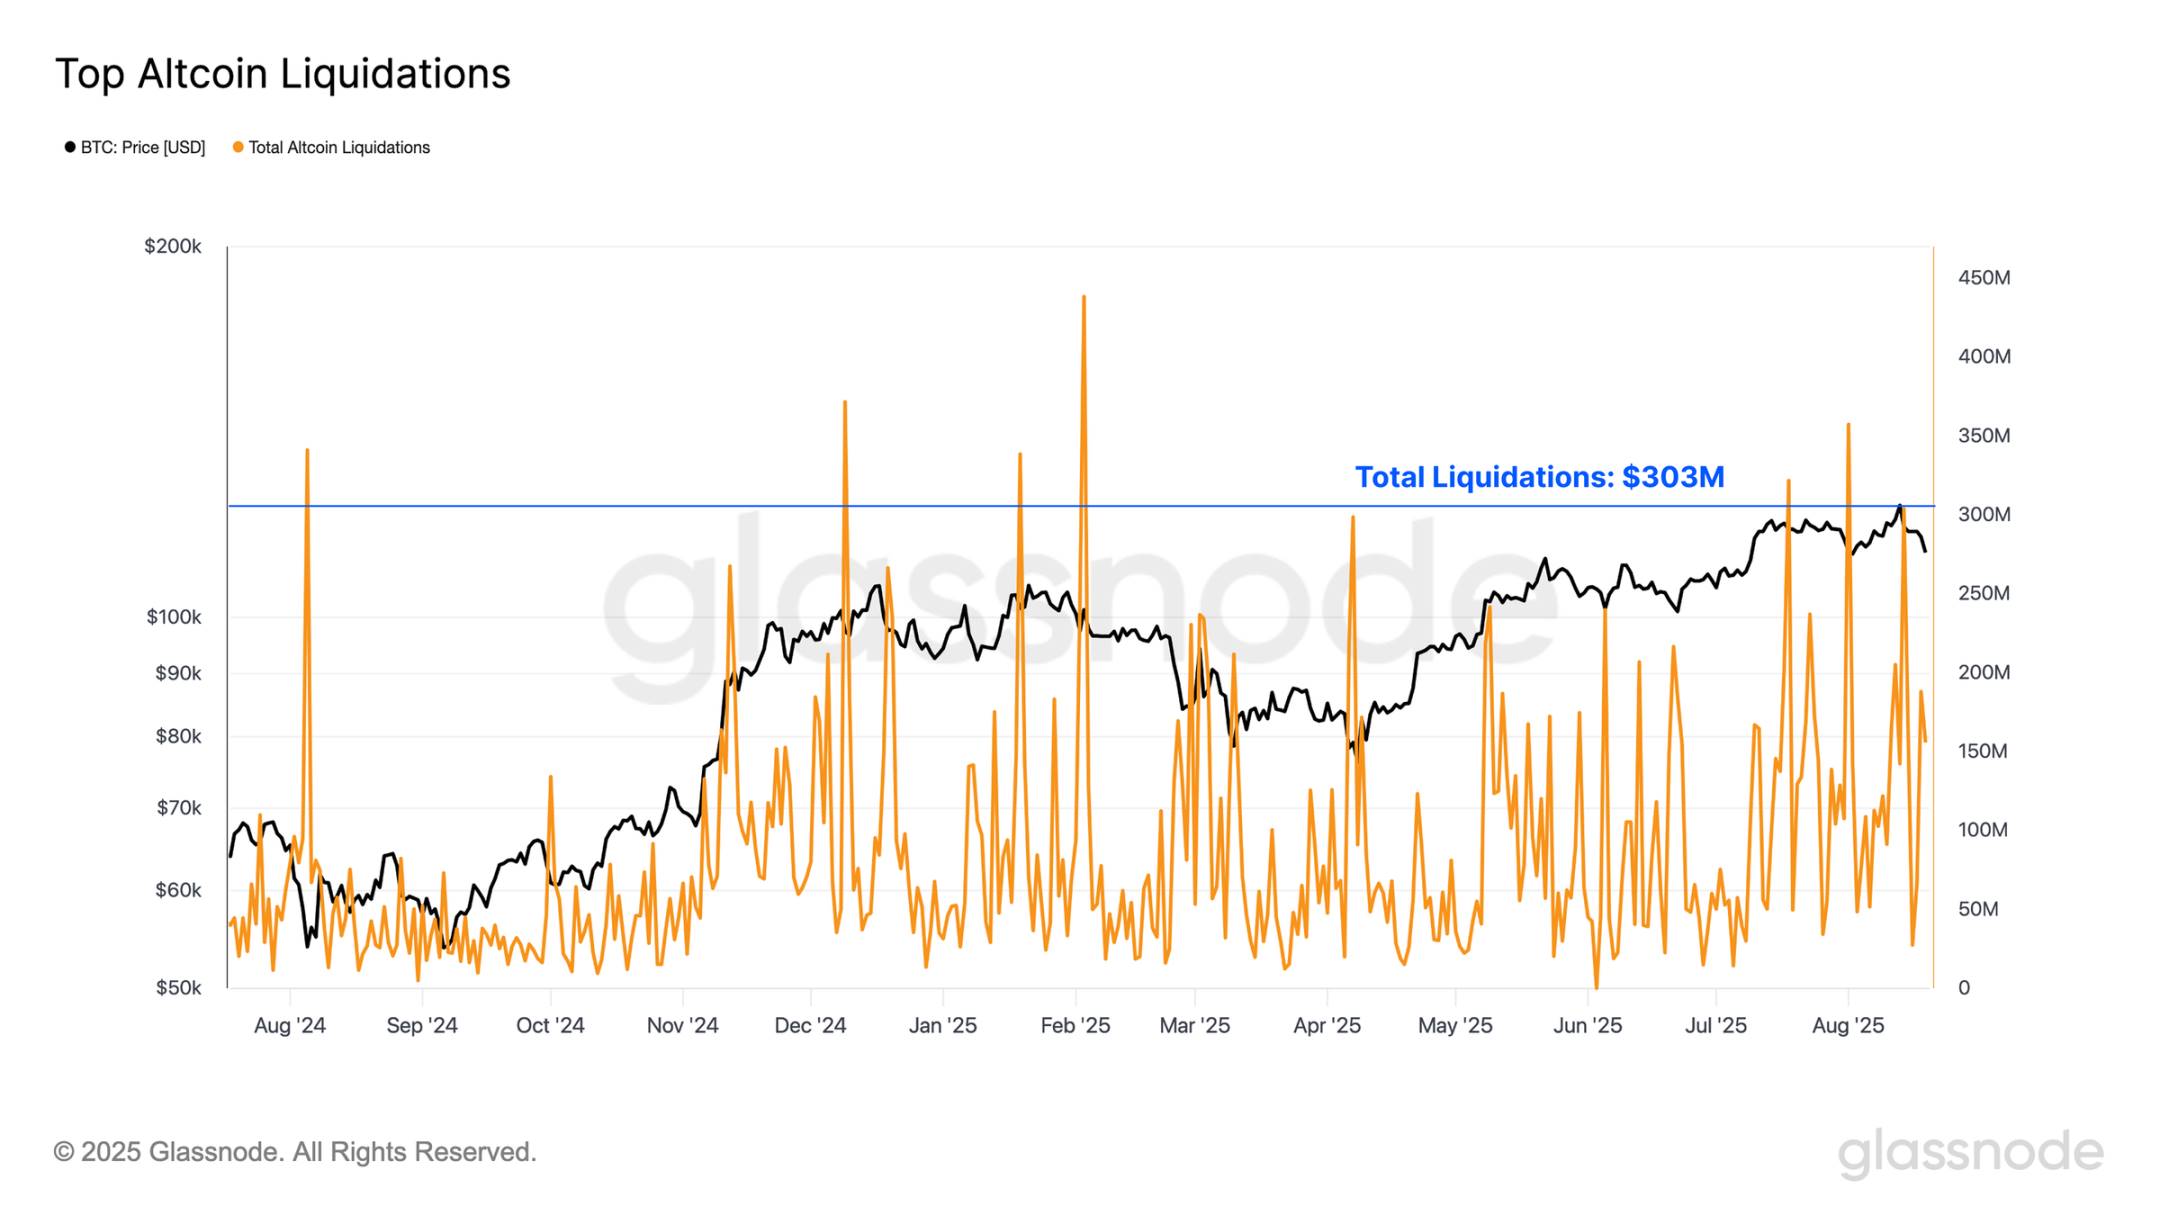
Additionally, the total liquidation volume of mainstream altcoins has recently been quite high, peaking at $303 million per day, and the liquidation volume experienced is more than double that of the Bitcoin futures market.
Furthermore, the scale of liquidations over the weekend now ranks as the 15th largest on record, indicating an increased willingness to take leveraged exposure in the altcoin space.
Real-time Chart
Intensified Speculation
Over the years, Ethereum has often been viewed as a bellwether asset, with its strong performance periods typically associated with the broader "altcoin season" phase of the digital asset market.
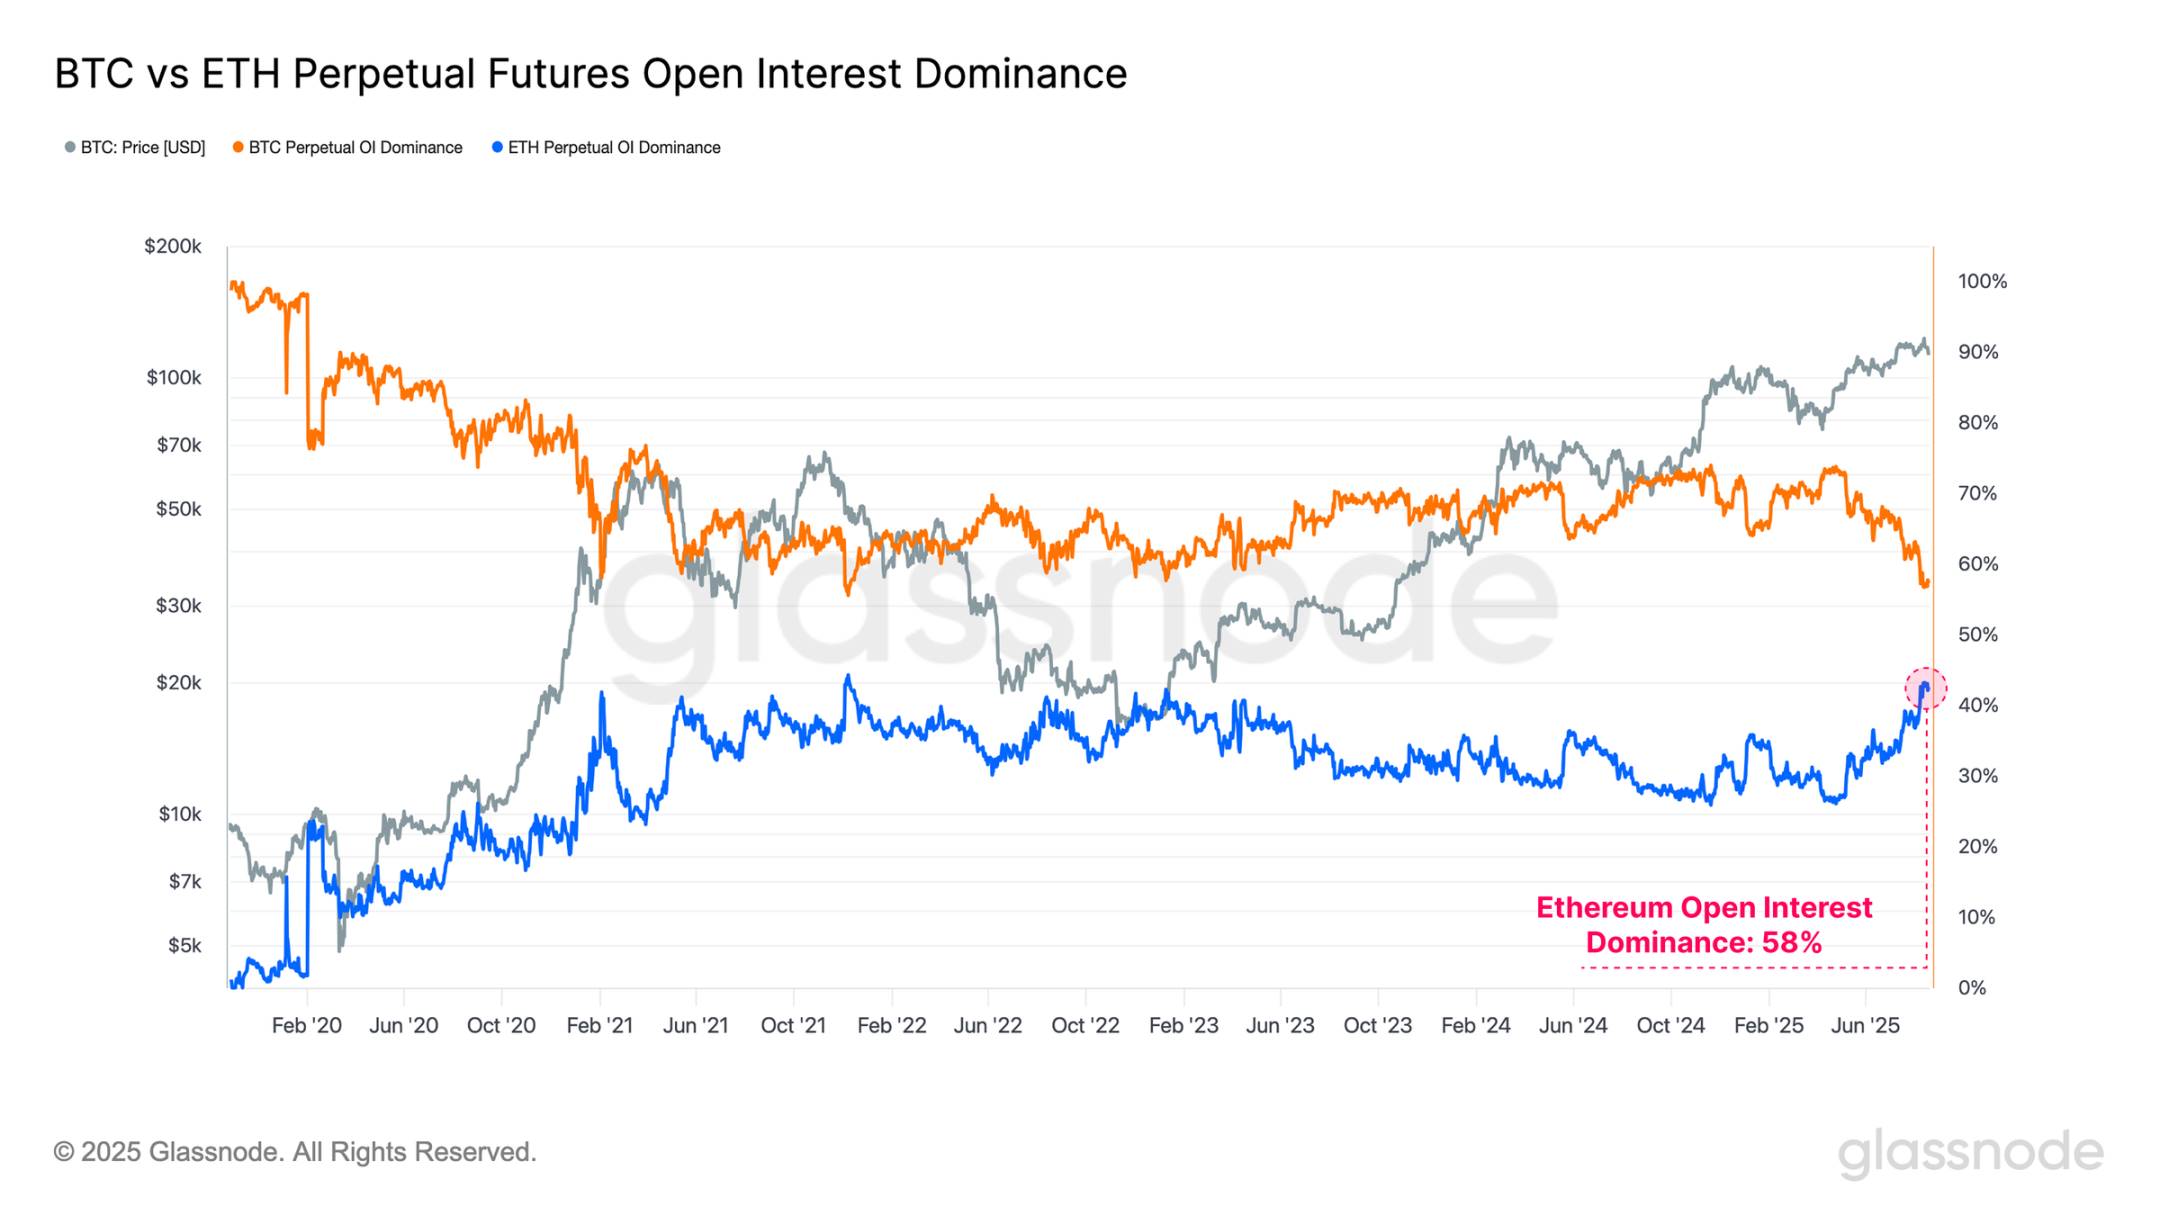
This relationship can also be observed through the dominance of open contracts between Bitcoin and Ethereum, reflecting changes in market participants' risk preferences. Currently;
Bitcoin open contract dominance: 56.7%
Ethereum open contract dominance: 43.3%
Ethereum's share of open contracts has been rapidly climbing, indicating that market attention is significantly shifting towards further out on the risk curve. Notably, Ethereum's dominance in open contracts has reached the fourth highest level on record, underscoring a significant increase in speculative activity. It is important to note that as the second-largest digital asset, Ethereum is one of the few assets capable of accommodating institutional-scale funds.
Real-time Chart
When viewed through the lens of trading volume, this trend becomes even more striking. Ethereum's perpetual futures trading volume dominance has surged to a new all-time high of 67%, marking the strongest shift on record.
Such a significant rotation in trading activity reflects investors' growing focus on the altcoin space and points to an acceleration of risk appetite within the current market cycle.
Real-time Chart
Crossroads
When we observe Bitcoin's performance from each cycle's low point, we can see that in the 2015-2018 and 2018-2022 cycles, the time to reach the all-time high was approximately 2-3 months later than the current cycle's timing.
While these are just two examples before the mature cycle and are insufficient to assume that this synchronicity will continue, it remains a noteworthy data point. This perspective is particularly relevant when considering the wave of on-chain profit-taking over the past two years and the high levels of speculative activity visible in today's derivatives market.
Real-time Chart
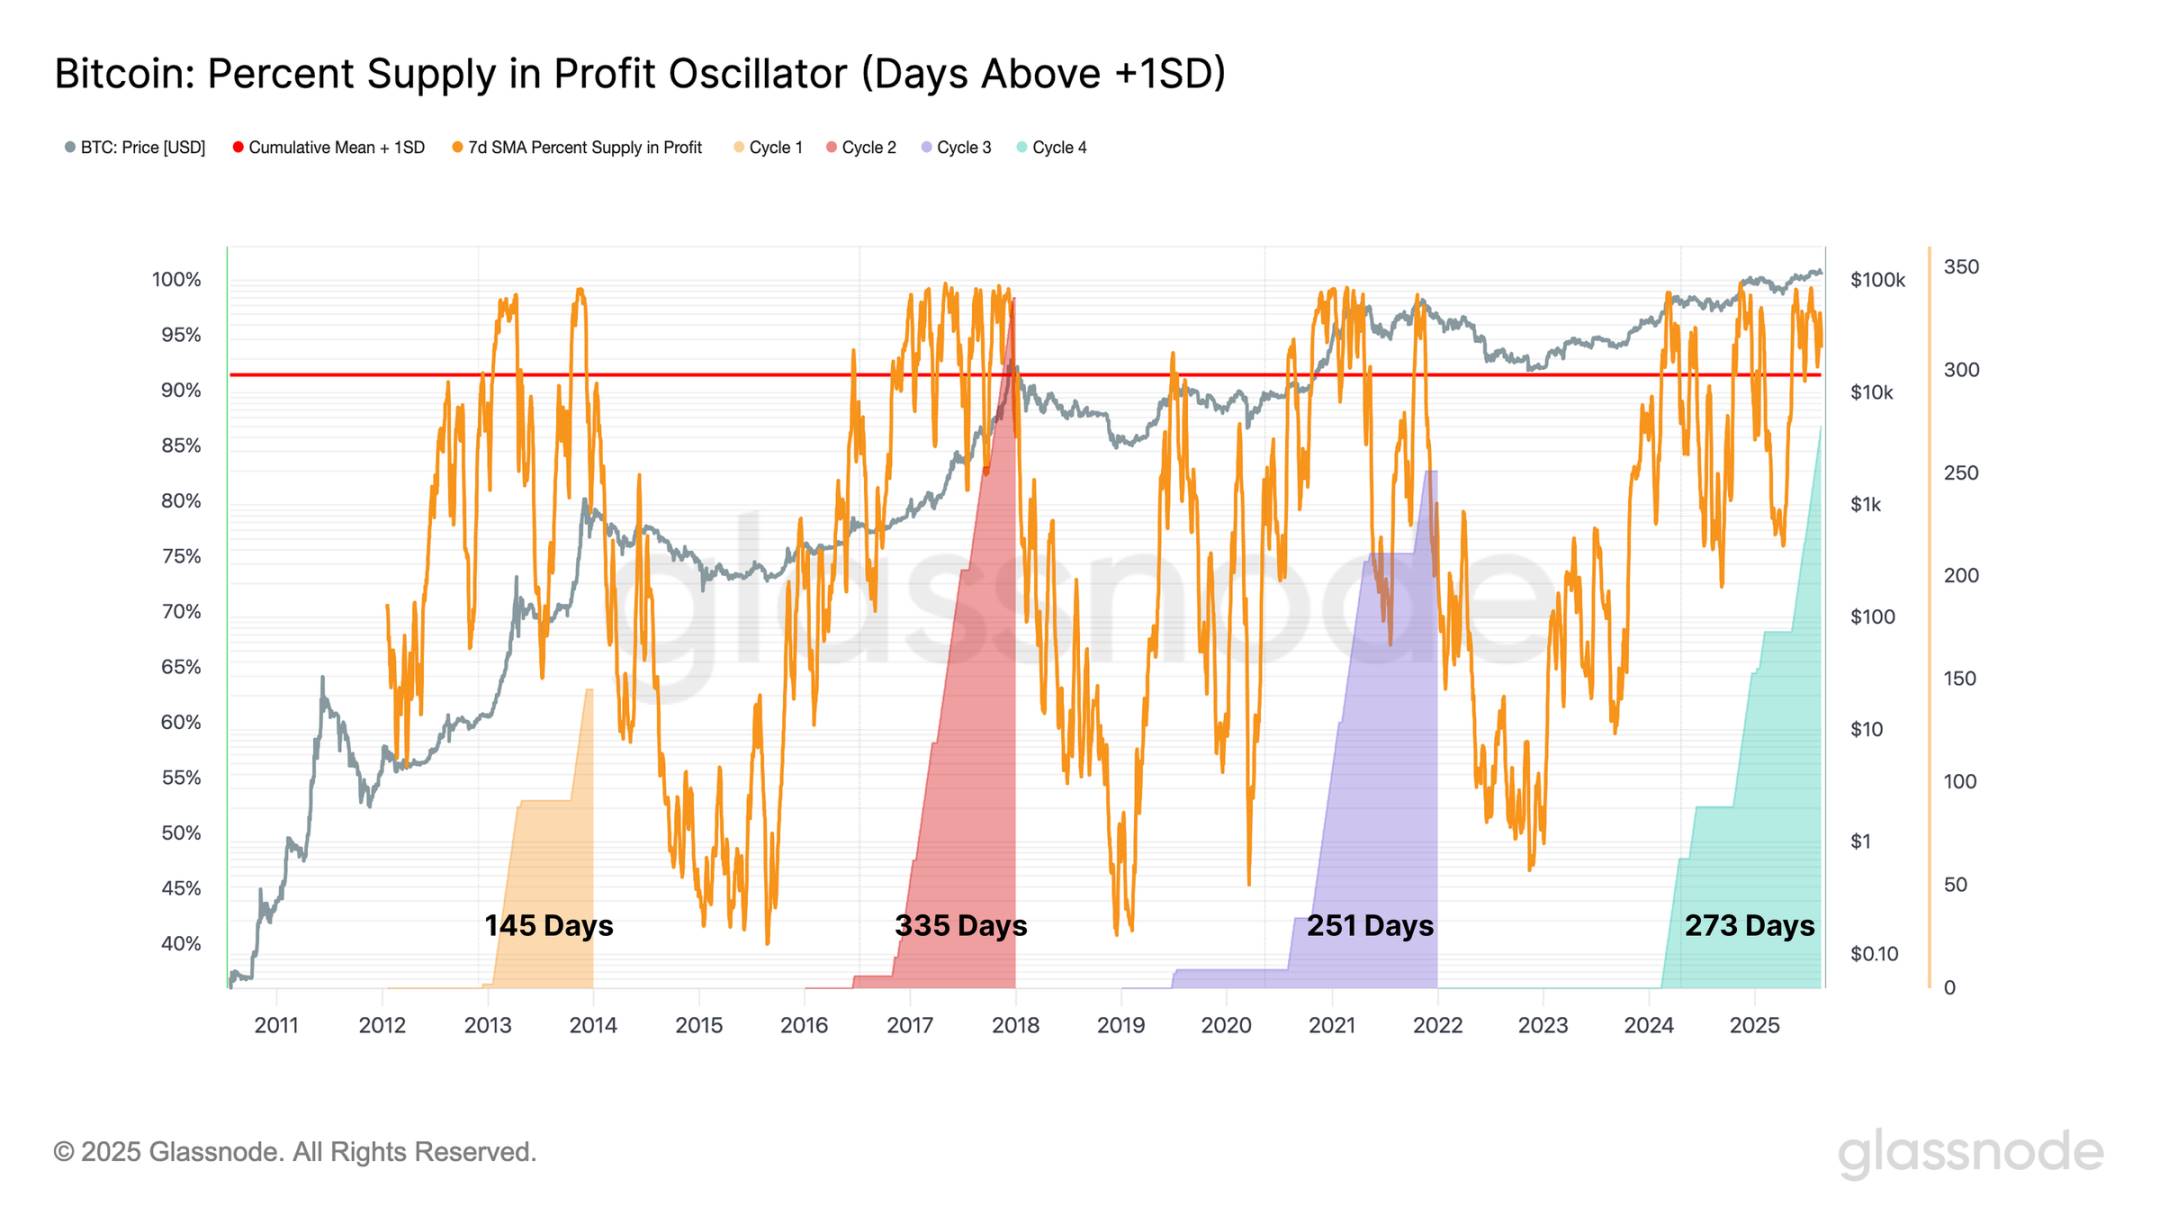
To further support this observation, we can look at the duration in each cycle that the percentage of Bitcoin's circulating supply has remained above +1 standard deviation.
In the current cycle, this period has now extended to 273 days, making it the second longest on record, only behind the 335 days of the 2015-2018 cycle. This indicates that, when measured from the perspective of the majority of supply held at a profit, the duration of the current cycle is comparable to previous cycles.
Real-time Chart
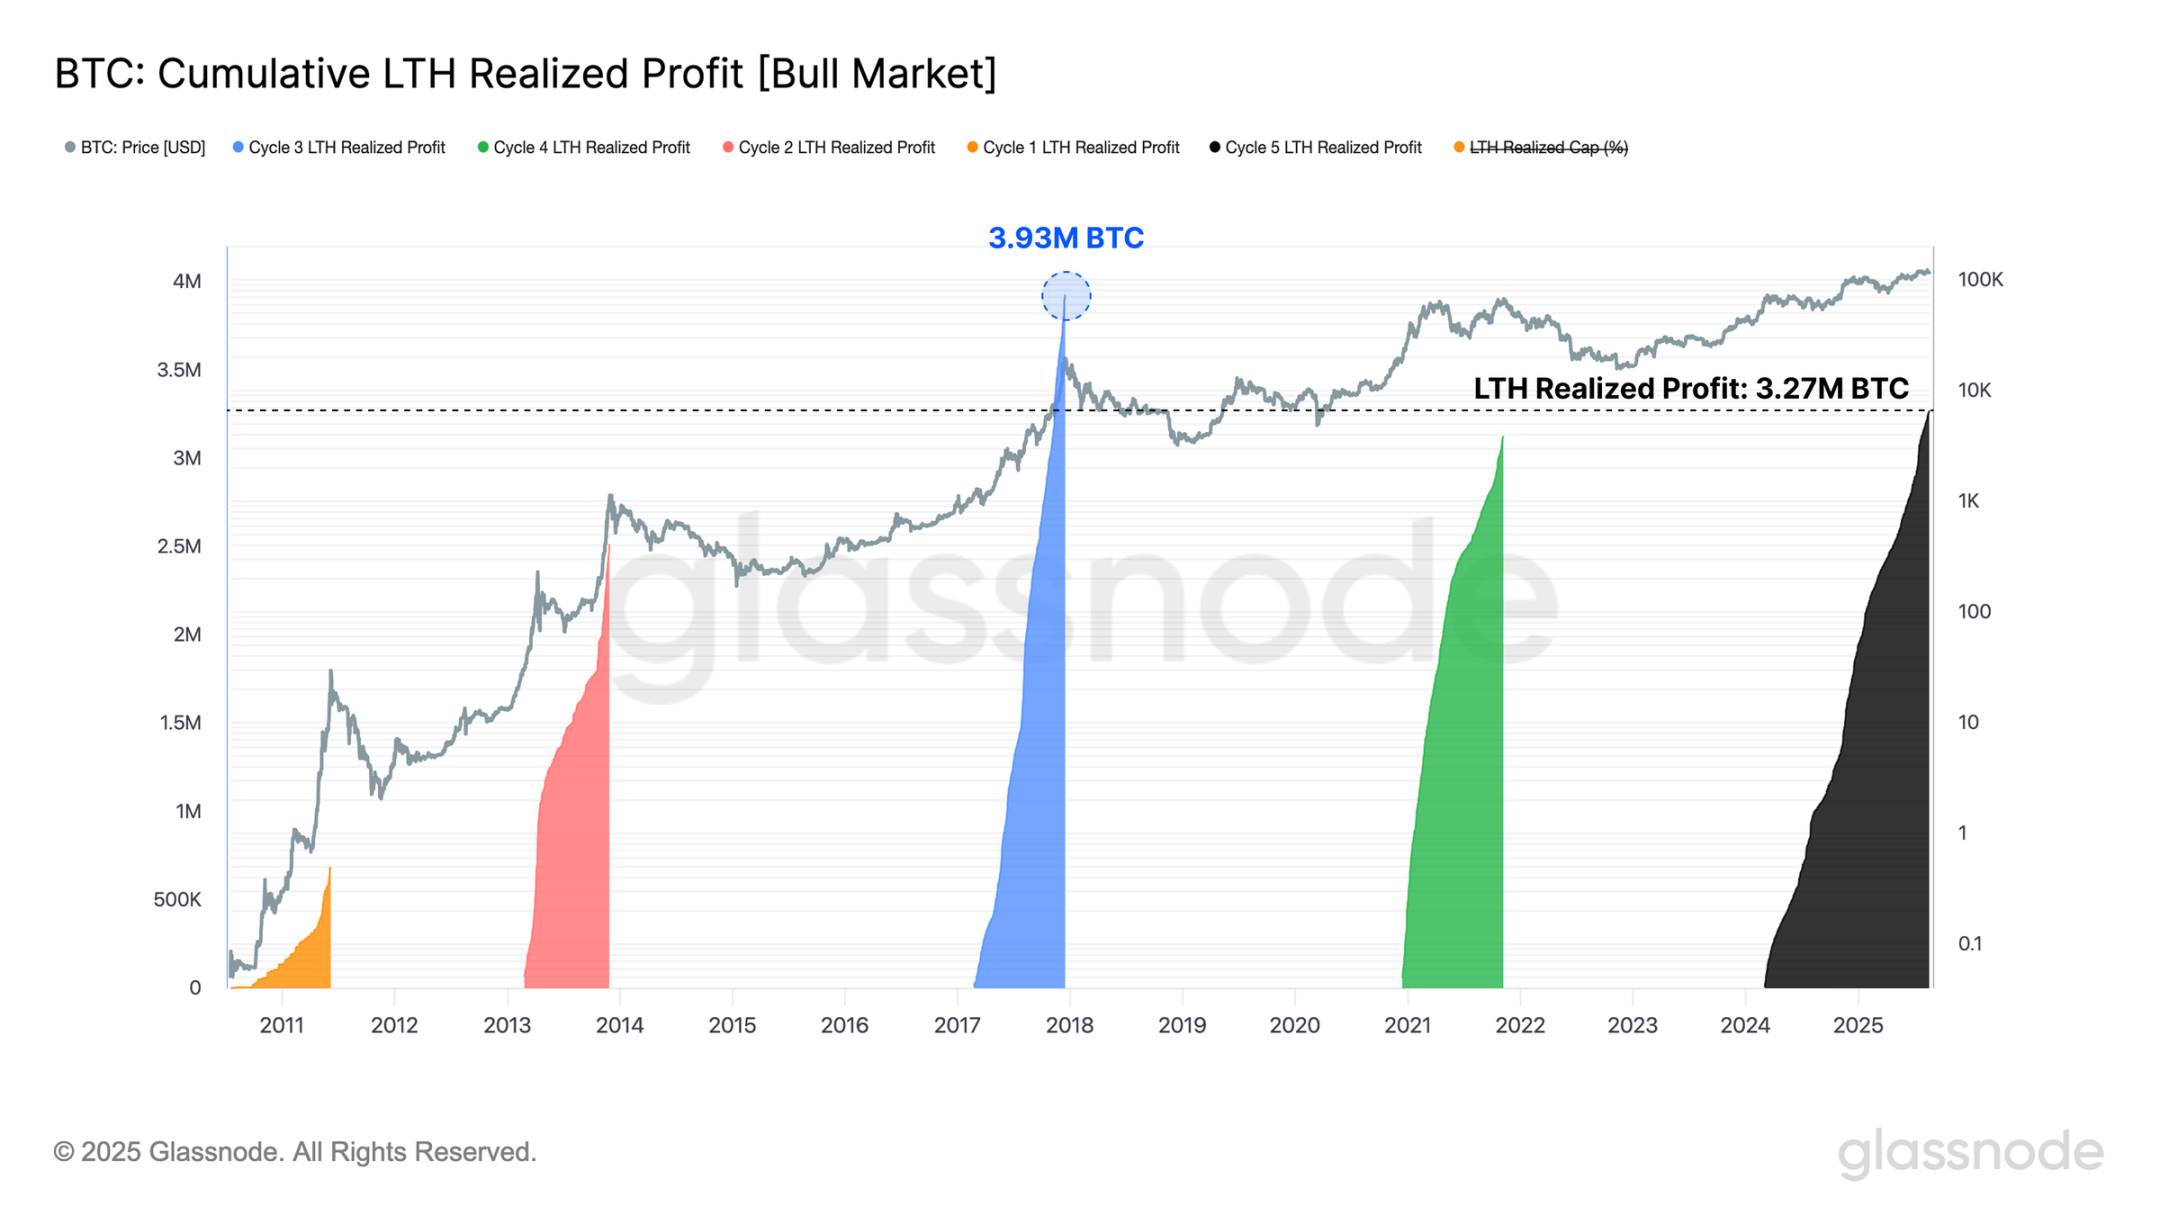
We can also measure the cumulative profits realized by long-term holders from the time a new cycle's historical peak is reached to the cycle's ultimate peak. From this perspective, we find that the group of long-term holders (who are typically most active at the extreme points of the cycle) has realized more profits than in all previous cycles except for one (the 2016-2017 cycle).
This observation aligns with previous indicators and adds another dimension through the lens of selling pressure. Taken together, these signals reinforce the view that the current cycle is in its historical late stage.
However, each cycle has its own characteristics, and there is no guarantee that market behavior will follow this fixed time pattern.
Nevertheless, these dynamics raise an interesting question. Is the traditional four-year cycle still valid, or are we witnessing its evolution? These questions will be answered in the coming months.
Real-time Chart
Conclusion
Bitcoin's capital inflow shows signs of weakness, with demand decreasing even as the price reached a new all-time high of $124,400. This slowdown in willingness coincides with a surge in speculative positions, as the total open contracts of major altcoins briefly reached a historical high of $60 billion, followed by a correction that reduced it by $2.5 billion.
Ethereum, long regarded as a bellwether for "altcoin season," is once again at the forefront of this rotation. Its dominance in open contracts has climbed to the fourth highest level on record, while its perpetual futures trading volume dominance has surged to a new all-time high of 67%, marking the strongest structural shift to date.
From a cyclical perspective, Bitcoin's price movements also echo previous patterns. In the 2015-2018 and 2018-2022 cycles, the time to reach the historical peak from the cycle low was only 2-3 months later than the current timing. Meanwhile, the profit levels realized by long-term holders are comparable to those during past market frenzy phases, reinforcing the impression that the market is in the late stage of the cycle.
Overall, these signals highlight increased leverage, profit-taking, and intensified speculation, all characteristics of the mature stage of the market in history. However, each cycle has its own characteristics, and it cannot be determined that Bitcoin and the broader market will follow a fixed time blueprint.
免责声明:本文章仅代表作者个人观点,不代表本平台的立场和观点。本文章仅供信息分享,不构成对任何人的任何投资建议。用户与作者之间的任何争议,与本平台无关。如网页中刊载的文章或图片涉及侵权,请提供相关的权利证明和身份证明发送邮件到support@aicoin.com,本平台相关工作人员将会进行核查。


