Author: arndxt, Crypto KOL
Compiled by: Felix, PANews
This is a liquidity-driven bull market, but not in the traditional sense of liquidity.
The Federal Reserve has adopted a tightening policy, and the effects of fiscal stimulus are gradually fading; however, risk assets continue to soar. Why? Because the top tier of the economy, driven by AI, is seeing diminishing capital gains and capital expenditures, while cryptocurrency treasury companies (TCos) have designed a new transmission mechanism that can quickly convert the optimism of the equity market into on-chain buying.
This flywheel can withstand weak seasonal factors and macroeconomic noise until massive capital expenditures shift or ETF demand stagnates.
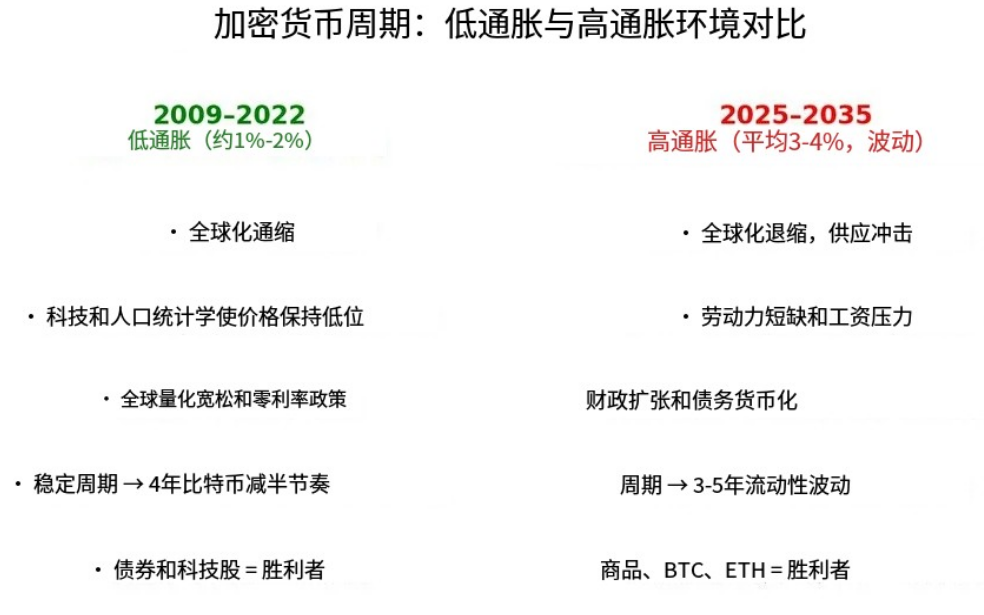
Image source: X
Personal views are as follows:
- Shift in liquidity sources: Not from the Federal Reserve or the Treasury, but from the equity gains and capital expenditures of AI mega-corporations. The wealth effect from Nvidia (NVDA) and Microsoft (MSFT), combined with a capital expenditure wave exceeding $100 billion, is radiating to the workforce, suppliers, and crucially, retail investor portfolios, pulling risk out of the curve and into the cryptocurrency market.
- New buyers in cryptocurrency: TCos (like MicroStrategy for Bitcoin; Bitmine and others for Ethereum) serve as a bridge to bring public equity capital into spot tokens. This is the structural buyer that was lacking in the previous cycle.
- Current macro headwinds are manageable: Signs of sticky inflation risk (tariffs, wages, dollar) and weakness in the labor market are emerging in macro data, but the optionality of AI productivity + favorable regulatory factors for cryptocurrency are compressing risk premiums.
1) AI at the top of the pyramid
- Capital gains → risk rotation: As the S&P 500 index is overvalued (with high expected P/E ratios), retail funds are shifting towards loss-making tech stocks, high short positions, and cryptocurrencies.
- Capital expenditures as liquidity: Record spending by mega-corporations acts as a liquidity pump for the private sector, with funds flowing to suppliers, employees, and shareholders, then back into the market.
- Side effects: AI infrastructure development (data centers, chips, power) is currently reflected in investment growth, which will manifest as productivity improvements in the future. Time lag → wealth effect is immediate.
2) TCos = DAT
- From "first generation" to price-chasing TCos: Early TCos (like Saylor) were insensitive to price. Emerging ETH-centered TCos pursue price, defend key levels, and break through while accelerating upstream equity value.
- Reflexive cycle: Equity financing → purchase reserve assets (BTC/ETH) → token price increase → TCos equity increase → capital costs decrease → repeat. This is the flywheel effect.
- Fatal weakness: Gaps between defensive levels. If ETFs/retail fail to fill the middle gap, failed breakout attempts will force traditional financial companies (TCos) to hold cash, and prices will quickly retreat.
3) Favorable policies and market positioning
- Relaxation of cryptocurrency regulations and a more friendly stance have unlocked funding channels for traditional finance (TradFi).
- Tariff "solutions" are just a mirage: Companies still cannot accurately judge future tariff trends. Uncertainty leads companies to favor financialization over capital expenditures—more funds chasing assets.
Current state of Ethereum (and reasons for its rise)
After years of underperformance compared to L2, demand for government bonds + ETF inflows have brought a turning point for ETH.
"Cup theory" perspective: ETH trading companies (TCos) defending $3000, $3300 to $3500, $4000; retail (ETFs) need to fill the middle gap. If about $27 billion in demand is realized in phases, the current market can continue. If not, price volatility (the gap at the bottom of the cup) will become an issue.
Personal view: The buyer group for ETH now has a structural change compared to previous cycles. It is no longer "retail vs miners," but rather ETF + TCos vs liquidity gap.
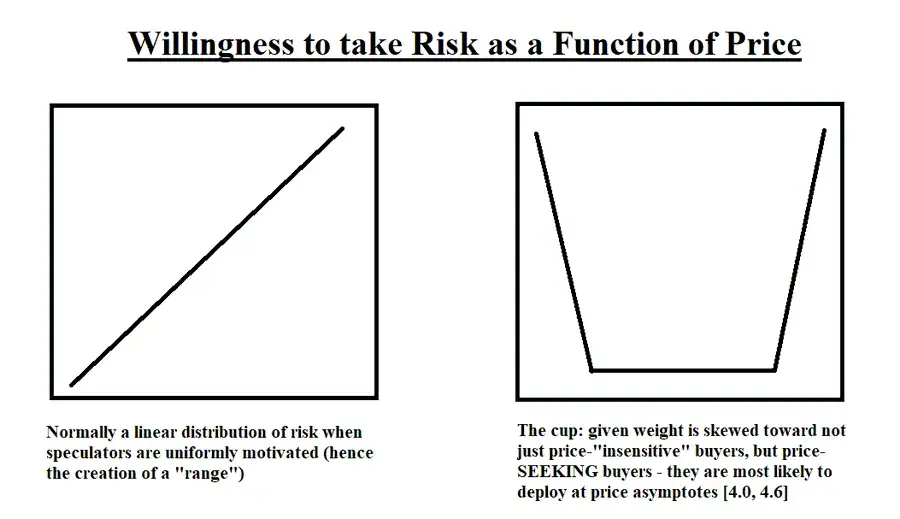
Image source: X
Macro: Wall of Worries (and why the market is rising)
Inflation
- Surveying supply chain pressures: The sales price index has risen for three consecutive months (the highest since August 2022), indicating rising commodity price pressures, consistent with tariff pass-through, a weakening dollar, and sticky wages.
- Interpretation: An implied inflation rate of about 4% is not a crisis but complicates the case for rate cuts. The Federal Reserve can only tolerate growth-friendly inflation if there are no cracks in the labor market.
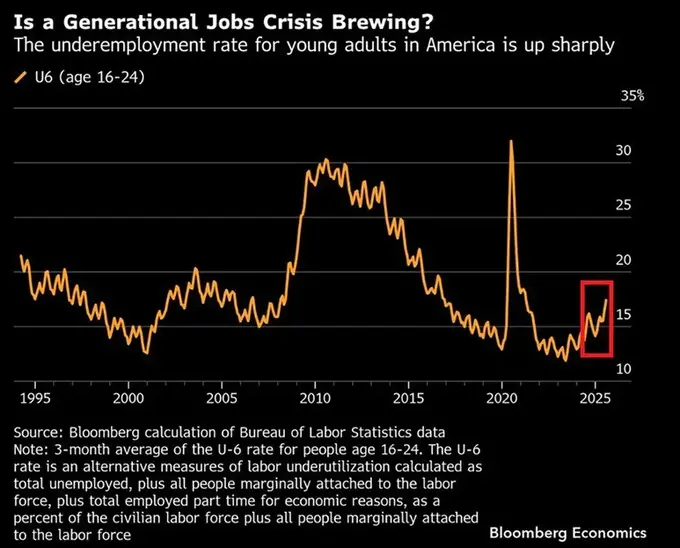
Labor
- The youth unemployment rate in the labor market has surged (around 17%, three-month average), serving as a warning sign in the early stages of the economic cycle. Young people are the first to feel changes in the economic situation; if this spreads to core employment areas, risks will emerge.
Growth, Debt, and AI
- The fiscal offset effect of AI: If total factor productivity is 50 basis points higher than the benchmark level over the next few decades (AI scenario), by 2055, the public debt-to-GDP ratio could be around 113%, compared to a benchmark level of 156%, and per capita real GDP could be about 17% higher. In other words, AI is the only reliable growth lever capable of reversing the debt curve.
- But the lag effect is significant: The capital expenditures on computers in the 1980s leading to the productivity boom in the late 1990s indicate that the adoption of AI takes time. Today, the market is underestimating future efficiencies.
Tariffs and Uncertainty
- Policy fog = valuation clarity risk: Uncertain tax rates, ambiguous agreements (EU/Japan), changes in exemptions, and legal challenges have made future cost curves unclear. This leads CFOs to prefer holding financial assets over long-term physical assets, ironically supporting the market while increasing mid-term inflation risks.
Bear Market vs. Bull Market
Bearish Factors
- Declining treasury cash balances + limited quantitative tightening (QT).
- Seasonal weakness in September.
- Early signs of fatigue in the labor market; inflation accelerating again (tariffs/wages).
Bullish Factors
- AI capital expenditures + wealth effect are the current sources of liquidity.
- The shift in cryptocurrency policy has opened the funding floodgates for traditional finance.
- The TCos/ETF structure is a continuous mechanical buyer.
- The dovish tilt of the Federal Reserve's composition in 2026 is a credible forward-looking catalyst.
In summary: As long as the chain from AI → retail → TCos → spot remains intact, optimism is warranted.
When will I change my mind?
- Reduction in mega-capital expenditures: A noticeable decrease in AI infrastructure orders.
- Stagnation in ETF demand: Continued capital outflows or failed secondary offerings.
- Closure of TCo equity financing windows: Decrease in financing rounds, failed issuances, or a collapse in the premium-to-net-asset-value ratio.
- Weakness in the labor market: Youth employment market weakness spreading to the prime-age employment market.
- Tariff shocks → consumer price index: Commodity inflation forcing the Federal Reserve to tighten policy again rather than cut rates.
Cycle Positioning (NFA)
- Core: High-quality AI composite companies; selectively holding key assets (computing, power, networks).
- Cryptocurrency: BTC as a beta version, ETH as a reflexive flywheel. Emphasize defensive levels; assume gaps exist between the two.
- Risk management: Adjust positions based on ETF flow data, TCo issuance calendars, and mega-corporation guidance. Increase positions at defensive levels; reduce positions in frenzied breakouts lacking follow-through.
Conclusion
This cycle is different from 2021.
It is driven by private sector liquidity, sourced from AI equity gains and capital expenditures, and transferred into cryptocurrency through new corporate structures, recognized by ETFs.
The flywheel is real, and it will keep turning until the top of the pyramid (mega-corporations) stops operating.
Until then, the path of least resistance remains upward (bullish) and to the right (sideways).
Related reading: HashKey Trading Moment: Bitcoin's $110,000 to $112,000 volume gap awaits filling, Ethereum holding steady at $4100 is a bullish key
免责声明:本文章仅代表作者个人观点,不代表本平台的立场和观点。本文章仅供信息分享,不构成对任何人的任何投资建议。用户与作者之间的任何争议,与本平台无关。如网页中刊载的文章或图片涉及侵权,请提供相关的权利证明和身份证明发送邮件到support@aicoin.com,本平台相关工作人员将会进行核查。


