Summary
• BTC is experiencing high-level fluctuations with a robust structure, while ETH is steadily rising close to 4,000 USDT, showing relatively strong short-term performance. In terms of volatility, BTC remains stable while ETH has increased, reflecting a rise in market divergence.
• The long-short ratio and funding rates have retreated to a neutral and conservative range, with the amount of positions maintained at a high level, and ETH leverage growth is more significant.
• The overall liquidation structure is rational, with long liquidations reaching 630 million USD on July 23, providing momentum for high-level cleansing.
• The overall market continues to exhibit a structurally bullish pattern, with cautious capital participation but not deviating from the trend foundation, still possessing potential for upward momentum.
• In terms of quantitative strategies, the MACD trend strategy has achieved over 150% returns in SUI tokens, demonstrating good short-term trading potential.
Market Overview
To systematically present the current capital behavior and trading structure changes in the cryptocurrency market, this report analyzes five key dimensions: the price volatility of Bitcoin and Ethereum, the long-short trading ratio (LSR), contract position amounts, funding rates, and market liquidation data. These five indicators cover price trends, capital sentiment, and risk conditions, providing a comprehensive reflection of the current market's trading intensity and structural characteristics. The following will sequentially analyze the latest changes in each indicator since July 15:
- Analysis of Bitcoin and Ethereum Price Volatility
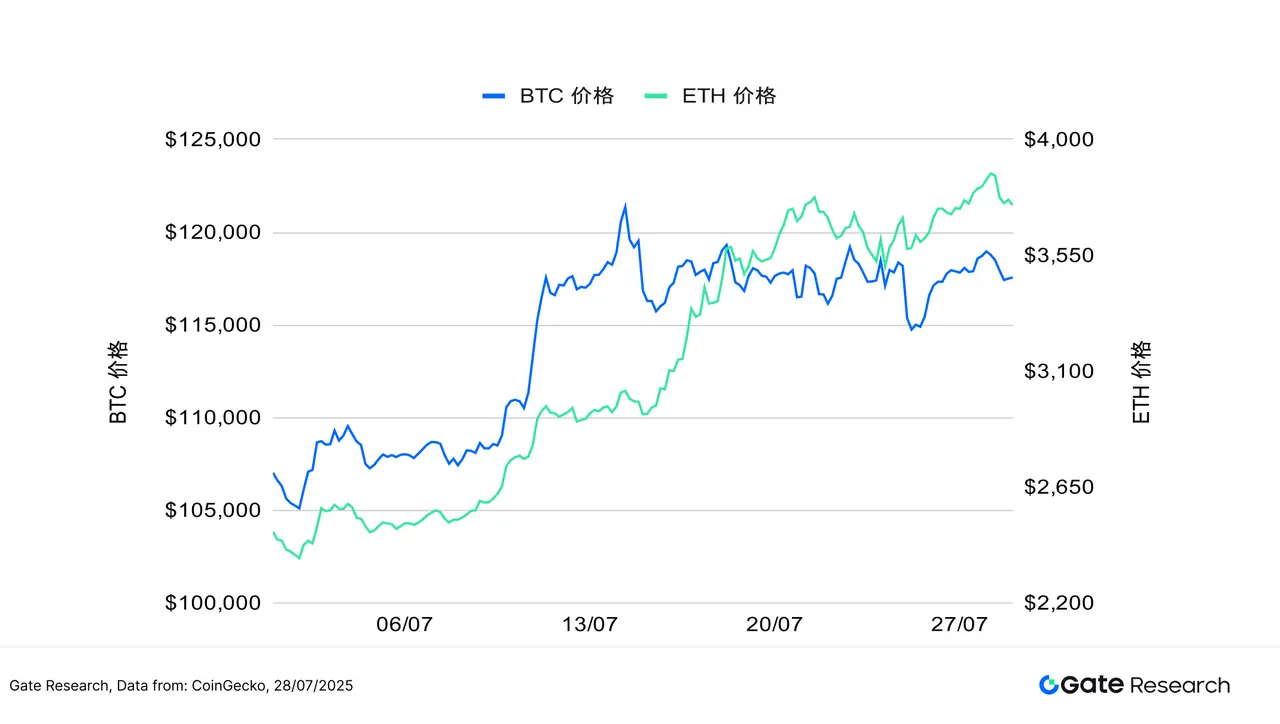
According to CoinGecko data, from July 15 to 28, the cryptocurrency market has been consolidating at high levels, with BTC and ETH entering a sideways range after breaking through their respective peak levels. Short-term momentum has become subdued, but the overall structure remains bullish.
For BTC, after reaching an all-time high of 123,000 USDT on July 14, it entered a high-level fluctuation range, with prices repeatedly testing around 119,000 USDT. Technically, the short-term moving averages and MA30 are in a sticky state, and although the MACD briefly formed a golden cross, the momentum bars have slowed down, and the price lacks further breakout support. Trading volume has continued to decrease after the peak, reflecting a decline in market chasing willingness. Nevertheless, the overall support level remains stable, with significant buying strength in the 115,000–116,000 USDT range.
From a fundamental perspective, the Bitcoin ecosystem continues to expand, with annual on-chain transaction volume officially surpassing Visa, marking its payment attributes gradually gaining recognition in the global capital market. At the same time, on-chain liquidity is tightening, and institutional holdings are continuously rising, reinforcing BTC's role as "digital gold" and a core collateral asset. Merlin Chain recently completed its 2.0 upgrade, aimed at enhancing Bitcoin's yield capabilities and cross-chain applications, introducing more practical use cases for BTC, which is expected to drive long-term value reassessment.
On the ETH side, it has shown a relatively robust upward trend over the past two weeks. Starting from around 3,550 USDT, ETH has been steadily rising along the short-term moving averages and approached the 4,000 USDT mark on July 28, with a complete technical structure. The MACD continues to expand, and the moving averages are in a bullish arrangement, indicating stable momentum. Although trading volume has not seen explosive growth, moderate expansion combined with the trend shows that market participation willingness is gradually increasing.
In summary, since mid-July, the cryptocurrency market has overall entered a high-level consolidation period, with BTC trapped in a range after reaching new highs, momentum slowing down, and volume continuously decreasing, but the support below remains solid, with favorable fundamentals providing strong support for mid- to long-term trends. ETH, on the other hand, demonstrates a stronger continuation trend, with a complete technical structure and steady upward movement along the moving averages, with increasing capital participation nearing the critical 4,000 USDT mark. Overall, although the market lacks clear breakout momentum in the short term, mainstream assets maintain a healthy upward structure, and with ecological expansion and accelerated institutional allocation, the bullish trend foundation remains, and the market is expected to welcome a new round of momentum after consolidation.
Figure 1: BTC has fluctuated at high levels over the past two weeks, repeatedly facing resistance at 119,000 USDT, with momentum slowing; ETH steadily rises close to 4,000 USDT, showing stronger short-term performance than BTC, with market confidence recovering.
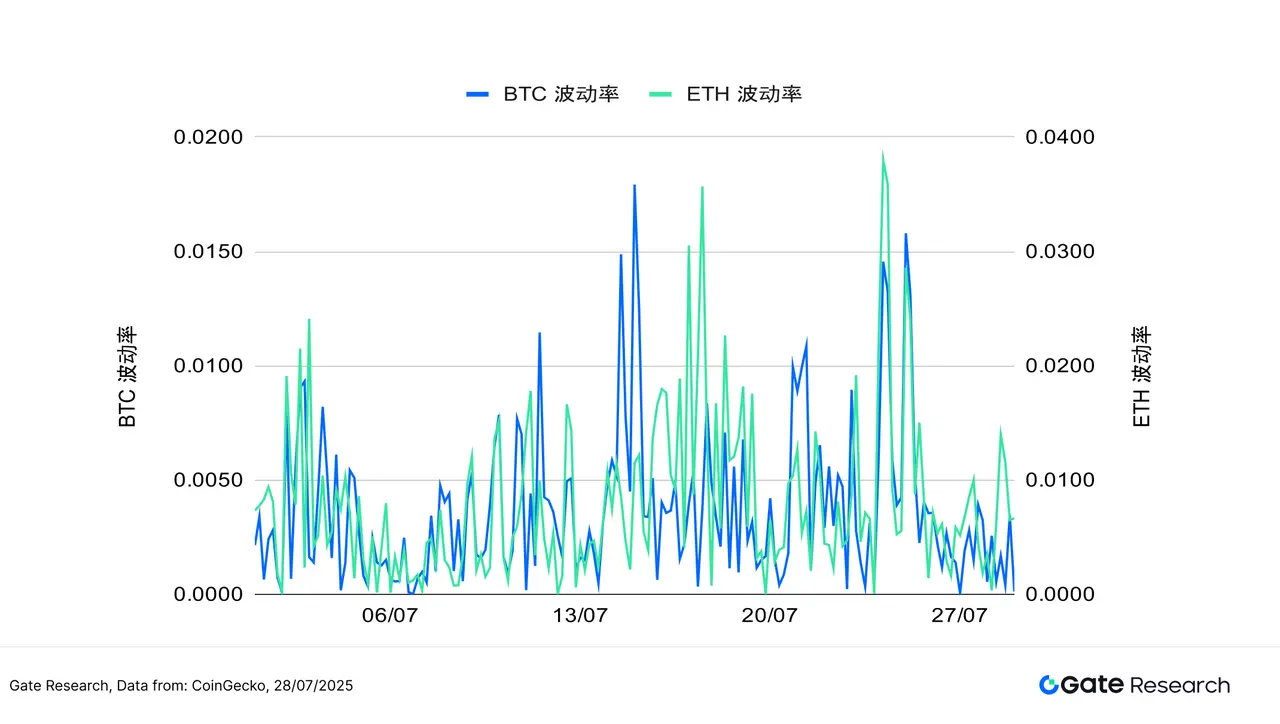
In terms of volatility, BTC overall maintains moderate fluctuations, only briefly expanding on certain trading days, with a relatively stable overall rhythm, indicating clear operational rhythm of market leading capital and strong trend expectations. In contrast, ETH's volatility has seen multiple significant surges since mid-July, especially around July 16 and 25, where the amplitude rapidly increased, reflecting greater divergence in the market regarding its breakout direction, with active short-term testing and trading behavior.
Although both have not deviated from historically low volatility ranges, ETH's recent repeated increase in volatility indicates that its market sentiment is relatively sensitive and easily influenced by short-term news or capital-driven reactions. If subsequent trading volume also increases, it may drive ETH to make directional choices, and it is necessary to continuously monitor whether its price fluctuations translate into trend movements.
Figure 2: BTC's volatility remains stable overall, while ETH frequently expands in mid to late July, reflecting intensified short-term trading sentiment and directional divergence.
The overall cryptocurrency market has maintained a high-level fluctuation pattern over the past two weeks, with BTC lacking further momentum after refreshing its historical high, trapped in range consolidation, with both volume and volatility converging, but bottom support remains stable, and the structure is intact; ETH shows a robust trend, moving upward along the moving averages and approaching 4,000 USDT, performing relatively strongly. In terms of volatility, BTC's rhythm is stable; ETH's volatility has significantly increased, reflecting capital divergence and heightened testing sentiment. Overall, although the market's short-term momentum has slowed, the mainstream asset structure remains healthy, and ecological development and capital participation continue to support the market, and once volume and price align, a new round of trend selection is expected.
- Analysis of Bitcoin and Ethereum Long-Short Trading Scale Ratio (LSR)
The long-short trading scale ratio (LSR, Long/Short Taker Size Ratio) is a key indicator measuring the trading volume of long and short positions in the market, typically used to assess market sentiment and trend strength. When LSR is greater than 1, it indicates that the volume of active buying (long positions) is greater than that of active selling (short positions), suggesting that the market is more inclined to go long, with a bullish sentiment.
According to Coinglass data, the BTC long-short trading scale ratio (LSR) has generally trended downward, and although the price remains in a high range, the long-short ratio has not been able to sustain a bullish level, repeatedly dipping below 1, and even falling below 0.90 by July 28, reflecting a weakening willingness to chase prices at high levels, with short-term capital becoming more conservative, indicating that although BTC's structure remains strong, market enthusiasm has waned. Overall, the decline in the long-short ratio after BTC reached new highs shows a decrease in short-term optimistic sentiment, with some capital choosing to gradually reduce positions or remain on the sidelines.
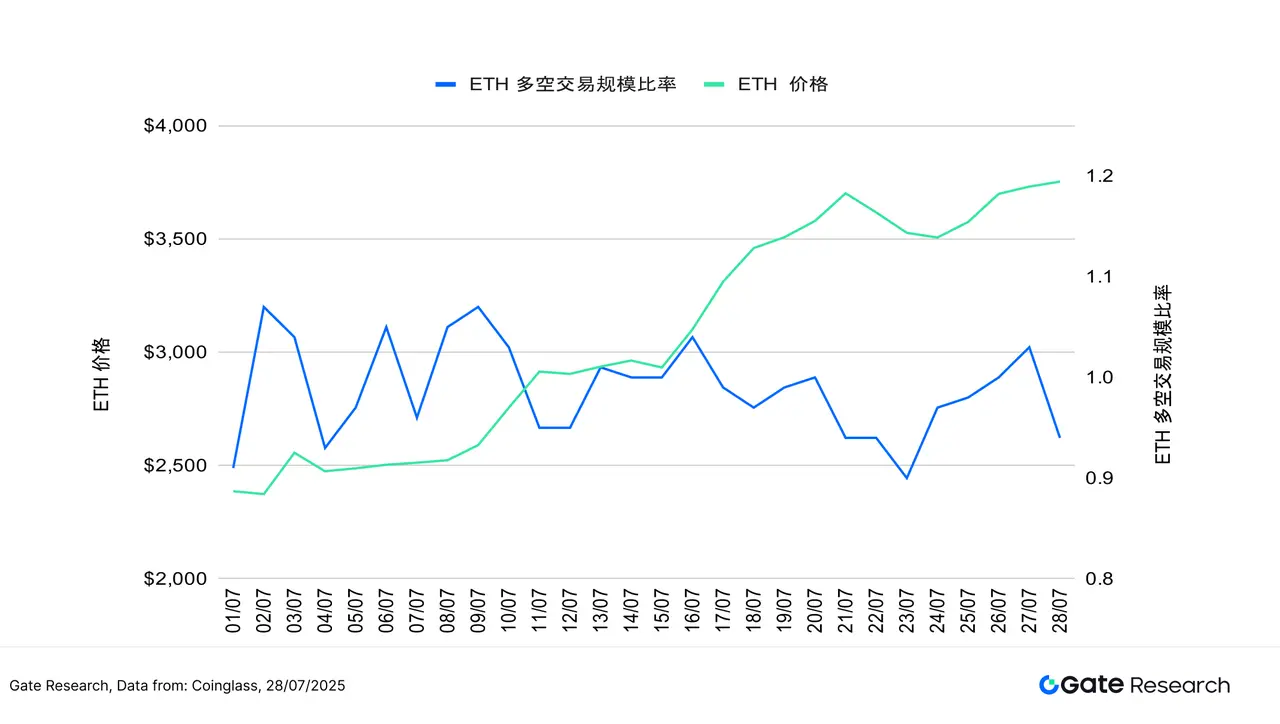
The ETH long-short ratio, on the other hand, exhibits a decoupling characteristic from price trends. Despite the price steadily rising and approaching 4,000 USDT since July 15, the long-short ratio has gradually weakened since mid-July, consistently hovering around 0.95 and even briefly dipping below 0.90, indicating that market capital operations are relatively cautious and there may be doubts about the sustainability of ETH's rise. The LSR has remained at a bearish level for several consecutive days, reflecting a preference for tentative short positions among short-term capital, with the market rising but sentiment not synchronously strengthening.
Overall, both BTC and ETH have seen their long-short ratios weaken while prices remain high, indicating increased divergence in market sentiment and a more cautious capital layout. In the short term, attention should be paid to whether the long-short ratio can rebound, serving as a leading signal for whether prices will continue their upward trend.
Figure 3: The long-short ratio gradually declines during BTC's high-level fluctuations, reflecting a weakening willingness to chase prices.
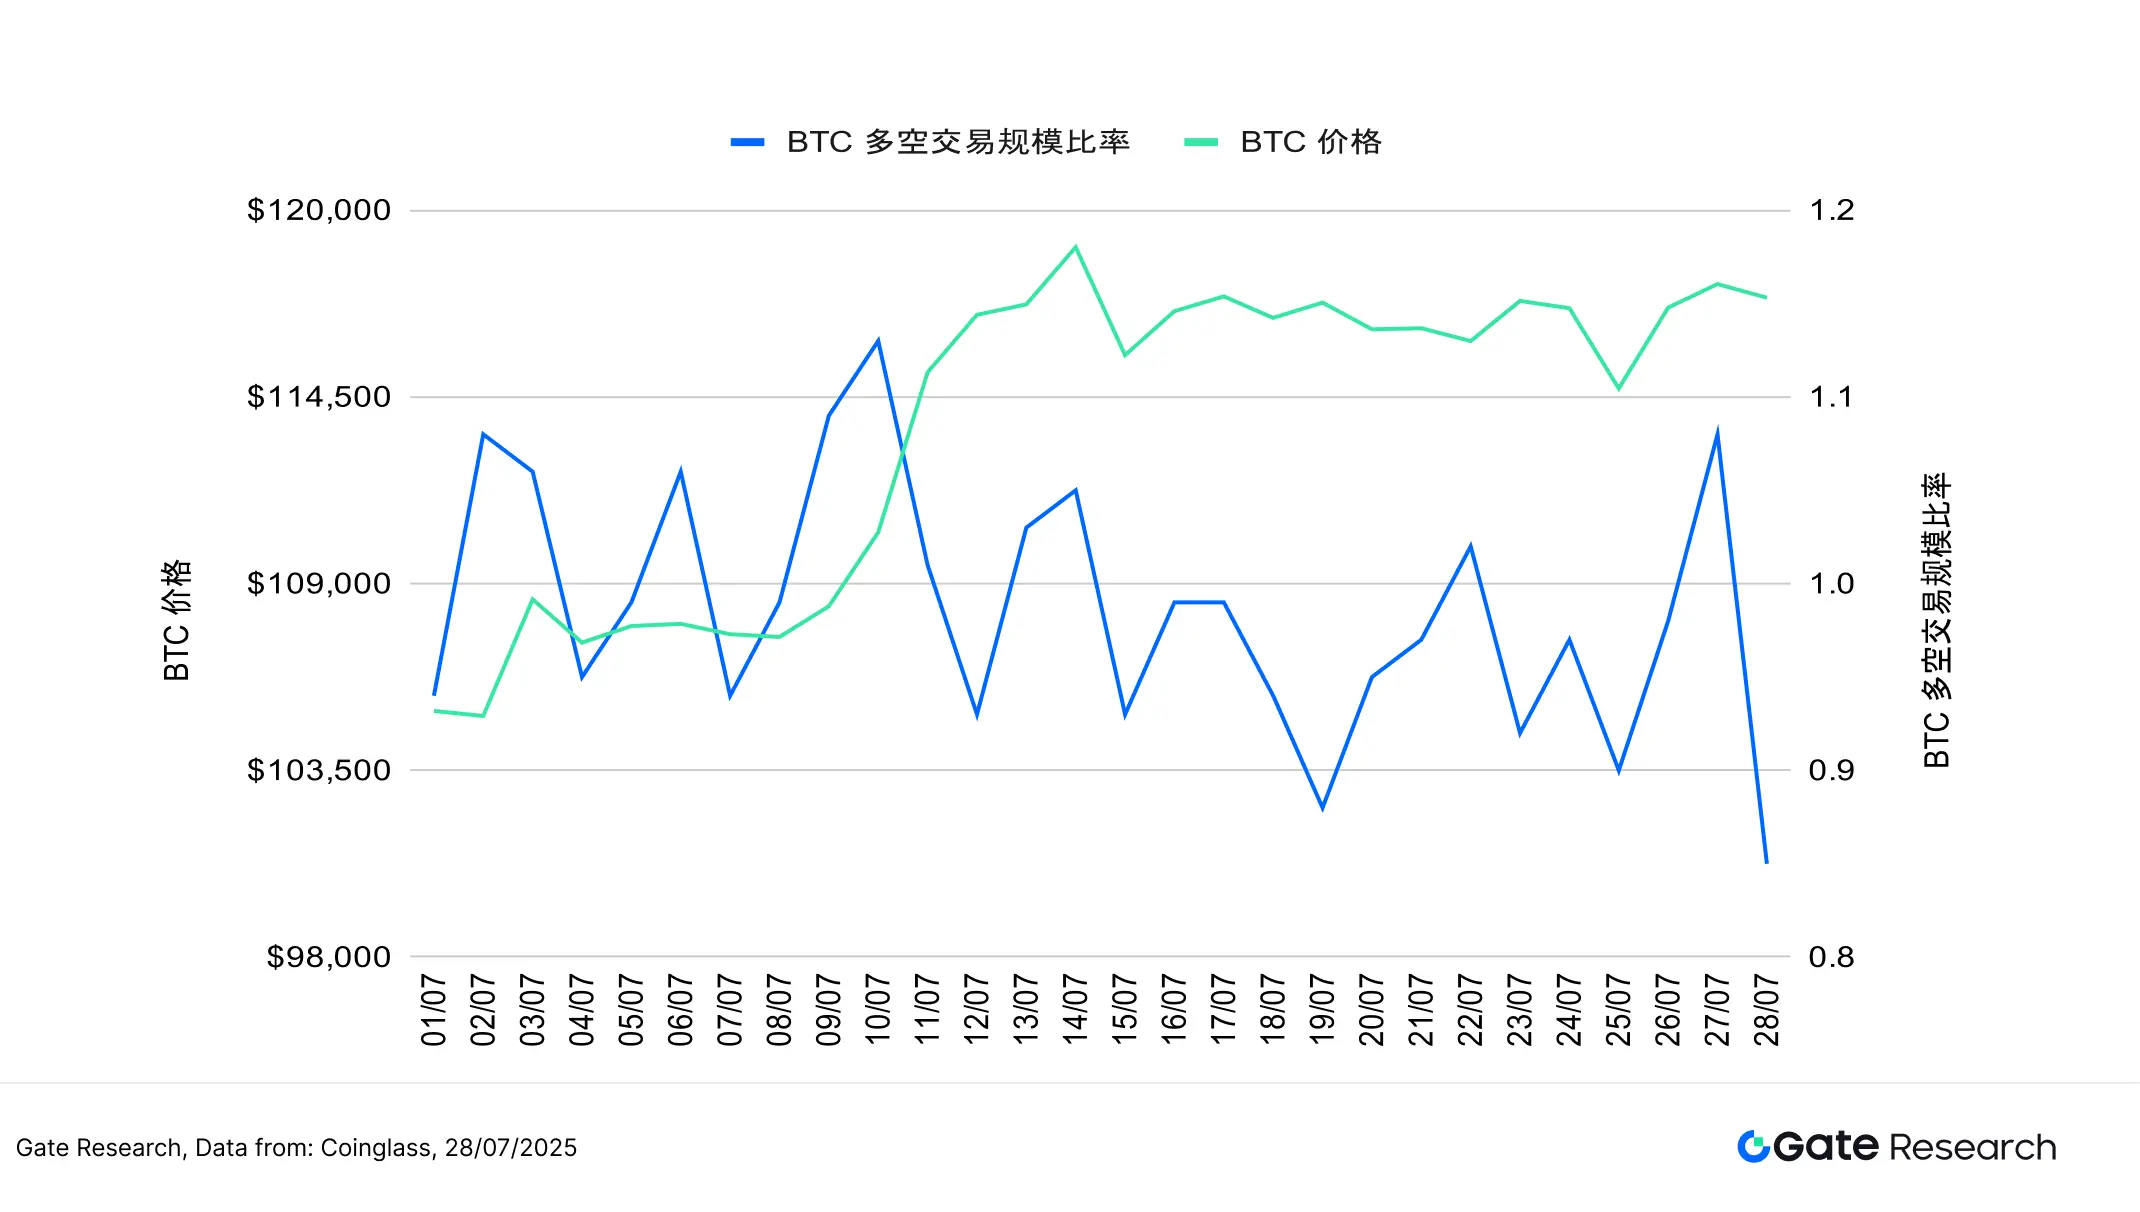
Figure 4: The ETH long-short ratio remains in a bearish range, with a relatively conservative capital participation attitude.
- Analysis of Contract Position Amounts
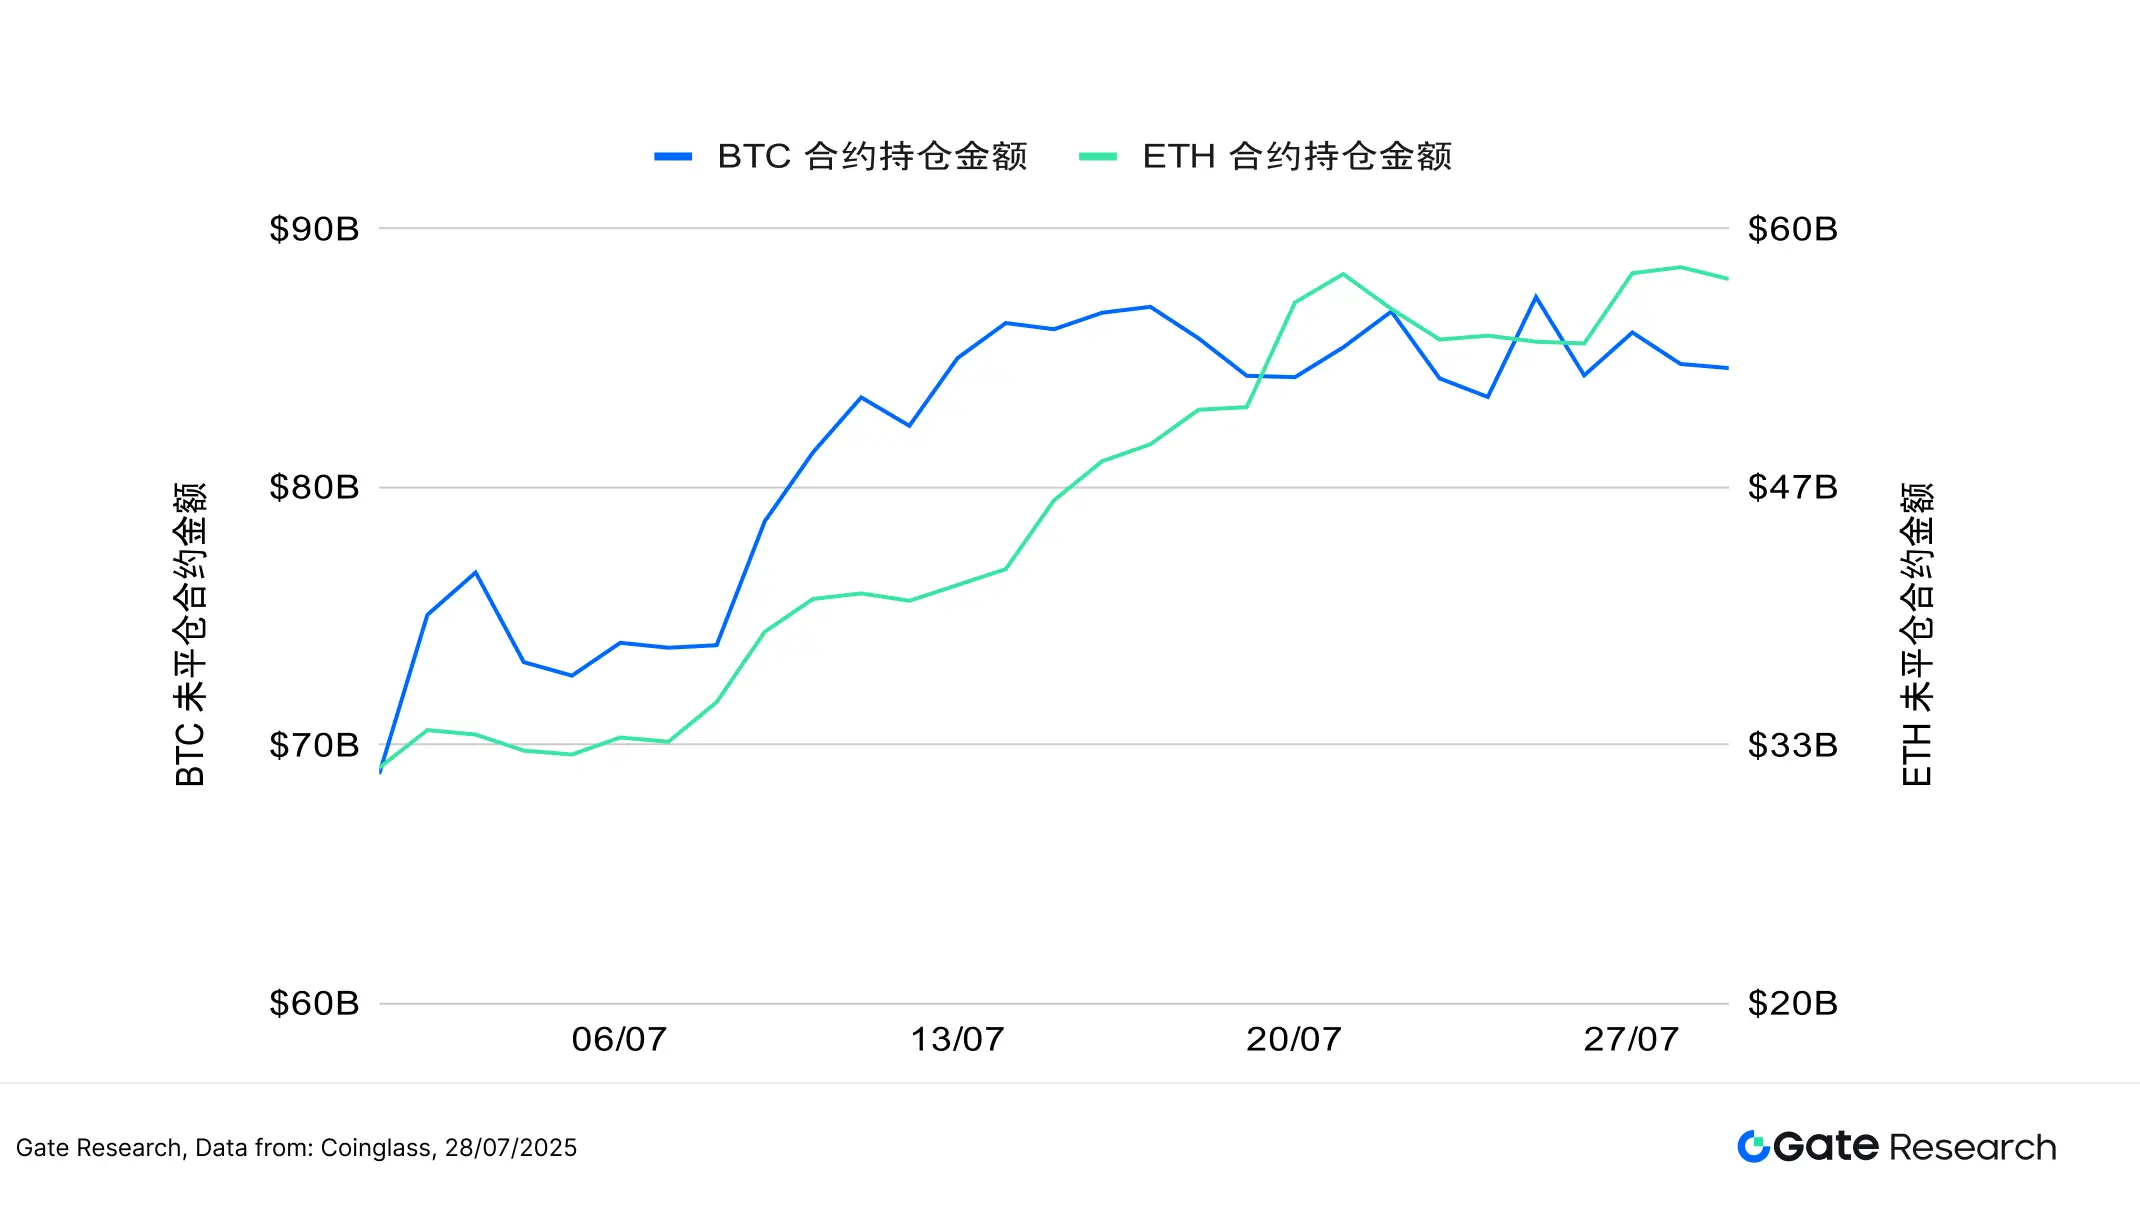
According to Coinglass data, the contract position amounts for BTC and ETH have generally maintained high-level fluctuations, indicating that after actively entering the market in the early stages, leveraged capital has entered a wait-and-see or high-level speculative state in the short term. BTC's contract position amount has repeatedly tested the 85 billion to 88 billion USD range since mid-July, although it has not significantly broken through, the overall level remains at a near-month high; ETH's contract positions have continued to grow steadily, breaking through 50 billion USD in mid-July and maintaining around 57 billion USD by July 28, setting a new high for the year.
It is noteworthy that the growth rate of ETH's contract positions has been significantly faster than that of BTC in mid to late July, reflecting a more active willingness in the market to leverage bets on ETH's subsequent trends, which also corresponds to its spot price gradually rising and increasing capital enthusiasm.
Overall, both BTC and ETH's leveraged capital are actively operating at high levels, with market risk appetite maintaining a recovery trend. However, as prices and leverage levels are both at relatively high levels, if market volatility intensifies in the future, it may trigger phase-specific concentrated liquidation pressure, and it is advisable to continuously monitor changes in position amounts and liquidation risks to prevent abrupt shifts in market sentiment.
Figure 5: BTC and ETH contract position amounts maintain high-level fluctuations, indicating strong leverage capital enthusiasm, with ETH's growth rate being more pronounced.
- Funding Rates
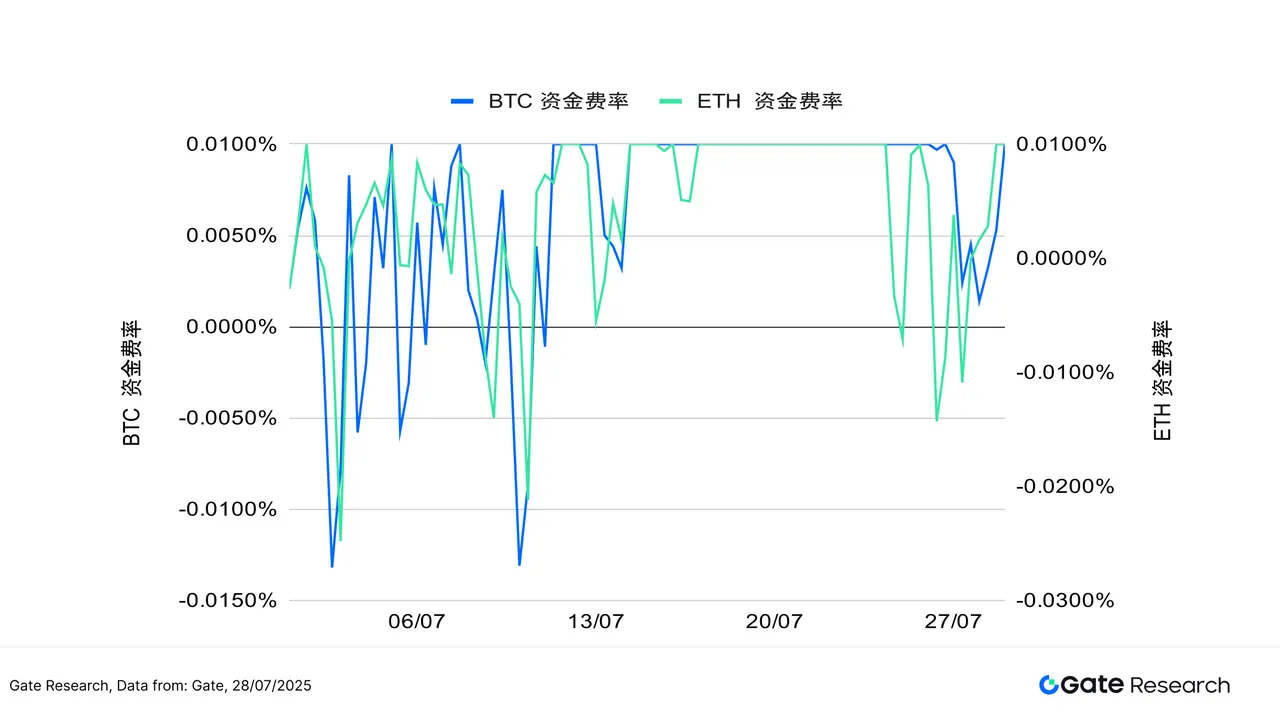
Over the past two weeks, the funding rates for BTC and ETH have generally fluctuated slightly around the zero axis, indicating a stalemate between bullish and bearish forces in the market, with limited investor willingness to chase prices and leveraged capital not yet significantly intervening. While prices remain high, funding rates have not seen significant increases, reflecting that this round of price increases is more driven by spot and low-leverage capital, with a relatively stable market structure that helps avoid short-term bubble risks.
From the trend perspective, ETH's funding rates have briefly turned negative multiple times during this period, especially between July 24 and 26, where it fell deeply, reaching a low of nearly -0.015%, but quickly recovered without triggering large-scale liquidations or price reversals, indicating good overall market resilience. It is worth noting that BTC's funding rate fluctuations are relatively small and stable, showing that institutions and conservative capital still prefer to allocate to it; while ETH's funding rate fluctuates slightly higher, reflecting market divergence regarding its subsequent trends, with operations leaning more towards trading.
Overall, while the current funding situation has not significantly supported the market, it also does not constitute substantial pressure. If funding rates can stabilize and turn positive while maintaining high levels, along with increased trading volume, it will become an important signal for accelerating price increases, warranting continuous attention.
Figure 6: BTC and ETH funding rates fluctuate around the zero axis, indicating a strong wait-and-see sentiment among short-term funds, with leverage momentum yet to expand.
- Cryptocurrency Contract Liquidation Chart
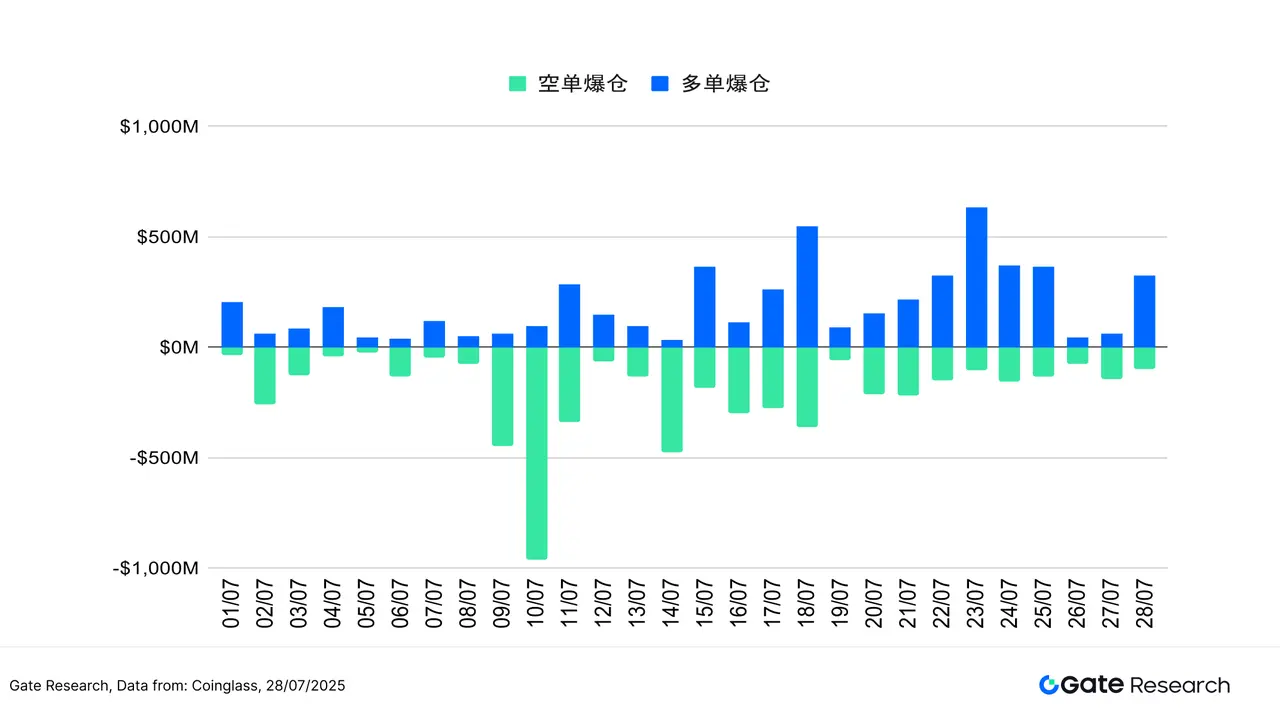
According to Coinglass data, the overall structure of contract liquidations in the cryptocurrency market has maintained a balance of tension over the past two weeks, with no systemic crashes or concentrated liquidations occurring. However, there have been localized liquidations during the phase of fluctuations. On the long side, significant liquidations occurred on July 18 and July 23, with the latter seeing a single-day liquidation amount reaching 630 million USD, the highest in this phase, indicating that funds chasing high prices faced reverse liquidations during the consolidation. Although there is still upward momentum in the market, the pace has clearly slowed.
The liquidation of short positions has been relatively mild, only seeing concentrated stop-loss liquidations during the strong upward movement on July 18, while remaining low during other times, reflecting a more conservative operation of short funds, with attempts to "catch the top" not triggering large-scale liquidations.
Overall, the current liquidation structure does not show systemic imbalance, indicating that the market maintains healthy capital flow and position tension during the high-level consolidation process. Periodic long liquidations help release short-term overheating sentiment and cleanse floating chips, thereby accumulating momentum for subsequent market movements. If future volatility slows down and the frequency of liquidations decreases, it is expected to provide a more solid foundation for the market to restart its trend.
Figure 7: The long liquidation amount on July 23 reached 630 million USD, indicating that funds chasing high prices are under pressure to pull back.
In the current context of a structurally bullish market with restrained capital rhythm, the foundation for the continued rise of crypto assets remains, but after entering high-level consolidation, short-term sentiment fluctuations have intensified, with both chasing highs and lows facing phase-specific risks. The market rhythm is becoming differentiated, and investors need to utilize more precise technical tools to grasp trading rhythm and risk control. Therefore, the following content will focus on the MACD (Moving Average Convergence Divergence) in quantitative technical indicators, exploring its practical effectiveness in identifying trend reversals and capturing entry and exit signals during high-level fluctuations and wave rotation markets. We will center on the "MACD Trend Strategy," backtesting its performance under different cryptocurrencies and market structures, assessing the strategy's adaptability and stability in following trends, controlling drawdowns, and amplifying mid-term trend returns.
Quantitative Analysis - MACD Trend Strategy
Disclaimer: All predictions in this article are based on historical data and market trends, and are for reference only. They should not be considered as investment advice or guarantees of future market trends. Investors should fully consider risks and make cautious decisions when making related investments.
- Strategy Overview
This strategy is based on the MACD (Moving Average Convergence Divergence) technical indicator, combined with momentum reversal signals and risk control mechanisms, to execute trend-following trading operations. When the MACD indicator shows a golden cross (the MACD line crosses above the signal line), it triggers a buy signal, and risk is controlled through fixed take-profit and stop-loss methods, achieving disciplined entry and exit. This strategy is suitable for transitioning from a consolidation phase to a trending market, aiming to capture major upward wave segments.
This backtest targets the top ten cryptocurrency projects by market capitalization (excluding stablecoins), covering mainstream public chains and high liquidity assets, testing the strategy's adaptability and practicality under different cryptocurrencies and market phases, and verifying its feasibility and robustness in real-world deployment.
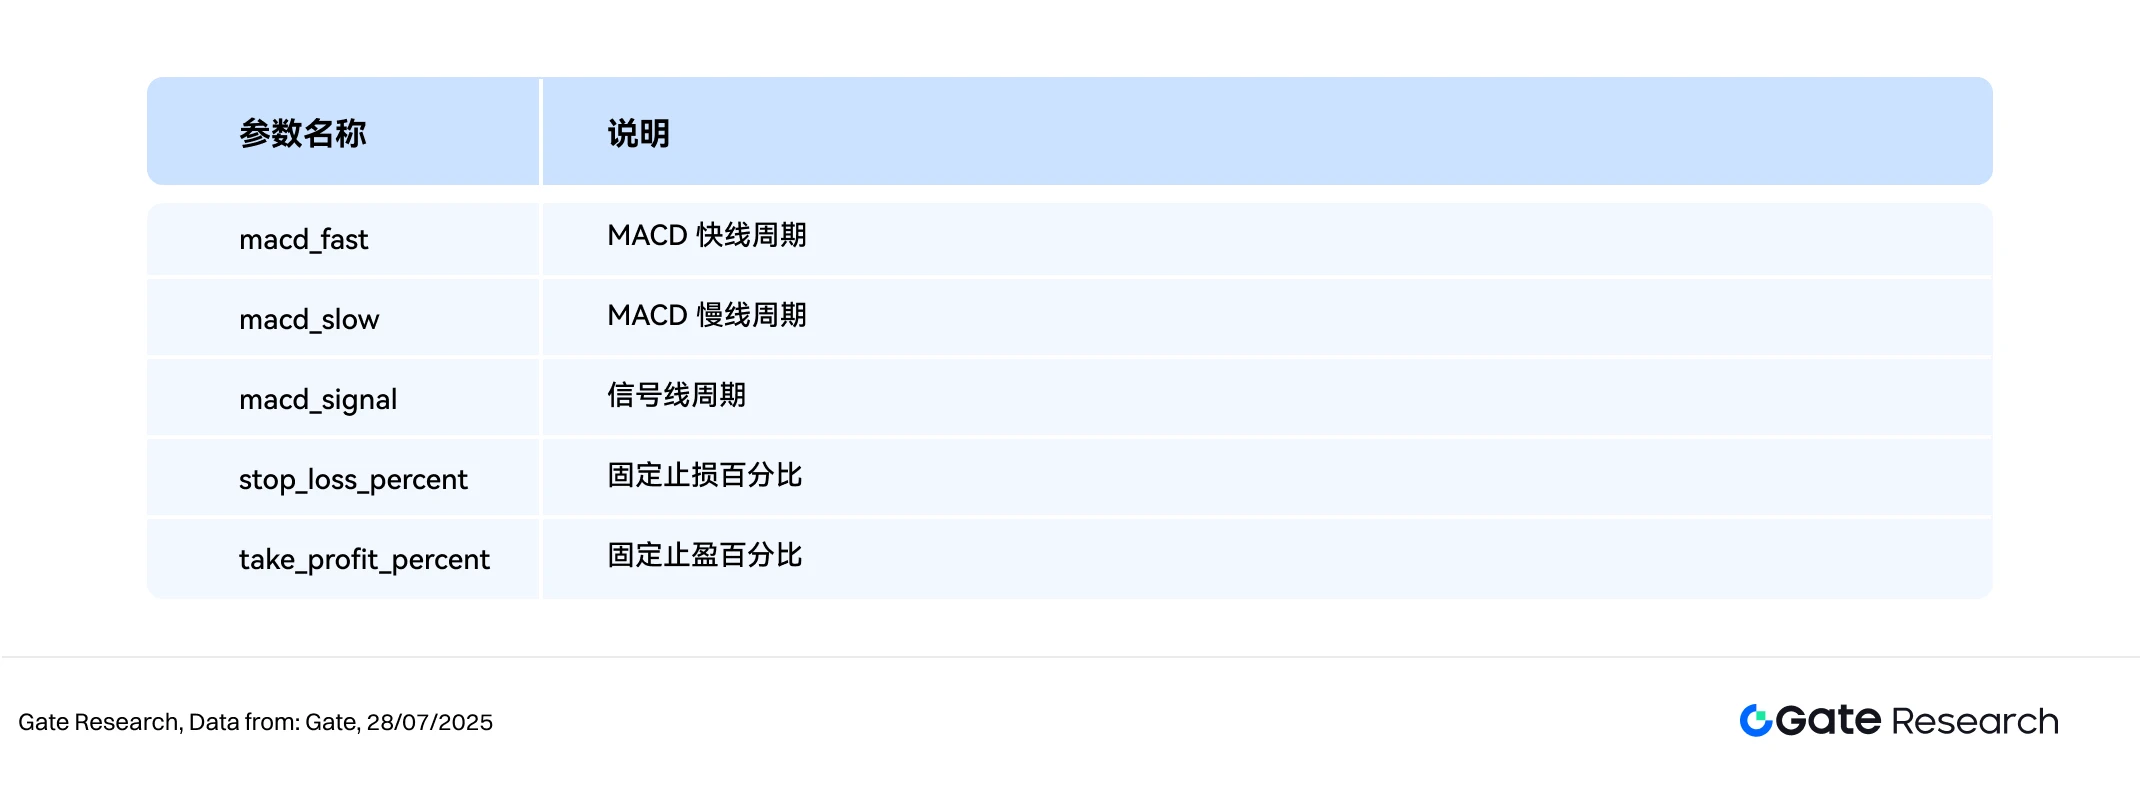
- Core Parameter Settings
- Strategy Logic and Operation Mechanism
Entry Conditions
• In a no-position state, when the MACD shows a golden cross (the MACD crosses above the signal line), it triggers a buy signal.
Exit Conditions:
• MACD Reversal: When the MACD shows a death cross (the MACD crosses below the signal line), it indicates a trend reversal signal, triggering a closing signal.
• Stop-Loss Closing: If the price falls to the buy price * (1 - stoplosspercent), it triggers a forced stop-loss.
• Take-Profit Closing: If the price rises to the buy price * (1 + takeprofitpercent), it triggers a take-profit closing.
Practical Example Chart
• Trading Signal Triggered
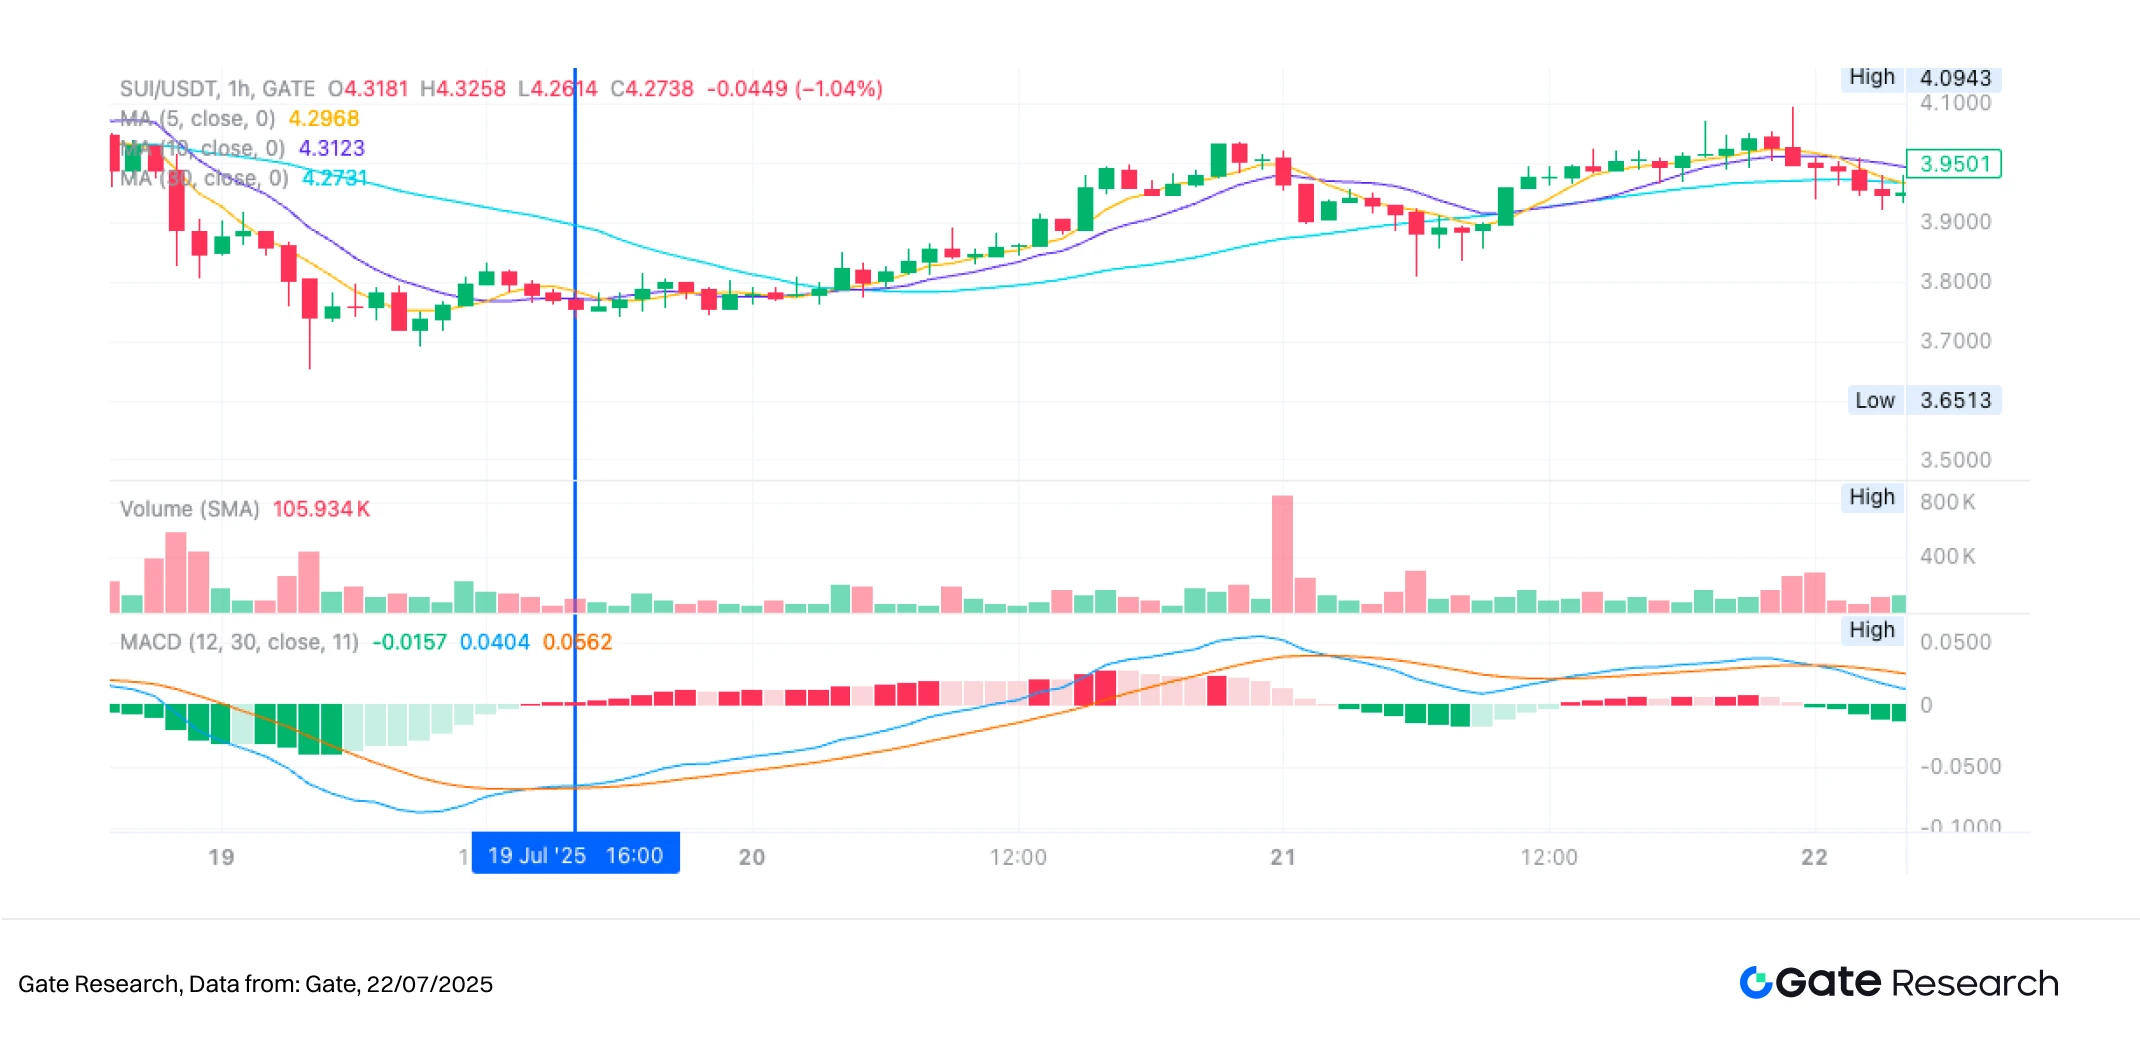
The following chart shows the SUI/USDT 1-hour candlestick chart when the strategy triggered an entry on July 19, 2025. At this time, the MACD fast line broke above the signal line from below, forming a standard golden cross signal, meeting the strategy's condition for "strengthening momentum" for long positions. Meanwhile, the price has risen above the short-term moving averages (MA5 and MA10), indicating a short-term bullish structure, with the short-term moving averages showing an upward turning trend, further strengthening the entry confirmation.
During this period, trading volume increased, and the MACD histogram turned from negative to positive, with a clear momentum reversal, reflecting a shift in market sentiment towards positivity. As the price moved away from the previous consolidation range, the strategy triggered a long position and set a fixed stop-loss of 1% and a fixed take-profit of 15%, aiming to capture the subsequent upward trend. From the subsequent price movement in the chart, it can be seen that this signal successfully positioned at the starting point of a phase of upward movement, validating the strategy's responsiveness and trading effectiveness at the initial stage of the trend.
Figure 8: SUI/USDT Strategy Entry Position Illustration (July 19, 2025)
• Trading Action and Results
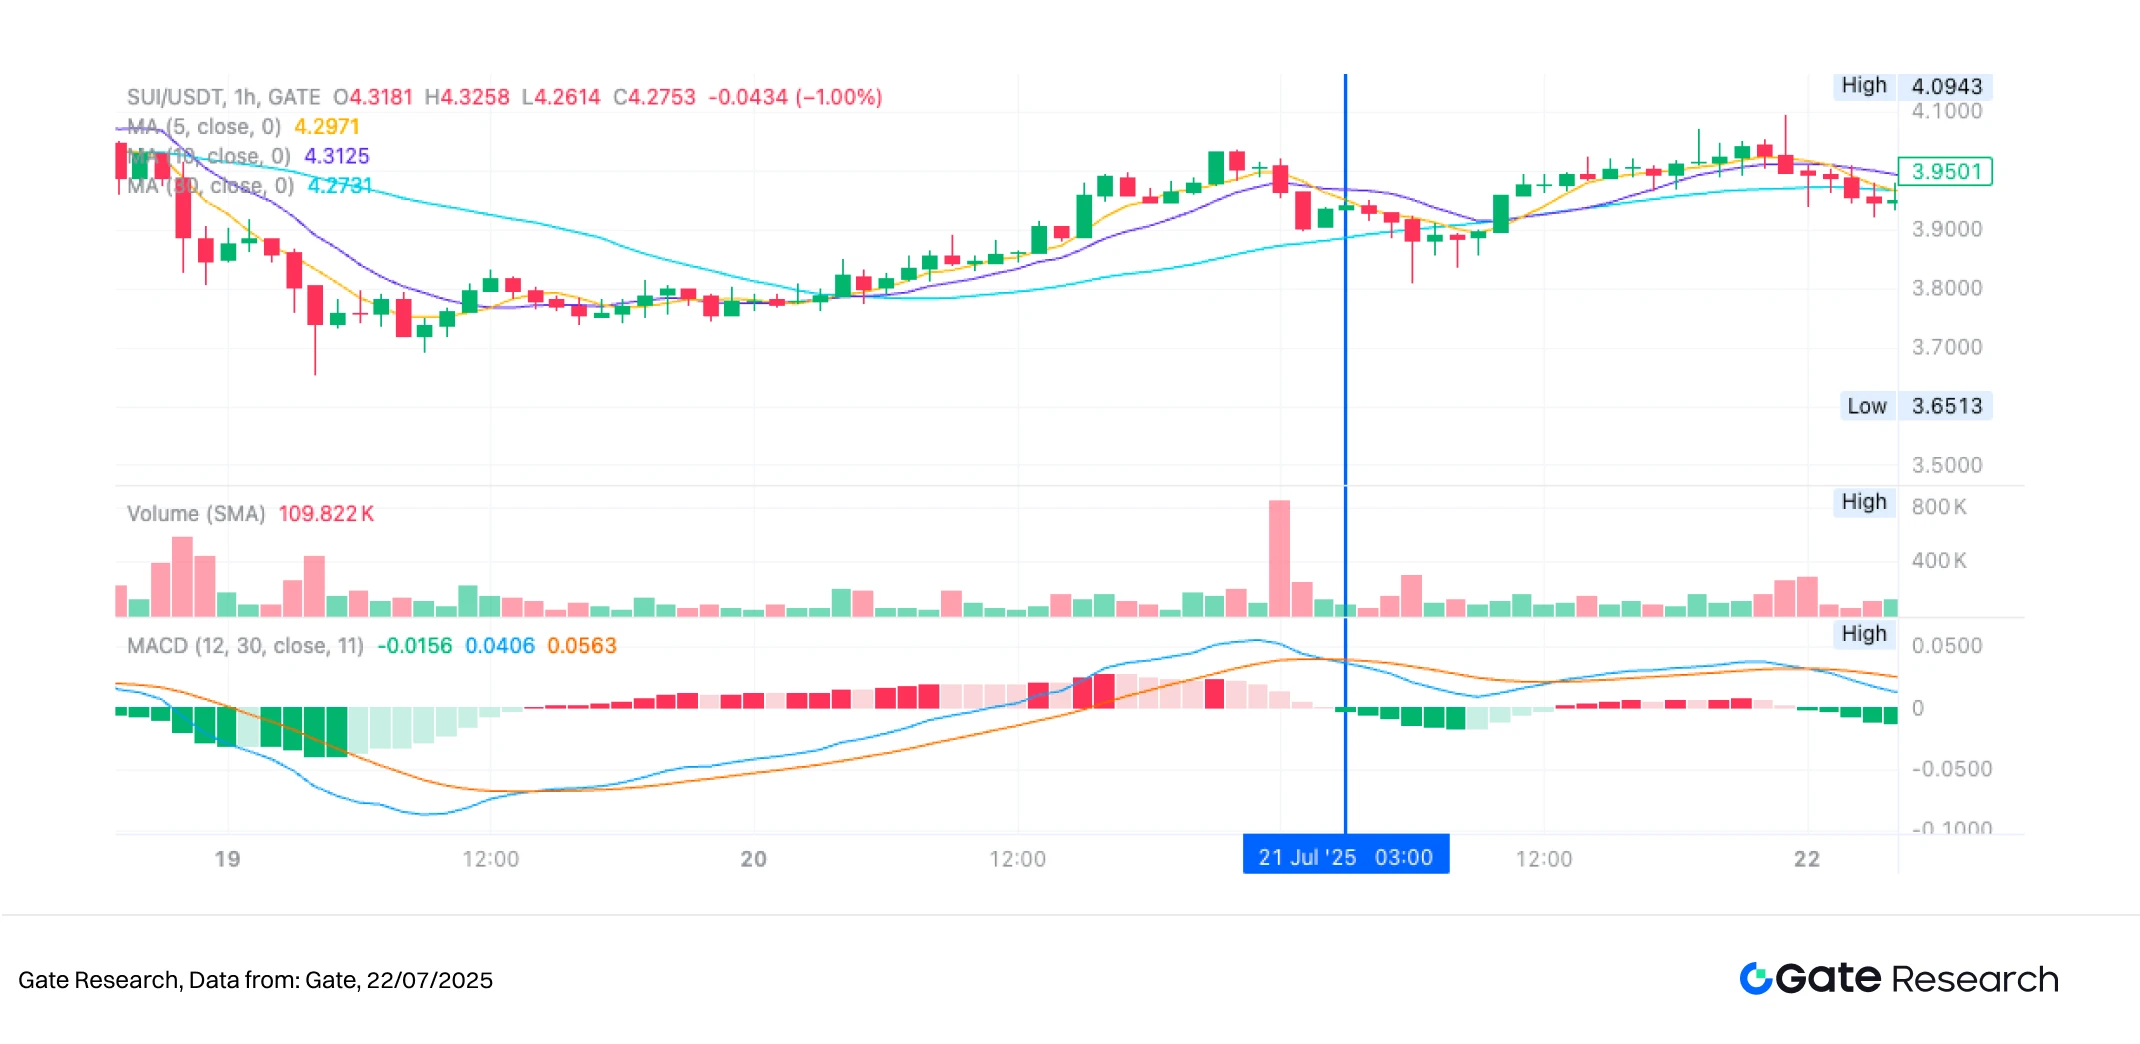
On July 21, 2025, SUI showed a MACD death cross, triggering an exit signal and executing a closing operation. In the chart, it can be seen that the MACD line broke below the signal line from above, forming a typical trend weakening signal, while the histogram converged, indicating a gradual weakening of momentum. Although the price remained above the short-term moving averages, the upward momentum had slowed, with consecutive highs failing to break effectively, and market momentum diminishing. Trading volume also did not show continued expansion, reflecting limited market willingness to chase prices. In this context, the strategy chose to exit proactively before the upward momentum exhausted, based on the "MACD death cross" as a forward-looking signal of trend reversal, locking in part of the previous range's gains.
This exit belongs to the risk control mechanism of trend reversal in the strategy, allowing for timely exit based on momentum indicators before triggering stop-loss or take-profit, effectively avoiding potential drawdowns from subsequent high-level fluctuations or trend reversals. If future strategies can further combine trend strength or volume changes to assist in judgment, it is expected to enhance the accuracy of exit signals and the ability to maintain profits.
Figure 9: SUI/USDT Strategy Exit Position Illustration (July 21, 2025)
Through the above practical examples, we visually demonstrate the entry and exit logic and dynamic risk control mechanism of the trend strategy based on the MACD indicator during the evolution of market conditions. This strategy uses the MACD golden cross as a signal of strengthening momentum, decisively entering to follow the trend, and effectively managing trading risks with fixed take-profit and stop-loss settings; it exits in a timely manner when the MACD death cross appears and momentum weakens, achieving the locking of phase gains.
While controlling drawdowns, the strategy successfully avoided potential profit reversals that high-level fluctuations might bring, demonstrating its defensive capability and trading discipline during the trend exhaustion phase. This case not only validates the feasibility and stability of the MACD strategy in real market conditions but also provides empirical foundations for future strategy optimization that combines trend strength judgment, volume-price coordination, or multi-factor signals.
- Practical Application Example
Parameter Backtest Settings
To find the best parameter combinations, we conducted a systematic grid search over the following ranges:
• macd_fast: 8 to 15 (step size of 2)
• macd_slow: 20 to 31 (step size of 2)
• macd_signal: 5 to 13 (step size of 2)
• stoplosspercent: 1% to 2% (step size of 0.5%)
• takeprofitpercent: 10% to 16% (step size of 5%)
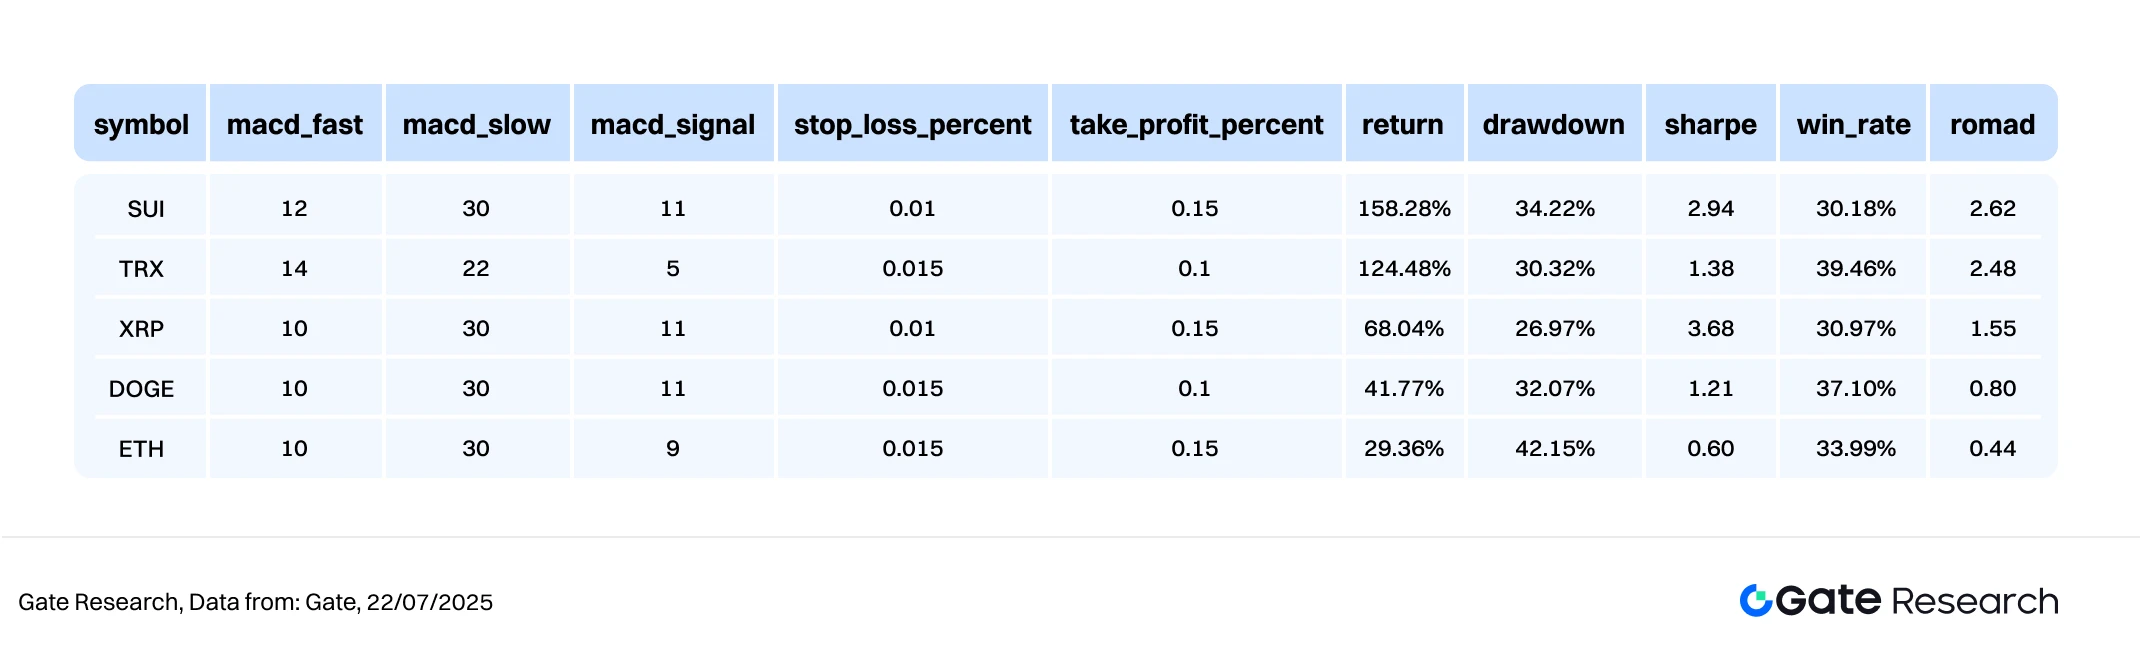
Using the top ten cryptocurrency projects by market capitalization (excluding stablecoins) as examples, this article backtested the 1-hour candlestick data from May 2024 to July 2025, testing a total of 384 parameter combinations and selecting the five with the best annualized return performance. Evaluation criteria include annualized return, Sharpe ratio, maximum drawdown, and ROMAD (return to maximum drawdown ratio), to comprehensively assess the strategy's stability and risk-adjusted performance under different market conditions.
Figure 10: Comparison Table of Five Optimal Strategy Performances
Strategy Logic Explanation
When the program detects that the MACD line crosses above the signal line (i.e., a golden cross), it is considered that market momentum is strengthening and may enter an upward trend phase, triggering a buy operation immediately. This logic aims to capture key turning points at the beginning of a trend, using the MACD to determine bullish and bearish conversion signals to confirm that the market is likely to transition from consolidation to a unilateral trend. After entering, the system will combine fixed take-profit and stop-loss mechanisms to enhance risk control performance. If the subsequent price reaches the set take-profit target or falls below a certain percentage of the buy price, the system will automatically execute an exit operation to timely lock in existing profits or control risks.
Taking SUI as an example, the settings used in this strategy are as follows:
• macd_fast = 12
• macd_slow = 30
• macd_signal = 11
• stoplosspercent = 1%
• takeprofitpercent = 15%
This logic combines price breakout signals with fixed proportion risk control rules, suitable for market environments with clear trends and distinct wave structures, effectively controlling drawdowns while following trends, enhancing trading stability and overall profit quality.
Performance and Results Analysis
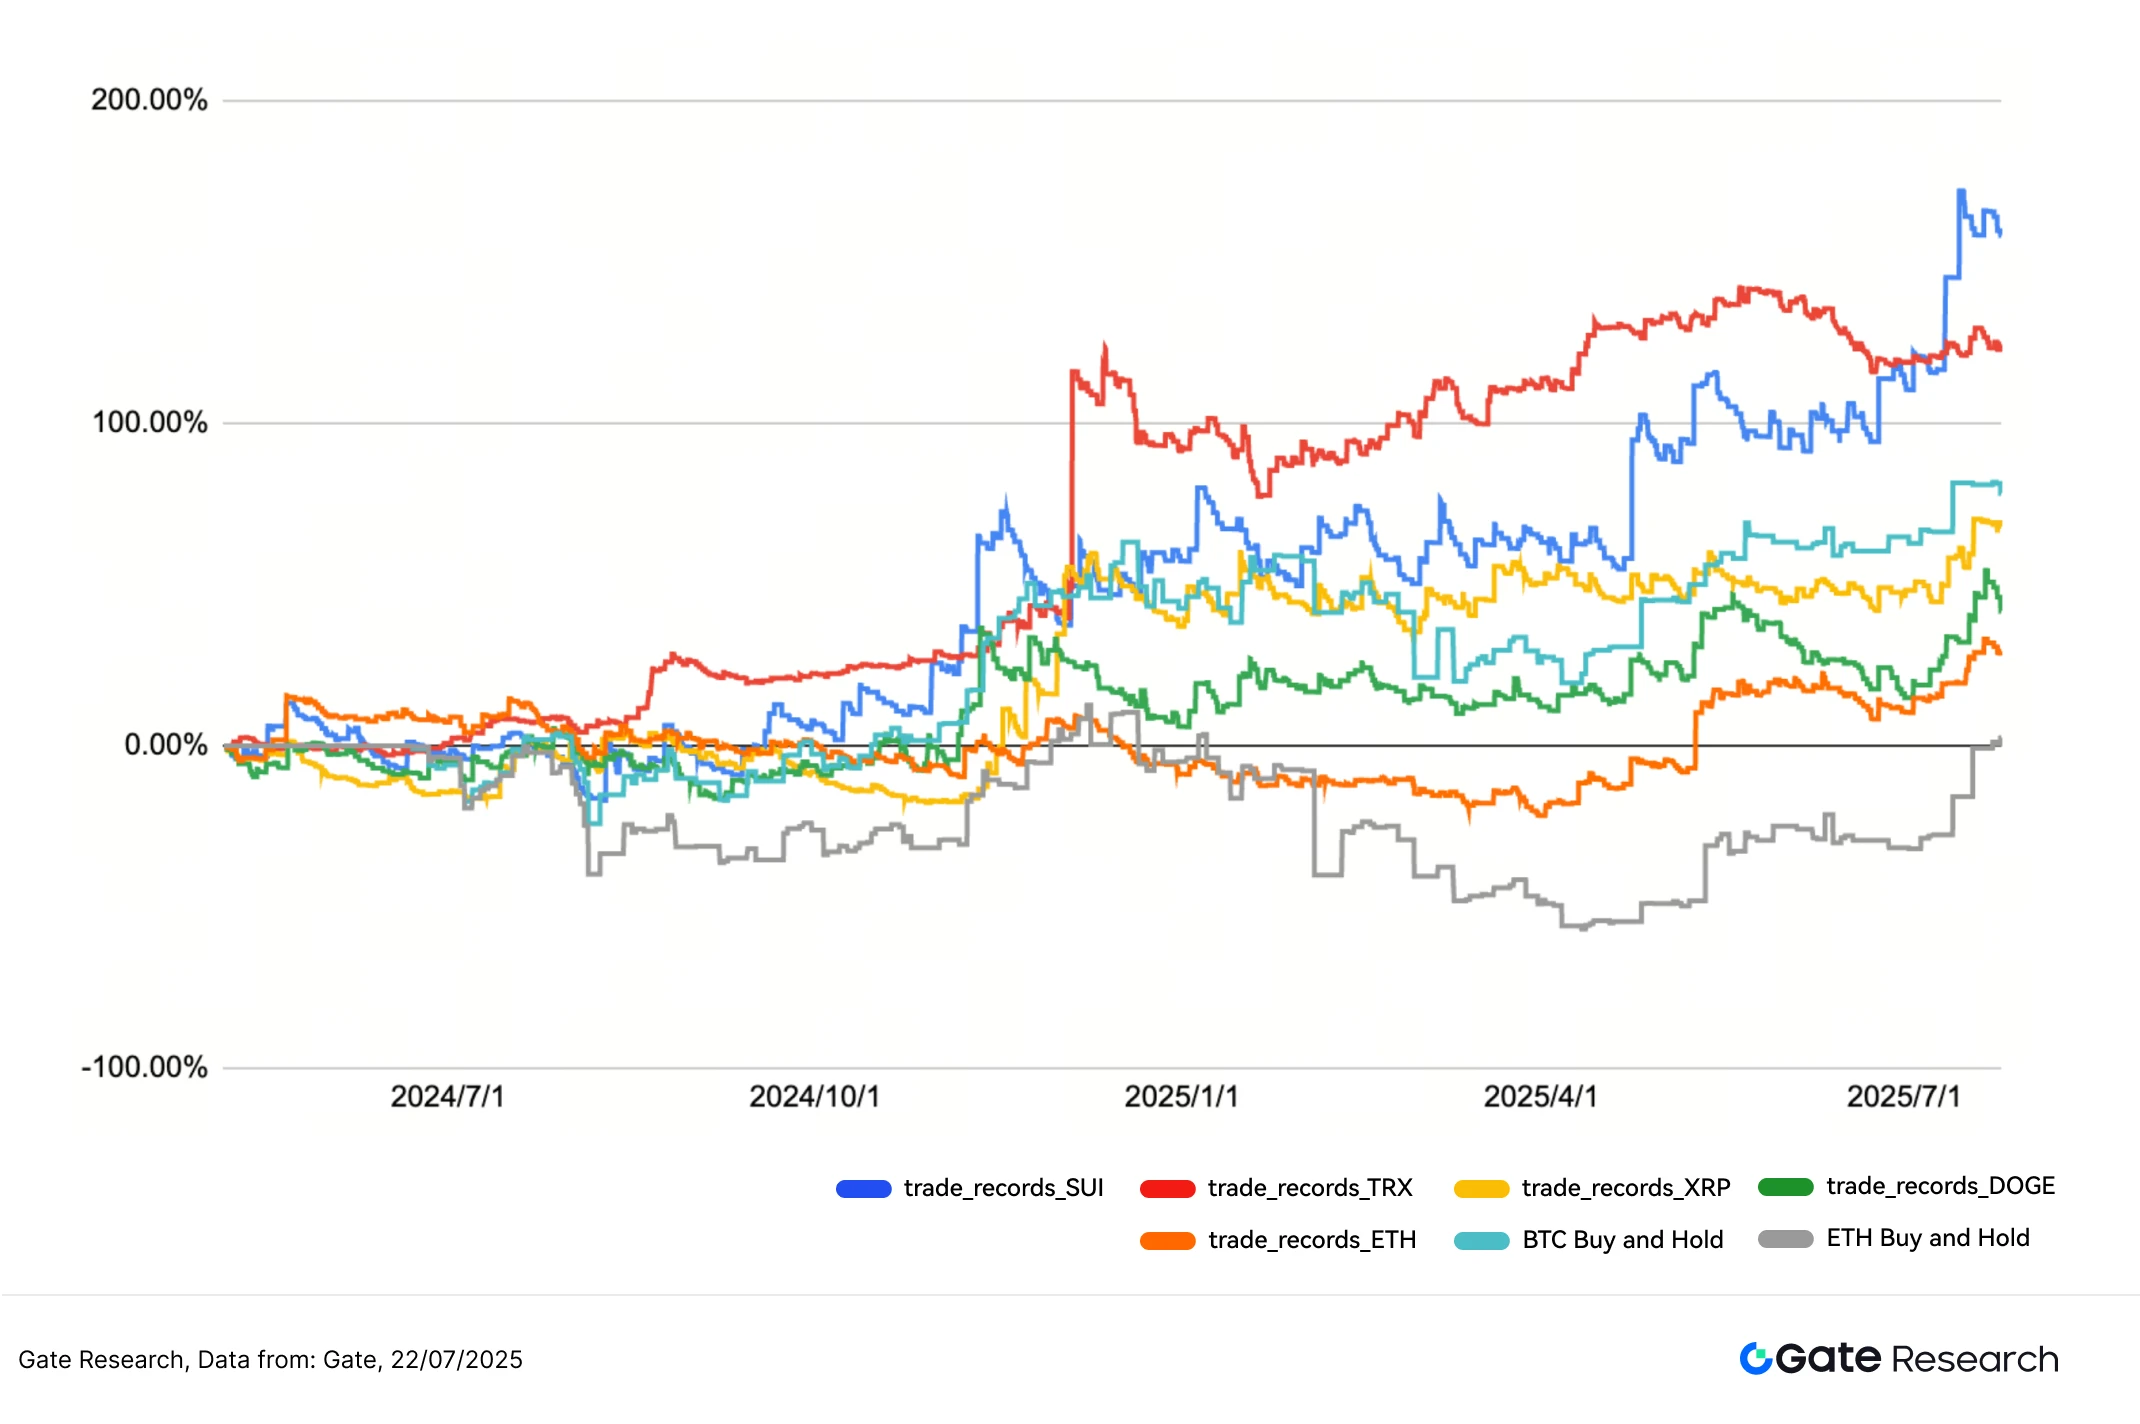
The backtest period is from May 2024 to July 2025, with the strategy based on MACD golden crosses for entry and fixed take-profit and stop-loss logic applied to the top ten mainstream crypto assets by market capitalization (excluding stablecoins). Overall, the strategy's cumulative return performance exceeds that of BTC and ETH's Buy and Hold strategies, demonstrating clear momentum tracking ability and good risk control effectiveness.
In the chart, it can be seen that the SUI and TRX strategy return curves perform the best, with an overall upward trend, and cumulative returns exceeding 100%. The strategies entered the market multiple times at the beginning of trend initiations and successfully took profits, demonstrating good trend-following capabilities. Among them, the SUI strategy is the best performer in the long term, steadily climbing since October 2024 and reaching a peak in mid-2025, with cumulative returns ranking first among all cryptocurrencies.
In contrast, the Buy and Hold strategy showed significant fluctuations during the same period, especially ETH, which experienced a peak drawdown of over 50%, exposing the risks of long-term holding in a high-volatility market. The MACD strategy, through clearly defined entry and exit mechanisms, can exit in a timely manner during a volatile market and effectively defend against pullbacks, achieving steady accumulation. Additionally, from the performance of DOGE and XRP, the strategy also shows good adaptability in medium to high volatility cryptocurrencies, capturing upward waves while effectively avoiding deep pullbacks.
In summary, the MACD golden cross combined with fixed take-profit and stop-loss strategies performs well in terms of profitability, drawdown resistance, and applicability across multiple cryptocurrencies, demonstrating practical deployment value. In the future, it can be further optimized by incorporating dynamic take-profit mechanisms, volume changes, or trend confirmation indicators to enhance the strategy's sensitivity to market transitions and improve overall trading efficiency and profit quality.
Figure 11: Comparison of Cumulative Returns of Five Optimal Parameter Strategies with BTC and ETH Holding Strategies Over the Past Year
- Trading Strategy Summary
This strategy is based on the MACD indicator to construct entry and exit logic, detecting golden cross signals to determine trend initiation points, paired with fixed take-profit and stop-loss mechanisms, demonstrating robust risk control capabilities and sustained growth in returns across various mainstream cryptocurrencies. During the backtest period, the strategy successfully captured key turning points at the beginning of trends multiple times, especially showing good adaptability during market fluctuations or trend transitions, with overall performance significantly outperforming traditional Buy and Hold strategies.
From the backtest results across multiple cryptocurrencies, the SUI and TRX strategies stand out, with cumulative returns exceeding 100%. The SUI strategy has the best long-term performance, consistently ranking first in overall returns among all cryptocurrencies. At the same time, the strategy effectively avoided the deep drawdown risks that assets like ETH might face during the holding period, further validating its stability and reliability in real market environments.
It is worth noting that although the win rate of most cryptocurrency strategies in the backtest may not exceed 50%, the strategy achieves continuous accumulation of returns through clear entry and exit discipline and an asymmetric profit-loss structure, effectively controlling losses and extending profits. This design highlights the importance and effectiveness of risk control systems and position management in low-win-rate environments.
Overall, the MACD trend strategy achieves a good balance between profitability, drawdown control, and capital utilization efficiency, making it particularly suitable for medium to high volatility and unclear trend market structures. In the future, it can further incorporate volume confirmation, moving average filtering, or multi-timeframe signal resonance mechanisms to enhance signal accuracy and expand into a multi-factor, multi-asset quantitative strategy framework, continuously improving the strategy's adaptability and scalability.
Conclusion
From July 15 to July 28, 2025, the cryptocurrency market maintained a structurally bullish pattern overall, with mainstream assets undergoing high-level consolidation, and both technical structure and fundamentals remaining relatively healthy. However, key indicators such as long-short ratios, funding rates, and liquidation structures indicate that short-term market sentiment is becoming cautious, with capital inflow rhythms being conservative and leverage momentum yet to be fully released. Although BTC and ETH remain at high levels, the tug-of-war between bulls and bears continues, with market rhythms gradually shifting towards oscillation games and tentative repetitions.
The subsequent market trend will heavily depend on the further evolution of capital flows and trading structures, especially whether factors such as volume coordination, recovery of funding rates, and stability of positions can create catalytic conditions for trend continuation. If prices break out with increased volume after high-level consolidation, accompanied by synchronized strengthening of technical indicators, mainstream assets are likely to enter a new upward cycle; conversely, if the oscillation period continues to drag on and market divergences intensify, the possibility of phase pullbacks or turnover consolidations cannot be ruled out.
At this critical juncture, where the structure is bullish but divergences are rising, short-term strategies should place greater emphasis on rhythm control and risk management, flexibly combining trend tools and position management to steadily seek certainty in complex market conditions. In this context, trend strategies based on MACD golden crosses for entry and fixed take-profit and stop-loss for exit demonstrate good short- to medium-term trading advantages. This strategy identifies market turning points through momentum indicators and strengthens risk control and execution discipline through clear entry and exit logic. Backtest results show that the strategy performs outstandingly on mainstream cryptocurrencies like SUI and TRX, with cumulative returns exceeding 150% and good overall drawdown control.
Although the win rate is generally below 50%, the strategy can still achieve stable positive returns due to its asymmetric profit-loss structure and strict stop-loss mechanisms, demonstrating its robustness in high-volatility markets. Overall, the MACD trend strategy achieves a good balance between profit potential, drawdown resistance, and execution efficiency, demonstrating practical deployment value. In the future, if it can further incorporate volume, trend strength, or multi-timeframe resonance as quantitative factors and introduce more flexible risk control mechanisms, it is expected to continuously enhance its adaptability and scalability in complex market structures.
References:
CoinGecko, https://www.coingecko.com/
Gate, https://www.gate.com/trade/BTC_USDT
Gate, https://www.gate.com/trade/ETH_USDT
Coinglass, https://www.coinglass.com/LongShortRatio
Coinglass, https://www.coinglass.com/BitcoinOpenInterest?utm_source=chatgpt.com
Gate, https://www.gate.com/futuresmarketinfo/BTCUSD/capitalrate_history
Gate, https://www.gate.com/futures/introduction/funding-rate-history?from=USDT-M&contract=ETH_USDT
Coinglass, https://www.coinglass.com/pro/futures/Liquidations
免责声明:本文章仅代表作者个人观点,不代表本平台的立场和观点。本文章仅供信息分享,不构成对任何人的任何投资建议。用户与作者之间的任何争议,与本平台无关。如网页中刊载的文章或图片涉及侵权,请提供相关的权利证明和身份证明发送邮件到support@aicoin.com,本平台相关工作人员将会进行核查。


