Over the past few weeks, XRP has been on a wild ride, rising from below $2.30 to highs above $3.50. A double top, a well-known bearish chart pattern, could form, but the asset's recent momentum might be hiding this new technical risk. Based on the current price structure, XRP is making a comeback after a steep decline, after its initial breakout near the $3.50 region.
The bulls' continued activity is indicated by the encouraging recovery above $3.20. The catch is that if the price bounces back to the $3.50 region and does not sustain a break, it could print a second peak, the second top of the double top, which could signal a short- or medium-term reversal.
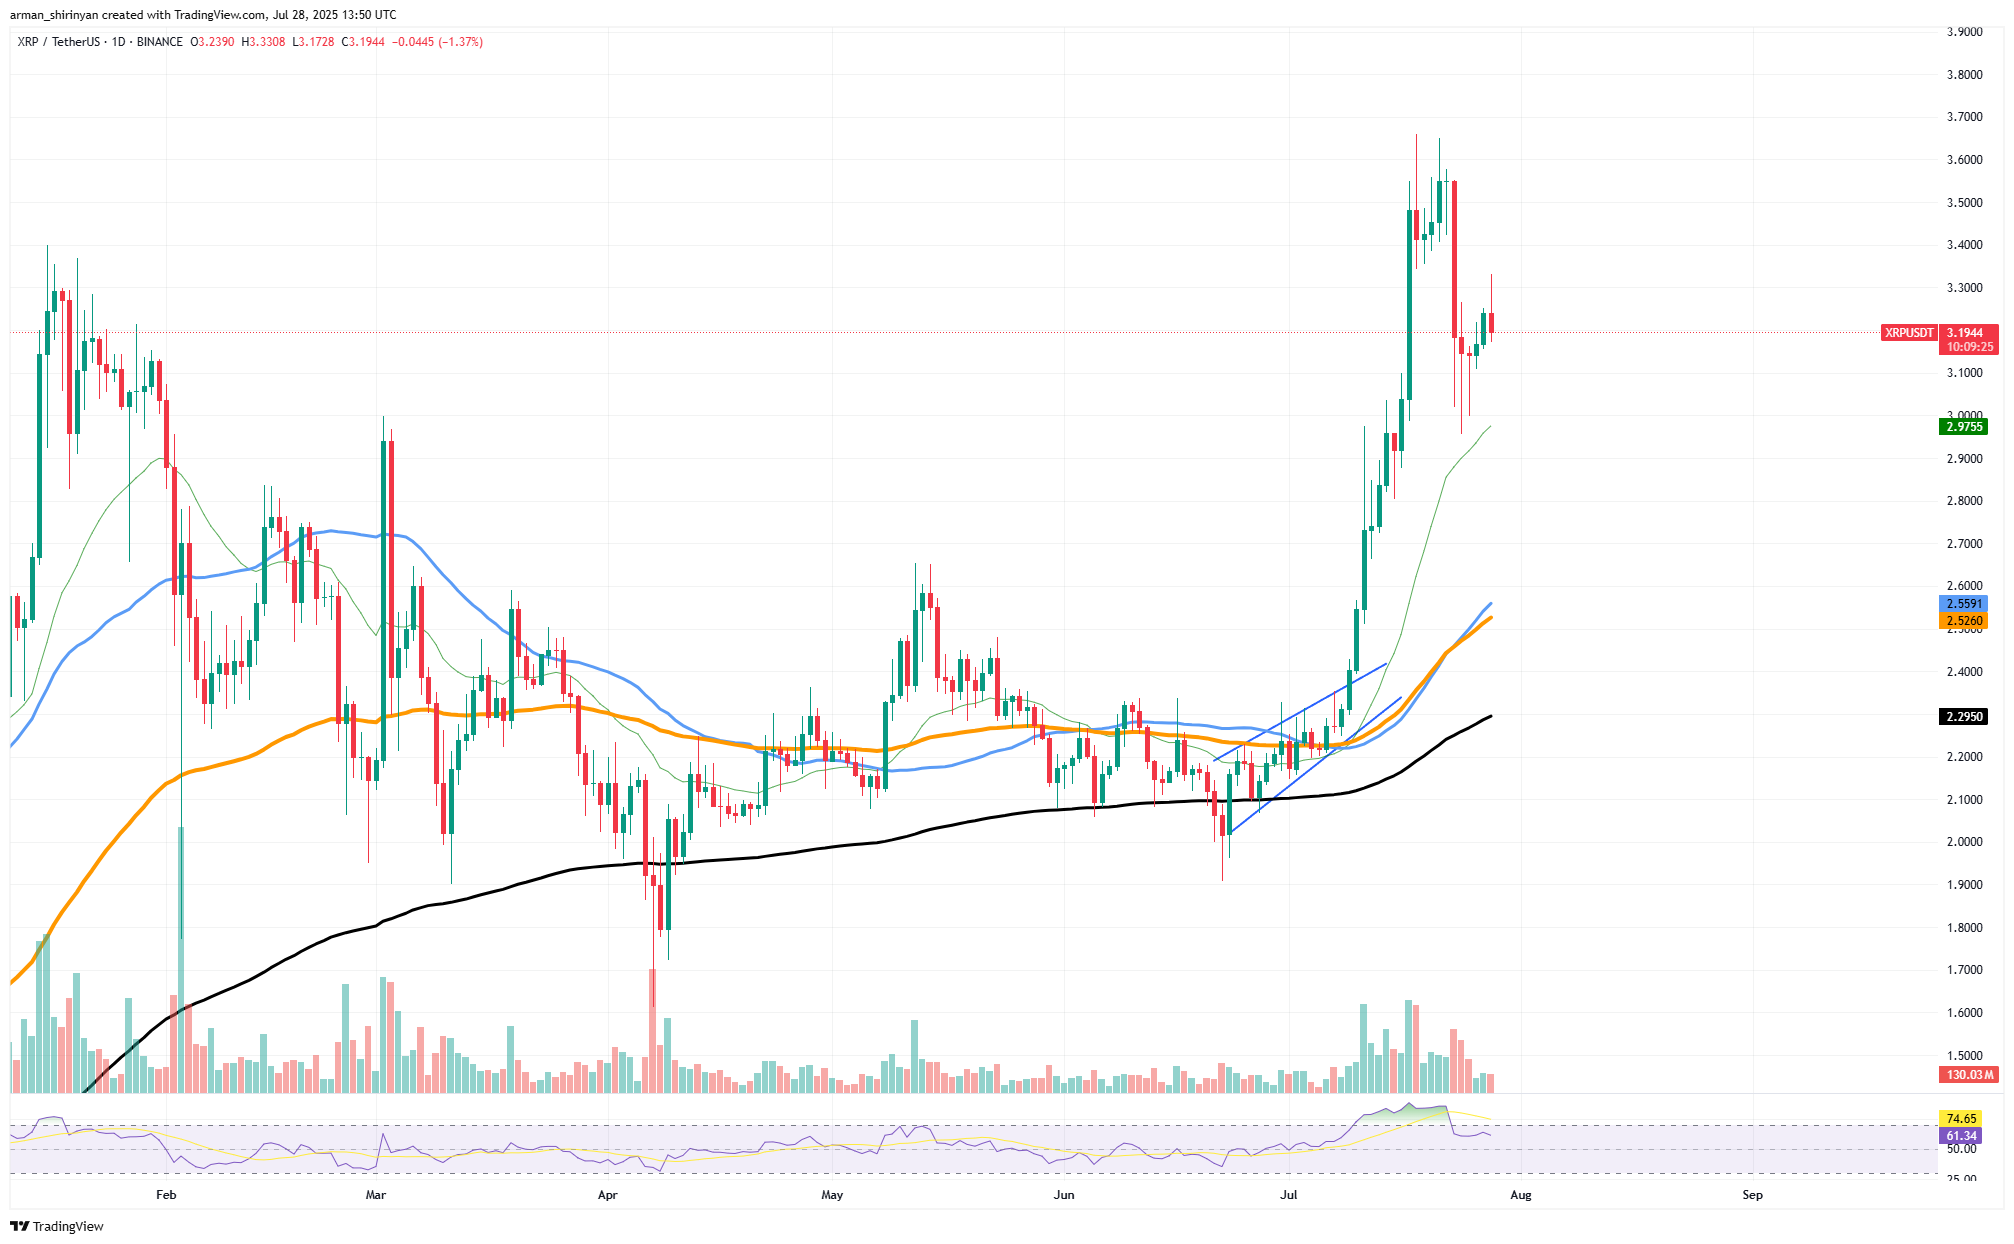
XRP/USDT Chart by TradingView
Also contributing to the worry is the Relative Strength Index (RSI), which is once again getting close to 75. Bullish strength can be indicated by a strong RSI, but the likelihood of exhaustion is increased when high levels are retested without a fresh breakout. Another important element here is volume.
HOT Stories XRP Has Hidden Danger Brewing, Ethereum's (ETH) Unstoppable Rally Continues, Bitcoin (BTC): Clear Resistance Formed Solo Bitcoin Miner Beats the Odds to Mine Entire Block Again? Novogratz's Galaxy Withdraws Tons of BTC XRP and Other Tokens to Be Accepted by US Merchants via PayPal
Despite strong buying support during the rally toward $3.50, the recent ascent has been on somewhat lower volume, which may indicate waning interest. The formation of lower highs and indications of distribution should be closely monitored by traders if XRP does return to $3.50 and stalls or reverses from that level.
The double top would be confirmed if there were a confirmed break below the neckline between $3.00 and $3.10, which could push XRP back toward support close to the 50-day EMA at $2.60 or even lower.
Ethereum stays up
Ethereum does not appear to be slowing down. Since emerging from its months-long consolidation range in early July, the second-largest cryptocurrency by market capitalization has been riding a relentless bullish wave. With its current price of $3,888, ETH has increased by more than 40% in recent weeks, and the bulls continue to have the upper hand.
The breakout was flawless: Ethereum moved immediately and with high volume past its prior resistance level of $2,900. The 50-day EMA and that level now serve as a strong support zone. Regaining the 200-day EMA and making a strong move above the $3,300-$3,500 range, which confirmed the trend reversal and attracted aggressive buyers, further increased momentum.
You Might Also Like

Mon, 07/28/2025 - 13:19 Binance Launches Novel Earn Product RWUSD: Details ByVladislav Sopov
The absence of significant drawbacks is the true clutch here. Each consolidation is brief and superficial, indicating high levels of demand. The RSI has reached overbought territory at 82, but historically, ETH can remain extended for a considerable amount of time before a significant correction occurs in strong uptrends like this one.
Psychological resistance is looming close to $4,000, which many traders may consider a short-term target. FOMO-driven inflows would probably be triggered by a clear break above it, which might push Ethereum closer to the $4,400 range, the last local peak observed in late 2021.
Watch the $3,300-$3,500 range as the immediate support on the downside. Buyers will probably intervene at those levels, which also coincide with important moving averages if ETH declines. It appears that Ethereum's rally will continue unless a macro-level catalyst steps in. Strong momentum encouraging volume and an unquestionably bullish market structure are all present. As of right now, there are no warning signs — just a steady upward trend from a reputable cryptocurrency asset.
Bitcoin's main target
Bitcoin has formally established $120,000 as a distinct resistance level. Following weeks of consistent rising and numerous retests, the digital gold is still being rejected around this technical and psychological ceiling, creating what seems to be a standard horizontal resistance zone.
In recent weeks price action has shown both growing exhaustion and bullish intent. BTC has failed to close above $120,000 decisively despite several intraday breakouts above that level, indicating the existence of significant sell pressure or profit-taking activity. The comparatively low volume during these attempts raises the possibility that the bulls are running out of immediate fuel to push higher without consolidation.
You Might Also Like

Mon, 07/28/2025 - 13:04 Strategy's Saylor Breaks Silence With Three Words, But No Bitcoin Follows ByGamza Khanzadaev
It is not necessarily bearish to look at the current consolidation that is just below resistance. Indicators such as the RSI, which is currently at a neutral 61, can be reset by the market as a result of this healthy pause following a robust uptrend. There is still momentum, and moving averages, particularly the 50 and 100-day EMAs, keep sloping upward, providing strong support zones at $115,000 and $111,000, respectively.
If, on the other hand, the market is unable to make a breakthrough, it may retrace further toward the $111,000-$108,000 support band. For the most part, Bitcoin is still structurally bullish. Stronger confirmation is necessary to maintain the rally though — particularly a convincing breakout above $120,000 with supportive volume.
免责声明:本文章仅代表作者个人观点,不代表本平台的立场和观点。本文章仅供信息分享,不构成对任何人的任何投资建议。用户与作者之间的任何争议,与本平台无关。如网页中刊载的文章或图片涉及侵权,请提供相关的权利证明和身份证明发送邮件到support@aicoin.com,本平台相关工作人员将会进行核查。


