A potential reversal of XRP could signal the end of the current bear market. XRP has found stability in the $3.10-$3.20 range following a significant correction from its local high above $3.60. With the price stabilizing above the 20-day EMA, the most recent daily candles demonstrate a strong defense of support, indicating that bulls are not relinquishing control easily.
As can be seen from the chart, XRP has been able to hold its position above important moving averages such as the 50-day and 100-day EMAs. The asset is still firmly within a larger uptrend as indicated by the 200-day EMA's position far below the current price action. With the RSI hovering around 61 after cooling off from overbought territory, there is still opportunity for another leg up without going into the risk zone of excessive overheating.
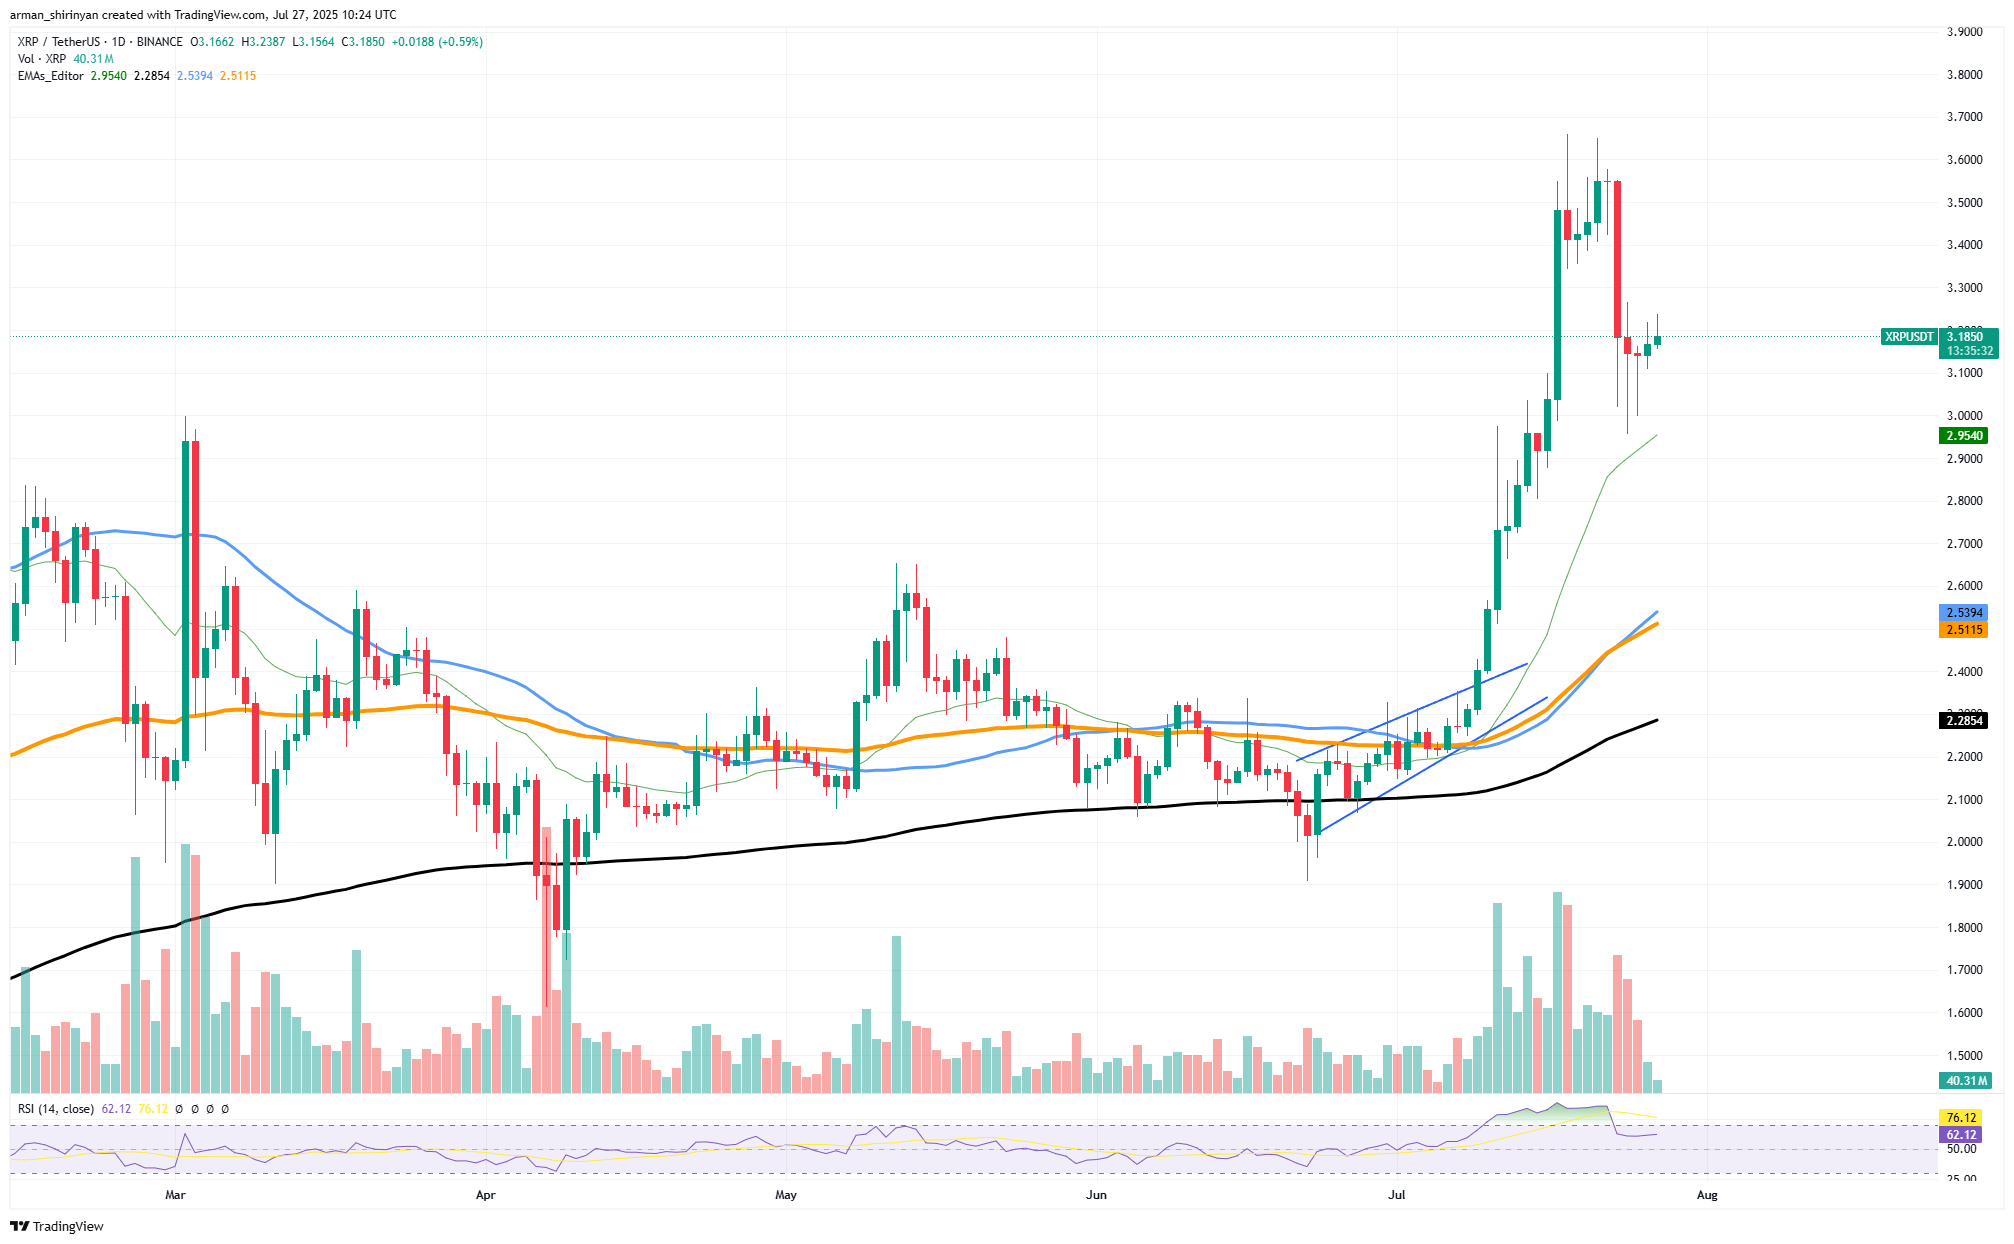
XRP/USDT Chart by TradingView
As is common following a high-volatility move, volume has declined from the most recent peak. The fact that this consolidation has taken place without a lot of selling pressure, however, suggests that the recent decline was more of a breather than a change in direction. The reversal might develop into a full-fledged continuation of the bullish structure if XRP is able to break above $3.30 with fresh volume.
HOT Stories BNB Hits New ATH. Is CZ Now Richer Than Bill Gates? XRP Cooldown? Volume Drops 42% Ahead of Key Price Action Main XRP Price Scenario Revealed by Bollinger Bands, and It's Bullish Ethereum (ETH) Reclaims $3,800; Is $4,000 Likely?
The bears would also be in a difficult position because they were unable to lower the asset below the crucial psychological support of $3. In conclusion, the current situation indicates that XRP is at a pivotal juncture. The lack of strong sell-offs and the bullish inclination of the indicators support the idea of a reversal. Although it's too soon to declare a breakout, bears should exercise caution because if momentum rises above the current range, the market might soon make their thesis irrelevant.
Shiba Inu recovers
After a severe retracement that rattled confidence in its most recent rally, Shiba Inu looks to be recovering. SHIB found support just above the 100-day EMA after falling below the critical resistance level of $0.0000145. In the past few trading sessions, SHIB has shown renewed activity. SHIB is currently trading above the 50-day EMA and holding the $0.0000134-$0.0000136 range, which was once resistance but is now a solid support zone, according to technical analysis.
The positive recovery from this sector indicates that in spite of the recent decline, market players might still find value at these prices. There is still plenty of opportunity for upside without creating overbought conditions as indicated by the RSI's current position of 53.63. Additionally, the volume has somewhat increased, suggesting a cautious return of buyers.
You Might Also Like

Sat, 07/26/2025 - 16:02 SHIB Price Prediction for July 26 ByDenys Serhiichuk
The local highs around $0.0000160 and higher may be retested if SHIB is able to recover the $0.0000145 level. This bounce's location immediately following a retracement from a multi-month high and directly above layered support from both moving averages and previous price consolidation makes it especially significant. It fits into a traditional bullish continuation pattern, assuming the overall market doesn't collapse.
A decline below the $0.0000134 level, on the other hand, would render the current rebound invalid and leave SHIB vulnerable to a more severe pullback toward the $0.0000126 support. SHIB may still be in the woods, but the technical configuration indicates that it is making progress.
Ethereum's possibilities
Ethereum is exhibiting indications of a possible breakout above the psychological $4,000 barrier while remaining stable around the $3,800 mark. In contrast to the majority of the cryptocurrency space, ETH has demonstrated a strong display of independent momentum by remaining mostly unaffected by the general market hesitancy and cooling off in other significant assets.
Following an impressive parabolic rally in July, ETH has consolidated just below $3,800 on the daily chart. During high-velocity surges, it is uncommon to maintain an elevated position without a significant retracement. Consolidation of this type close to the local top typically indicates accumulation rather than distribution and suggests the presence of underlying bullish pressure.
You Might Also Like
Sat, 07/26/2025 - 16:02 SHIB Price Prediction for July 26 ByDenys Serhiichuk
The way that ETH is different from the rest of the market is what makes its current setup even more intriguing. While assets such as XRP and SHIB saw significant volume drops and pullbacks, Ethereum has continued to rise or at worst has flatlined with few drawdowns.
The 200-day EMA has been a dependable source of support during the rally, and all moving averages are trending upward. Even though the RSI is high at 79.46, it has not yet produced a clear reversal signal. The slight tapering of the volume is not alarming, and is probably due to the brief weekend silence rather than a decline in interest. The $4,000 level could be removed quickly if ETH breaks above $3,800 with significant volume.
免责声明:本文章仅代表作者个人观点,不代表本平台的立场和观点。本文章仅供信息分享,不构成对任何人的任何投资建议。用户与作者之间的任何争议,与本平台无关。如网页中刊载的文章或图片涉及侵权,请提供相关的权利证明和身份证明发送邮件到support@aicoin.com,本平台相关工作人员将会进行核查。


