Cryptocurrency News
July 1 Hot Topics:
1. The U.S. Department of Justice cracks down on North Korean IT fraud: infiltrating Fortune Global 500 companies, involving millions of dollars.
2. Burwick Law requests to handle a $440 million cryptocurrency lawsuit through NFTs.
3. Hut 8 activates the world's largest single Bitcoin mining facility, Vega.
4. BitMEX report: Bitcoin perpetual contract extreme financing rates drop 90% over 9 years, market matures.
5. U.S. Democratic Senator proposes an amendment: aims to prohibit officials from profiting by promoting cryptocurrencies.
Trading Insights
Why look at 4-hour, 1-hour, and 15-minute candlesticks? Friends, after years of navigating the cryptocurrency space, I've seen too many people get ground down by stubbornly sticking to one timeframe's candlestick. Today, I’m sharing my secret weapon — the multi-timeframe candlestick trading method, just three steps to directly grasp trends, points, and timing!
- 4-Hour Candlestick: The "Stabilizing Force" of Trends
This is like GPS in the crypto world, helping you find the big direction amidst the vast fluctuations. Don’t underestimate a single 4-hour candlestick; it filters out intraday noise, making the trend clear:
- Uptrend: Highs and lows rise like steps; a pullback is a chance to buy low!
- Downtrend: Highs and lows slide down; a rebound is like crocodile tears, don’t get carried away, look for shorting opportunities.
- Sideways Movement: Prices bounce around in a range; frequent trading here just gives fees to the exchange, better to sit back and watch.
Remember, in the crypto space, following the trend is how you profit; going against it is just playing with real money!
1-Hour Candlestick: Precise "Battlefield" Positioning
With the big direction set, the 1-hour candlestick is our "battle map." Focus on finding support and resistance levels: trend lines, moving averages, previous lows are like the market's "moat," often providing support when prices approach, indicating potential entry points; previous highs and key resistance levels, combined with top patterns, signal retreat — take profits or reduce positions.15-Minute Candlestick: The "Last Second" to Pull the Trigger
Don’t use the 15-minute candlestick to judge trends; it’s only for finding the best entry timing! Like a sniper waiting for a target to show a flaw, we wait for signals: key price levels showing engulfing patterns, bottom divergences, or golden cross signals — that’s when to act! Pay attention to trading volume! Breakouts without volume are often false, wait for volume to increase before entering.
Multi-timeframe coordination practical mantra:
- Direction: Check the 4-hour chart first for trend direction, whether to go long or short.
- Marking Circles: Use the 1-hour chart to mark support and resistance areas, locking in entry ranges.
- Wait for Signals: Look for reversal signals on the 15-minute chart, decisively pull the trigger!
Pitfall Avoidance Summary
When multiple timeframes conflict, don’t force a trade; staying in cash and observing is better than losing money. Small timeframes fluctuate quickly, so set stop losses properly, or you’ll get swept out in minutes. Trend, position, and timing are all essential; don’t rely on gut feelings — using this method is the way to go! I’ve used this method for over two years, and it has become my "trading muscle memory." Honestly, there’s no trading holy grail; the key is to review and summarize often, making these methods your own. If anyone has practical insights, let’s chat in the comments, and we can navigate the crypto space together with fewer detours!
Still confused about how to operate? Join TG: [https://t.me/+xq9M2pJrthMDc1… Daily market analysis + practical strategies, say goodbye to blind trading! The cryptocurrency market is full of uncertainty and challenges, but it also contains potential opportunities. Investors should fully understand the associated risks when participating in cryptocurrency investments, remain calm and rational, and respond to market changes with a steady strategy!](https://t.me/+xq9M2pJrthMDc1… Daily market analysis + practical strategies, say goodbye to blind trading! The cryptocurrency market is full of uncertainty and challenges, but it also contains potential opportunities. Investors should fully understand the associated risks when participating in cryptocurrency investments, remain calm and rational, and respond to market changes with a steady strategy!)
LIFE IS LIKE
A JOURNEY ▲
Below are the real trading group orders from the Big White Community this week. Congratulations to the friends who followed along; if your trades aren’t going well, you can come and test the waters.
Data is real, every order has a screenshot from when it was issued.
**Search for the public account: *Big White Talks Coins*
BTC
Analysis
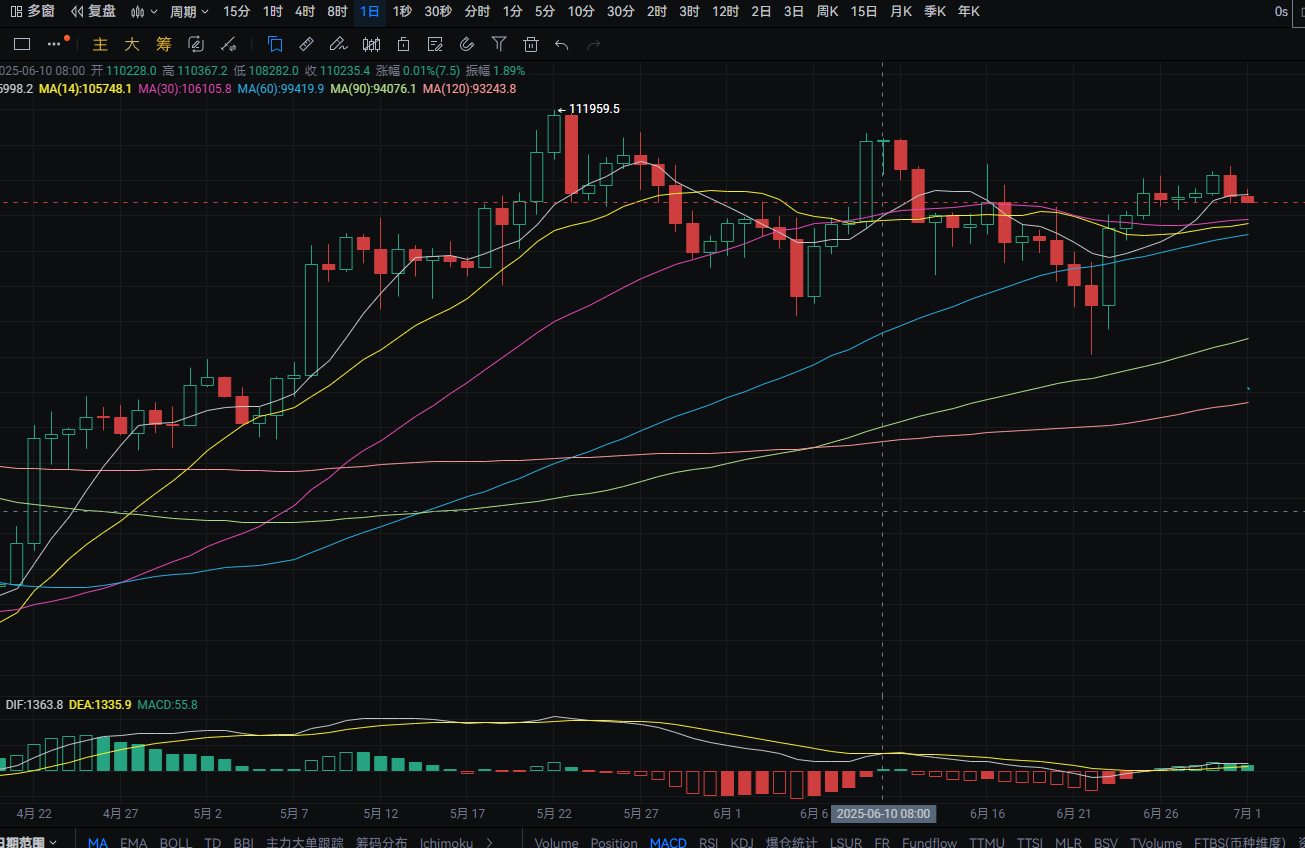
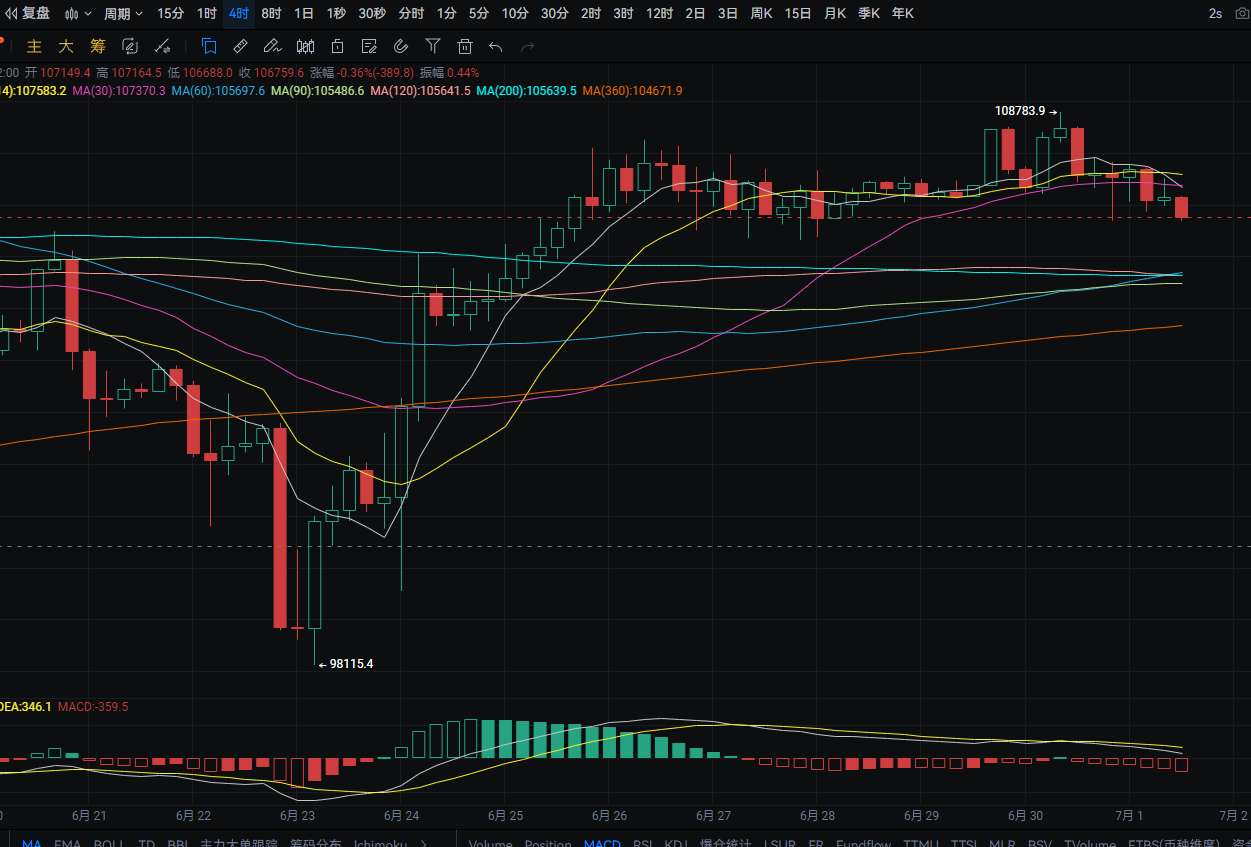
Bitcoin's daily chart fell from a high of around 108,800 to a low of around 106,700 yesterday, closing around 107,100. The support level is near MA60; if broken, it could drop to around 102,400. A pullback could provide a buying opportunity nearby. The resistance level is around 108,800; if broken, it could rise to around 110,250. A rebound nearby could provide a shorting opportunity. MACD shows a decrease in bullish momentum. The 4-hour chart's support is near MA90; if broken, it could drop to MA360. A pullback could provide a buying opportunity nearby. The resistance level is near MA14; if broken, it could rise to around 108,500. A rebound nearby could provide a shorting opportunity. MACD shows an increase in bearish momentum.
ETH
Analysis
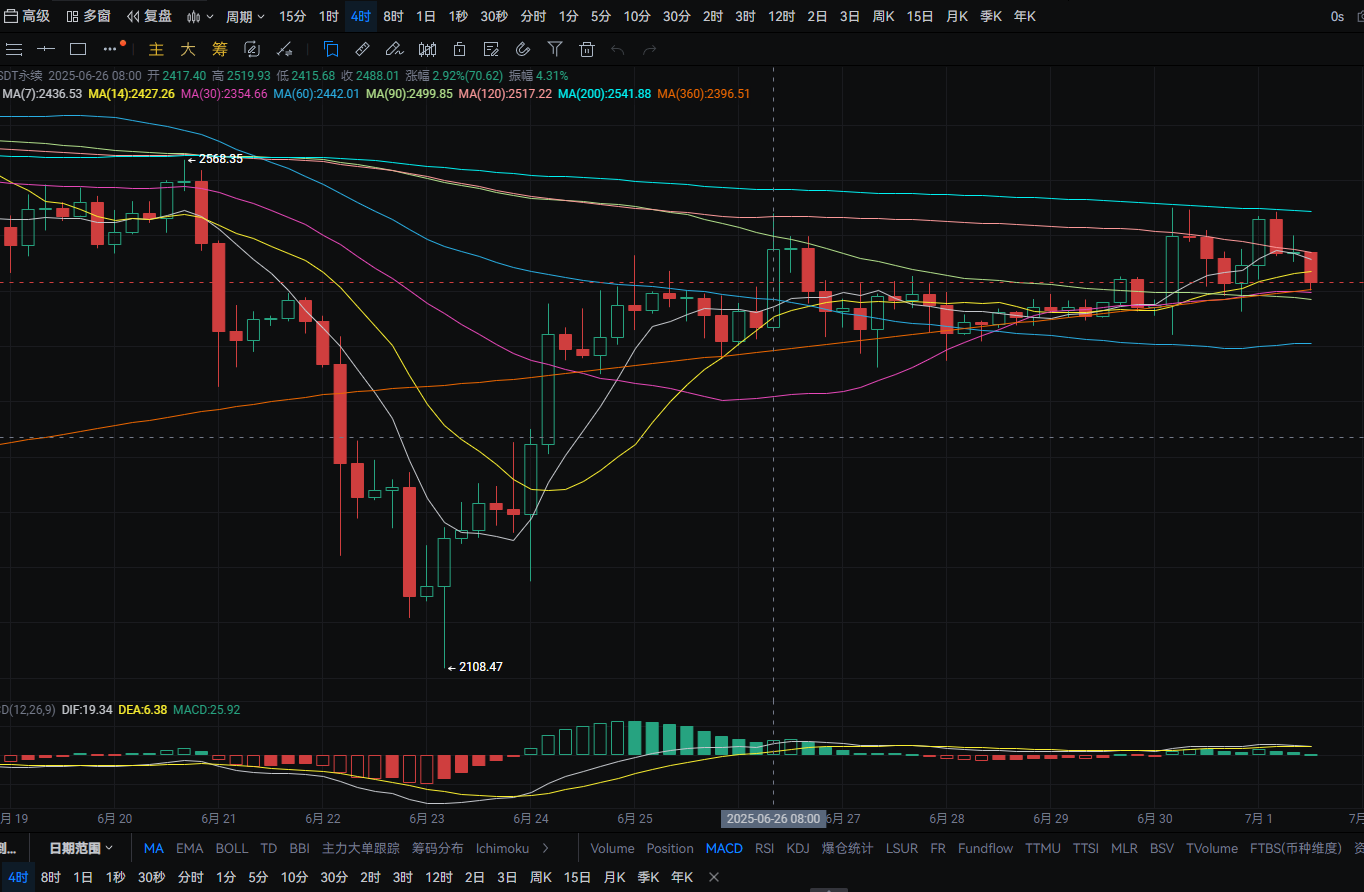
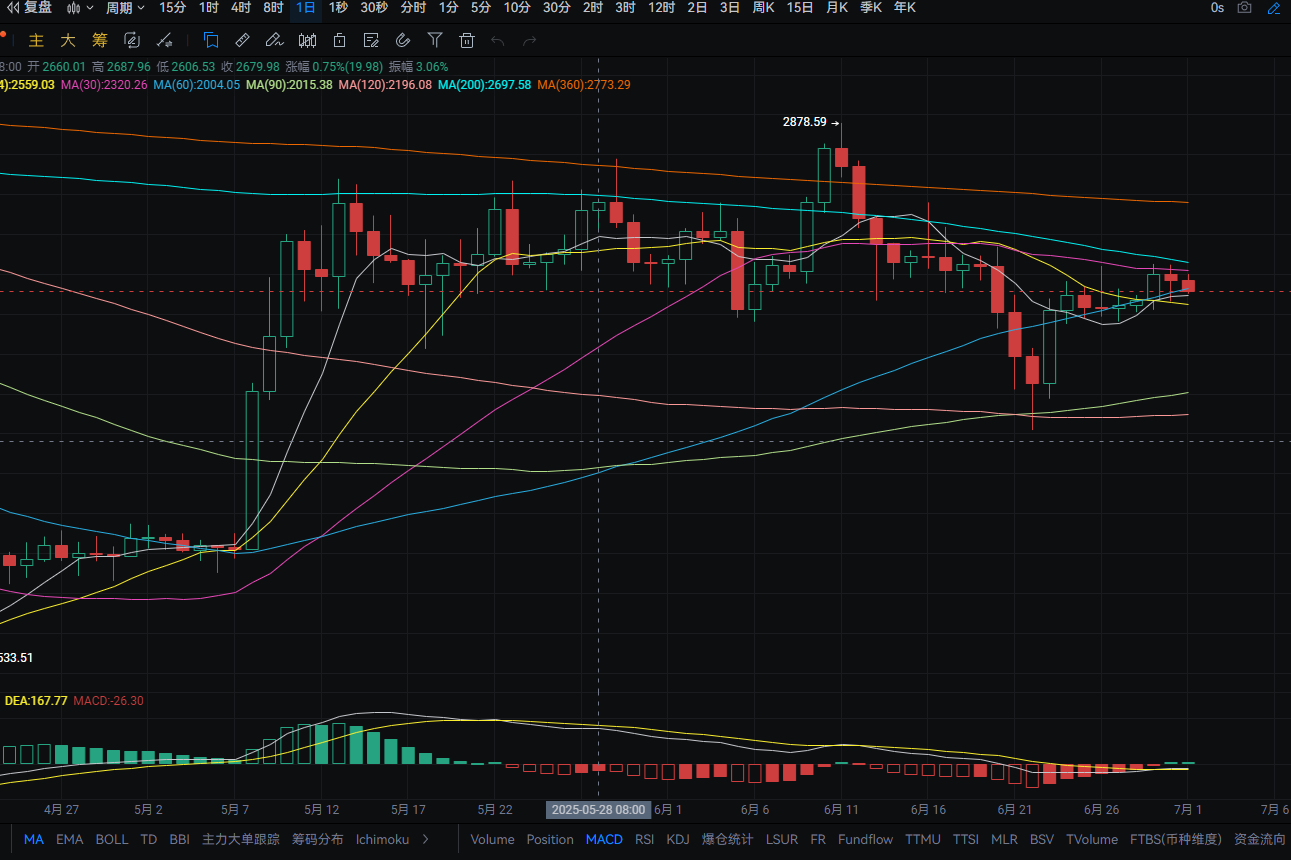
Ethereum's daily chart fell from a high of around 2,525 to a low of around 2,430 yesterday, closing around 2,485. The support level is near MA14; if broken, it could drop to around 2,345. A pullback could provide a buying opportunity nearby. The resistance level is near MA200; if broken, it could rise to around 2,615. A rebound nearby could provide a shorting opportunity. MACD shows a flat oscillation with dual lines converging. The 4-hour chart's support is near MA90; if broken, it could drop to MA60. A pullback could provide a buying opportunity nearby. The resistance level is around 2,500; if broken, it could rise to around MA200. A rebound nearby could provide a shorting opportunity. MACD shows a decrease in bullish momentum.
Disclaimer: The above content is personal opinion and for reference only! It does not constitute specific operational advice and does not bear legal responsibility. Market conditions change rapidly, and the article may have some lag; if you have any questions, feel free to consult.
免责声明:本文章仅代表作者个人观点,不代表本平台的立场和观点。本文章仅供信息分享,不构成对任何人的任何投资建议。用户与作者之间的任何争议,与本平台无关。如网页中刊载的文章或图片涉及侵权,请提供相关的权利证明和身份证明发送邮件到support@aicoin.com,本平台相关工作人员将会进行核查。


