Discuss the investor activities in on-chain and off-chain markets, and analyze the changes in this cycle through network indicators.
Written by: UkuriaOC, CryptoVizArt, Glassnode
Translated by: AididiaoJP, Foresight News
Abstract
- The number of on-chain transactions has decreased, but the settlement volume has increased, indicating a rise in usage by large entities. Although the number of transactions has declined, the average transaction size has significantly increased, suggesting that institutions or high-net-worth participants are dominating on-chain activities.
- Despite Bitcoin's trading price being close to historical highs, on-chain fees remain sluggish, and the demand for block space is still low. This marks a significant departure from previous cycles. In past cycles, price increases were typically accompanied by surges in fees due to congestion and increased network usage.
- Trading activity is increasingly shifting off-chain, with centralized exchanges now accounting for the majority of trading volume, particularly in the futures market. Notably, the total trading volume of spot, futures, and options is usually 7 to 16 times higher than the on-chain settlement volume.
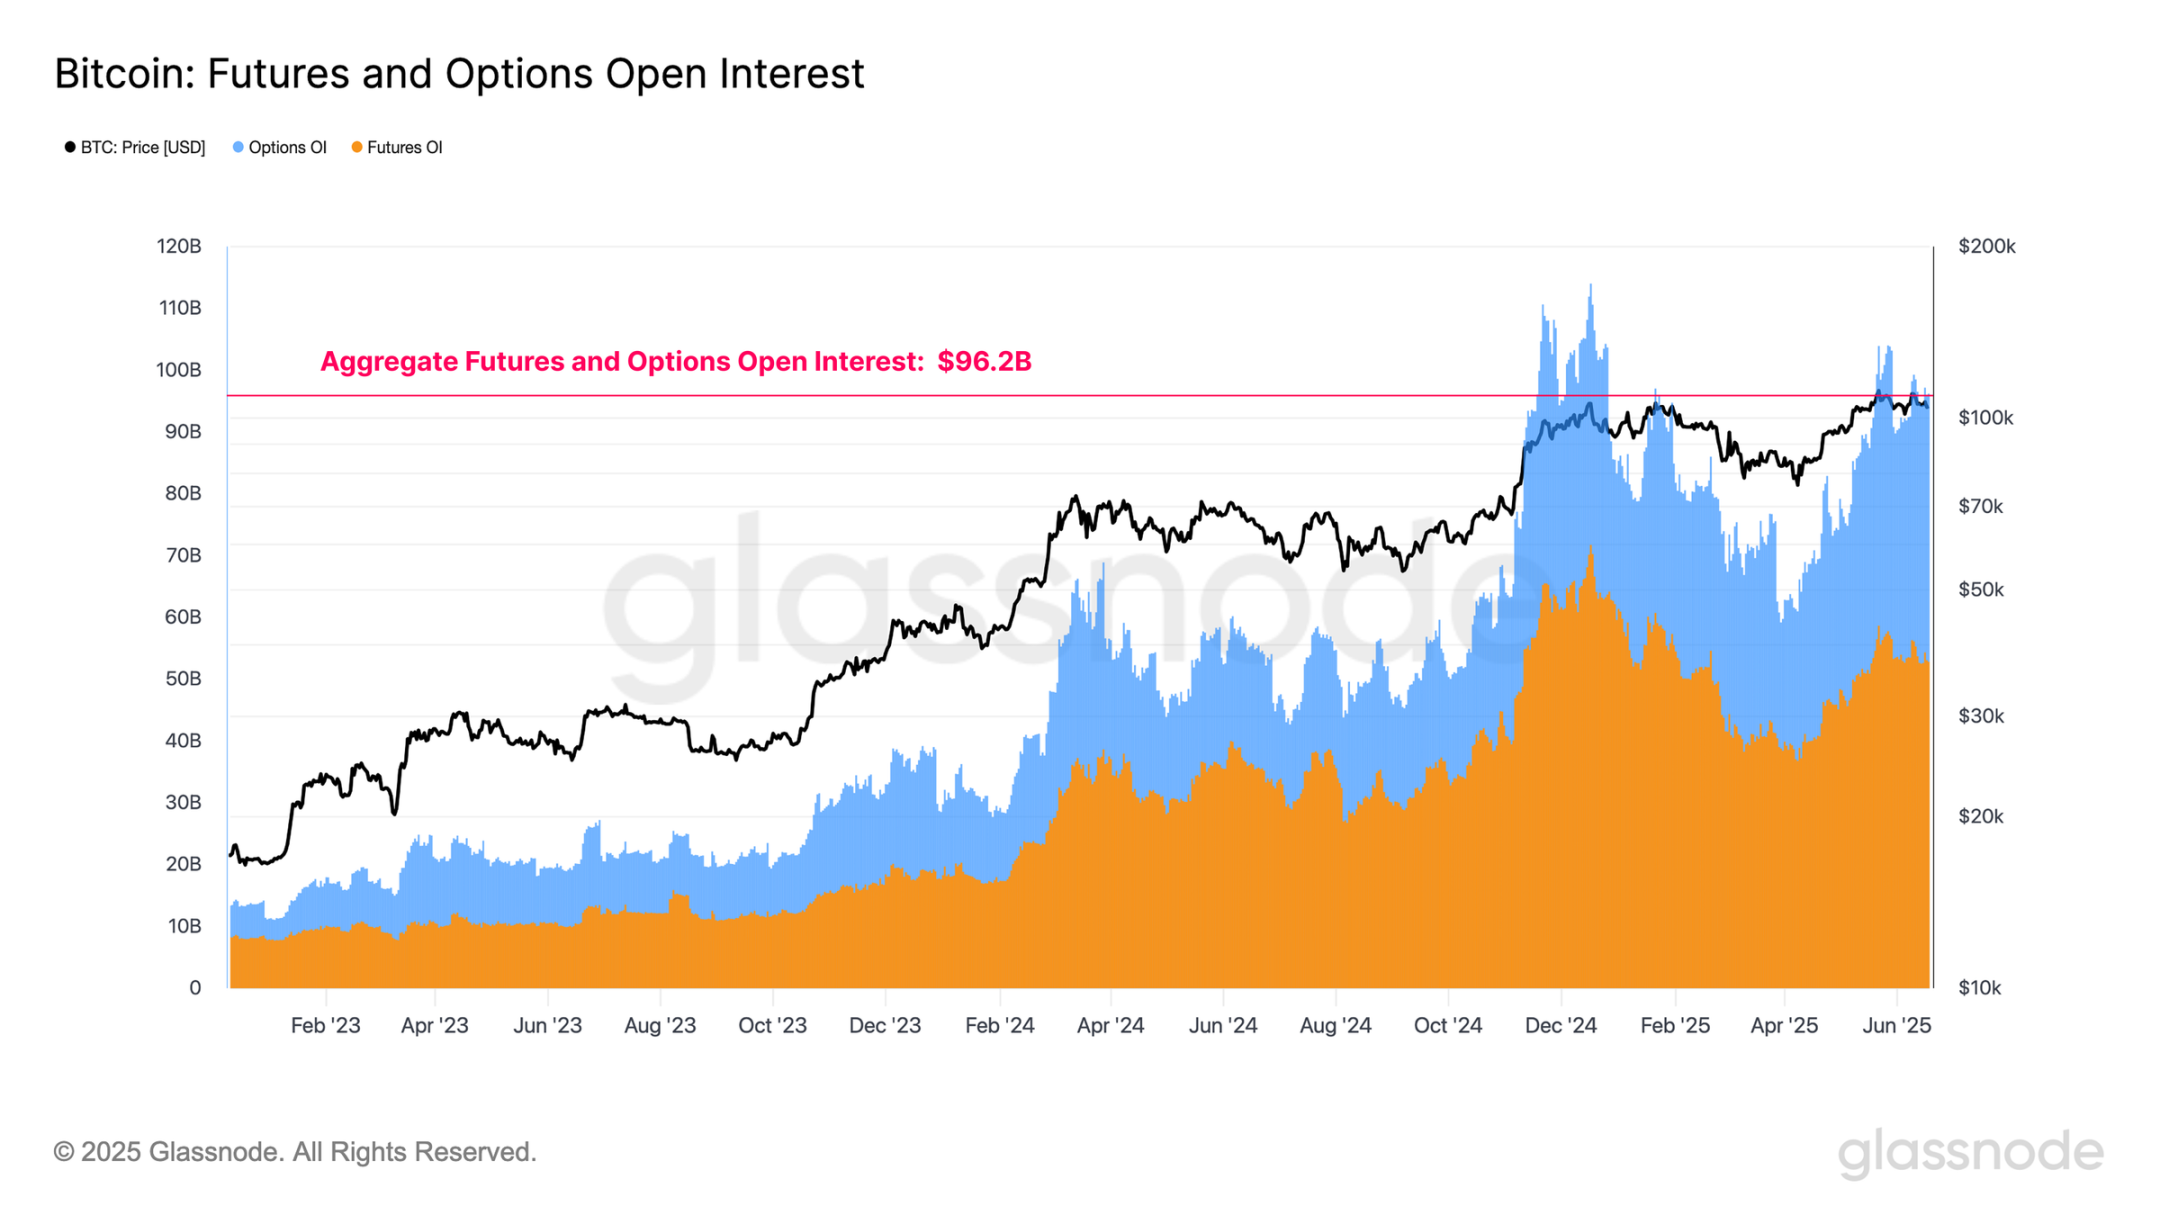
- Leverage continues to accumulate, with total open interest in futures and options reaching $96.2 billion. The collateral structure has significantly improved, with stablecoin margin positions currently making up the majority of open interest.
On-Chain Ghost Town
Bitcoin is currently holding steady above the important psychological level of $100,000, just 6% away from its historical peak of $111,700. One might expect that on-chain activity in the Bitcoin network would also be equally active; however, a clear divergence has emerged: spot prices remain high, while network activity is unusually quiet.
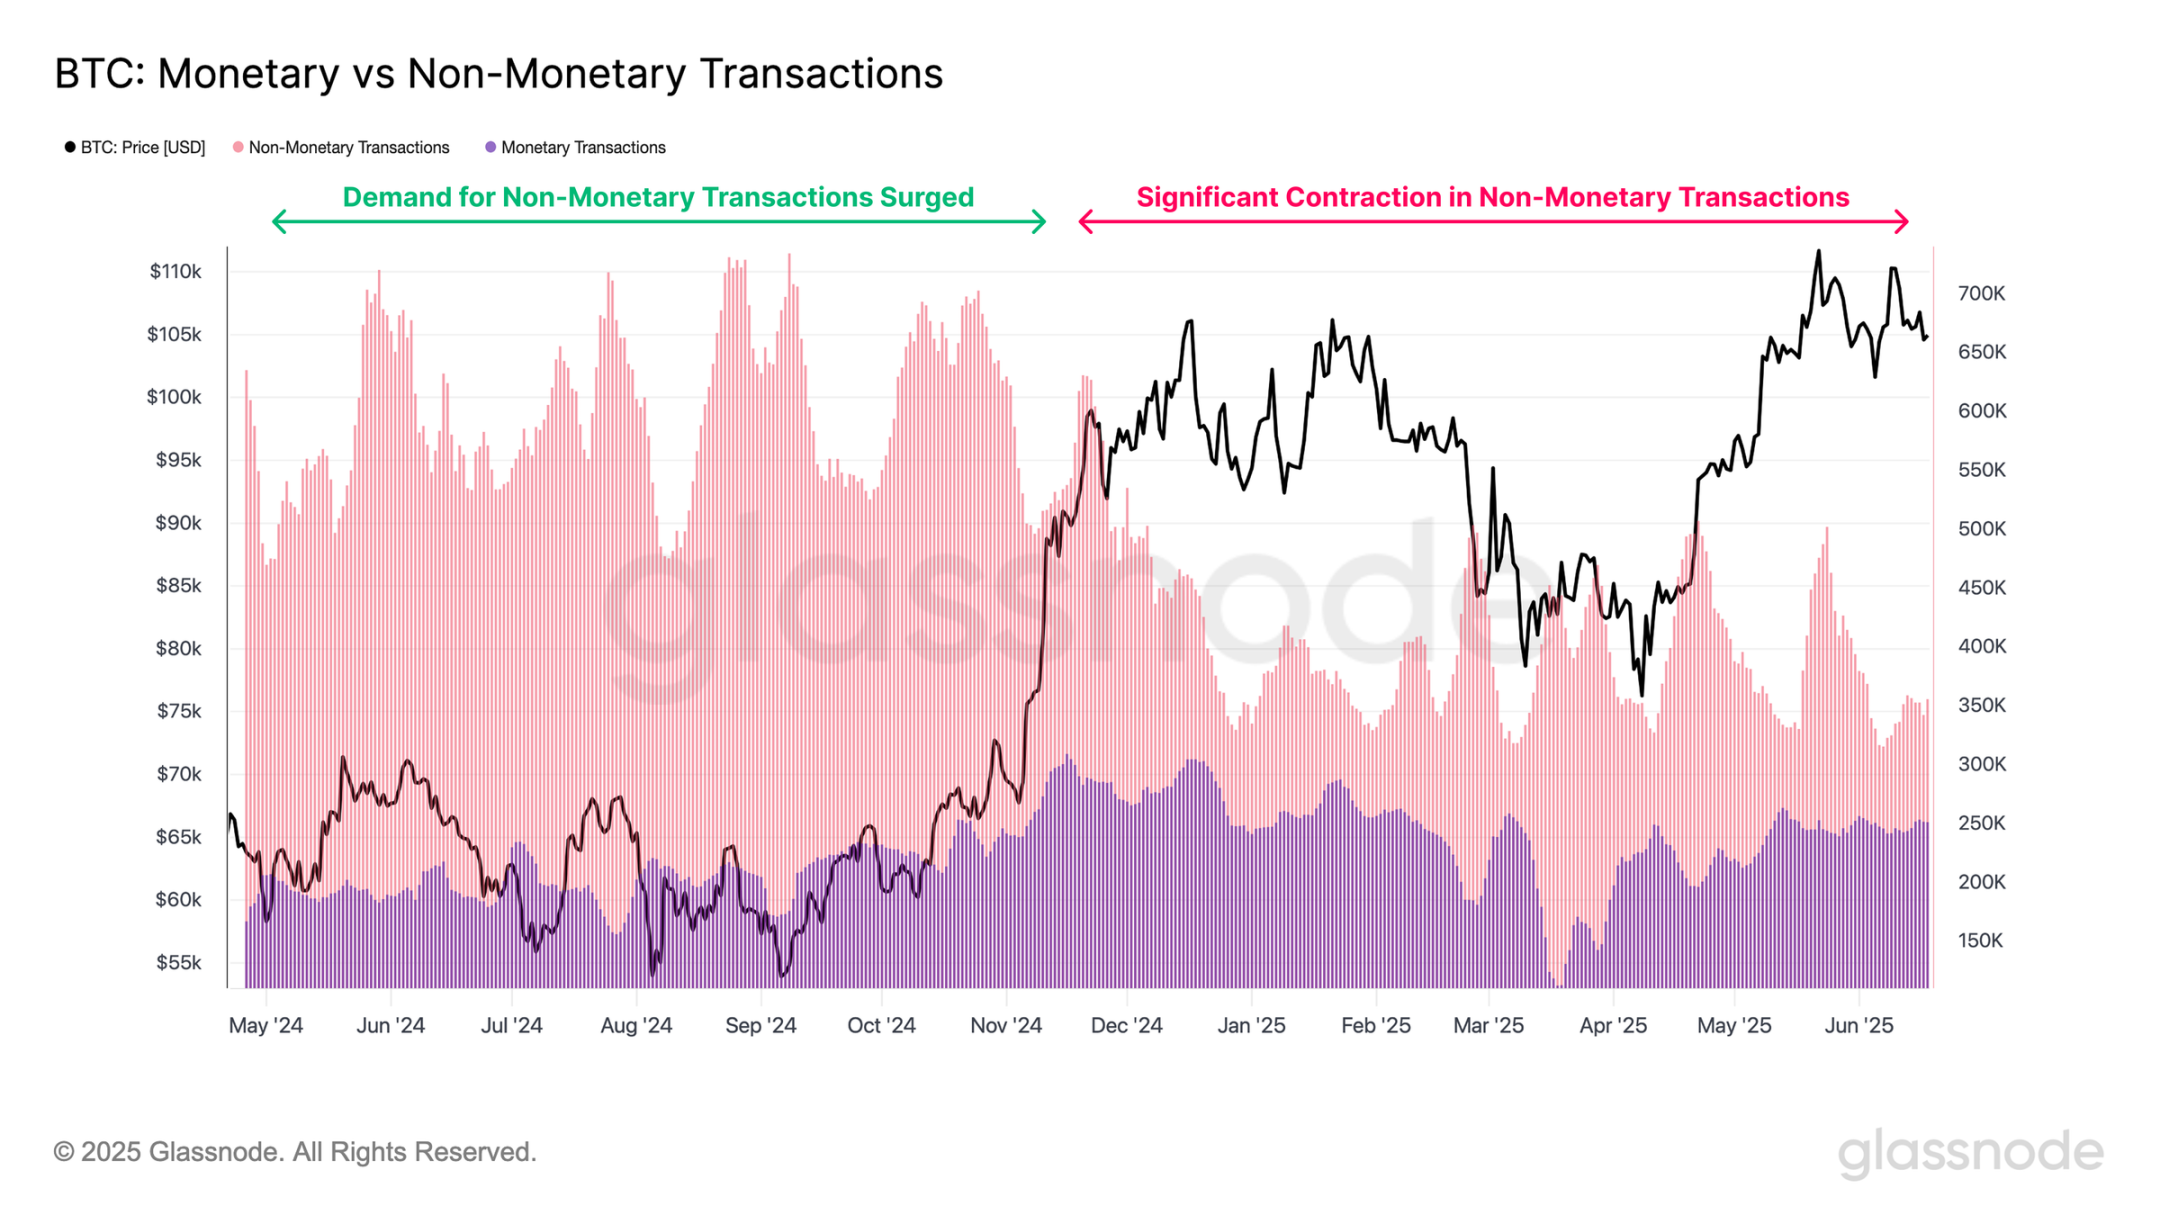
To assess this disconnect, we first analyzed the daily number of transactions settled on the Bitcoin network. During the period from 2023 to 2024, the number of transactions showed a structural upward trend, peaking at 734,000 transactions per day. Since the beginning of 2025, throughput has significantly declined, with daily transaction numbers ranging between 320,000 and 500,000, a substantial contraction compared to the early highs of this cycle.

To better understand the nature of Bitcoin network activity, we can categorize transactions into two types:
- Token transactions, which involve value transfer.
- Non-token transactions, such as those related to inscriptions and runes, which embed arbitrary data through Taproot witness data and the OP_RETURN field.
Over the past year, the number of token transactions has remained relatively stable, indicating a stable foundation for value transfer activities. On the other hand, non-token transactions have exhibited a more volatile pattern. During the period from July to December 2024, demand for non-token transactions surged, significantly increasing the total transaction volume. However, since the beginning of 2025, non-bulk transaction activity has sharply declined, severely impacting the recent overall network throughput.
Transaction Volume Remains Strong
Despite a decline in transaction numbers, the economic volume settled on the Bitcoin network remains at historical highs, averaging $7.5 billion settled daily, peaking at $16 billion during the price breakout to $100,000 on November 10 last year.
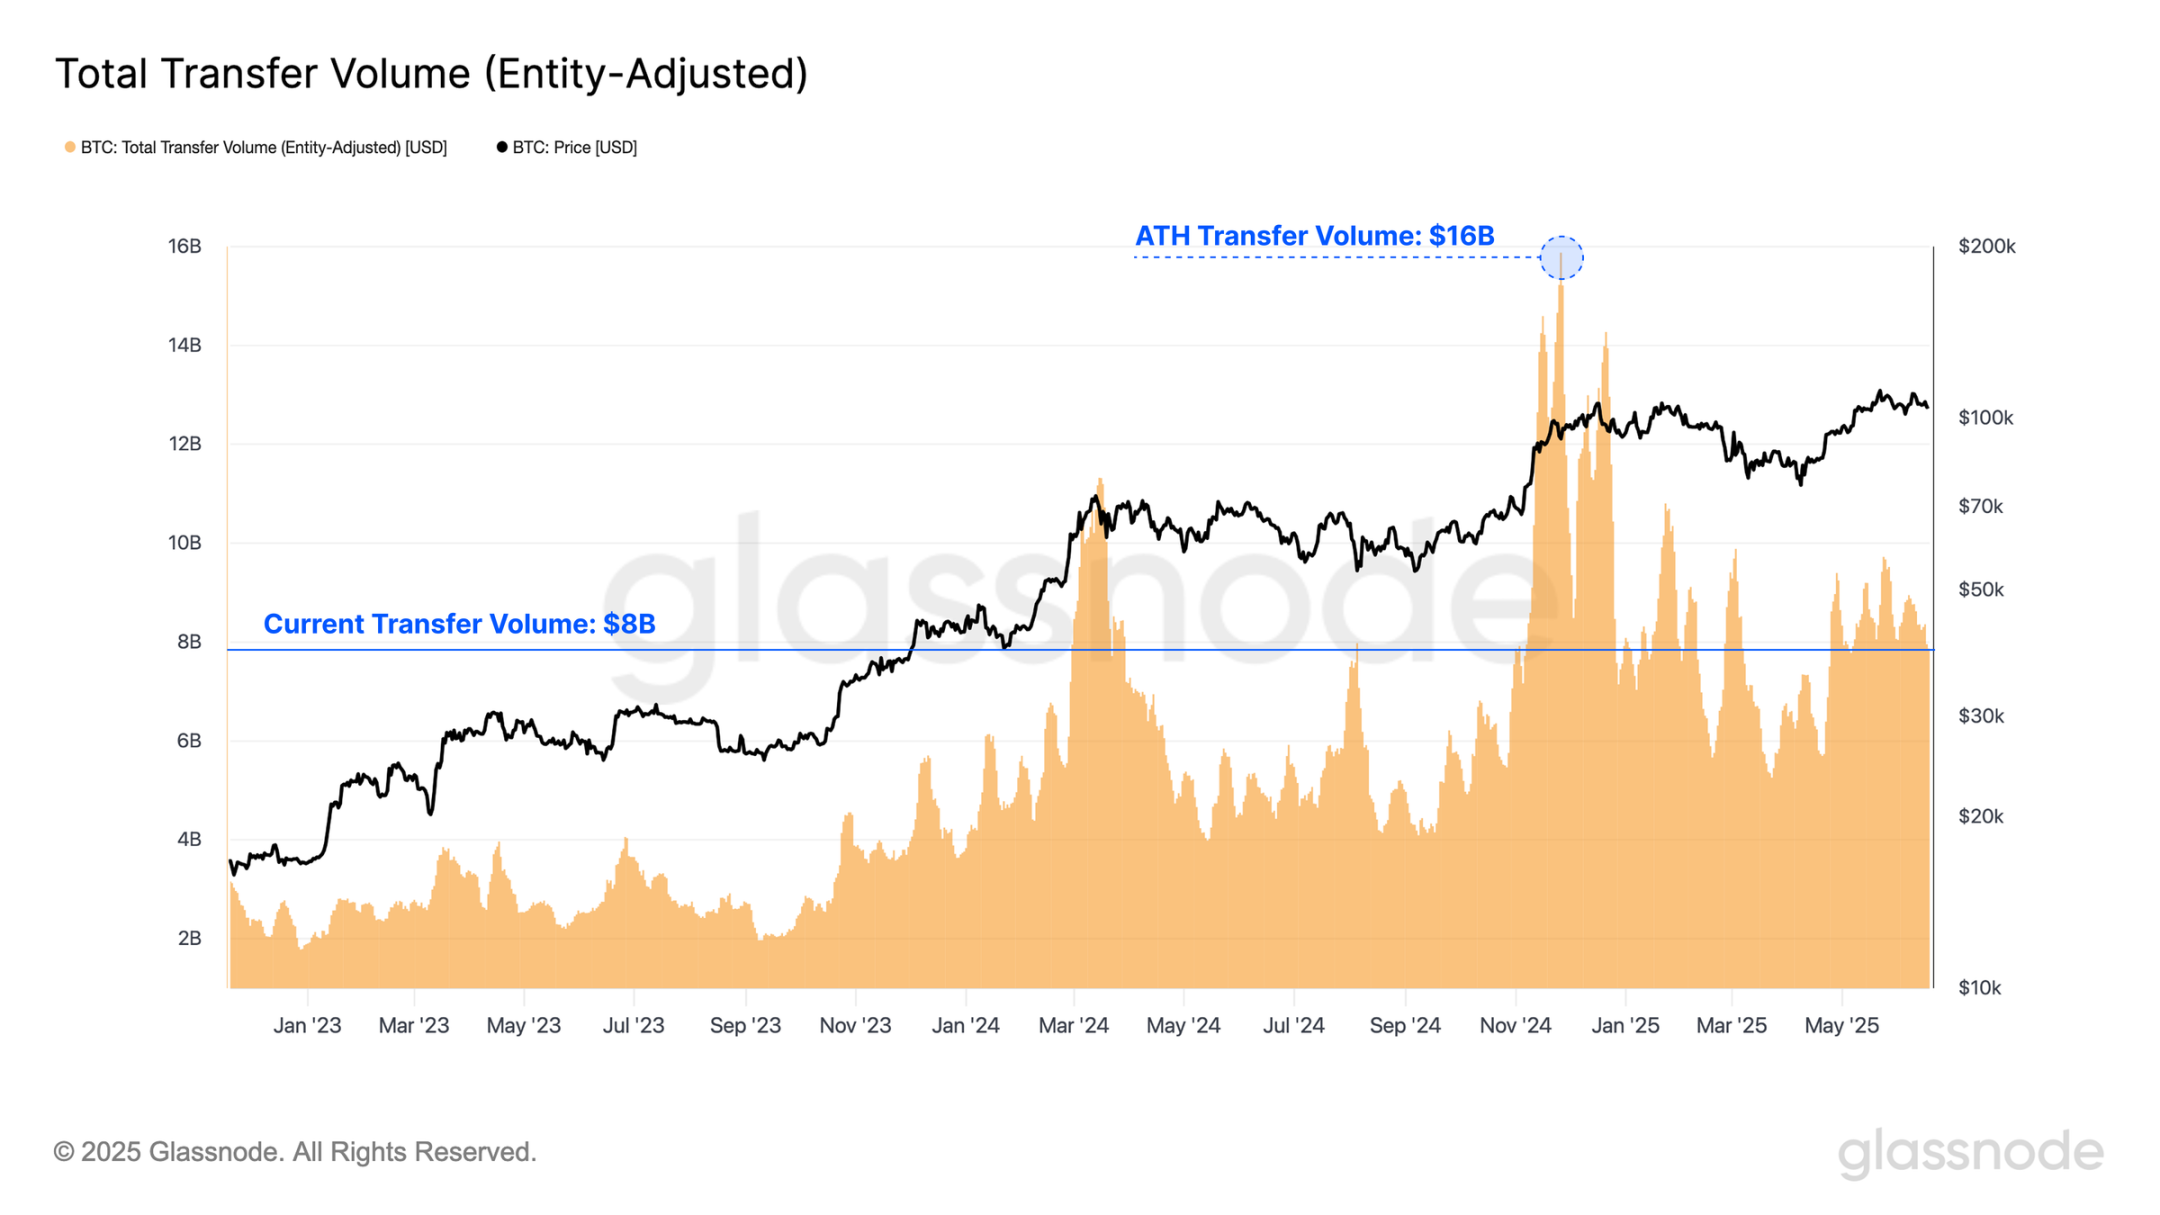
The current average transaction amount is $36,200, indicating that while transaction volume has decreased, the value of each transaction remains substantial. This trend suggests that larger entities continue to utilize the Bitcoin network, as the throughput per transaction is still rising despite the overall decline in transaction volume.

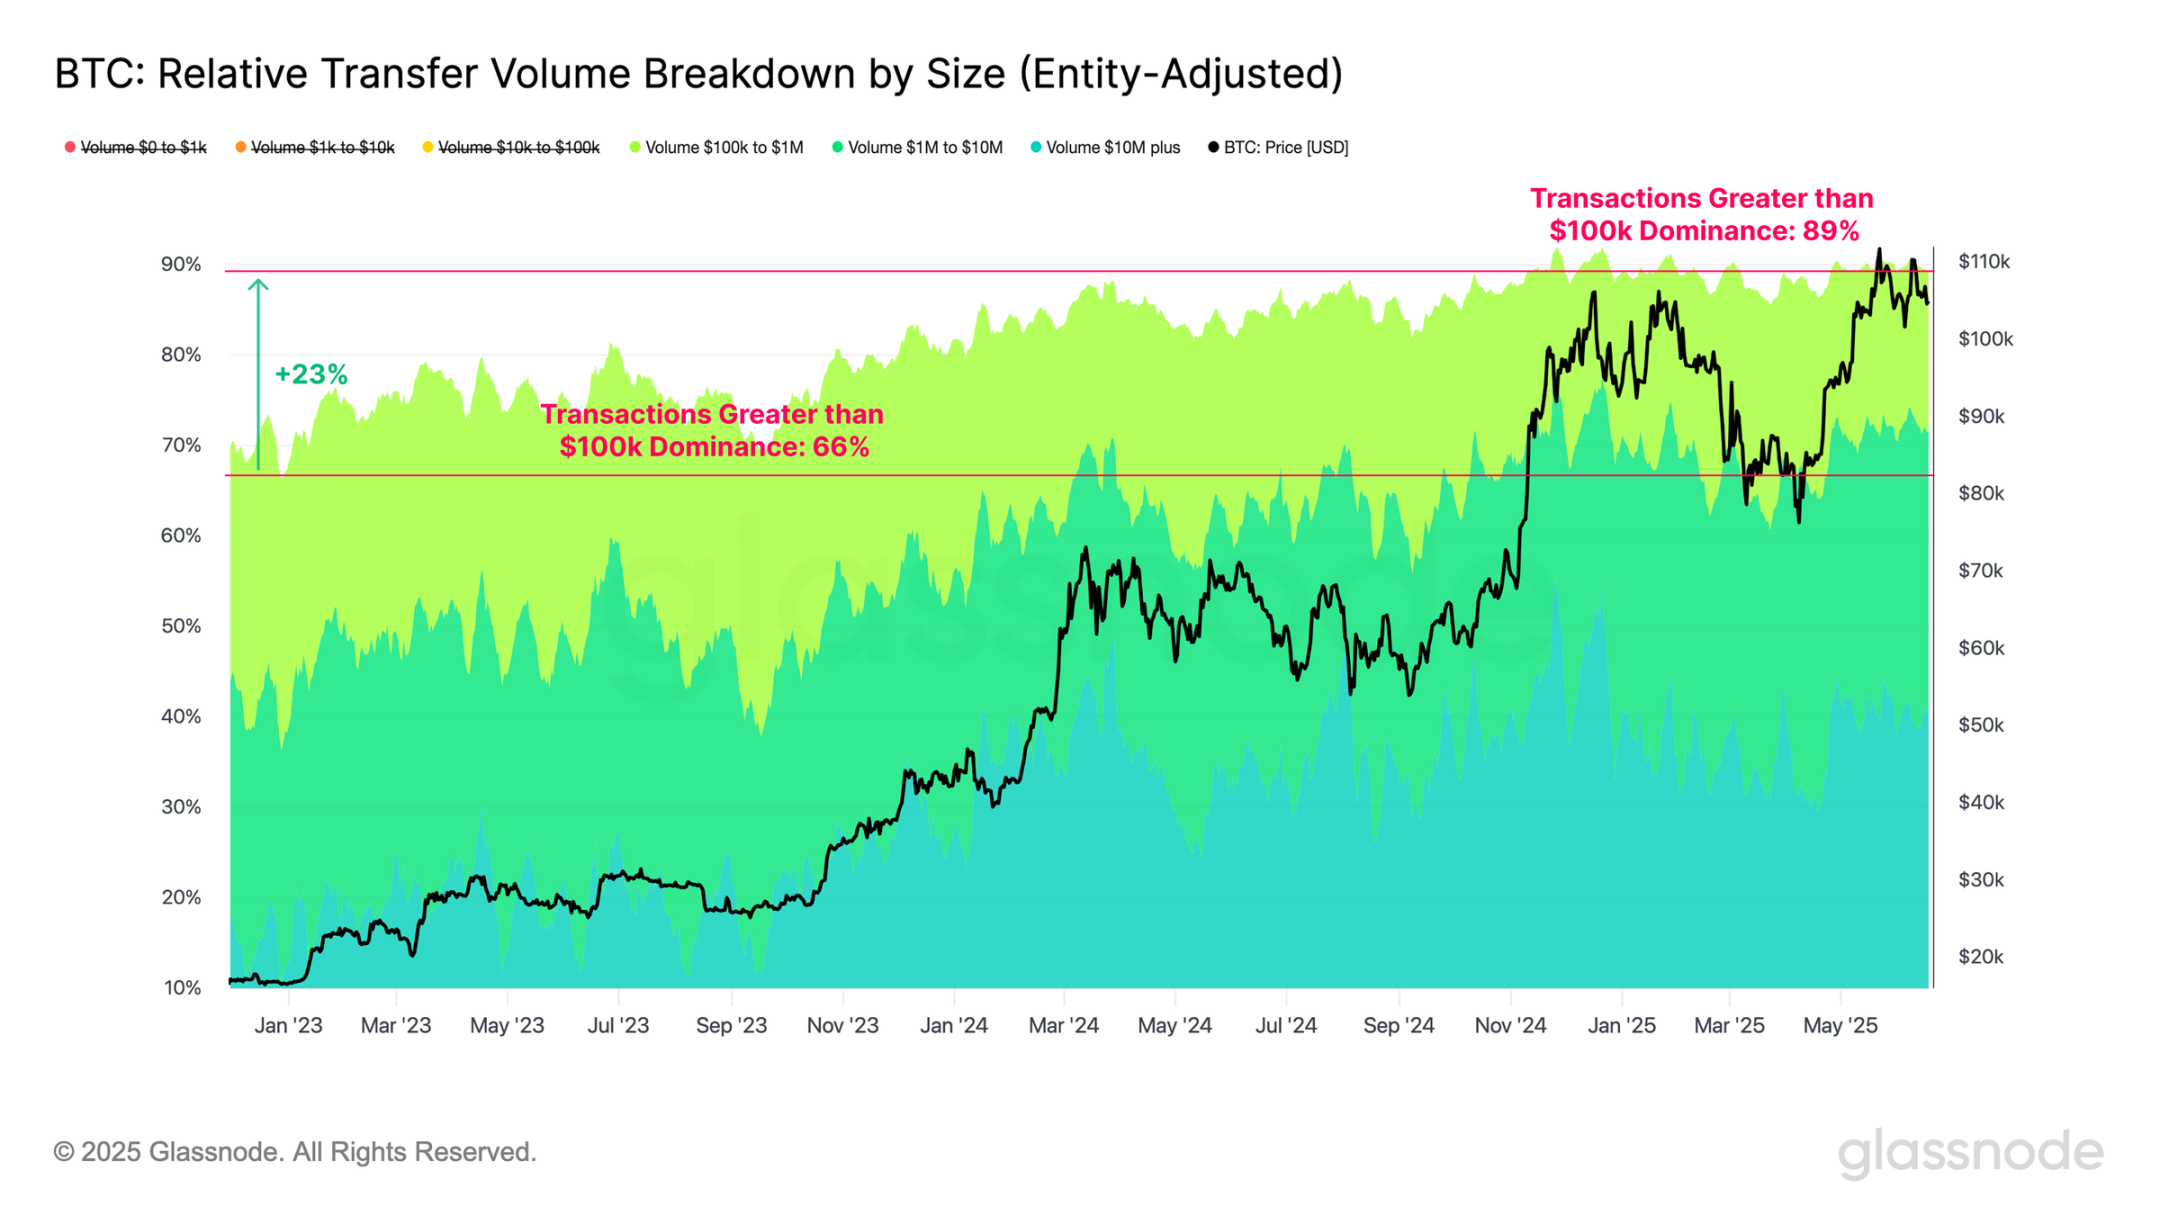
To validate the hypothesis that larger entities are increasingly using the Bitcoin network for value transfer, we can analyze the settlement volume by transaction size. Transactions over $100,000 have shown a clear structural dominance, accounting for 66% of network transaction volume in November 2022, and now rising to 89%. This trend reinforces the view that high-value participants are increasingly dominating on-chain activities.
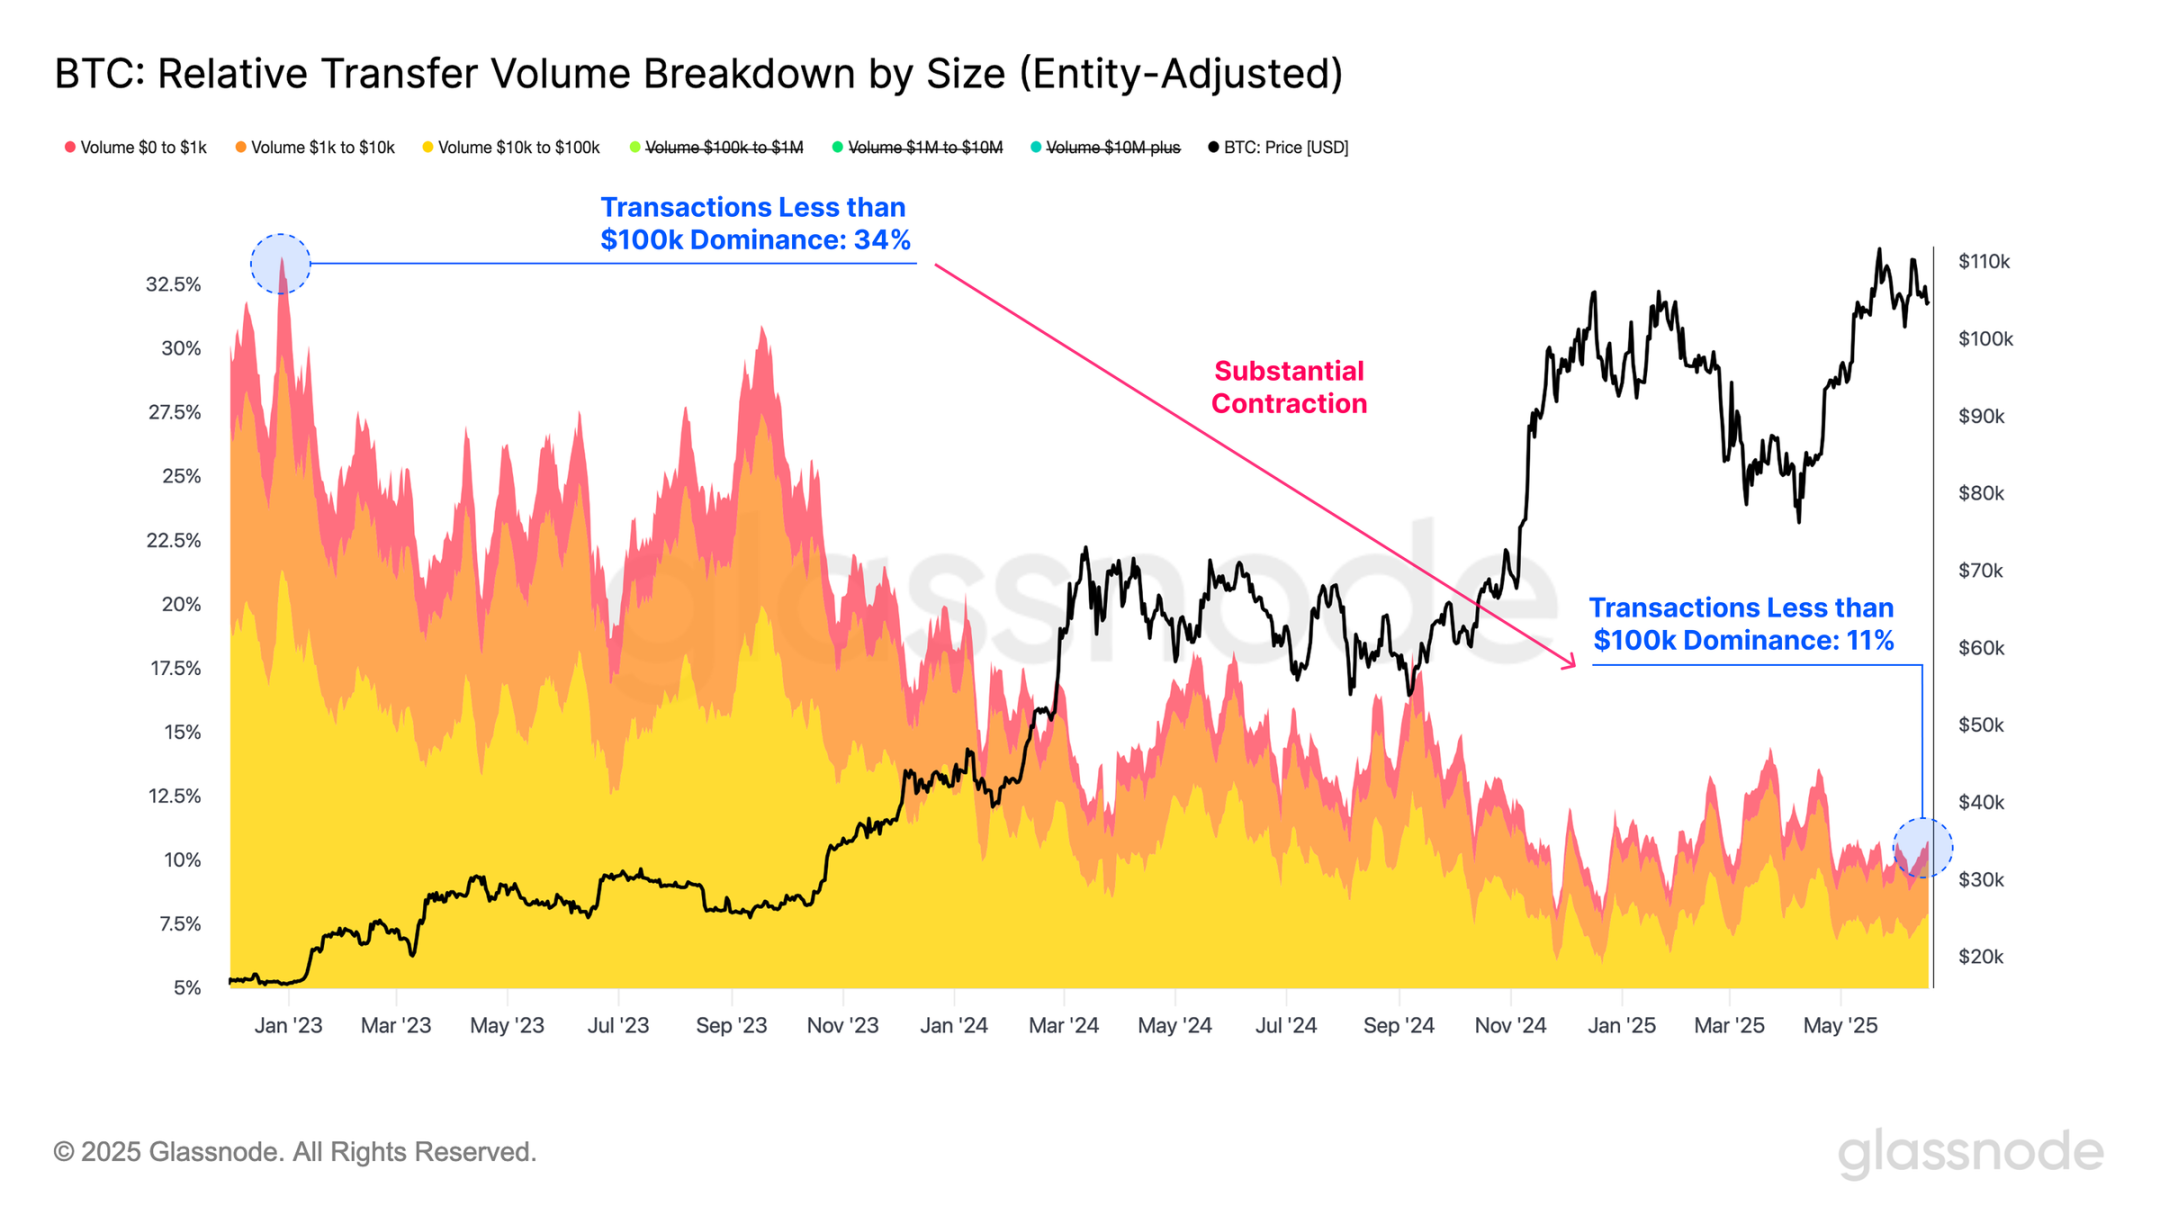
In contrast, transactions of $100,000 or less have experienced a significant contraction during the same period. After peaking at a relative dominance of 34% in December 2022, this group has structurally decreased its share of total transfer volume, now accounting for only 11%.
A more detailed breakdown of each subgroup indicates that this trend is consistent across the board, with each group's share of network capacity showing significant declines.
- $0-1,000: 3.9% to 0.9%
- $1,000-$10,000: 8.4% to 2.1%
- $10,000-$100,000: 21.4% to 7.9%
On-Chain Fees at Historical Lows
For years, Bitcoin transaction fees have been influenced by technological upgrades and changes in usage patterns. The introduction of SegWit reduced the actual size of transactions, providing fee discounts; while centralized exchanges have adopted batch processing as an industry standard practice, further enhancing efficiency by consolidating multiple withdrawals into a single transaction. Recently, the embedding of arbitrary data into the blockchain through inscriptions and runes has led to periodic spikes in fees, often causing network congestion.
Historically, on-chain fees have been a reliable indicator of network demand; when block space is limited relative to overall transaction demand, fee pressure tends to rise sharply. In high-pressure environments, limited block space forces users to compete for transaction packaging and ordering, with fees themselves acting as a pressure relief valve. Therefore, rising fees typically indicate increased demand for block space, signaling heightened user activity and speculative interest.
However, in recent months, miners' transaction fee revenue has significantly declined, averaging only $558,000 per day last month. This sluggish fee pressure indicates a significant drop in demand for block space, echoing similar signals from the overall decrease in transaction volume.

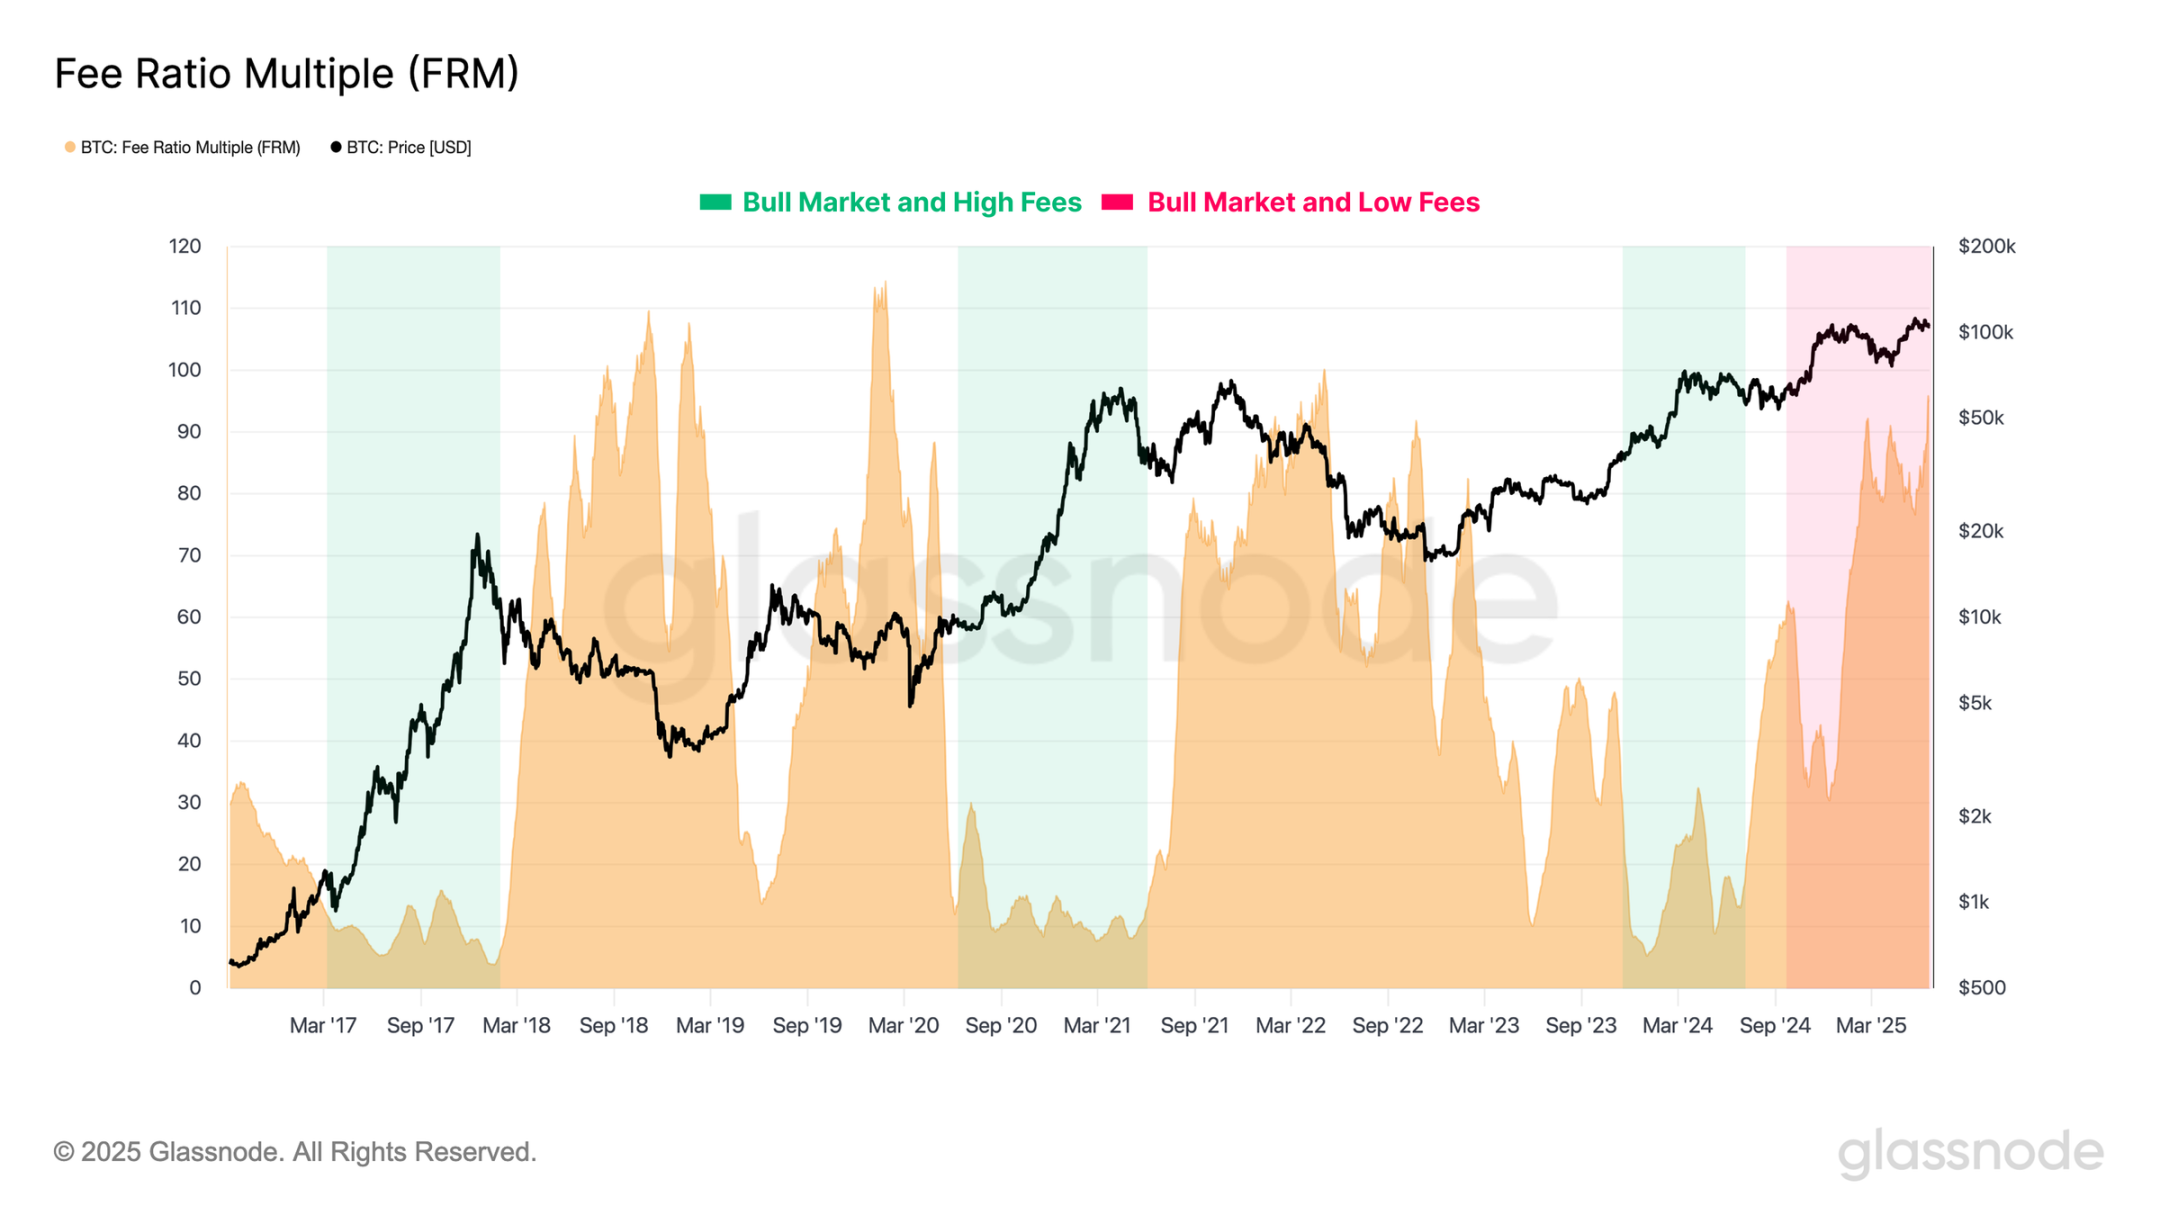
The Fee Revenue Multiplier (FRM) refers to the ratio of total miner rewards (block subsidies and transaction fees) to total fees. This ratio helps to understand the composition and proportion of miner income.
During previous bull markets, and typically during periods of historical peaks, this ratio tends to decline as network activity increases and demand for transaction inclusion surges.
However, the current cycle presents a rather unique market structure; despite Bitcoin's trading price being slightly below its historical peak, the FRM ratio remains unusually high. This discrepancy highlights that current fee pressure is relatively low, indicating that on-chain activity is surprisingly calm, especially in a market where trading prices are close to historical highs.
Increased Off-Chain Trading Volume
The Bitcoin economy consists of both on-chain and off-chain components, each playing a crucial role in the asset's market dynamics. As Bitcoin's consensus strengthens and the range of available financial instruments expands, the influence of centralized exchanges has grown. These platforms facilitate the majority of trading activity and have become key venues for price discovery.
Therefore, assessing the off-chain activity of exchanges is essential for constructing an overall view of Bitcoin ecosystem activity.
Starting with the spot market, trading activity on centralized exchanges has remained strong over the past year, with an average daily trading volume of $10 billion, peaking at $23 billion in November 2024. Notably, this scale of spot trading volume is typically comparable to the daily number of transactions settled on-chain, highlighting the parallel scale of activity between the spot market and the underlying network.

In the derivatives market, perpetual contracts and calendar contracts dominate trading volume, often exceeding the trading volume of on-chain, spot, and options by an order of magnitude.
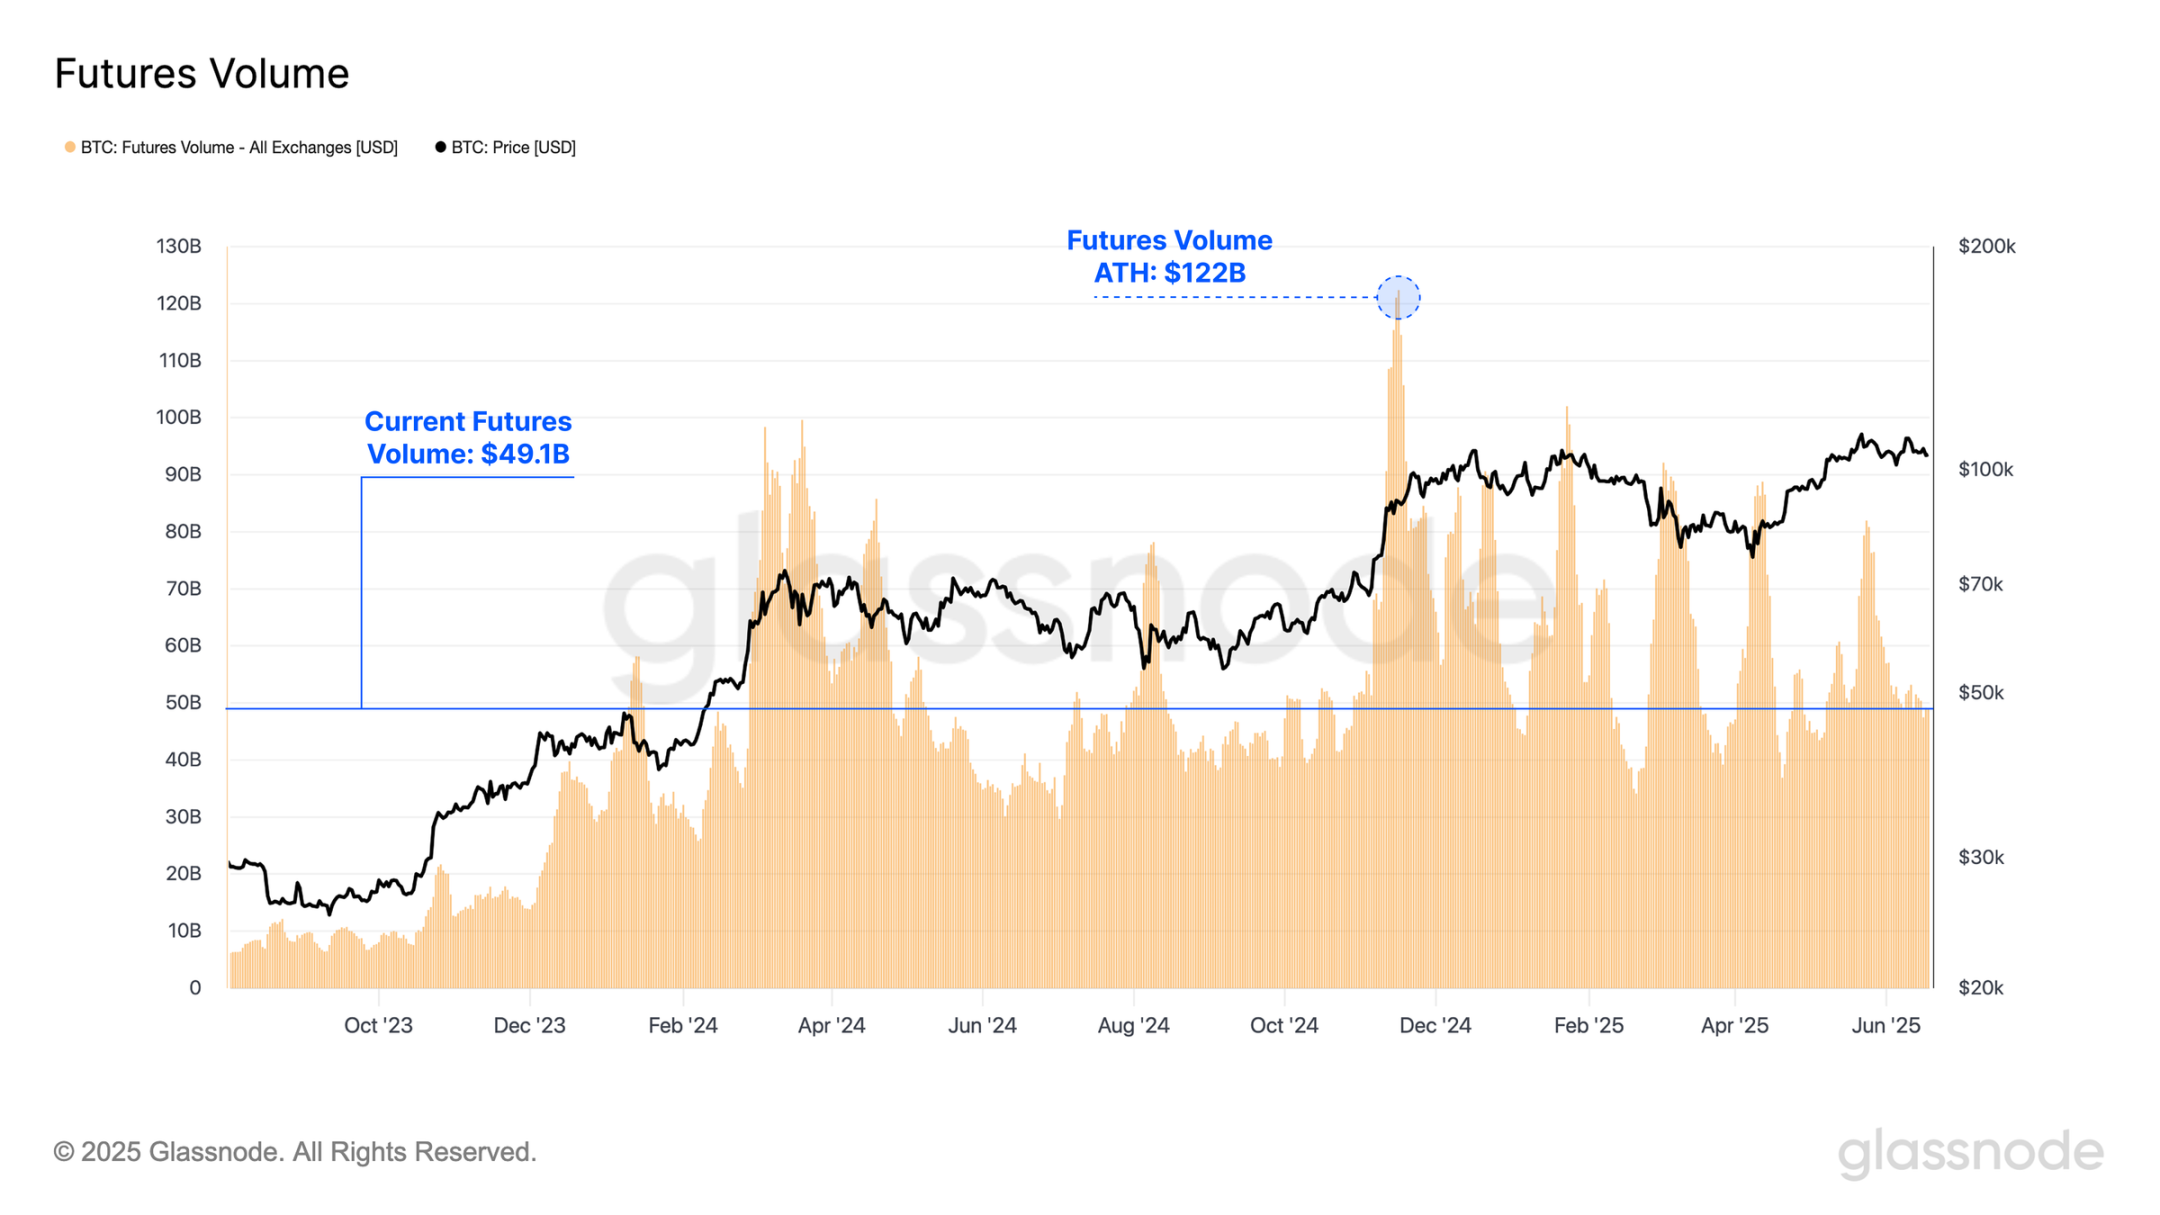
Trading activity in futures contracts has surged during this cycle, averaging $57 billion in daily trading volume over the past year. Additionally, in November 2024, futures trading volume reached an astonishing peak of $122 billion per day. The scale of trading volume in the futures market underscores the dominance of these instruments for speculators, traders, and risk hedgers.
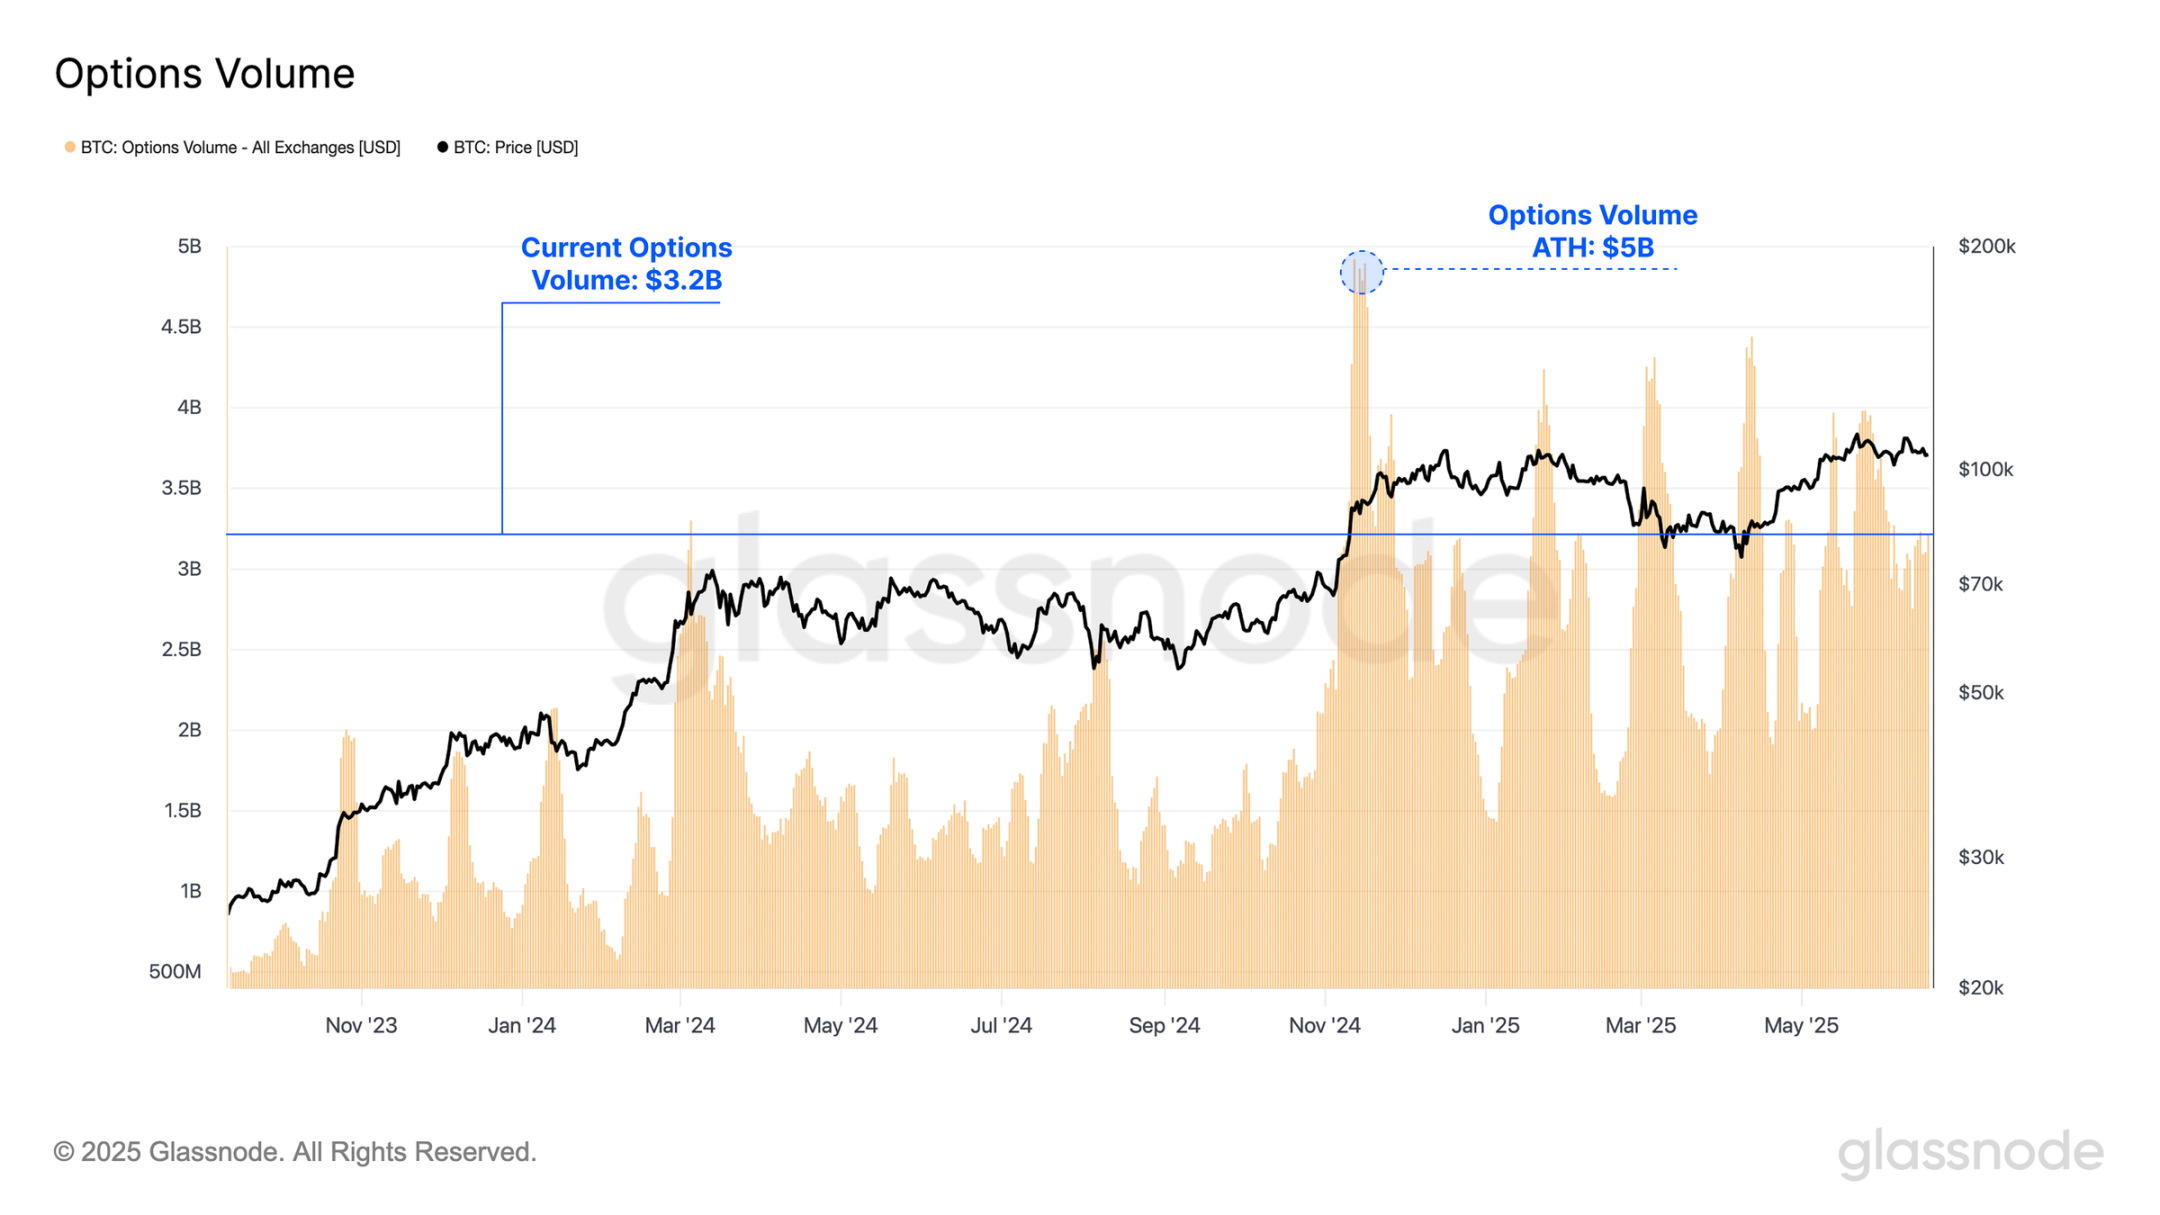
Moreover, options trading volume has significantly increased during this cycle, averaging $2.4 billion in daily trading volume over the past year, peaking at $5 billion. This surge highlights the growing use of options contracts by mature market participants, as investors increasingly leverage options to implement advanced risk management strategies and fine-tune their market exposure.
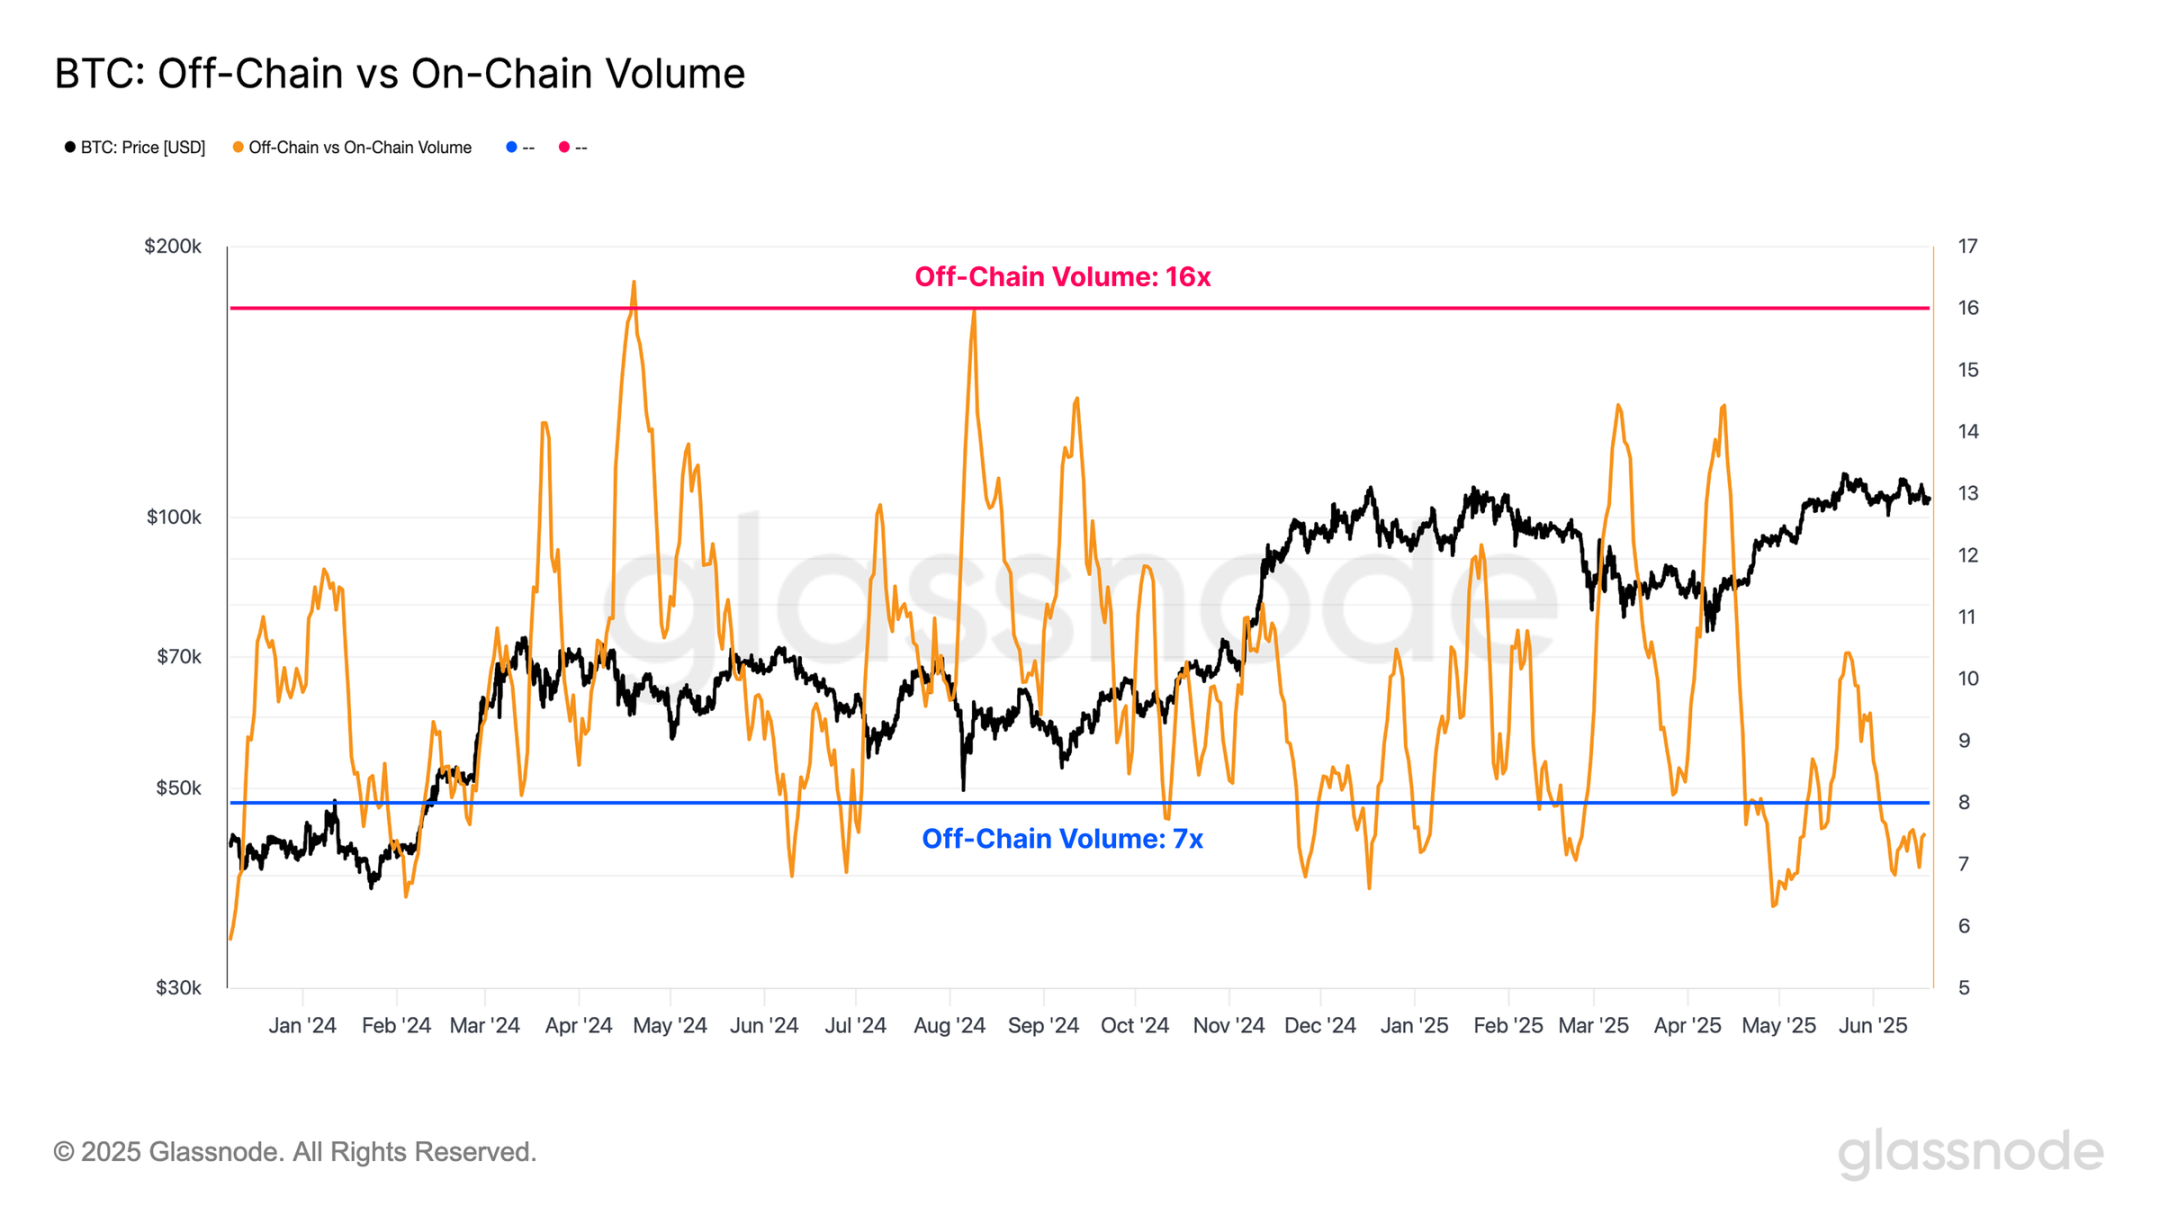
The growth in spot and derivatives trading volume underscores the shift in trading activity, with an increasing amount of trading volume moving from the Bitcoin underlying to off-chain trading platforms. When comparing off-chain trading volume (spot, futures, and options) to network settlement value, we note that off-chain trading volume is typically 7 to 16 times higher than on-chain trading volume.
This shift may significantly affect how we interpret network indicators, as traditional metrics may no longer fully reflect market activity. However, the on-chain market remains the core of the Bitcoin economy and constitutes the foundational layer for the broader ecosystem's operations. Deposits and withdrawals serve as the primary link between off-chain platforms and the Bitcoin network, and on-chain activity is likely to continue playing a crucial role in market structure and capital flows.
Leverage Accumulation
Having established the growing role of derivatives in the Bitcoin ecosystem, we now turn our attention to the open interest (OI) in futures and options contracts to assess the accumulation of market leverage.
Both markets have experienced significant growth in open interest, with futures open interest rising from $7.7 billion to $52.8 billion, and options open interest increasing from $3.2 billion to $43.4 billion. The total open interest in derivatives peaked at $114 billion and currently remains high at around $96.2 billion. This ongoing expansion reflects a substantial increase in leverage within the Bitcoin economy, which may heighten the risk of price volatility.
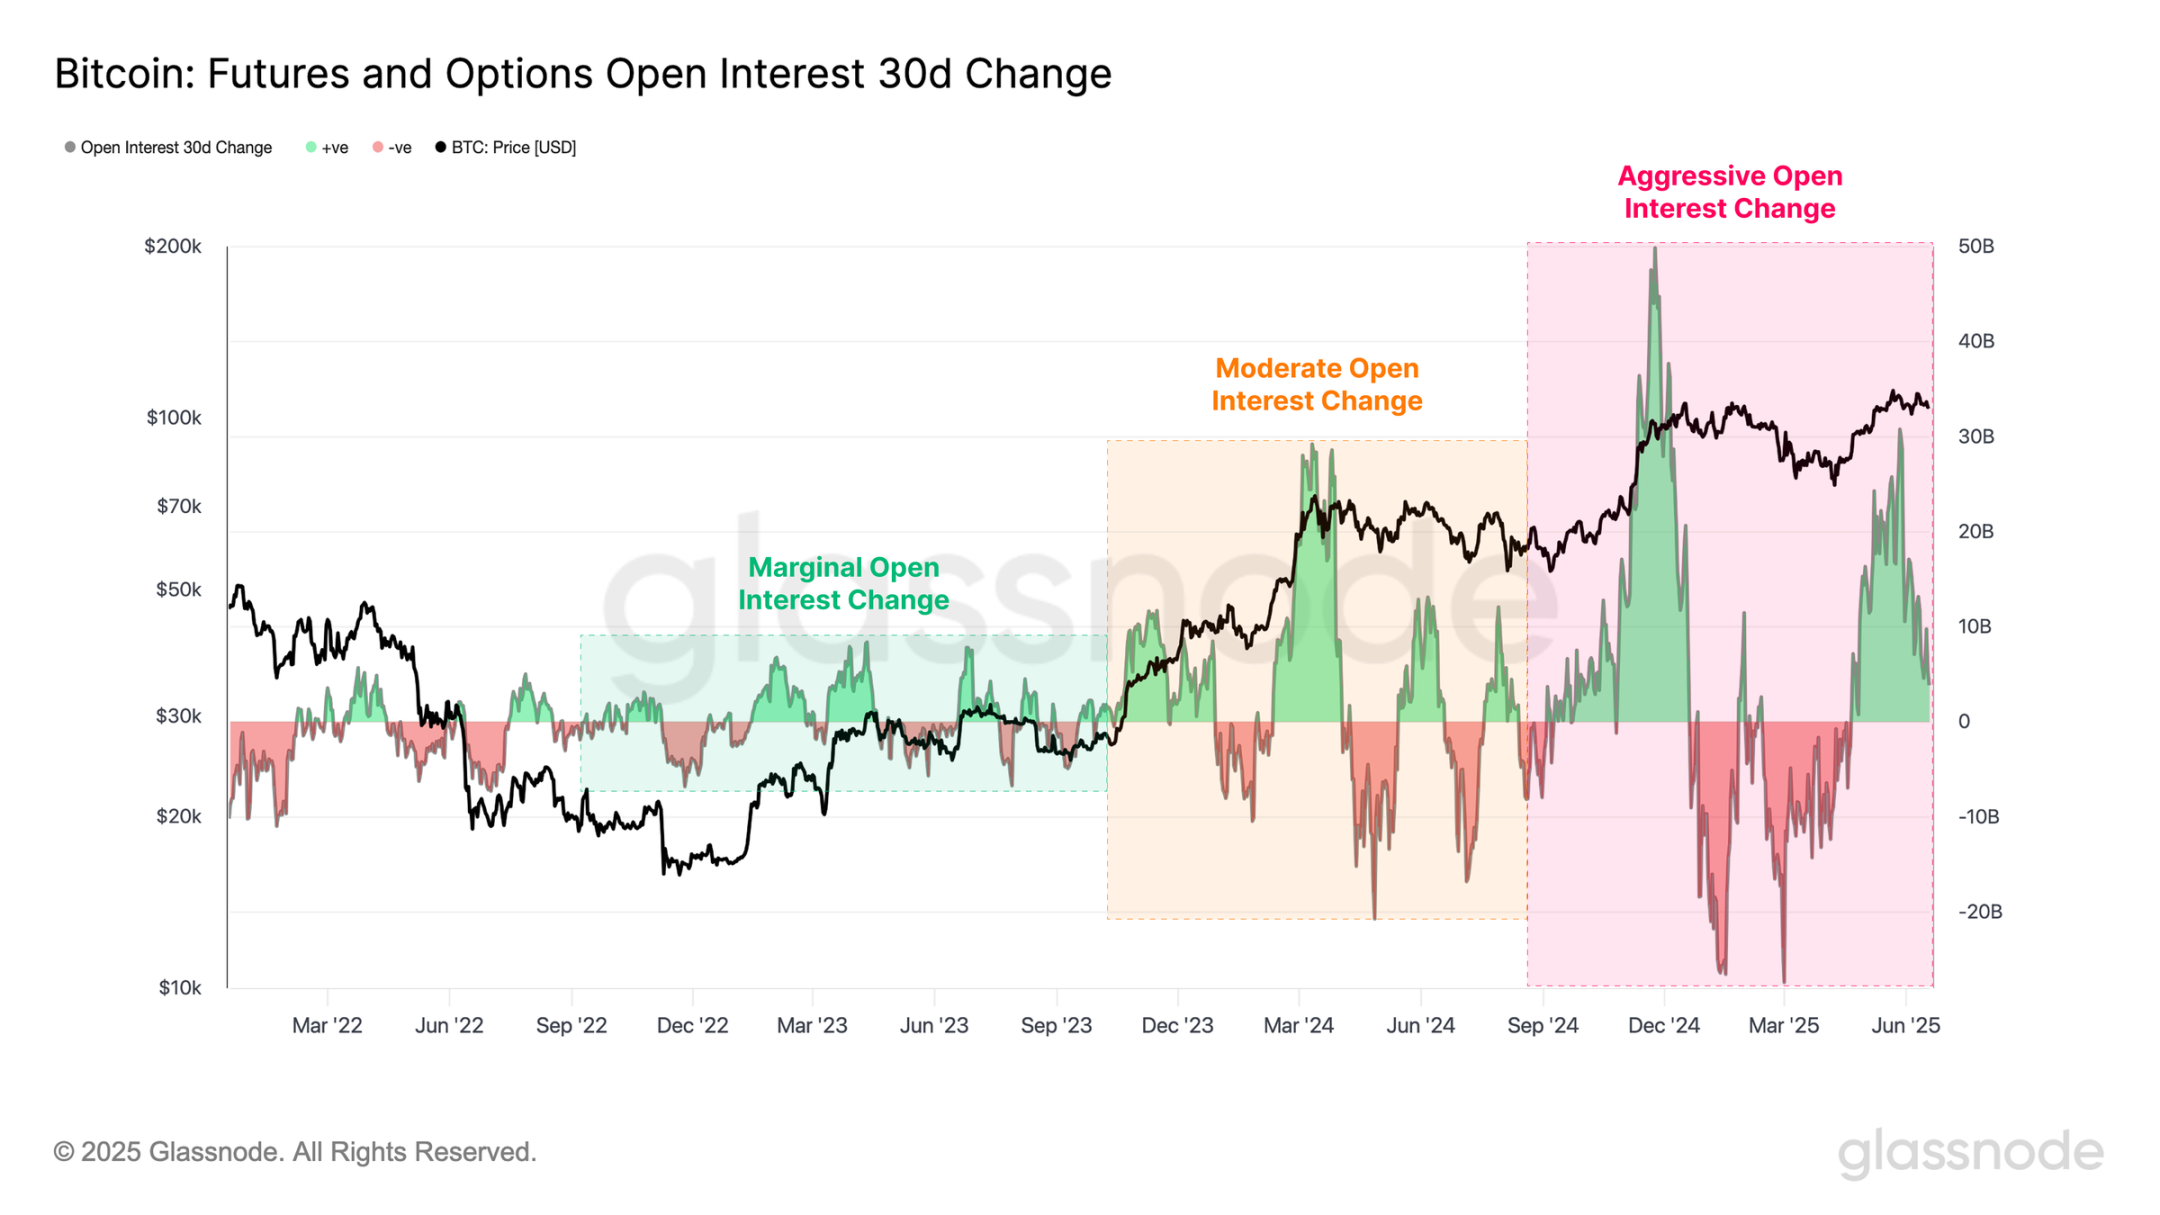
When evaluating the changes in total open interest over 30 days, we observe that the volatility has been accelerating. Throughout 2023, the changes in open interest were relatively smooth; however, with the launch of the U.S. spot ETF in January 2024, these fluctuations began to intensify.
The increase in open interest volatility marks a transformation of the broader market, shifting from a structure primarily driven by spot activity to one dominated by derivatives. This transition raises the risk of chain liquidations and leads to a more unstable and reflexive market environment.
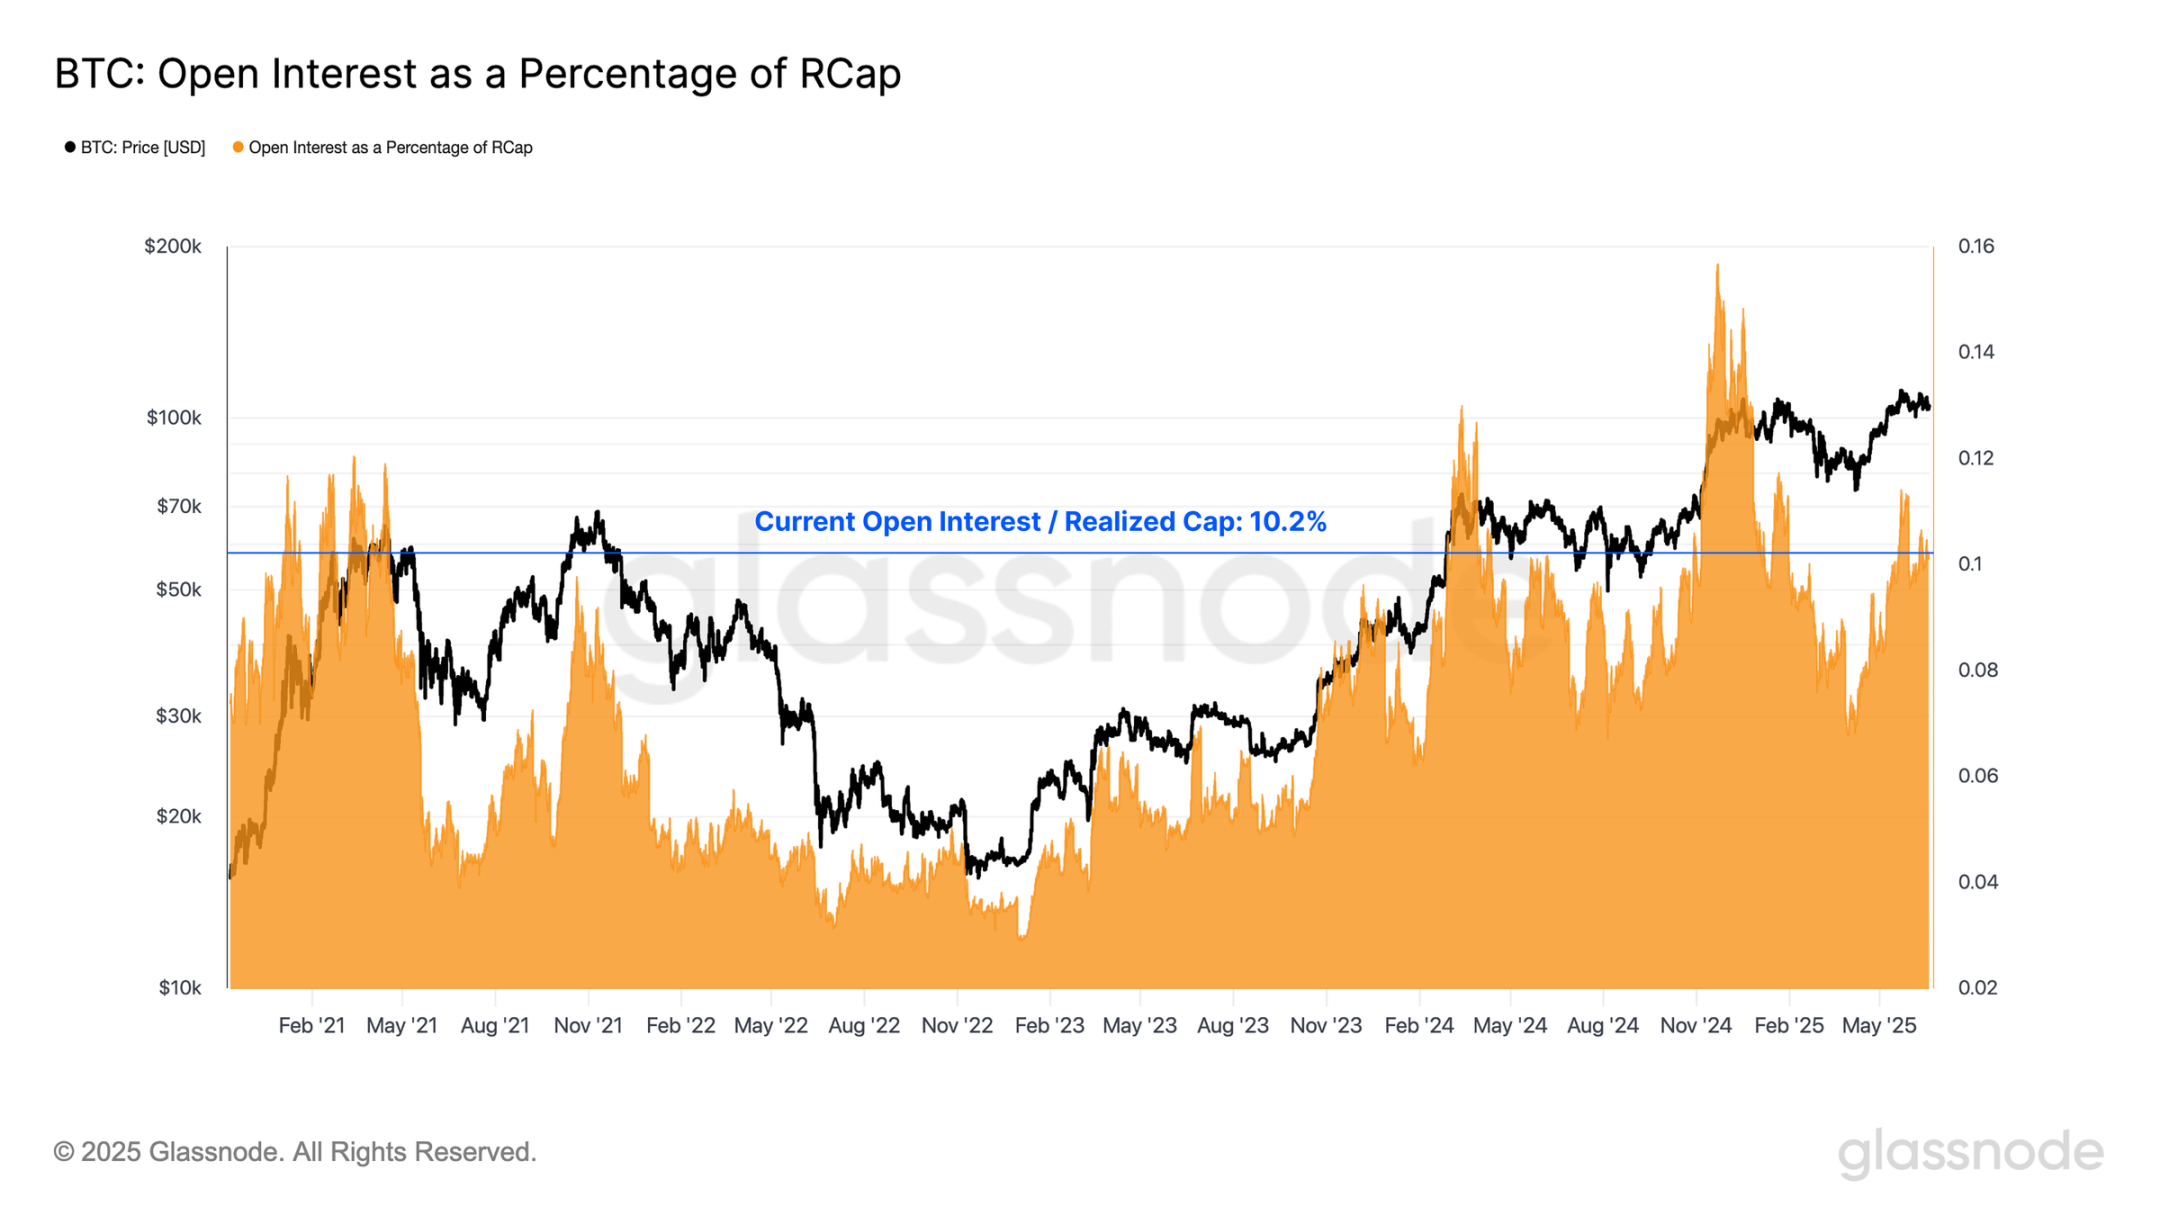
To quantify the accumulation of leverage, we calculated the realized market cap leverage ratio, which compares total open interest to Bitcoin's realized market cap (i.e., the total dollar value stored on the network). A significantly positive deviation in this ratio indicates that speculative activity in the derivatives market has increased relative to the underlying asset's scale, suggesting rising leverage and potential vulnerabilities in the market structure. Conversely, a contraction in this ratio indicates that a deleveraging phase is underway.
Currently, the leverage ratio remains as high as 10.2%, with only 182 trading days (10.8%) out of 1,679 trading days having a leverage ratio above this level. This highlights a substantial increase in market leverage and further reinforces the growing dominance of derivatives in shaping the current market landscape.
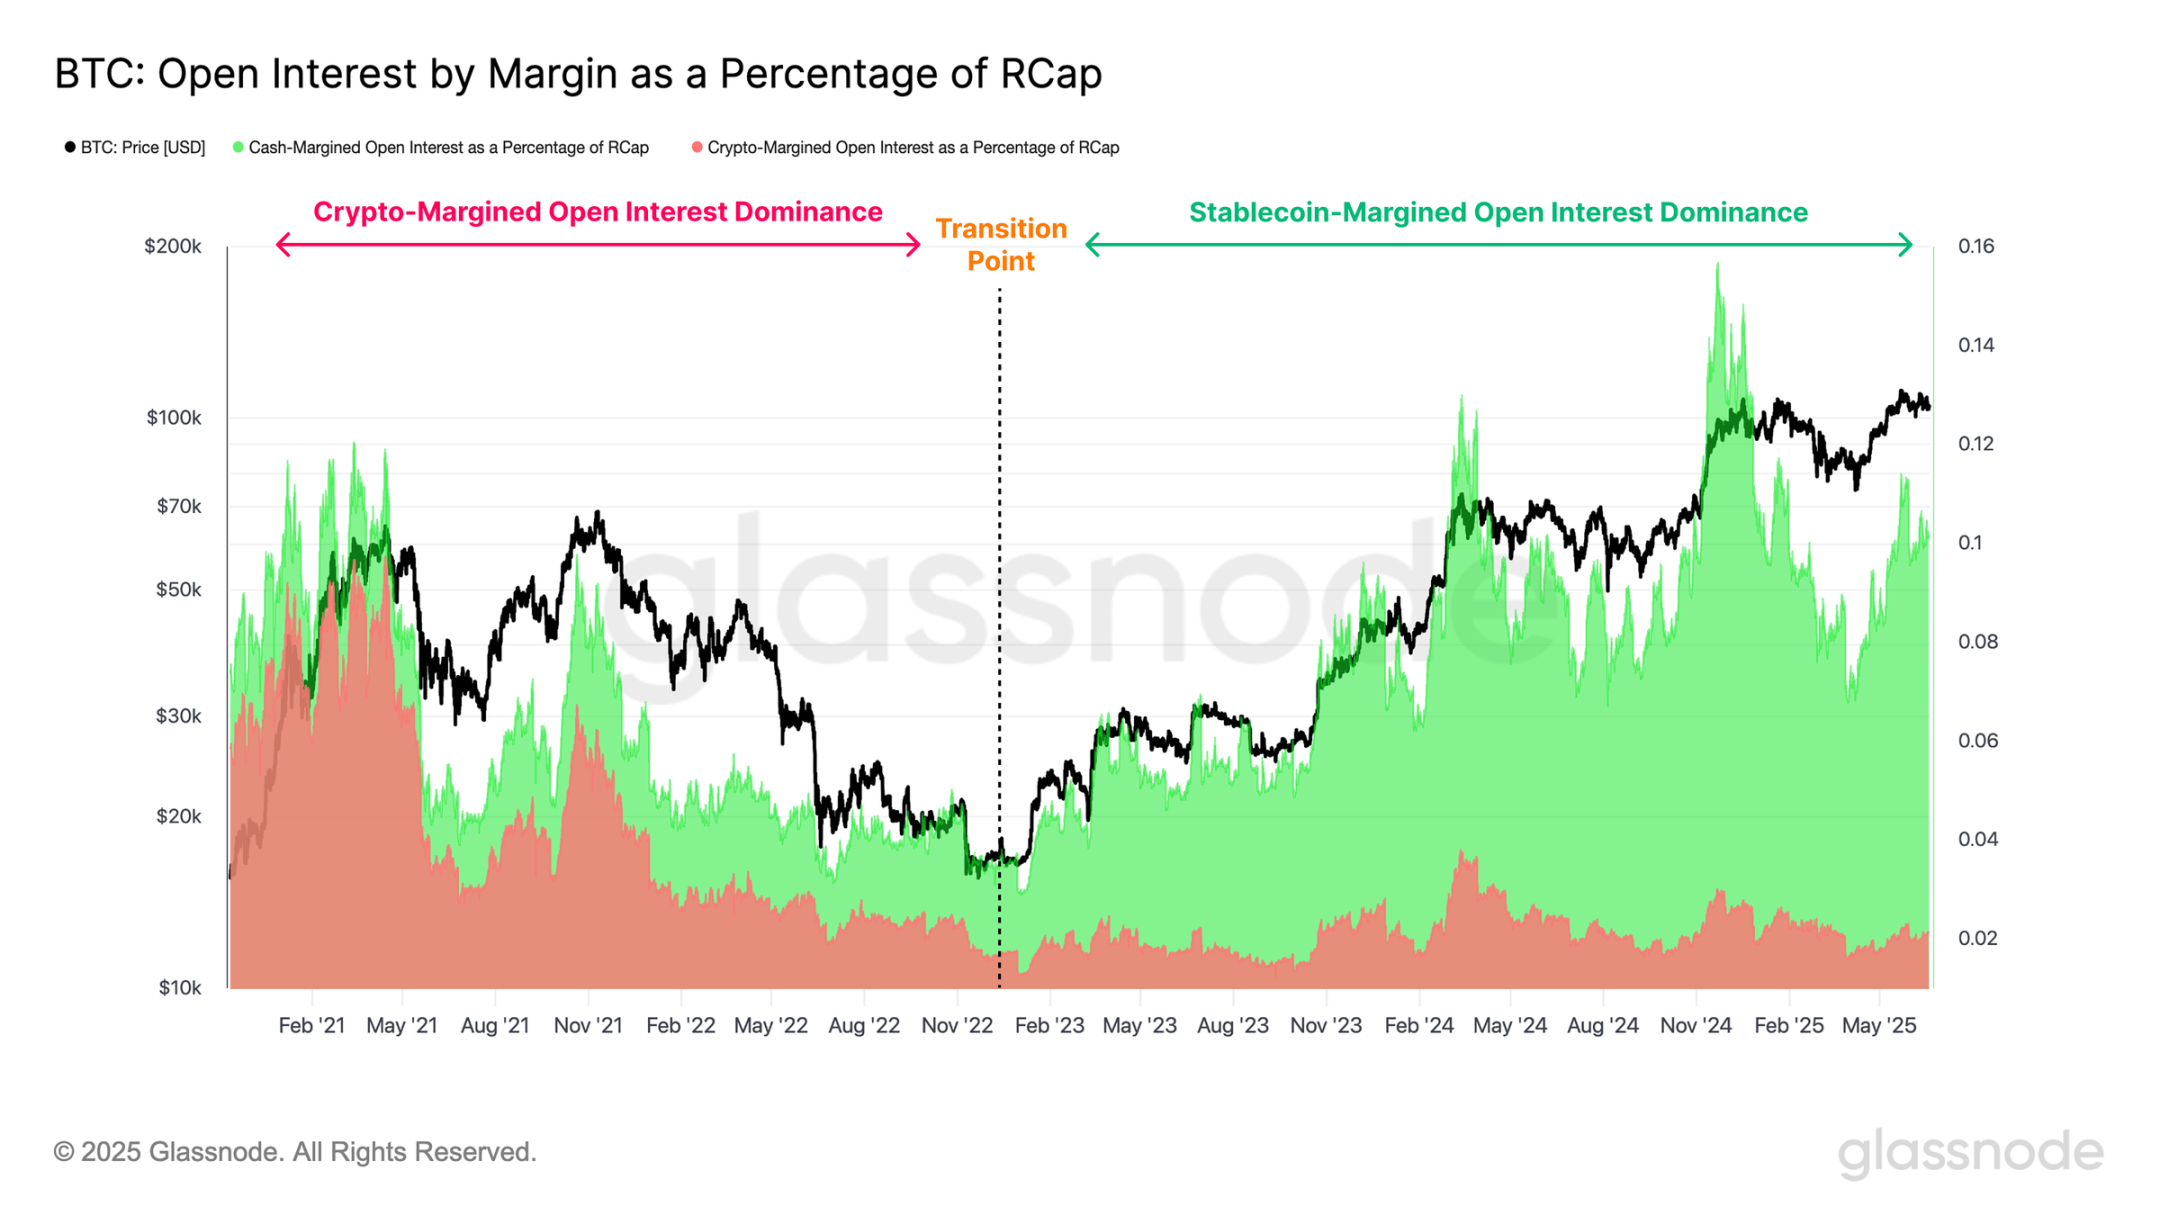
However, since traders can choose between stablecoin margin or cryptocurrency margin as collateral, the collateral structure of open interest is not uniform. Stablecoin margin positions are more conservative, with collateral pegged to the dollar; whereas cryptocurrency margin positions introduce additional volatility, as the value of the underlying collateral fluctuates with the market.
To assess the overall health of the collateral structure in the derivatives market, we separately calculated the realized market cap leverage ratios for stablecoin margin and cryptocurrency margin open interest. During the 2018-2021 cycle, cryptocurrency margin collateral was the preferred choice for investors. Coupled with the widespread use of 100x leverage, this structurally weak collateral base exacerbated the market downturn in May 2021.
Since the highly publicized collapse of FTX, stablecoin margin collateral has become the primary form of margin, currently accounting for the vast majority of open interest collateral. This shift underscores the increasing maturity of the derivatives system surrounding digital assets and the movement towards more stable risk management practices.
Conclusion
Despite the rise in Bitcoin prices, a clear divergence has emerged between market valuation and network activity, with transaction numbers remaining unusually low, primarily due to a sharp decline in non-token transactions. The decrease in throughput has led to a significant drop in miner fee revenue, contrasting sharply with previous bull market cycles, where price increases typically resulted in network congestion and soaring fees.
Nevertheless, the settlement volume on the network remains quite substantial, averaging $7.5 billion settled daily. The lower transaction numbers and higher transaction throughput indicate that larger entities are increasingly dominating on-chain activities. Additionally, off-chain trading platforms have also seen strong growth, with the total trading volume of spot, futures, and options typically being 7 to 16 times higher than on-chain settlement volume.
The leverage in the derivatives market continues to rise, with total open interest in futures and options remaining at a historical high of $96.2 billion. However, the composition of the underlying collateral structure has significantly improved, with stablecoin margin positions currently making up the majority of open interest. This transition highlights the increasing maturity of the derivatives system surrounding digital assets and the movement towards more robust risk management practices.
免责声明:本文章仅代表作者个人观点,不代表本平台的立场和观点。本文章仅供信息分享,不构成对任何人的任何投资建议。用户与作者之间的任何争议,与本平台无关。如网页中刊载的文章或图片涉及侵权,请提供相关的权利证明和身份证明发送邮件到support@aicoin.com,本平台相关工作人员将会进行核查。


