With its price at $104,400 and obvious indications of market fatigue, Bitcoin is once again at a pivotal point. Even though the overall trend is still bullish, technical warning signs are beginning to appear during the current correction phase, and none are more concerning than the possible mini-death cross on the four-hour chart.
A mini-death cross happens when a short-term moving average, usually the 20 or 26 EMA, crosses below a longer-term one, such as the 50 EMA, on shorter time frames. It frequently serves as a momentum killer during local rallies, escalating bearish sentiment and setting off stop losses, even though it is less significant than a full-scale daily death cross. The bullish momentum of the past few weeks may be swiftly nullified if Bitcoin prints this cross in the upcoming sessions.
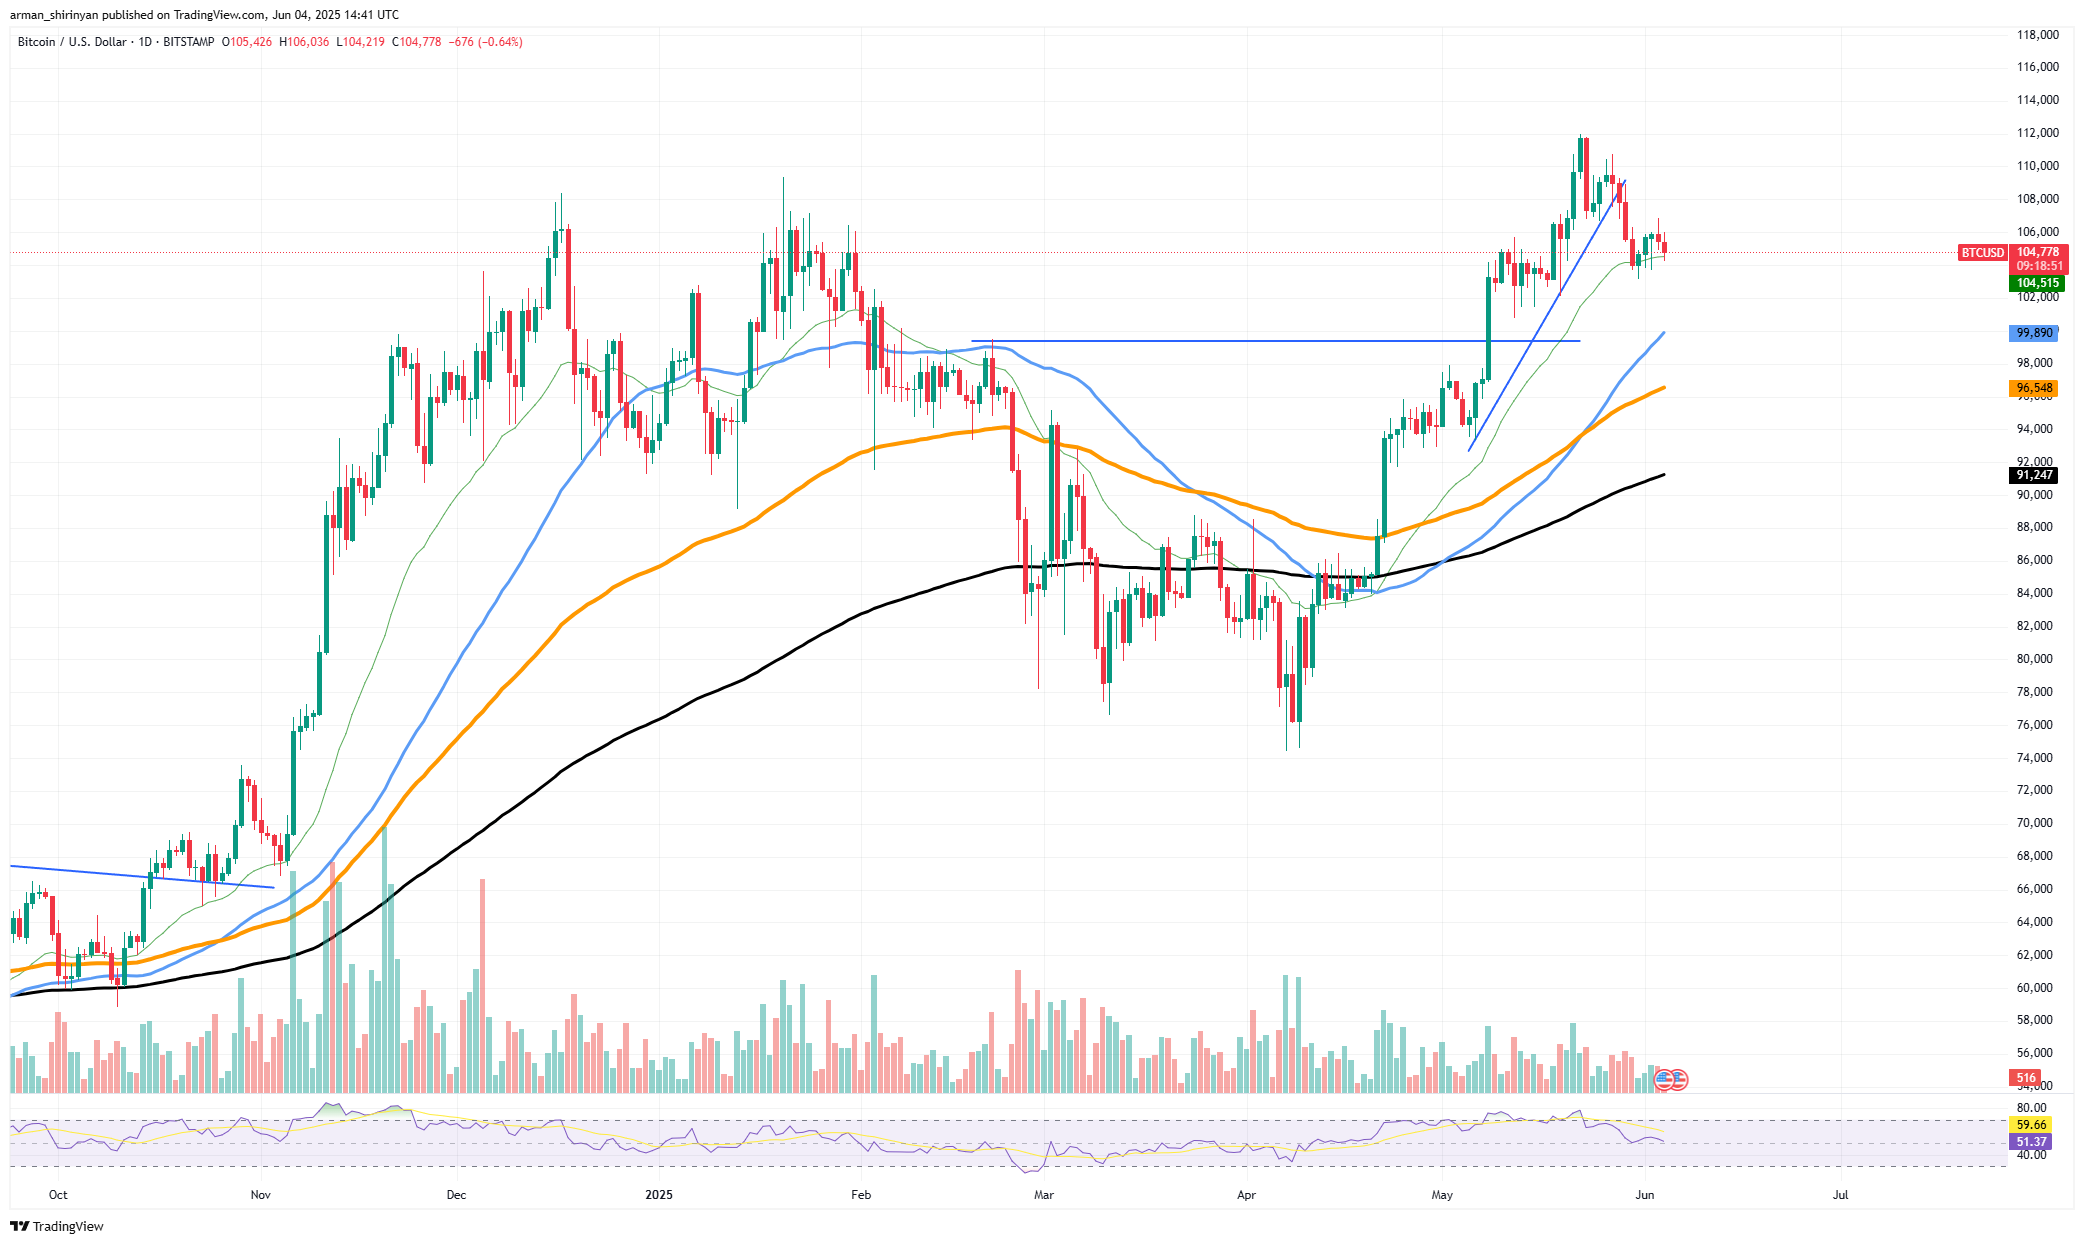
BTC/USDT Chart by TradingView
When viewed on a daily basis, Bitcoin is positioned just above the 26 EMA (~$104,500), which has served as crucial short-term support. Bitcoin may plummet toward the next significant support zone, which is around $99,800, the psychological support and previous breakout level, if it falls below this level. If there is more of a decline, the 50 EMA at about $96,500 will be reached. A deeper correction down to the high $80,000 range where the 100 and 200 EMAs converge must be avoided if this level holds.
HOT Stories Bitcoin (BTC) Signals Mini-Death Cross, This Shiba Inu (SHIB) Signal Is Bullish, Dogecoin (DOGE) Sleeping 'Buy Bitcoin': Musk's $5 Trillion Debt Warning Seen as BTC Endorsement XRP Rockets 721,735% in Abnormal Bull Liquidations in Hourly Bloodbath Shockingly Bullish Bitcoin Price Prediction Made by Legendary Venture Capitalist
Moreover, volume has sharply decreased, indicating waning bullish sentiment. Indicating that the market may be moving into a distribution phase rather than a period of healthy consolidation, the RSI has fallen close to 50 and is teetering on the edge of the neutral-bearish zone.
Those who are interested in investing should keep a close eye on $104,000. There would be a higher chance of a short-term breakdown if the close fell below that. A swift bounce toward $107,000-$108,000 could occur; if bulls do not step up, the dreaded mini-death cross could become a self-fulfilling prophecy for them.
Shiba Inu gets pushed
Shiba Inu's recent negative sentiment notwithstanding, the token may be displaying a faint but potentially potent bullish signal. SHIB, which is currently trading at $0.00001282, is hovering just above the annual low zone, a crucial support level that has traditionally served as a springboard for rapid reversals. As can be seen from the daily chart, SHIB has moved back to the lower edge of the accumulation zone that it had previously occupied this year.
The $0.0000125-$0.0000130 range has historically triggered relief rallies in late March and April. Although none of these attempts were able to surpass the 200 EMA, they all indicated that buyers were actively protecting the lower band of the range. The token may be approaching a condition that is ready for a rebound, as indicated by the RSI, which is at 39 — just above the oversold threshold.
You Might Also Like

Sun, 06/01/2025 - 13:53 104,125,016 DOGE Transfer Strikes Major US Exchange Coinbase ByGamza Khanzadaev
The fact that the volume is still modest but steady suggests that the sellside pressure is not yet strong enough to send SHIB plunging. Moreover, SHIB has escaped a complete breakdown despite its inability to reclaim the 50 and 100 EMA lines during the most recent bounce, indicating that some traders are still placing bets on consolidation rather than collapse.
Bulls may be able to form a reversal pattern if they can maintain the current level for a few more sessions and recover the $0.0000135 resistance. A retest of the $0.0000157 resistance and a bounce off this annual low support would be the most bullish scenario. The present bearish structure would be rendered invalid, and a wider rally might be sparked by a clear break above that level.
Dogecoin gets sluggish
As the meme coin tries to recover from its most recent local peak, Dogecoin has entered a period of noticeable sluggishness in both price action and volume. As of right now, DOGE is trading at about $0.19 and does not seem to be breaking out to higher levels or falling off a cliff. This sideways movement over the last few days is the most obvious indication of DOGE sleeping.
Although the price is currently circling the support zone between $0.18 and $0.19 and has flattened just above the 100 EMA (blue), there is not any immediate sign of a significant reversal or continuation of any previous trend. The relative strength index (RSI), which indicates neutral-to-bearish sentiment, centers on the 39 mark.
You Might Also Like

Mon, 06/02/2025 - 13:57 Dogecoin (DOGE) Tanks 60%: Here's Ugly Truth ByArman Shirinyan
A decline in trading volume, on the other hand, indicates a lack of active market participation, which is a well-known indication of both bulls and bears' indifference or uncertainty. The 50 EMA or orange line is a crucial technical level to keep an eye on because it serves as dynamic resistance and is presently situated just above the price. In order to rouse bullish momentum and wake up from its slumber, DOGE would need to make a clear breakout above this level — ideally accompanied by strong volume confirmation.
In the interim, the path of least resistance is sideways, if not slightly downward. Because of its lack of direction and volatility, Dogecoin appears to be in either accumulation or apathy mode, which can both lead to significant movements but also tends to lull investors into complacency.
免责声明:本文章仅代表作者个人观点,不代表本平台的立场和观点。本文章仅供信息分享,不构成对任何人的任何投资建议。用户与作者之间的任何争议,与本平台无关。如网页中刊载的文章或图片涉及侵权,请提供相关的权利证明和身份证明发送邮件到support@aicoin.com,本平台相关工作人员将会进行核查。


