A bearish "death cross" signal, in which the short-term moving average crosses below the long-term moving average, has flashed on Bitcoin's hourly chart, sparking speculation on BTC's short-term price trajectory.
The hourly moving average 50 has fallen below the hourly moving average 200 on the Bitcoin hourly chart, indicating a "death cross." Bitcoin reacted to the hourly "death cross" formation by initially bucking the trend, but as of recently, it marked two hourly red candles.
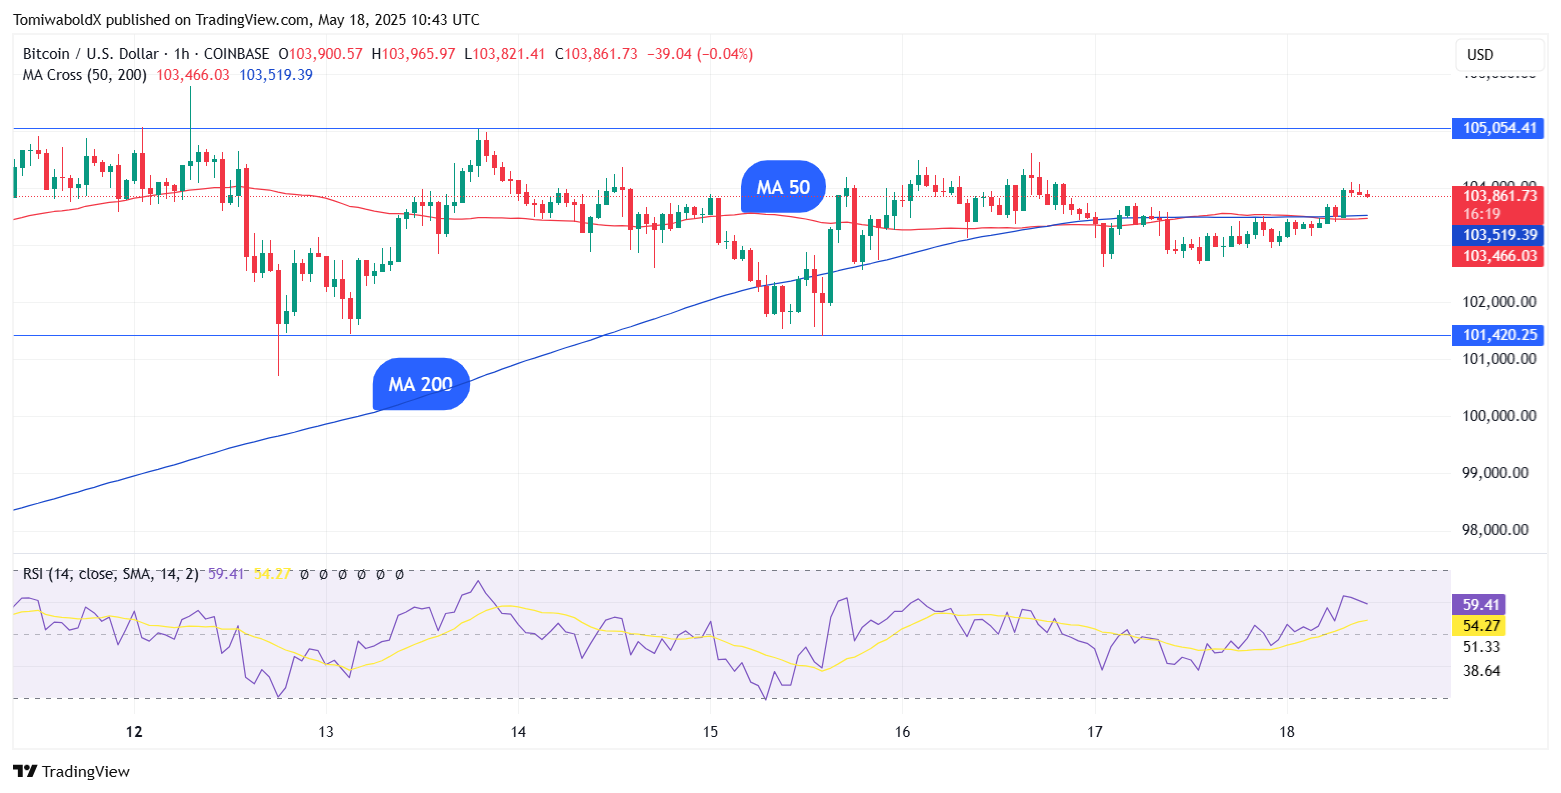
BTC/USD Hourly Chart, Courtesy: TradingView
At the time of writing, BTC was up 0.94% in the last 24 hours to $103,850, as the broader crypto market recovered slightly following yesterday's drop.
HOT Stories 'Rich Dad Poor Dad' Author Drops Bold Bitcoin Prediction, Urges Buying BTC Now Major Exchange Excites XRP Community With Cryptic Ripple Post DOGE Founder Warns This Asset's Bubble May Lead to Global Economy Destruction: Details 25,740,000,000,000 SHIB Stuck as Market Downturn Hits Shiba Inu
Bitcoin price continues to consolidate within a relatively tight range between $100,703 and $105,787. The sideways movement shows that the market is still uncertain, with bulls and bears in a deadlock.
You Might Also Like

Sat, 05/17/2025 - 15:05 Bitcoin to $120,000? Here's What Must Happen First, per Analyst ByTomiwabold Olajide
While death crosses typically hint at potential downside, especially on higher time frames, the hourly version often signals short-term weakness rather than a significant trend shift. Traders will now look for a confirmed break above or below the current range to determine BTC’s next move.
What's next for BTC price?
Bitcoin has been oscillating in a range for the last few days (since May 9), suggesting a balance between supply and demand. The BTC price has remained above the psychologically important $100,000 barrier, indicating that the bulls are holding onto their positions as they anticipate another move higher.
You Might Also Like

Sun, 05/18/2025 - 10:04 Bitcoin Likely Never Falling Below $47,000, Here's Why ByAlex Dovbnya
A break above $105,787 may reignite bullish momentum. If this happens, Bitcoin may target $120,000, as some analysts forecast.
However, continuous inability to push the price over the all-time high of $109,114 may entice short-term purchasers to book profits. That puts the $100,000 support at risk of failing. A dip below the present support area of $100,703 may pave the way for a deeper correction.
免责声明:本文章仅代表作者个人观点,不代表本平台的立场和观点。本文章仅供信息分享,不构成对任何人的任何投资建议。用户与作者之间的任何争议,与本平台无关。如网页中刊载的文章或图片涉及侵权,请提供相关的权利证明和身份证明发送邮件到support@aicoin.com,本平台相关工作人员将会进行核查。


