The information, opinions, and judgments regarding the market, projects, cryptocurrencies, etc., mentioned in this report are for reference only and do not constitute any investment advice.
Author: 0xWeilan
In the March report, we indicated that "the reverse is the movement of the Dao" and pointed out that "the panic and sell-off have been released to the maximum extent," forecasting that "Q2 will welcome a reversal market." Ultimately, in April, BTC experienced a strong rebound, rising 14.11% in a single month, recovering all losses since the "tariff war."
The "reciprocal tariff war," which dominates the trends in global financial markets, officially began in April, creating a severe impact on the market, with panic sentiment soaring and asset prices significantly adjusted downward. However, after the emotional release, accompanied by Trump's "softening" stance and the release of relatively resilient U.S. economic and employment data, funds rushed into the U.S. stock and crypto markets.
BTC adjusted ahead of the U.S. stock market, and after the U.S. stock market completed its bottoming out, it surged under the drive of billions in buying funds. More importantly, after more than two months of adjustment, the chip structure has greatly improved, and the internal state has become more stable.
The S&P 500 and the crypto market have fully recovered all losses since the "reciprocal tariff war." With the "tariff war" still ongoing and uncertainty about whether the U.S. economy will enter a recession, the market trend remains very strong, continuously pricing in various new information. However, for the market to achieve a reversal, the "tariff war" must enter its third phase (reaching an agreement) and confirmation of U.S. economic data is needed. In the meantime, there are likely to be many twists and turns.
Macroeconomic Finance: Expectations of the "Reciprocal Tariff War" Trigger Severe Market Revisions
In the March report, we mentioned that "a new trading judgment framework was initially established at the end of February, and throughout March, the output of this judgment framework was based on the continuously released various economic, employment, and interest rate data." In April, this continued to evolve, with Trump's statements and actions regarding the "reciprocal tariff war" playing a major role. Coupled with relatively strong economic and employment data released in April, traders weakened their concerns about "economic recession," and ultimately, after the monthly revision market came to a close, forward-looking trades betting that the tariff war would not lead to an economic recession dominated market trends. The Nasdaq and BTC, which fell first and then rose, both recorded positive monthly returns.
On April 2, Trump declared a national emergency and initiated reciprocal tariffs; on April 3, a 10% tariff was imposed on global goods, and a 104% tariff on Chinese goods. Secretary of Commerce Wilbur Ross and Treasury Secretary Steven Mnuchin emphasized cooperation with allies to counter China.
From April 3 to 5, U.S. stocks experienced a panic sell-off, with all three major indices falling below their annual lines, and the S&P 500 dropping to January 2024 levels. Overvalued stocks like Tesla and Nvidia were halved. Both long-term and short-term U.S. Treasury bonds fell sharply, as traders sold stocks to seek refuge in the bond market and European stocks. Over the weekend, large-scale protests erupted across the U.S.
On Monday, April 7, the S&P 500 VIX index broke through 60. The market sell-off entered its second phase, with U.S. Treasuries being heavily sold off. On the 9th, tariffs were officially implemented, with the 2-year Treasury yield rising above 4%, and on the 11th, the 10-year Treasury yield approached 4.6%. By the 21st, the sell-off spread to the foreign exchange market, with the dollar index falling to 97.911, surpassing last year's low during the Carry Trade collapse. The Nasdaq fell into a technical bear market.
Trump's unexpected "reciprocal tariffs," indifference to the decline in financial markets, and the Chinese government's strong counterattack led to a brutal "triple kill" scenario in U.S. stocks, bonds, and currencies. This situation triggered greater panic in the market, with criticism and protests from businesses and the financial sector boiling over, undermining fundamental market confidence, forcing Trump to make concessions.
First, he suspended tariffs on all countries except China for 90 days to ease tensions with allies and gain more negotiation time. On April 23, reports emerged that the Trump administration might significantly reduce the 104% high tariffs on Chinese goods, even by more than half, to ease tensions with China. During this period, Trump emphasized that he had been in contact with the Chinese government, but the Chinese government denied this.
Gold emerged as the only winner, experiencing a strong rally starting on the 9th, rising from $2970/ounce to a peak of $3499.93 (on April 22). However, after the 23rd, following news that Trump was considering cutting high tariffs on Chinese goods, it entered a sustained adjustment, dropping to $3288.54/ounce by the end of the month. Nevertheless, it still recorded a significant monthly increase of 5.08%.
U.S. stocks temporarily rebounded strongly after hitting bottom on April 4, and the rebound continued after Trump's "softening" on the 23rd, with the Nasdaq and S&P 500 fully recovering the declines caused by the tariff war by the time this report was completed (May 2).
For the month, the Nasdaq rose 0.85%, the S&P 500 fell 0.76%, the Dow Jones fell 3.17%, and BTC surged 14.11%.
During this process, although the market once bet that the Federal Reserve would initiate a temporary rate cut, with expectations of a rate cut in May exceeding 80%, the Federal Reserve maintained a tough stance, only reiterating during the "triple kill" of stocks, bonds, and currencies that it would intervene in the market if unexpected conditions arose in the labor market, releasing some "dovish" signals.
On April 10, the U.S. Bureau of Labor Statistics released data showing that, thanks to falling energy prices, the March CPI (Consumer Price Index) fell by 0.1% month-on-month (seasonally adjusted), marking the first monthly decline in nearly five years, below the market expectation of a 0.1% increase. The annualized CPI growth rate dropped from 2.8% in February to 2.4% (not seasonally adjusted). The core CPI (excluding food and energy) rose by 0.1% month-on-month (below the expected 0.2%), with an annualized growth of 2.8%, the lowest since March 2021.
On April 30, the U.S. Bureau of Economic Analysis released the preliminary estimate for the first quarter, showing a 0.3% annualized quarterly decline in real GDP, the lowest level since the second quarter of 2022, far below the 2.4% growth rate expected for the fourth quarter of 2024, and also lower than the market expectation of 0.4% (Dow Jones consensus forecast) or 0.3% (median from Wall Street Journal's April 12 survey).
On May 2, the Bureau of Labor Statistics (BLS) released the April non-farm payroll report, showing an increase of 177,000 non-farm jobs, higher than the Dow Jones expectation of 133,000, but lower than the revised 185,000 for March (with February and March data revised down by 58,000). The average monthly increase over the past six months was 193,000 jobs, indicating that the labor market remains resilient. The unemployment rate in April held steady at 4.187% (compared to 4.152% in March), meeting expectations, and the labor force participation rate slightly increased, indicating a relatively robust market. Average hourly earnings rose by 0.2% month-on-month (below the expected 0.3%), with an annualized growth of 3.8% (below the expected 3.9%), indicating moderate wage pressure.
Inflation data showed signs of cooling, while employment data remained strong. This temporarily alleviated market concerns about an economic recession, and coupled with Trump's "softening," although the tariff war is still in the second phase ("negotiation"), funds from retail investors and active funds initiated forward-looking trades, significantly buying in and driving a strong rebound in U.S. stocks.
EMC Labs believes that the panic triggered by the tariff war in the short to medium term has been relatively fully released, and GDP data indicates that at least for now, the U.S. economy has not suffered significant damage. Additionally, Trump's team seems to be returning from "out of control" to "rational," which is why forward-looking funds are willing to buy in large quantities. We tend to view the adjustments from February to April as a severe correction of overvalued U.S. stocks that had risen for two consecutive years under the impact of the "tariff war," a technical test of the bear market, but there is still no sufficient data to indicate that the U.S. economy will enter a recession. Currently, U.S. stock valuations have seen some downward adjustment, but they are not cheap either, and market pricing has been relatively sufficient. If the market continues to rise, more supporting conditions are needed, such as further easing of the "tariff war" and a further decline in CPI. The outlook for interest rate cuts is not optimistic, as CME FedWatch shows that market expectations for rate cuts have been pushed back to July. After a significant rebound, we tend to hold a neutral judgment, closely monitoring the progress of the tariff war and economic data. If signs of economic deterioration appear, further downward adjustments may occur.
Crypto Assets: Solid Chip Structure + Long-Term
After a crash at the beginning of the month, there was a significant rebound by the end of the month. April's BTC performance is a model of "reverse trading," buying in fear and waiting for asset prices to rebound rapidly as the situation calms down.
BTC opened at $82,534.31 in April, fell to a low of $74,420.69, and closed at $94,182.54, rising 14.11% for the month, an increase of $11,648.22, with a monthly volatility of 26.12%.
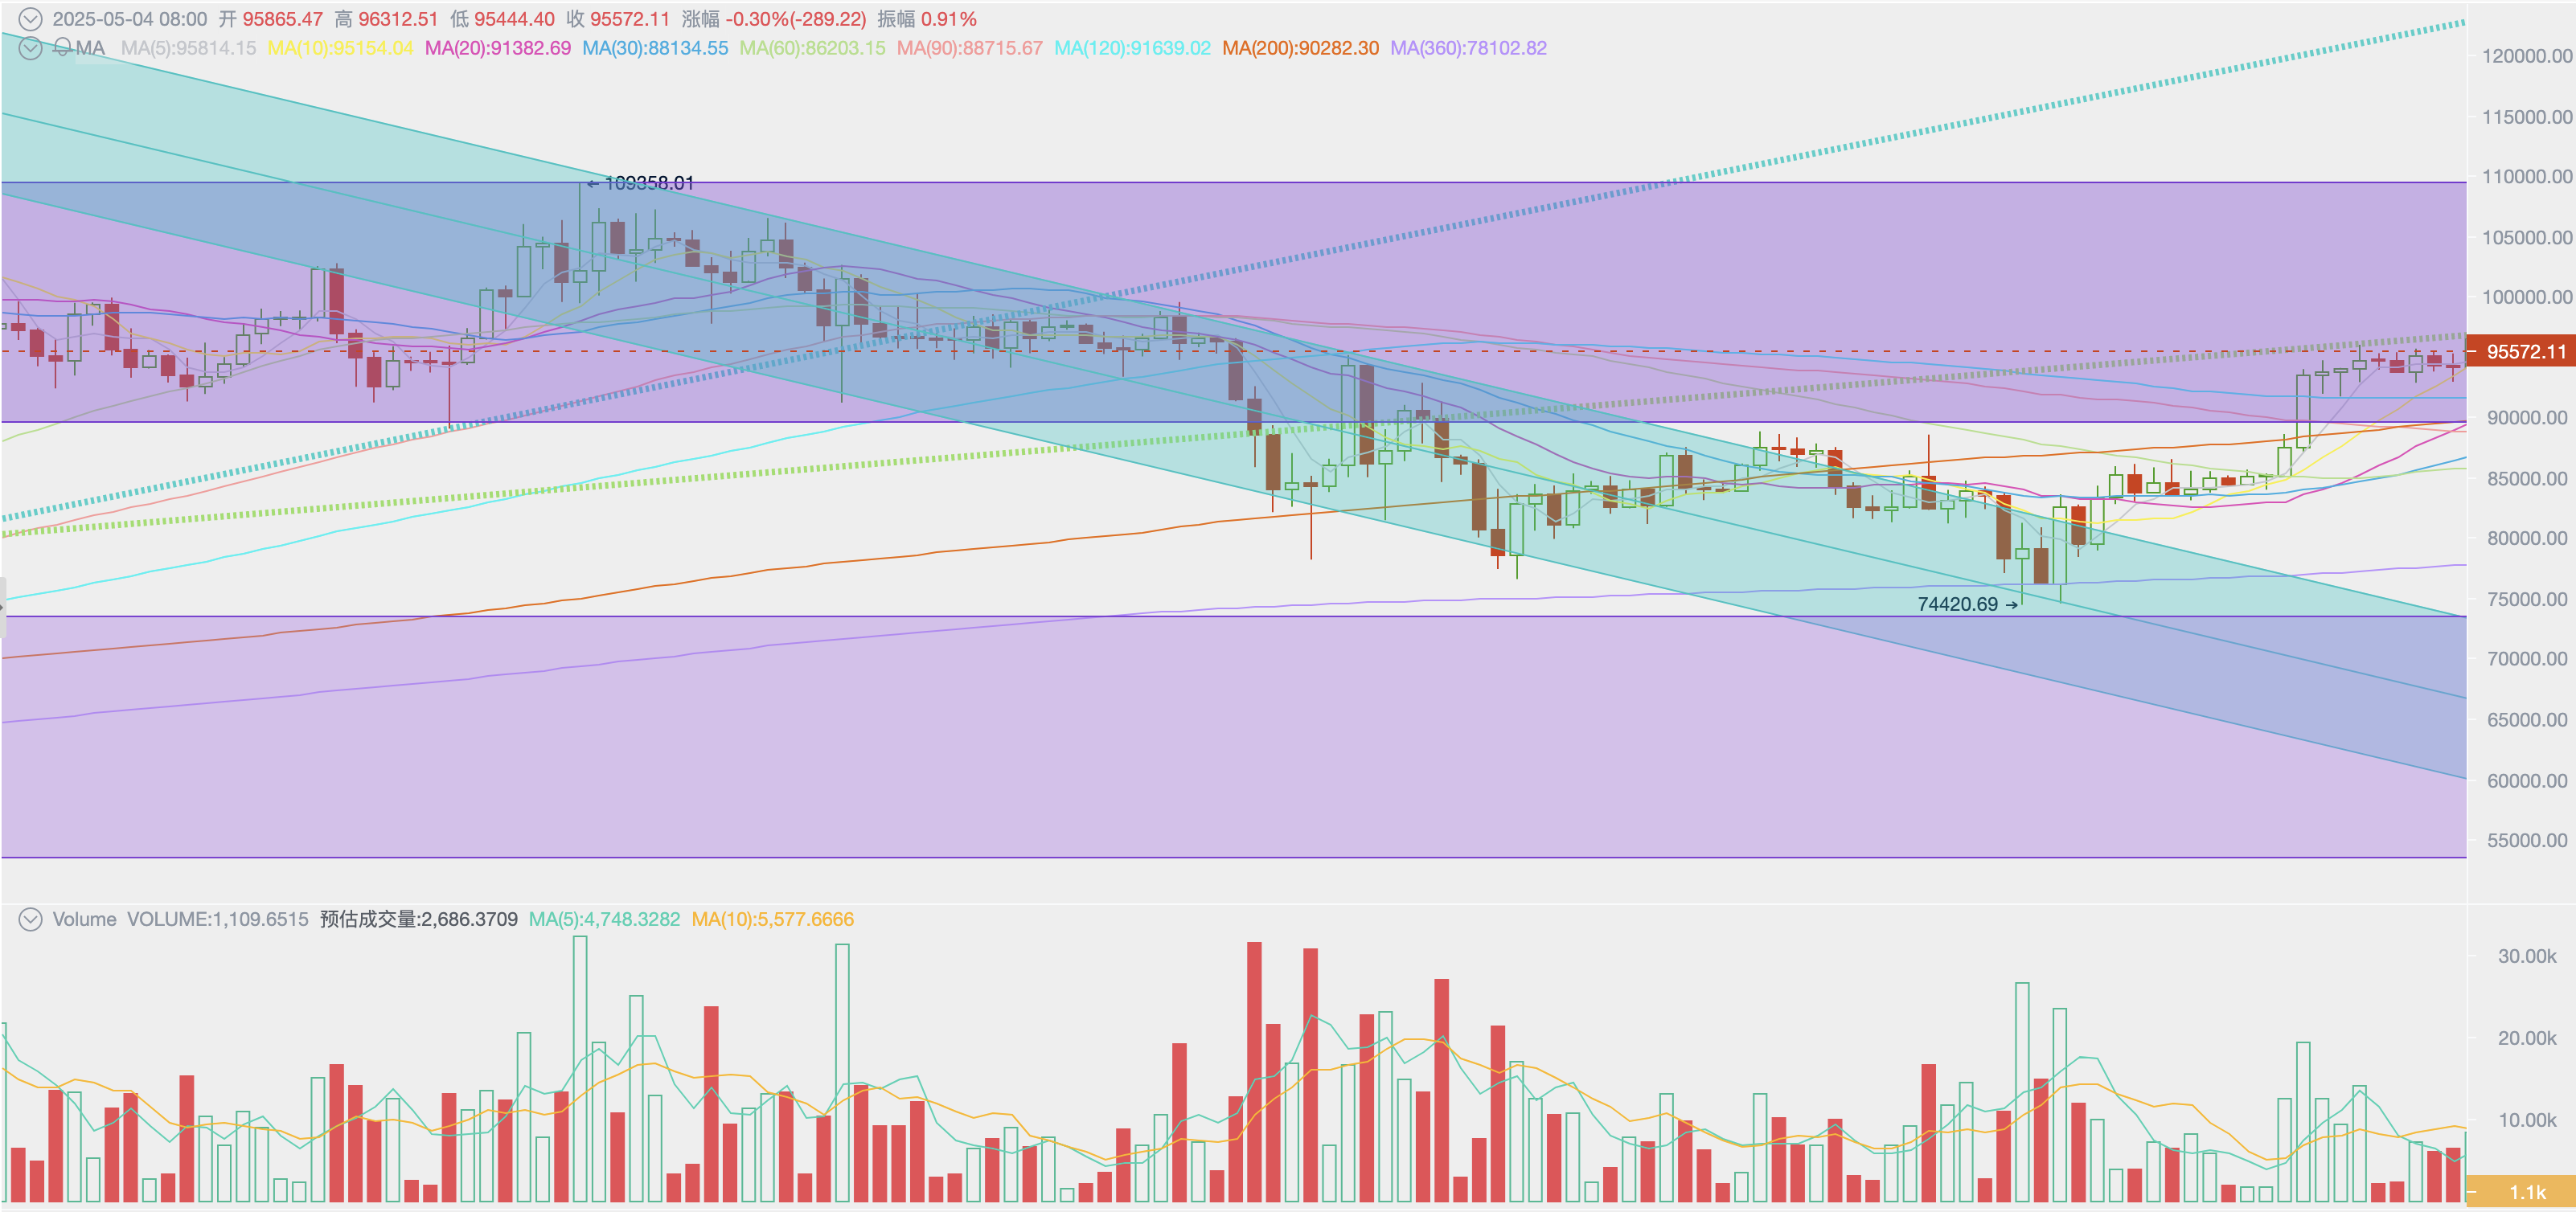
BTC daily price trend
The monthly trend showed a pattern of falling first and then rising, with the lowest point occurring on April 7, "Black Monday," and gradually rising after the official implementation of the "reciprocal tariffs." Calculating daily fluctuations, the number of rising days far exceeded the number of falling days over the 30 trading days.
Technically, BTC confirmed its long-term trend by testing the annual line three times during the sharp decline linked to U.S. stocks, and on April 22, it surged 6.82%, breaking through the 200-day line, returning to the "Trump bottom" (the box structure formed after Trump's victory) and approaching the "first upward trend line" of this bull market (green dotted line in the above image).
Compared to U.S. stocks, BTC's performance has been very strong, benefiting from price adjustments that began in March, increased holdings by long-term holders and large investors, and favorable support at the policy and use case levels.
Since Trump signed the executive order to establish a "strategic Bitcoin reserve" in March, several U.S. states have continued to advance their own "Bitcoin reserve bills." On April 30, the Arizona House of Representatives passed two Bitcoin reserve bills, which are currently awaiting the governor's signature. If the bills take effect, Arizona will become the first state in the U.S. to allow state finances to hold Bitcoin. Once the Arizona bill is officially enacted, it is believed that the pace of advancement in other states will also accelerate.
The expansion of BTC's use cases and price increases are in a mutually reinforcing feedback loop. The turmoil and revisions in the global financial markets triggered by Trump's tariff war in March and April temporarily interrupted this process. However, the internal holding structure of the crypto market and market movements remain intact and stable. Once panic sentiment dissipates, BTC will regain its upward momentum. In the future, with potential turmoil from the tariff war and macro finance, BTC prices may still experience fluctuations, and breaking through previous highs will depend on the resolution of the tariff war and whether the U.S. economy falls into recession.
Chip Structure: Long Hands, Sharks Increasing Holdings, Long-Term Buyers Sweeping Up
On October 4, 2024, as funds surged into the market, long hands initiated the second wave of selling in this cycle. The strong inflow of funds absorbed the selling pressure and continued to push prices close to $110,000.
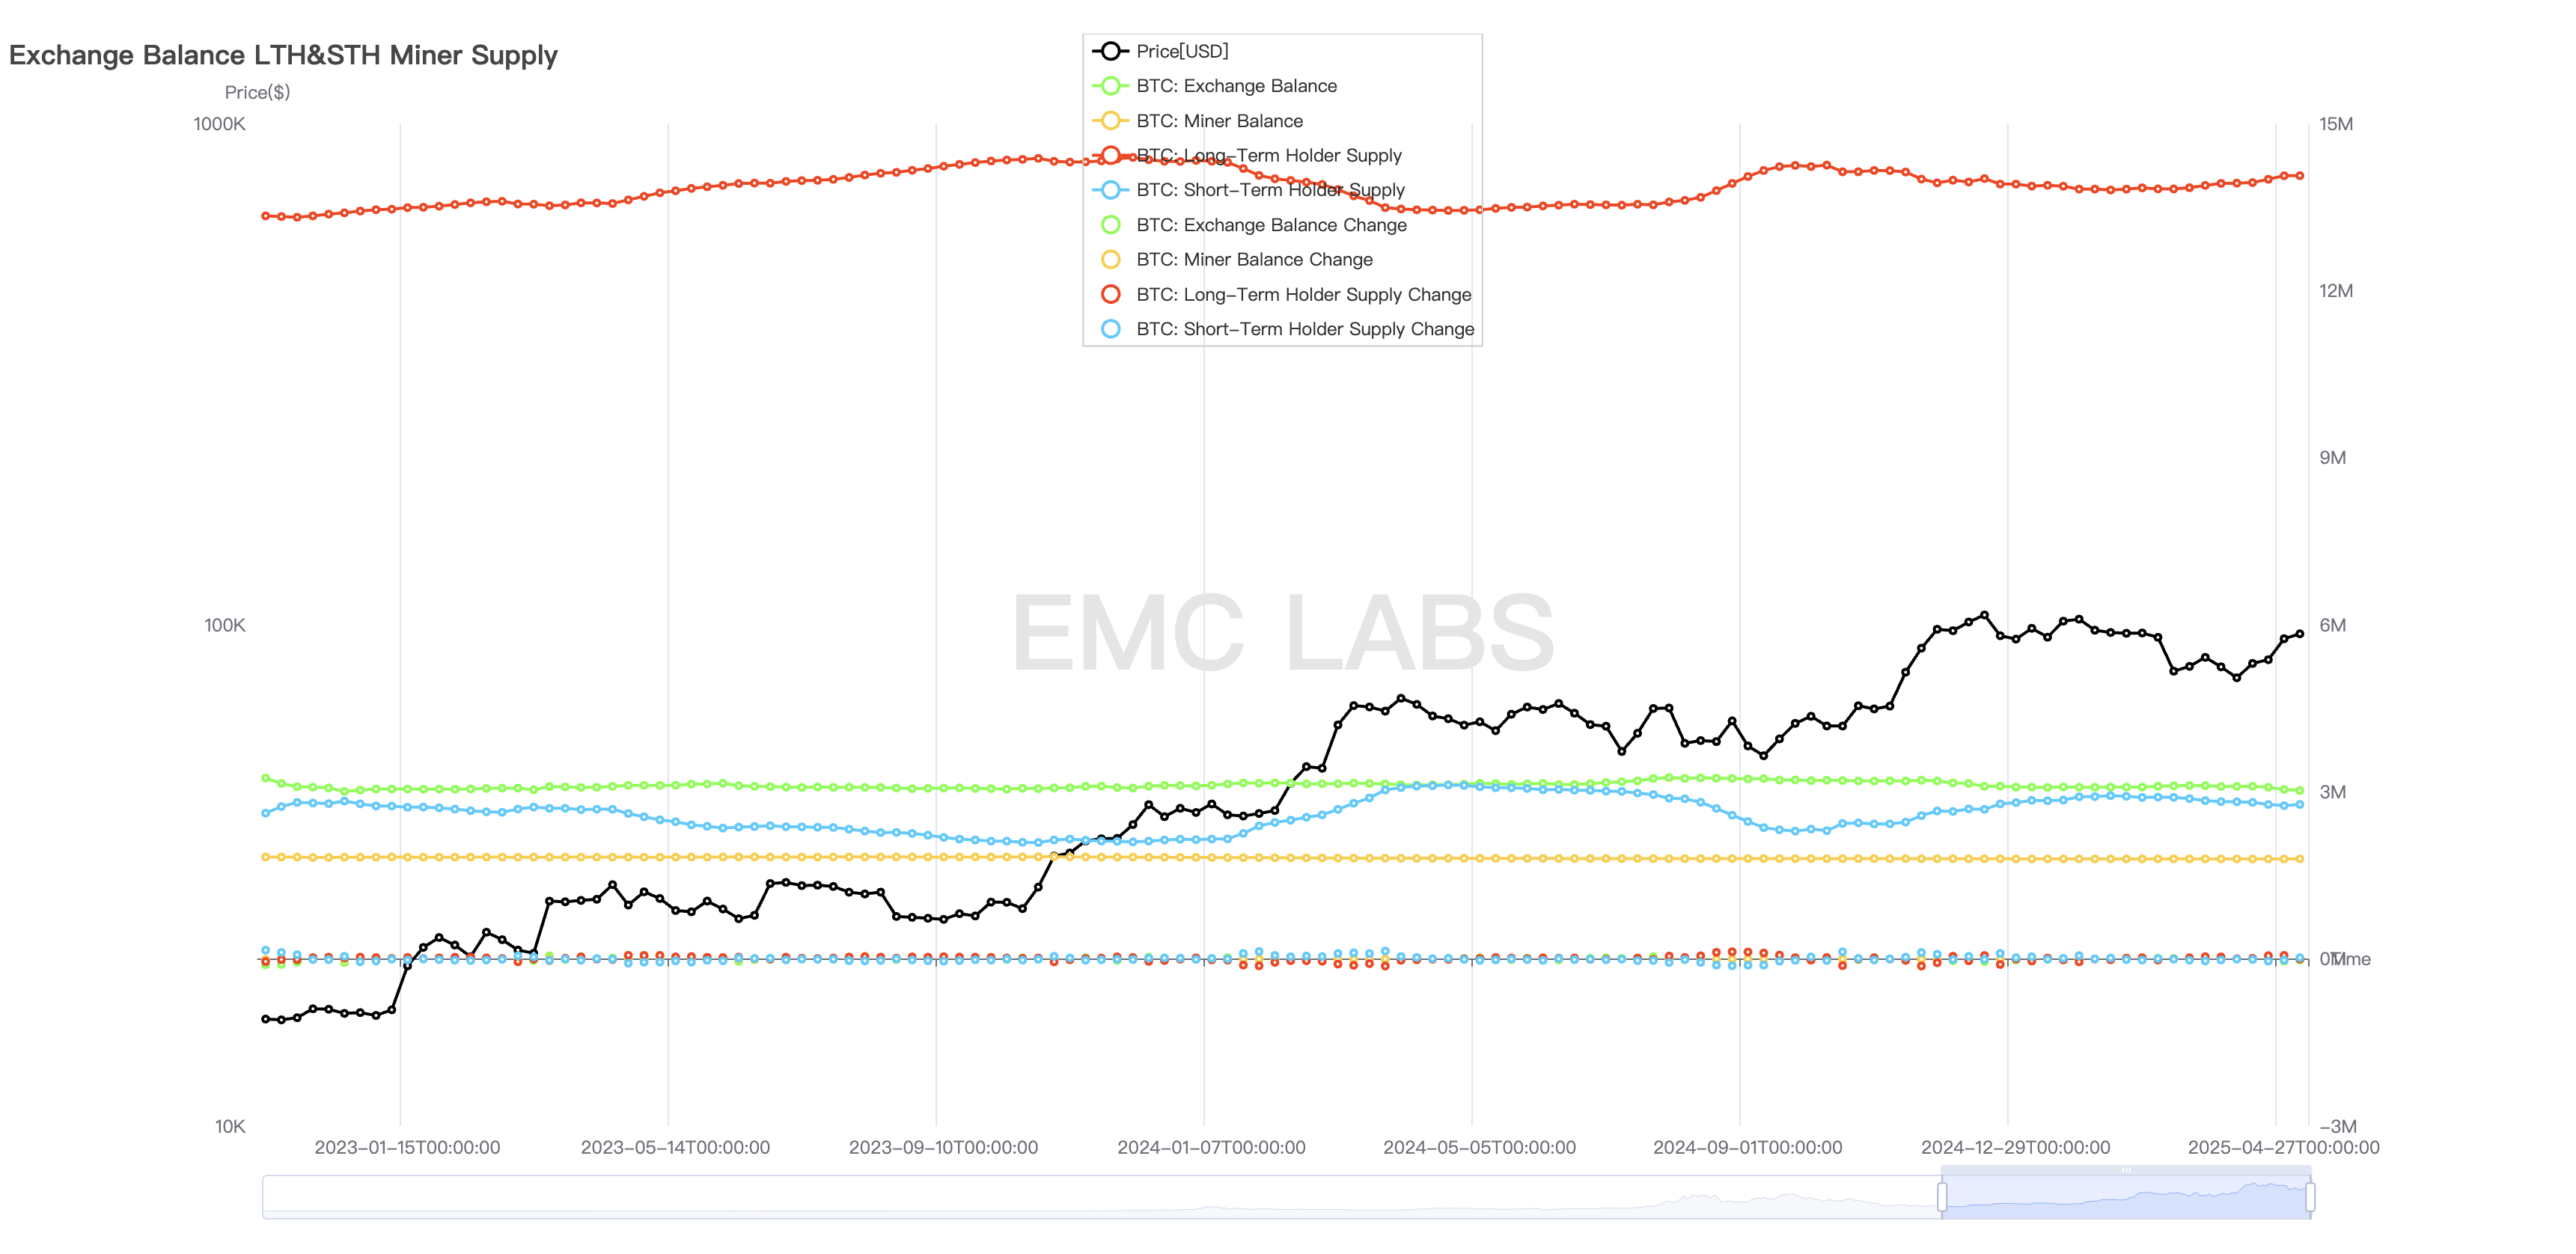
Long hands, short hands, and the scale of BTC held by exchanges
After entering March, with the loss of liquidity, BTC prices fell sharply. Subsequently, long hands once again played the role of "stabilizer," shifting from selling to increasing holdings.
Additionally, one of the large holders with holdings between 100-1000 BTC, known as "sharks," also continued to increase their holdings during the decline and accelerated their buying in late April, adding over 80,000 BTC throughout the month, becoming a crucial force in reversing the trend. It is worth noting that this group was also the main buyer that drove BTC prices from $70,000 to the $100,000 range in October to December 2024. Based on the characteristic that this group’s buying scale far exceeds their selling scale in this cycle, it can be inferred that their behavior aligns with that of long-term investors, and their recognition of this price range helps stabilize prices.
After various buyers swept up, the BTC inventory on exchanges decreased by about 60,000 coins in April.
In late February, prices began to decline, and by the end of April, prices had returned to the levels seen in late February. Accompanied by market fluctuations, the chips were fully exchanged. Comparing the chip distribution on January 31 and April 30, it can be seen that the focus of chips in the $74,000 to $100,000 range has significantly shifted downward, with some chips priced above $100,000 moving down to the $74,000 to $94,000 range.
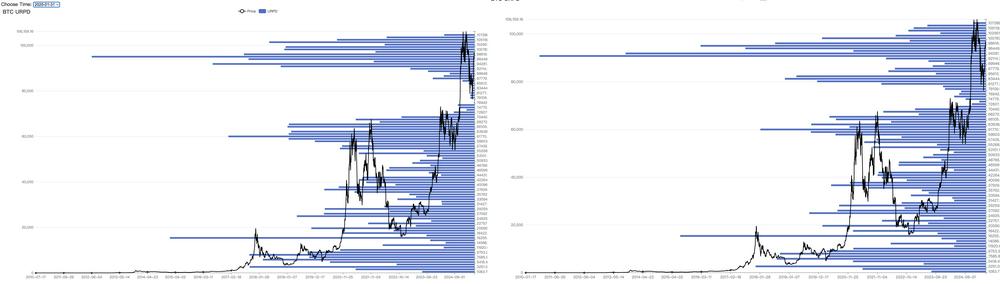
BTC Chip Distribution (January 31 vs April 30)
The market turbulence over the past two months, from the perspective of chip distribution, indicates that the FOMO (Fear of Missing Out) chips from new entrants were forced to sell during the sharp decline, while the previous shortage of chips in the $74,000 to $94,000 range has been replenished. According to eMerge Engine data, the current short positions have moved out of floating losses, while the BTC in floating loss across the entire chain has dropped to 14%. The market sell pressure triggered by panic and losses has greatly improved.
Funds: Rescuing the Market, Over $10 Billion in Buying
Divided by mid-month, under the pressure of the "tariff war" and macroeconomic panic, overall funds showed an outflow trend in the first half of the month. However, stablecoin funds have continued to flow in since April, and by mid-month, with Trump's "softening" and the stabilization and rebound of U.S. stocks, BTC Spot ETF channel funds also began to buy in, rapidly pushing BTC prices above $94,000.
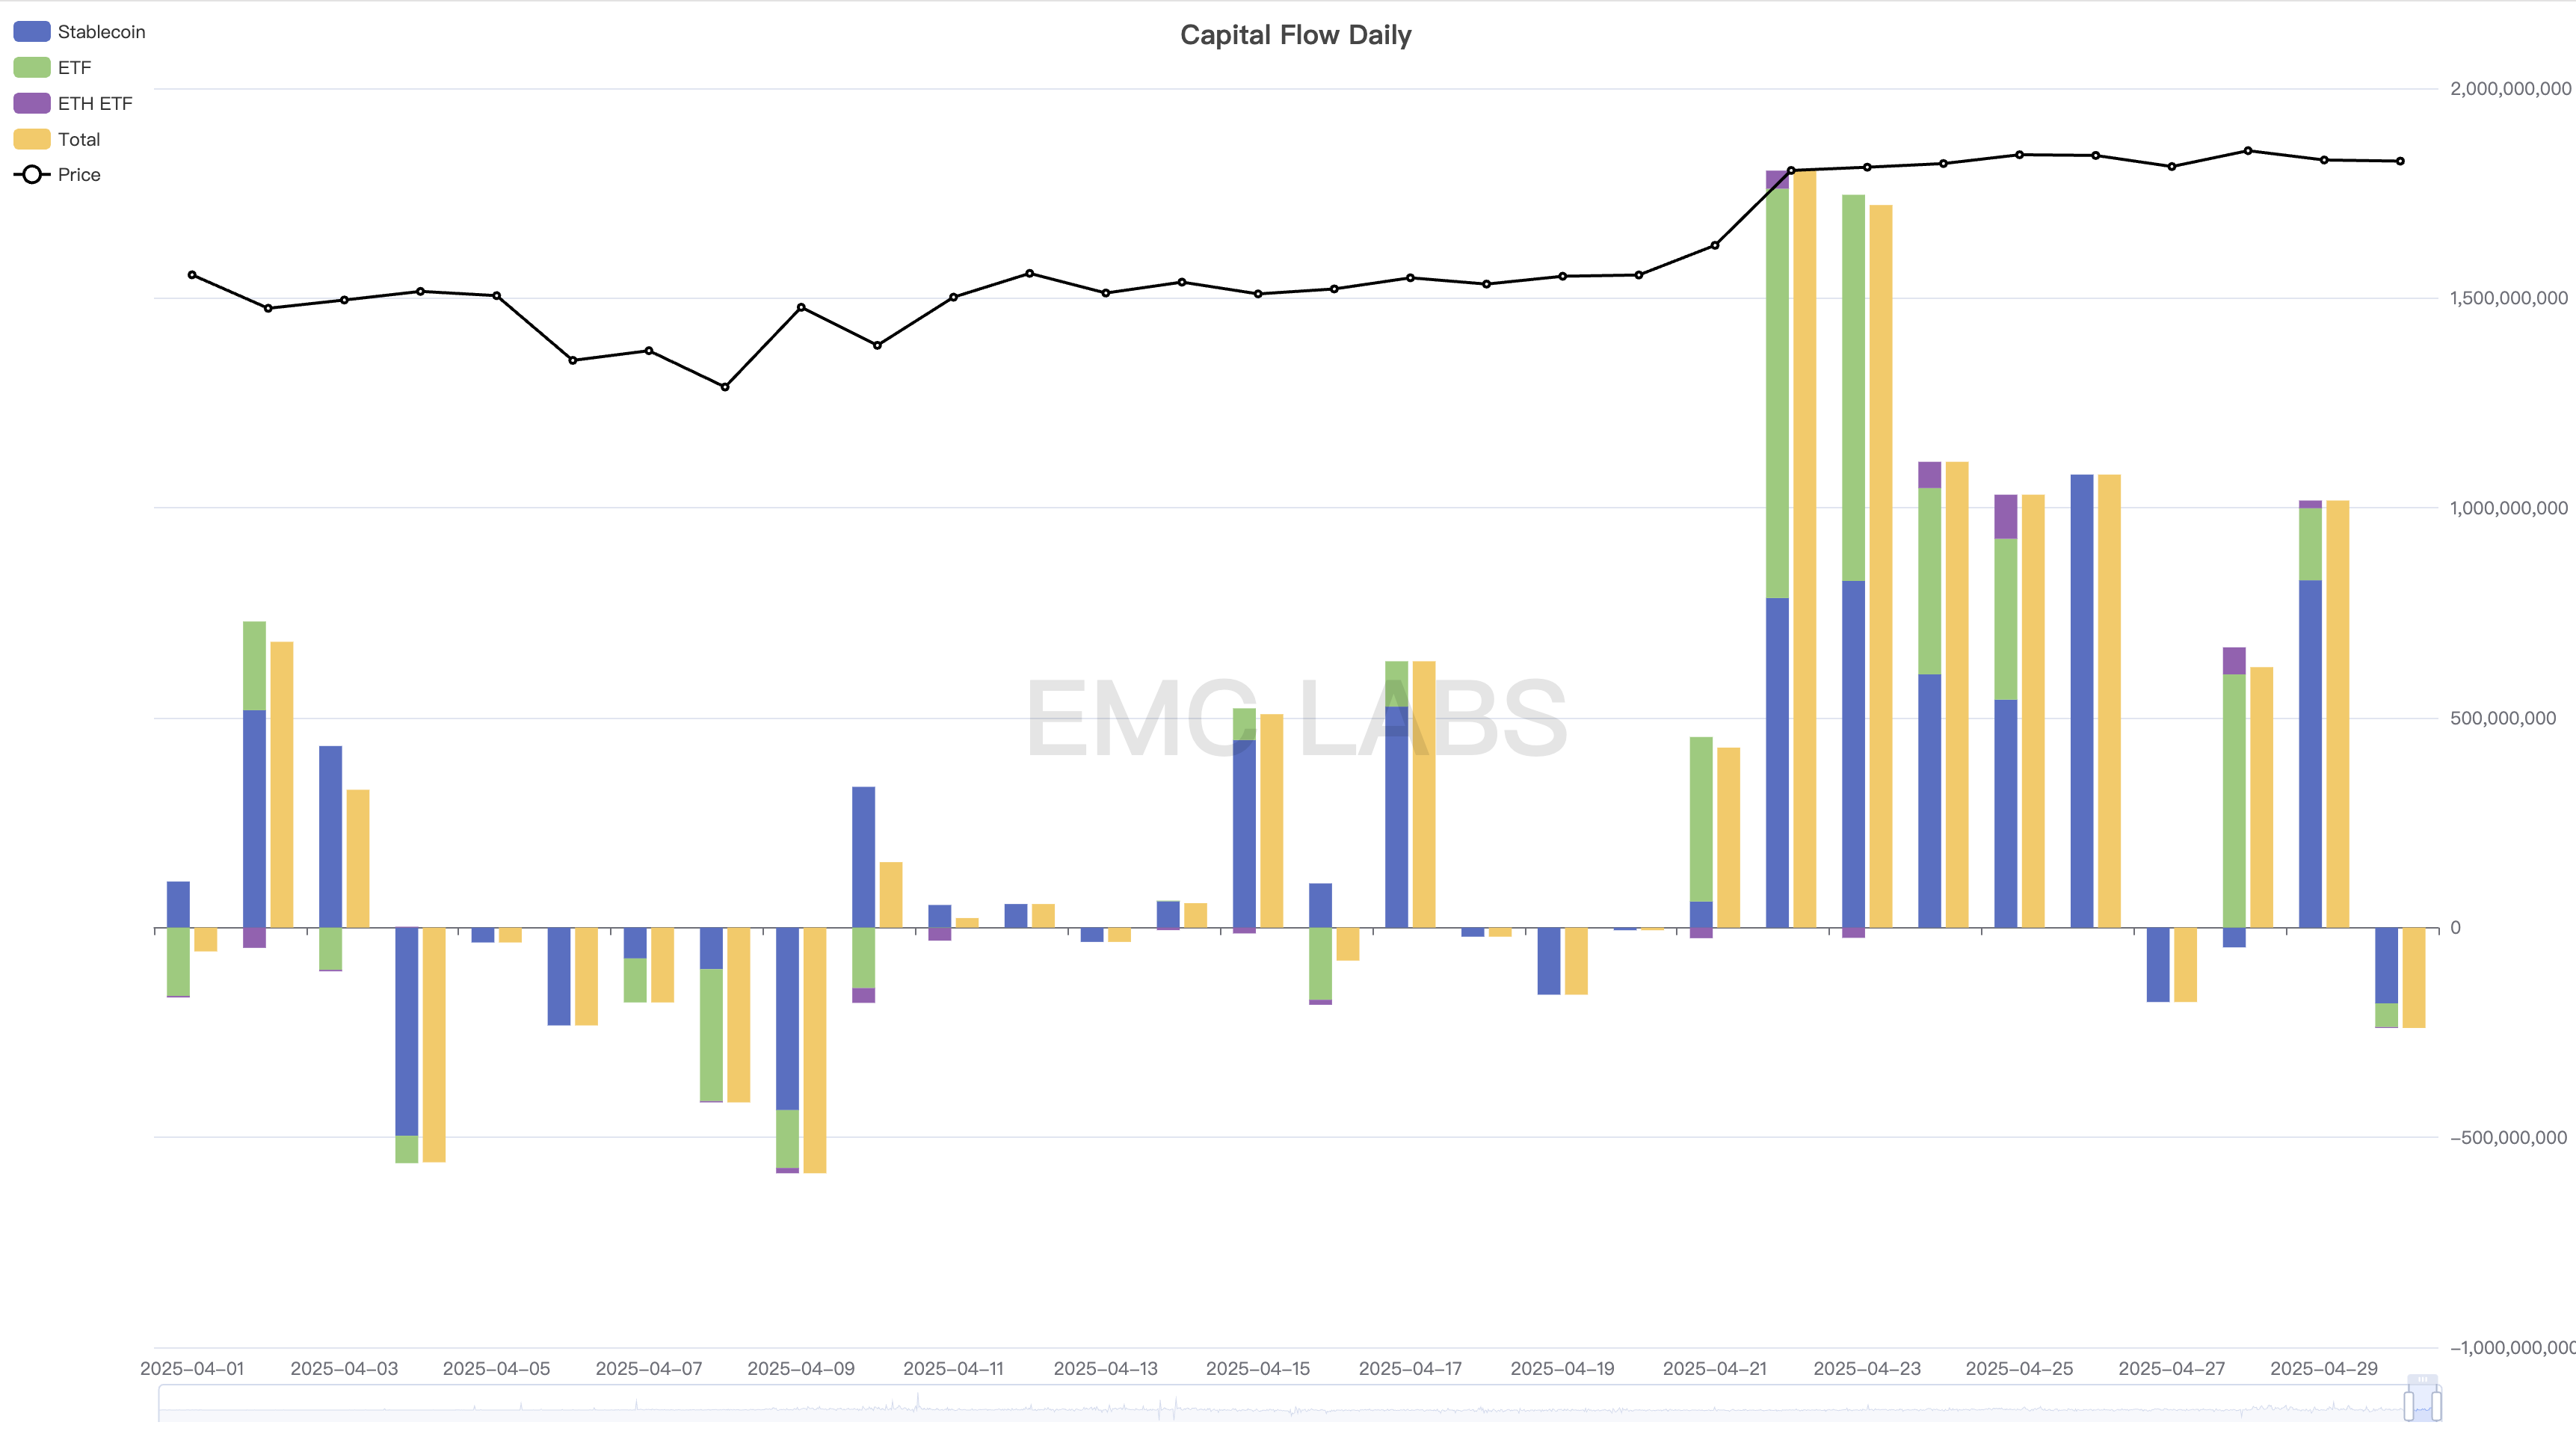
Cryptocurrency Market Fund Inflow and Outflow Statistics (Daily)
From a monthly perspective, the ETF channel funds that held short-term pricing power in February and March showed an outflow trend that pushed BTC prices downward, while the overall fund inflow in April reached $8.4 billion, making it the sixth largest inflow month of this cycle.
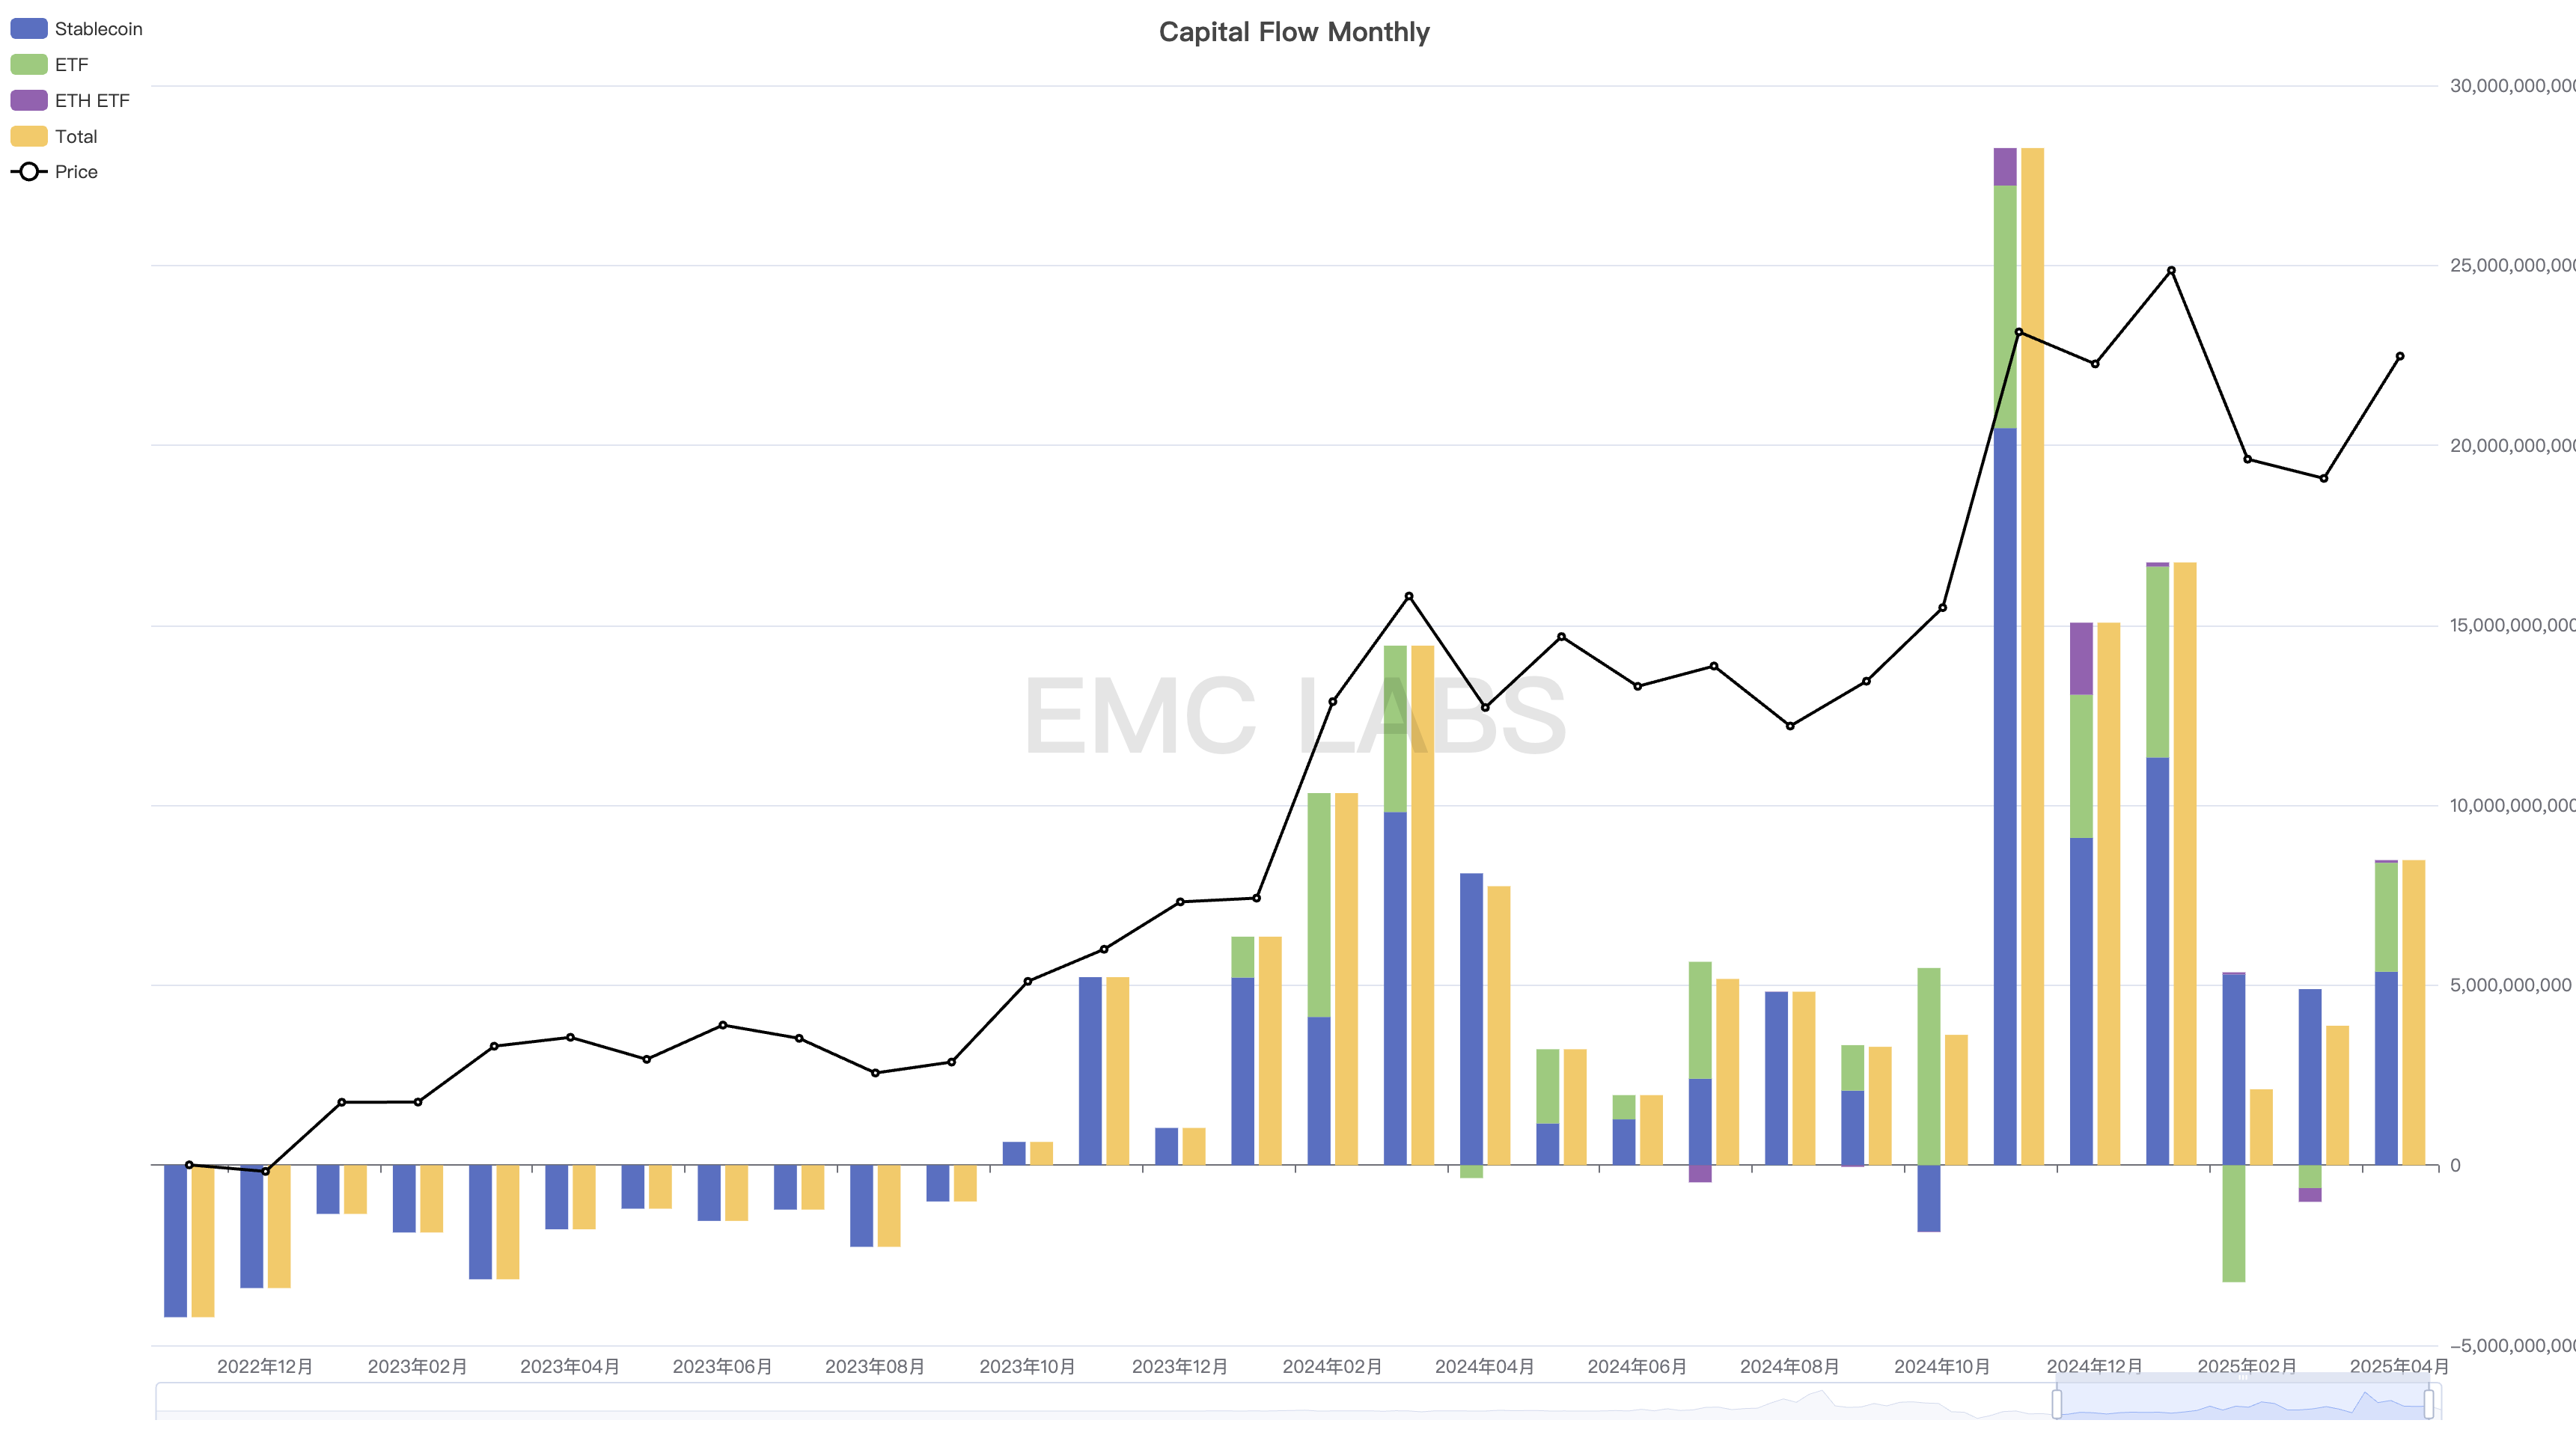
Cryptocurrency Market Fund Inflow and Outflow Statistics (Monthly)
The above statistics do not include the accumulation data from Strategy Company. According to their announcement, Strategy Company conducted three rounds of accumulation through fundraising in April, purchasing a total of 25,370 BTC, investing over $2.2 billion. Thus, the total inflow of funds into the market in April exceeded $10 billion.
The price trend of BTC reflects the inflow and outflow of funds in the market. Currently, the identifiable fund inflows can be categorized into three types: one is BTC Spot ETF channel funds, which often follow the fluctuations of U.S. stocks; the second is the fundraising from Strategy Company, which has shown good continuity; and the third is stablecoin channel funds, which are on-site funds. Since October 2023, there has only been one month of net outflow, while all other months have shown positive inflows (not all stablecoin funds flow into the cryptocurrency market).
Although the cryptocurrency market experienced significant volatility from February to April, technically entering a bear market at one point, based on a comprehensive analysis of funds and the trend of long hands accumulating chips, we believe the market cycle is still in an upward phase, i.e., a bull market. EMC Labs believes that after the adjustment, the chips have returned to long hands and large holders. This downward adjustment helps to strengthen the chip structure, and as the impact of the tariff war gradually fades, market trading enthusiasm will reignite, making it highly probable that BTC prices will break upward again.
Conclusion
In the March report, we pointed out that "after experiencing the storm of the first quarter, the outlook for the second quarter remains unclear, but the most painful moments may have passed. Once Washington and the Federal Reserve return to a rational game state, the market should be able to return to its own operating rules."
In April, the market performance initially proved this judgment, backed by Trump's "softening" and relatively strong U.S. economic data.
After several months of market adjustment and chip redistribution, the internal structure of the cryptocurrency market has become more stable, with long hands holding more chips, short hands eliminating floating loss pressure, and only 14% of Bitcoin in floating loss. This internal state provides solid support for market upward movement.
However, the external uncertainty, especially regarding the "reciprocal tariff war," is very high. Additionally, the potential for the "reciprocal tariff war" to trigger a U.S. economic recession and rising inflation could lead to another downward revision of U.S. stock valuations and further delays in Federal Reserve interest rate cuts. This point requires particular attention.
Market trends are the result of dynamic interactions among trading parties under changing conditions. We are confident about BTC's performance in the second half of the year and in the long term, but we must remain vigilant about the unpredictable damage that the "reciprocal tariff war" may inflict on funds, sentiment, and the global economy.
免责声明:本文章仅代表作者个人观点,不代表本平台的立场和观点。本文章仅供信息分享,不构成对任何人的任何投资建议。用户与作者之间的任何争议,与本平台无关。如网页中刊载的文章或图片涉及侵权,请提供相关的权利证明和身份证明发送邮件到support@aicoin.com,本平台相关工作人员将会进行核查。


