Original source: Maria X account
Author: Maria, Electric Capital
Translation: 1912212.eth, Foresight News
The sixth annual Electric Capital developer report has involved 829 contributors since its inception, analyzing a record 902 million code commits across 1.7 million code repositories.
How is the data performance of the crypto industry in 2024?
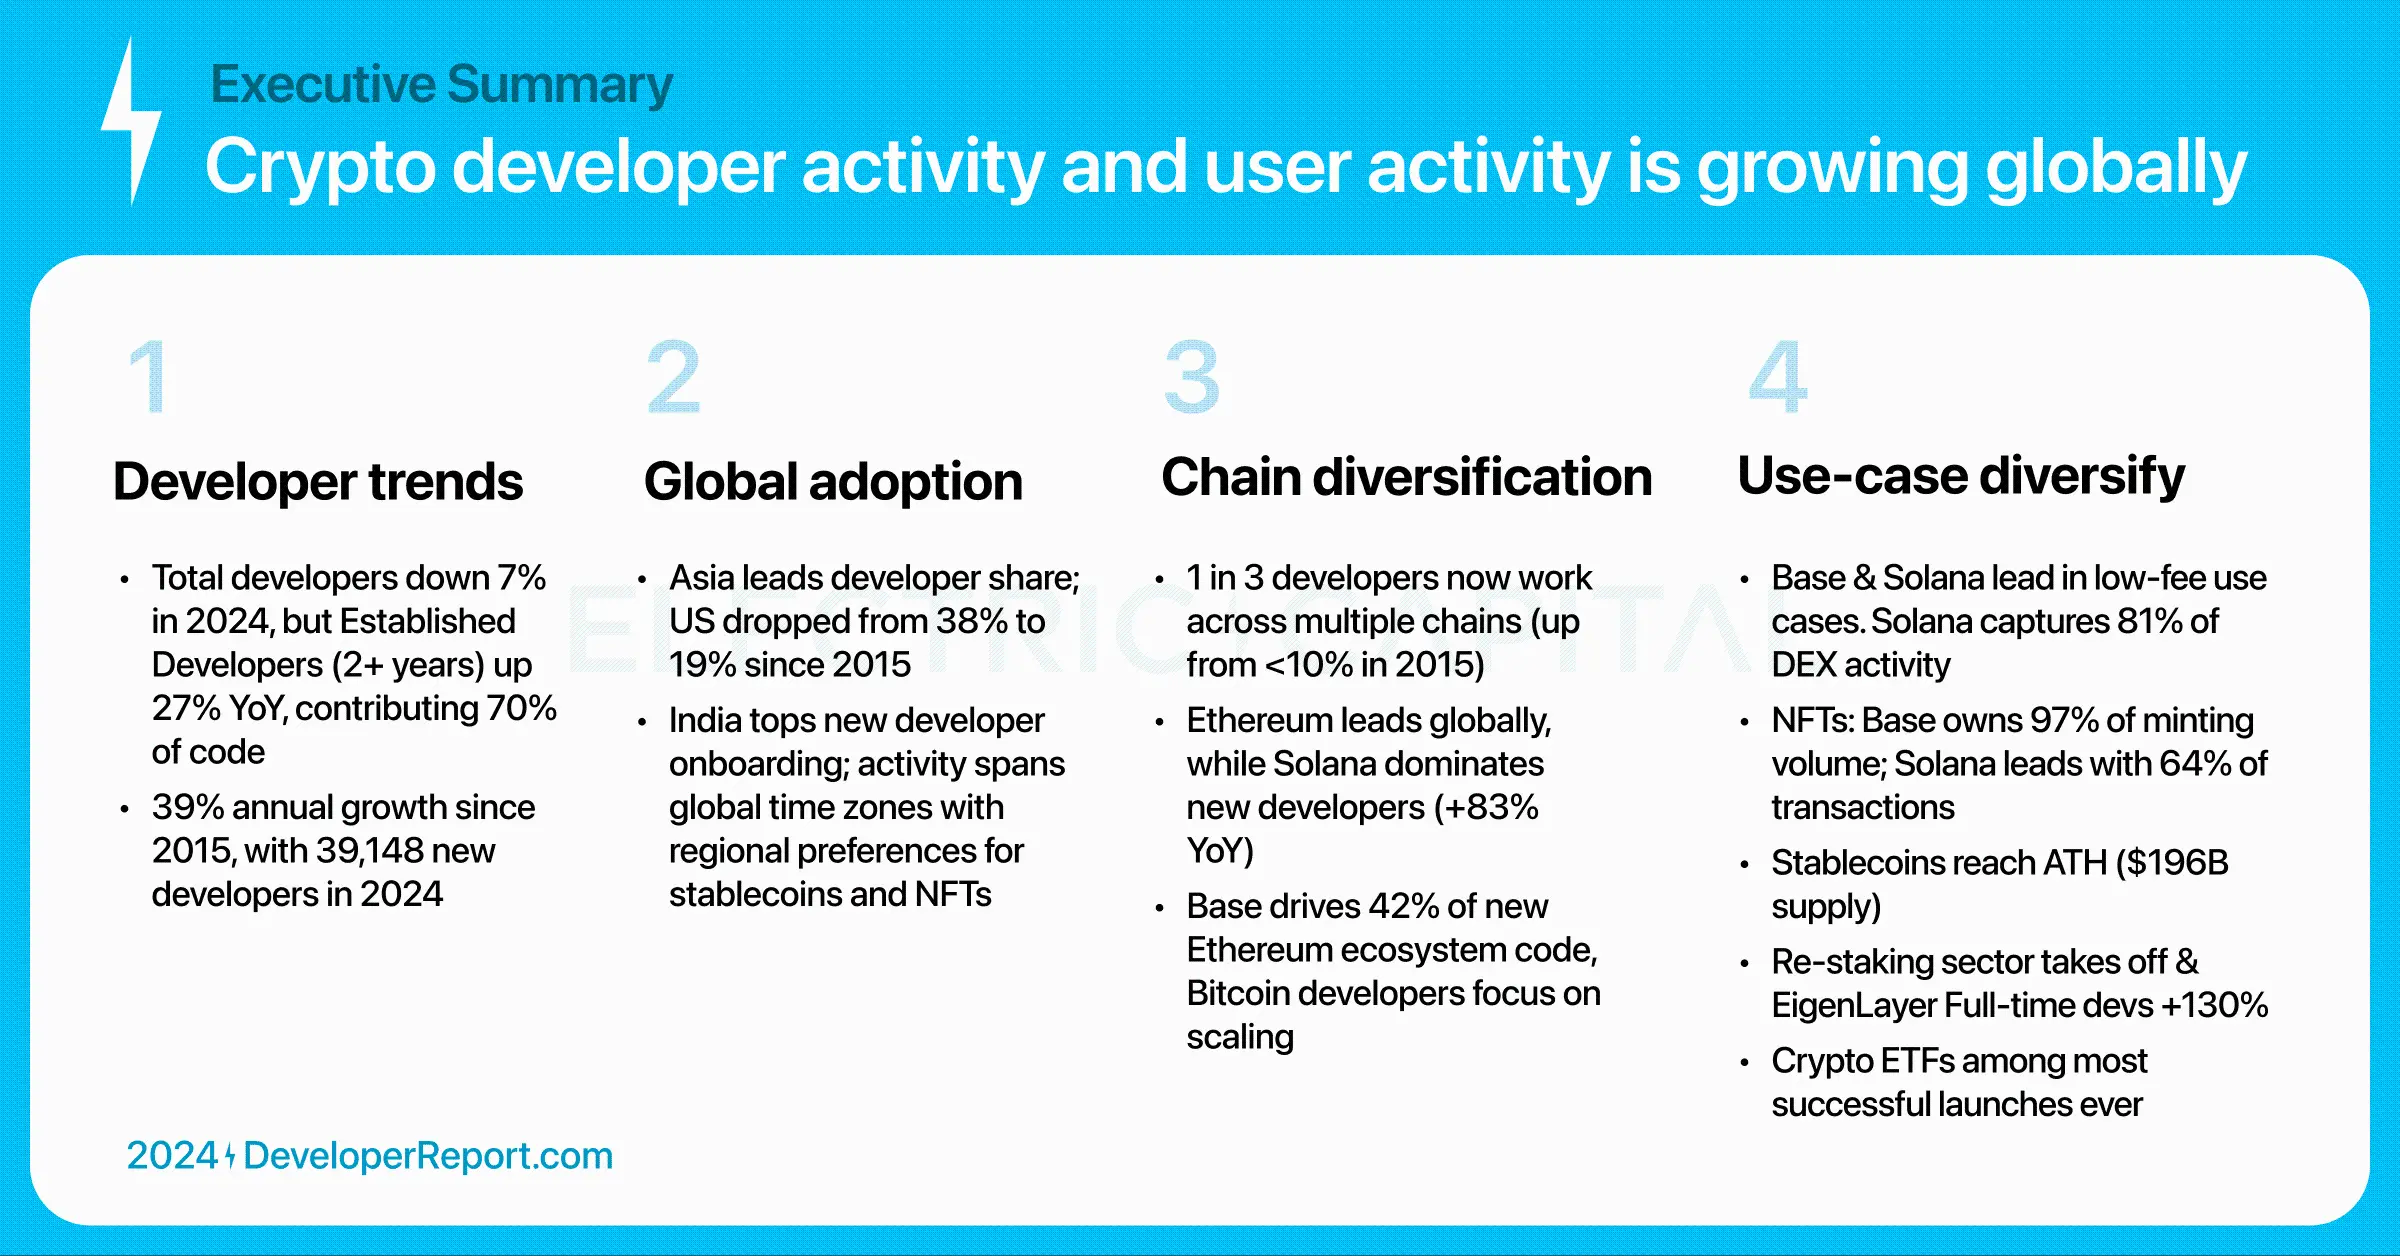
Key takeaways:
- The crypto industry is global, with developer momentum shifting from North America to other regions.
- Developers and use cases are diversifying across different ecosystems.
- Applications span all time zones, indicating widespread global adoption.
We have underestimated the number of developers in the crypto space because our statistics focus solely on open-source development activities.
Our methodology includes:
- Merging developer profiles into a single standardized identity.
- Identifying and excluding bot accounts.
- Removing code repositories that do not reflect development activity, such as data lists.
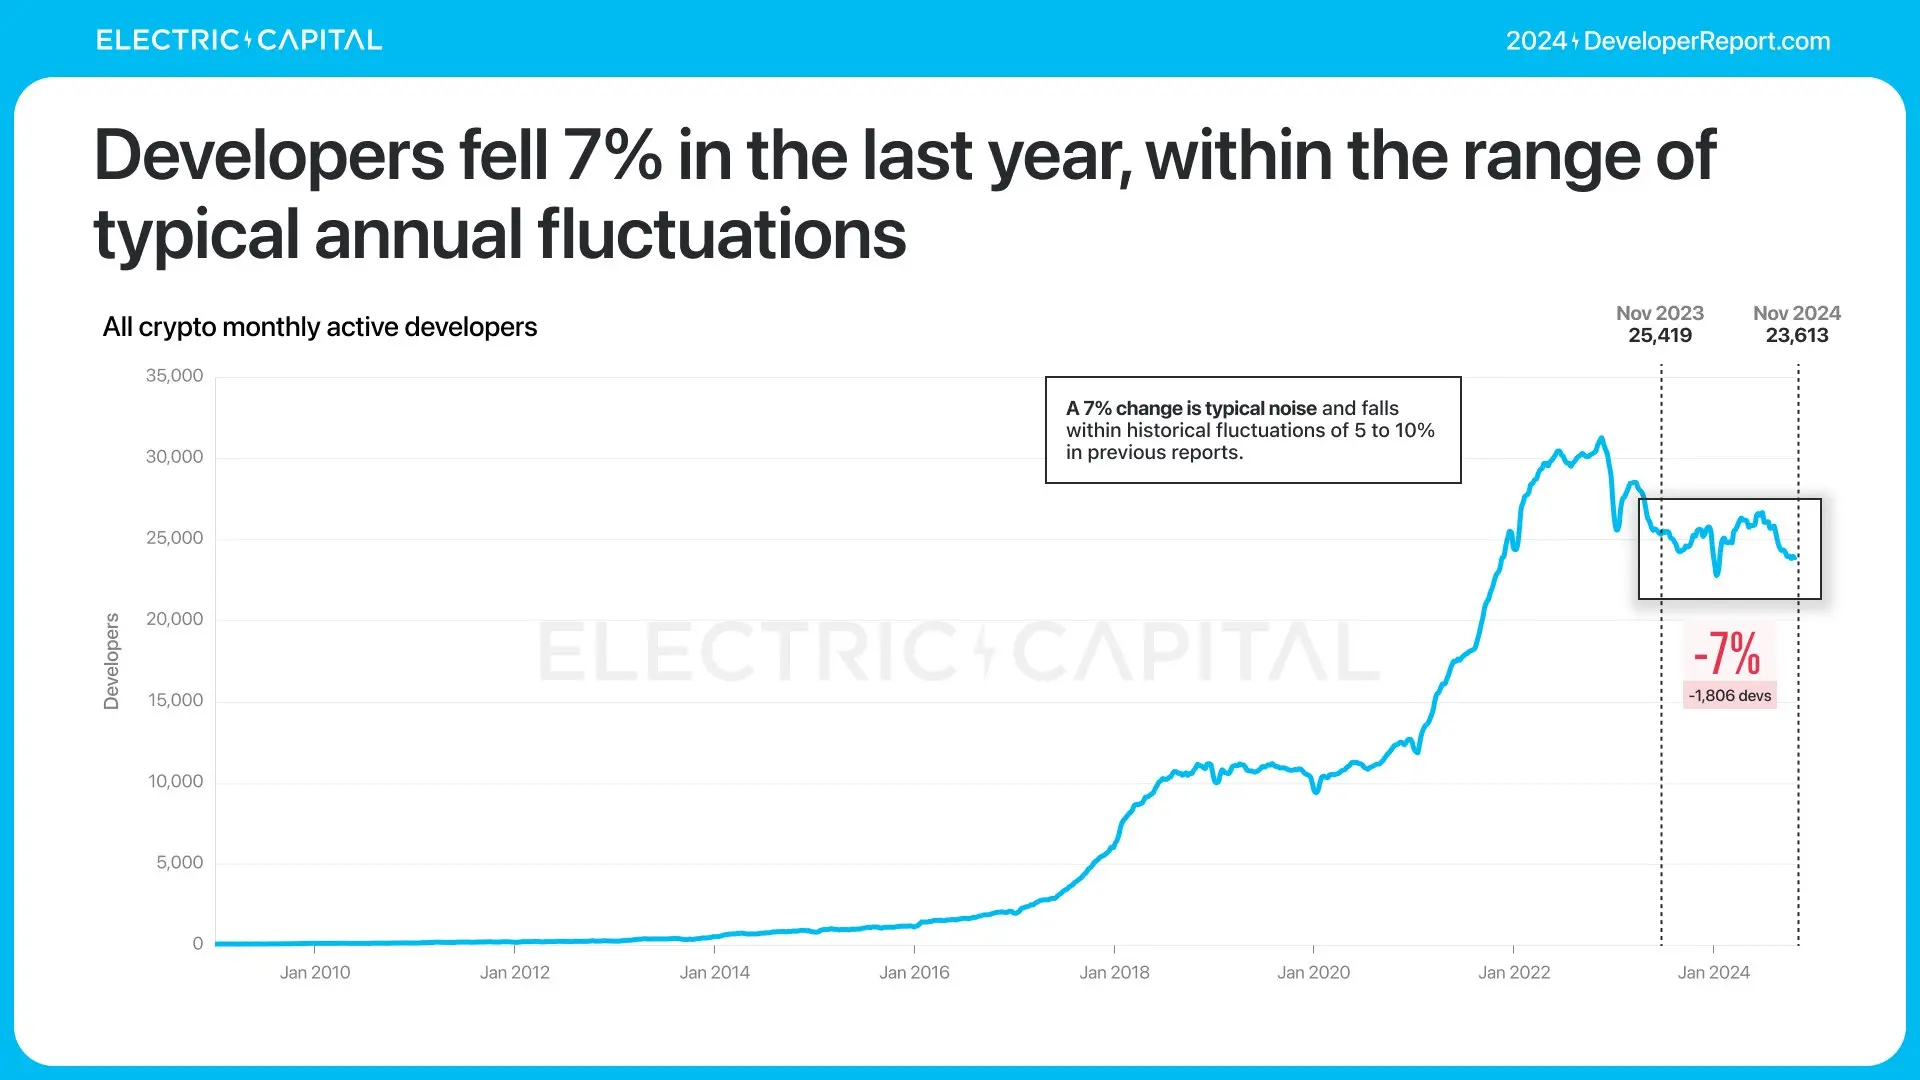
Since the launch of Ethereum in 2015, the crypto industry has grown at an average annual rate of 39%. In 2015, there were about 1,000 monthly active developers. Today, the number of monthly active developers has grown to 23,613.

In the past year, the number of monthly active developers has slightly decreased by 7%.
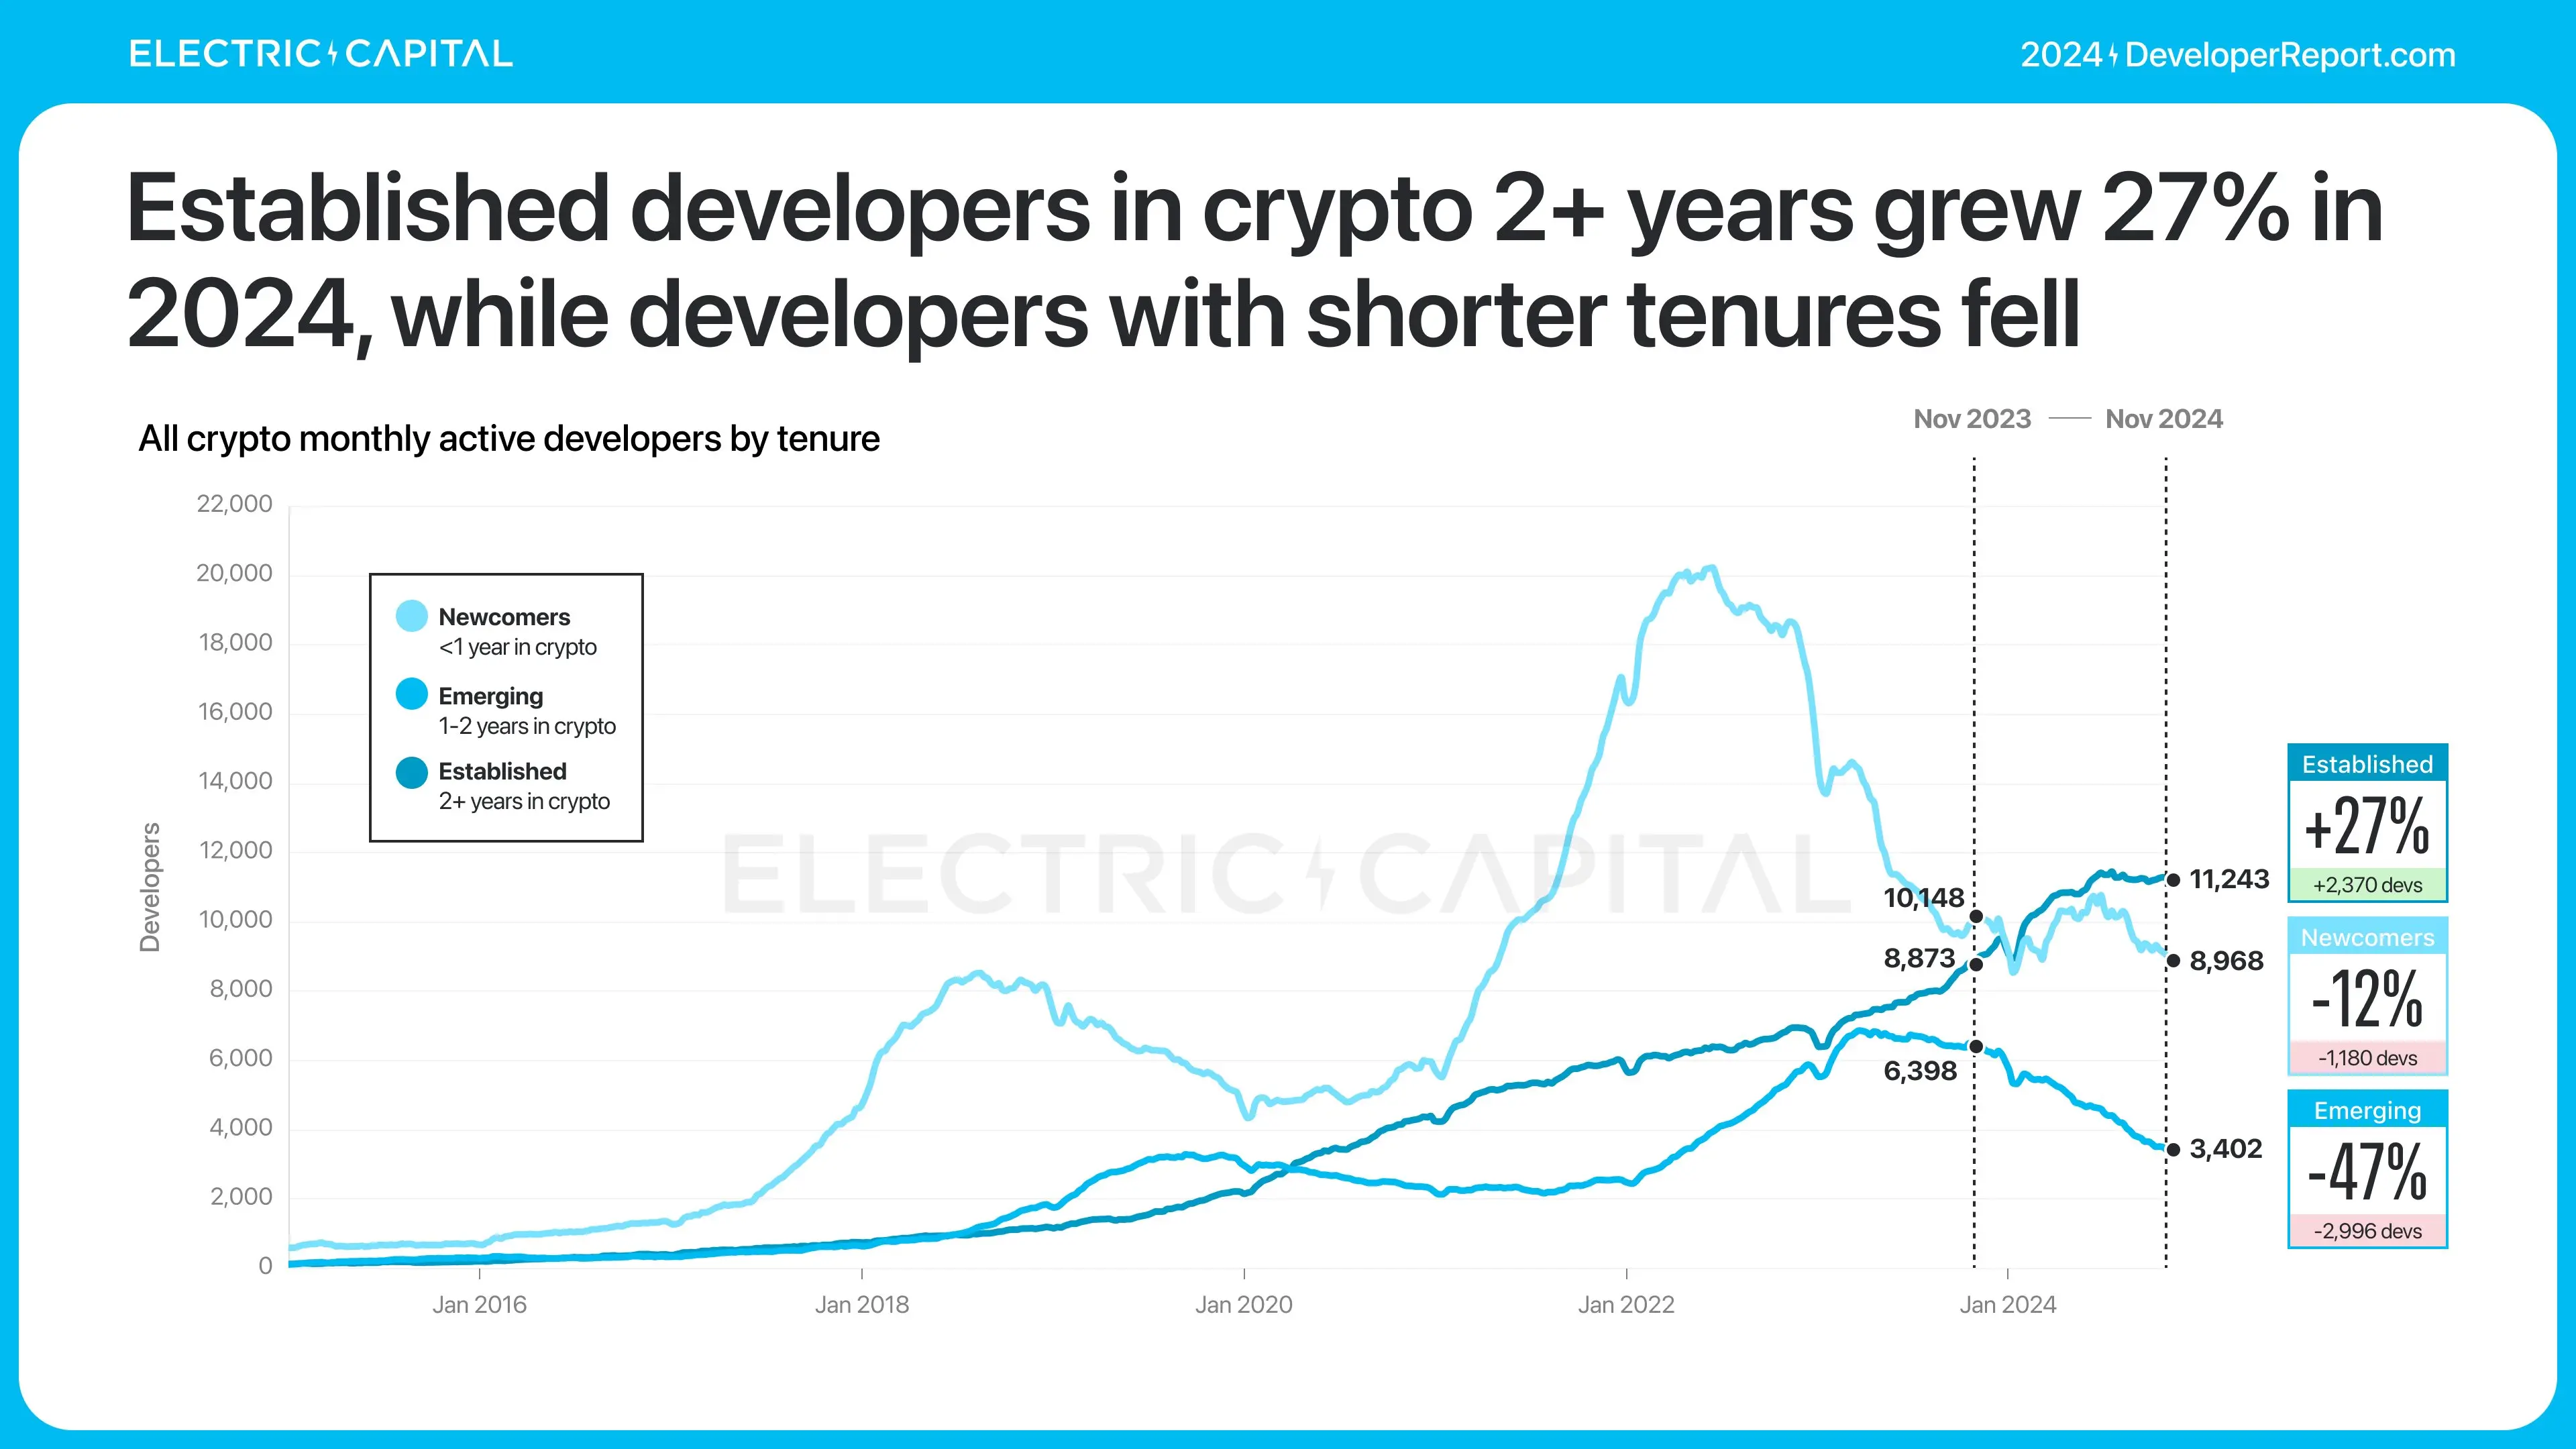
However, the number of developers engaged in the crypto industry for over two years has increased by 27%.
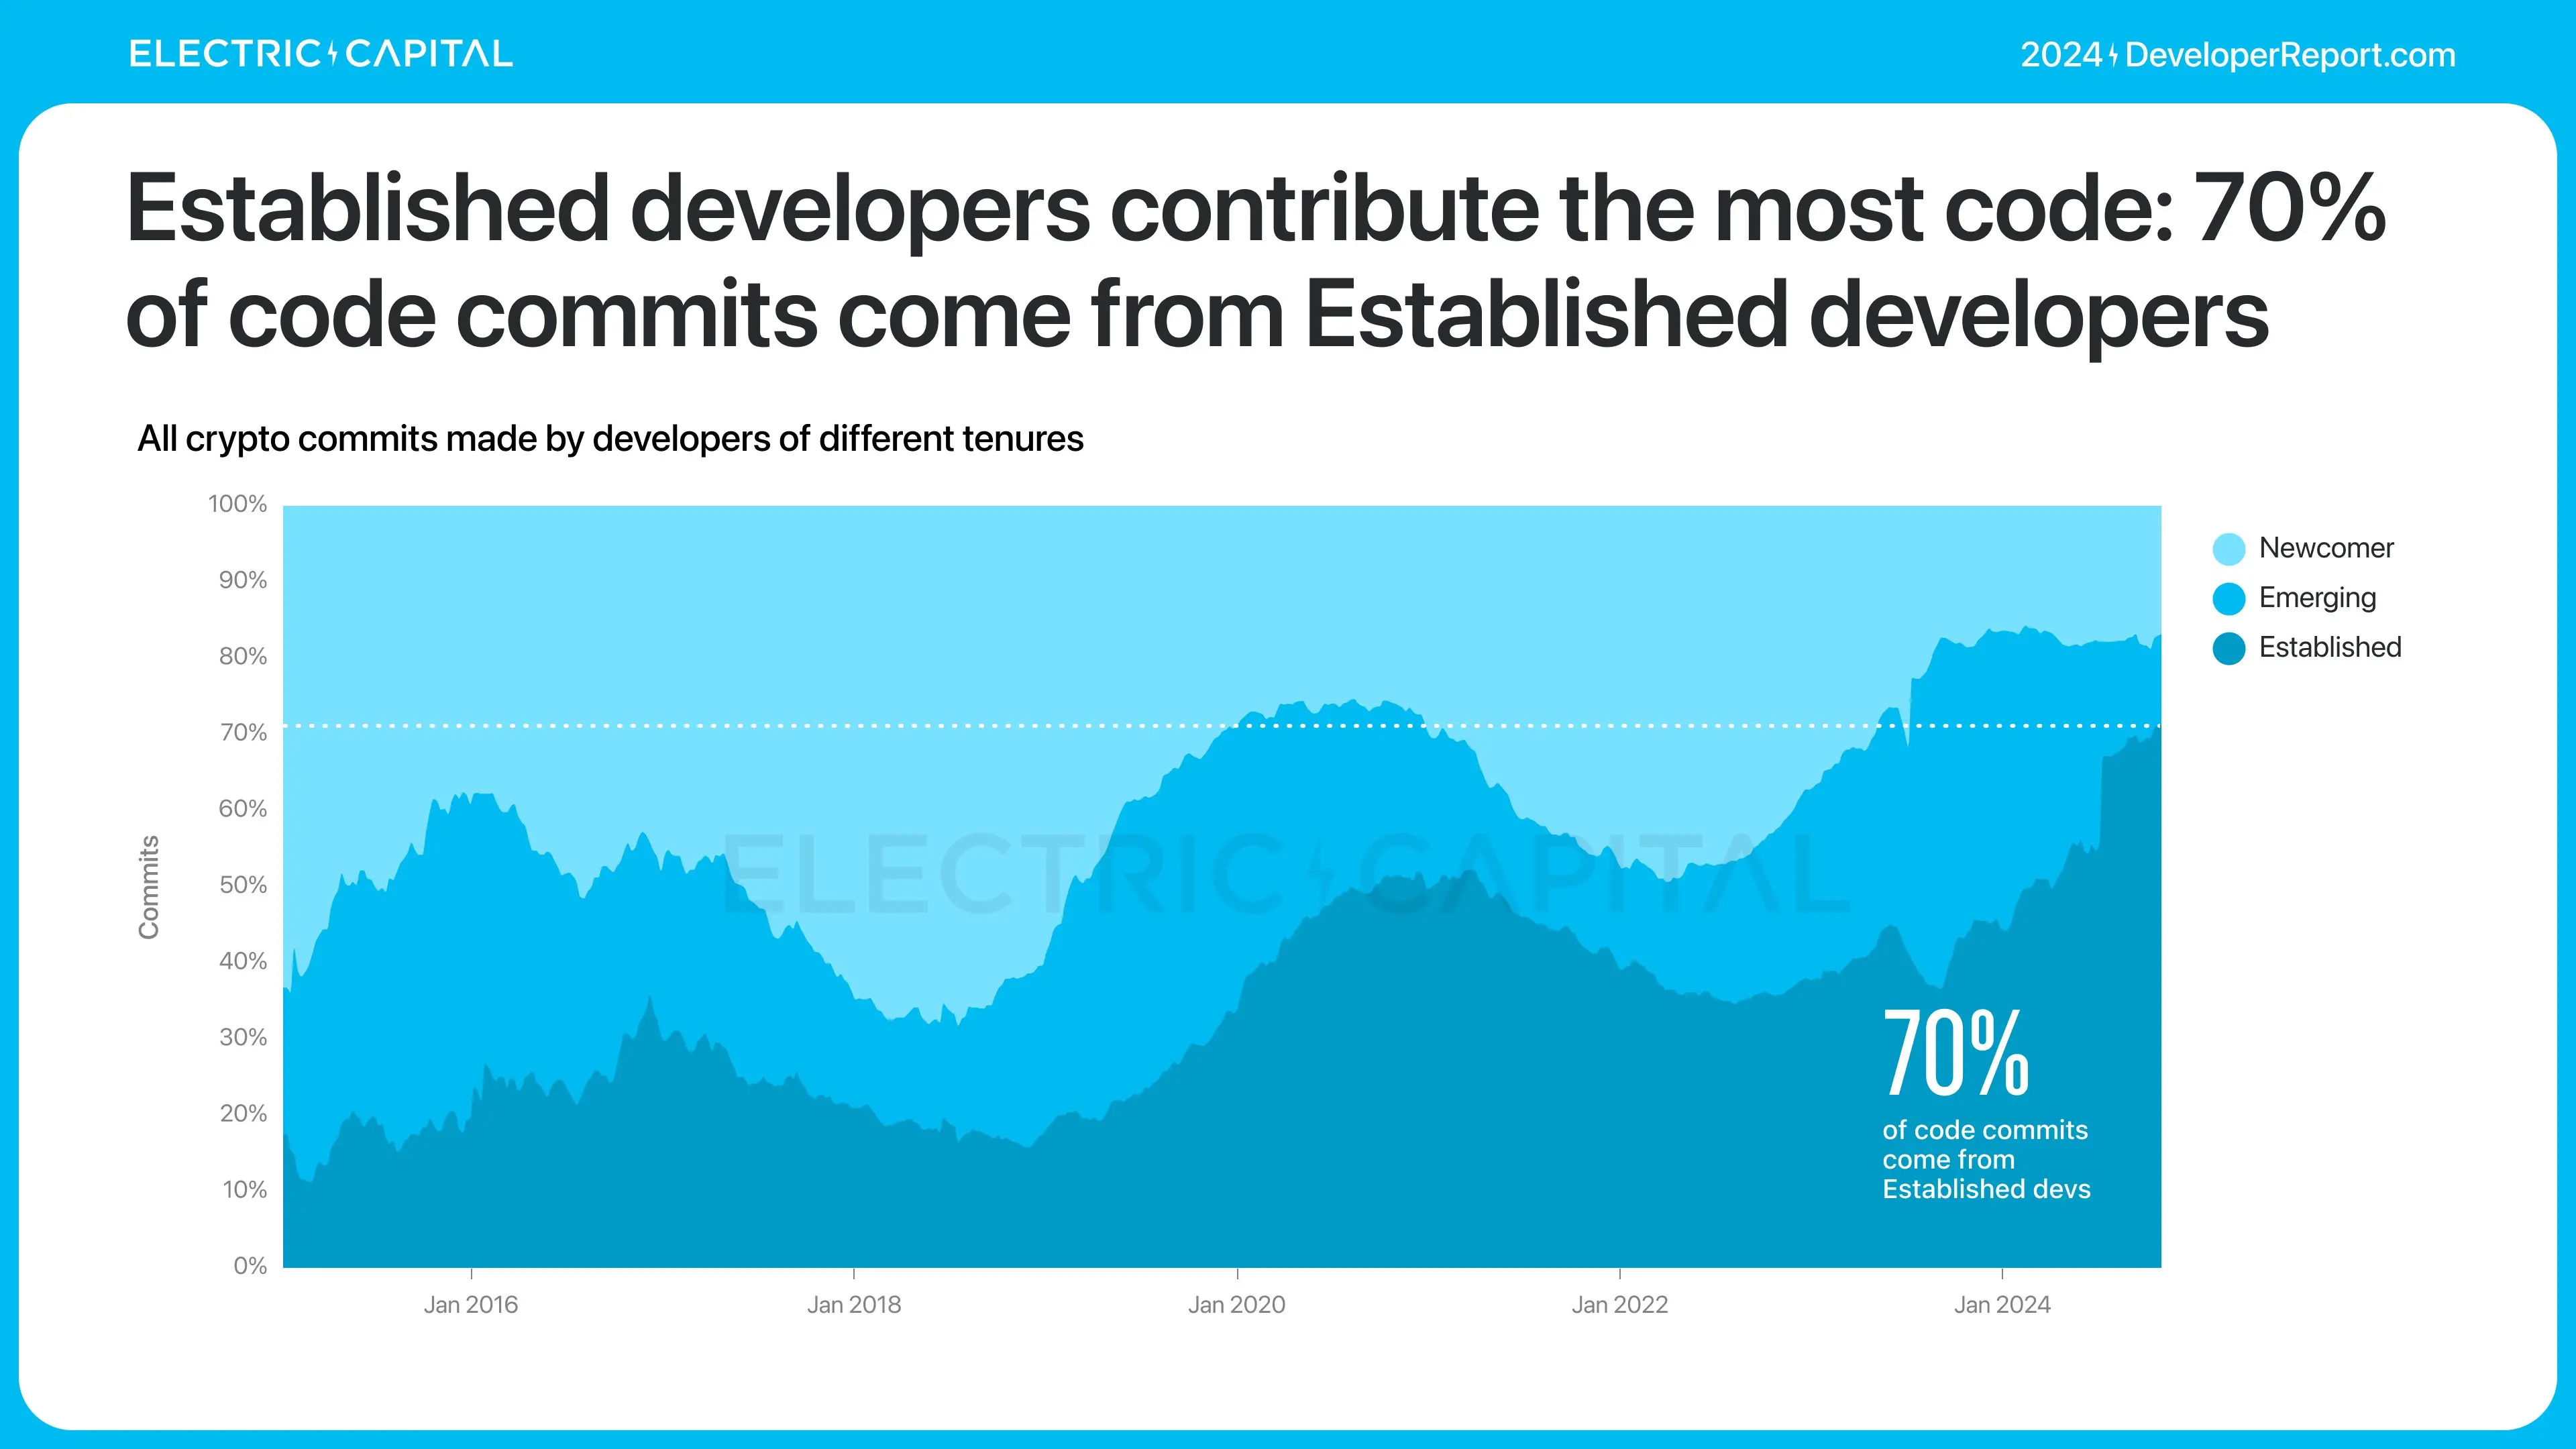
These experienced developers are driving industry growth, contributing 70% of the code commits.
How has the crypto industry changed since 2015? Let's take a look at the global diversity of crypto developers.
The distribution of developers has shifted from 82% in the US and Europe to other parts of the world.
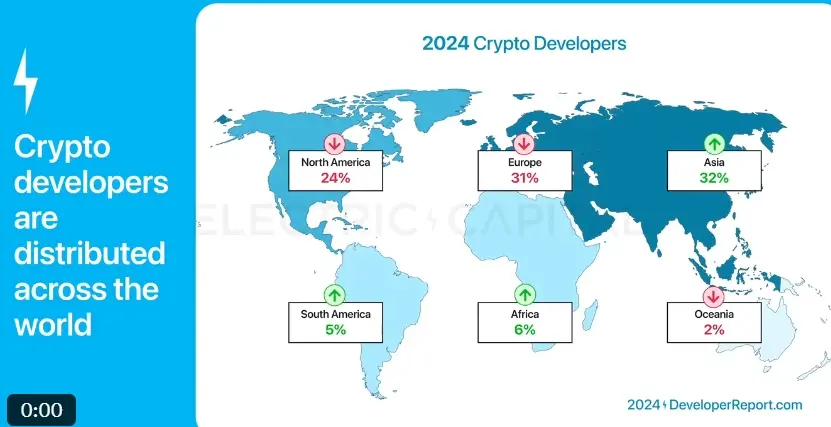
Asia is now the continent with the highest proportion of developers, with one in three crypto developers residing in Asia. Europe ranks second. North America has dropped from first to third since 2015.
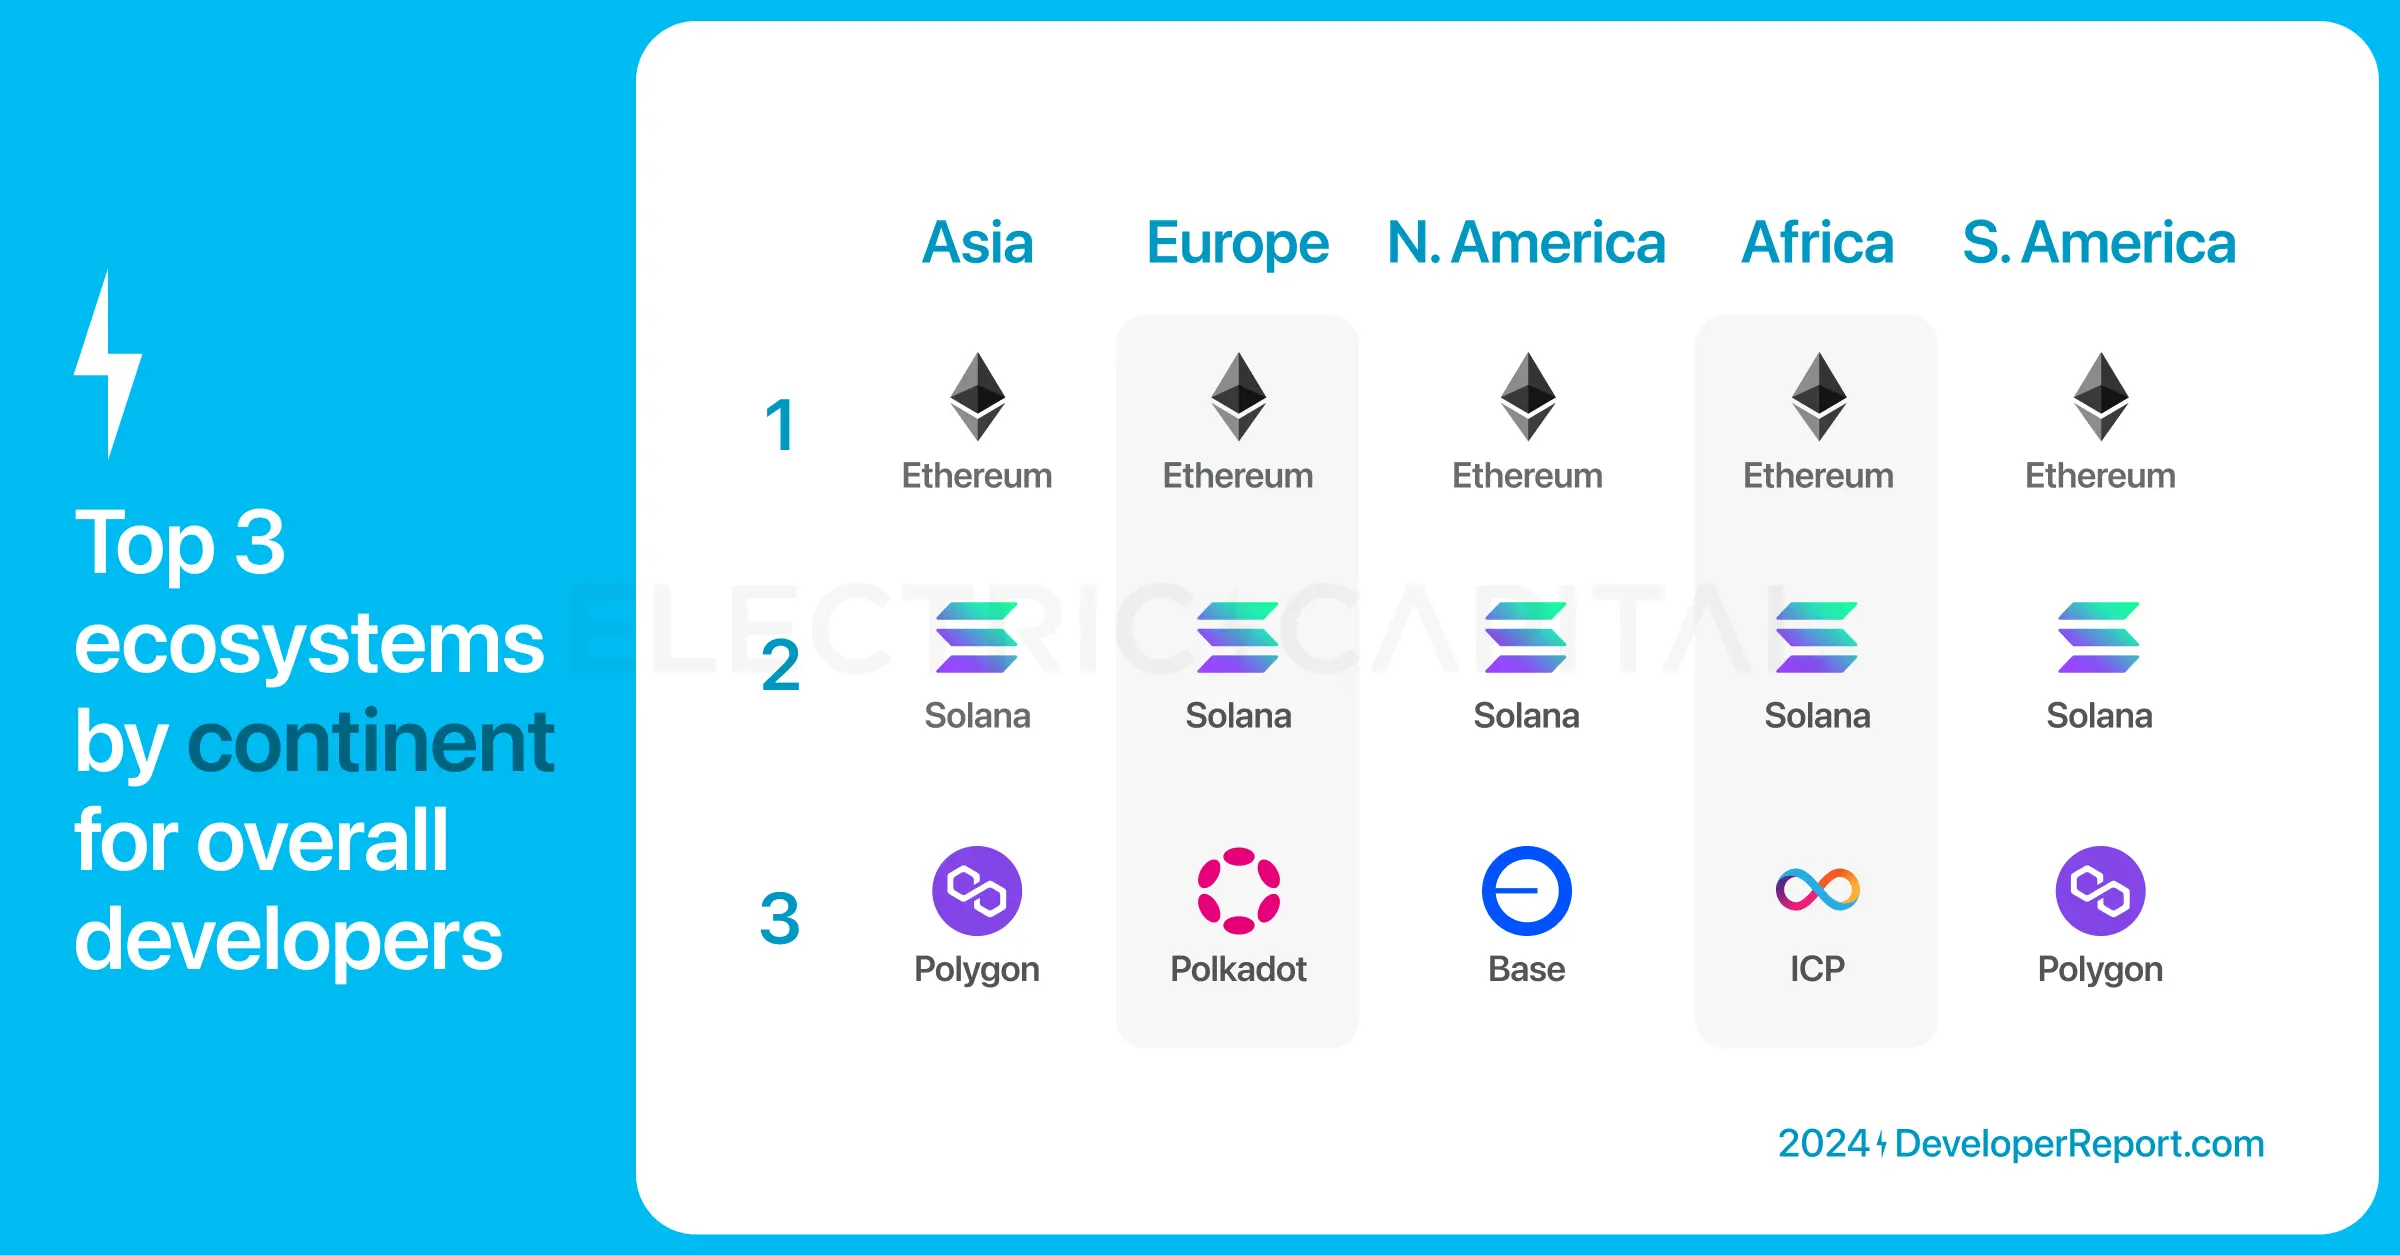
We can identify the top ecosystems in these continents by the proportion of developers.
By developer proportion, Ethereum ranks as the top ecosystem on every major continent.
- Solana ranks second.
- Polygon ranks third in Asia and South America.
- Polkadot ranks third in Europe.
- Base ranks third in North America.
- Dfinity ranks third in Africa.
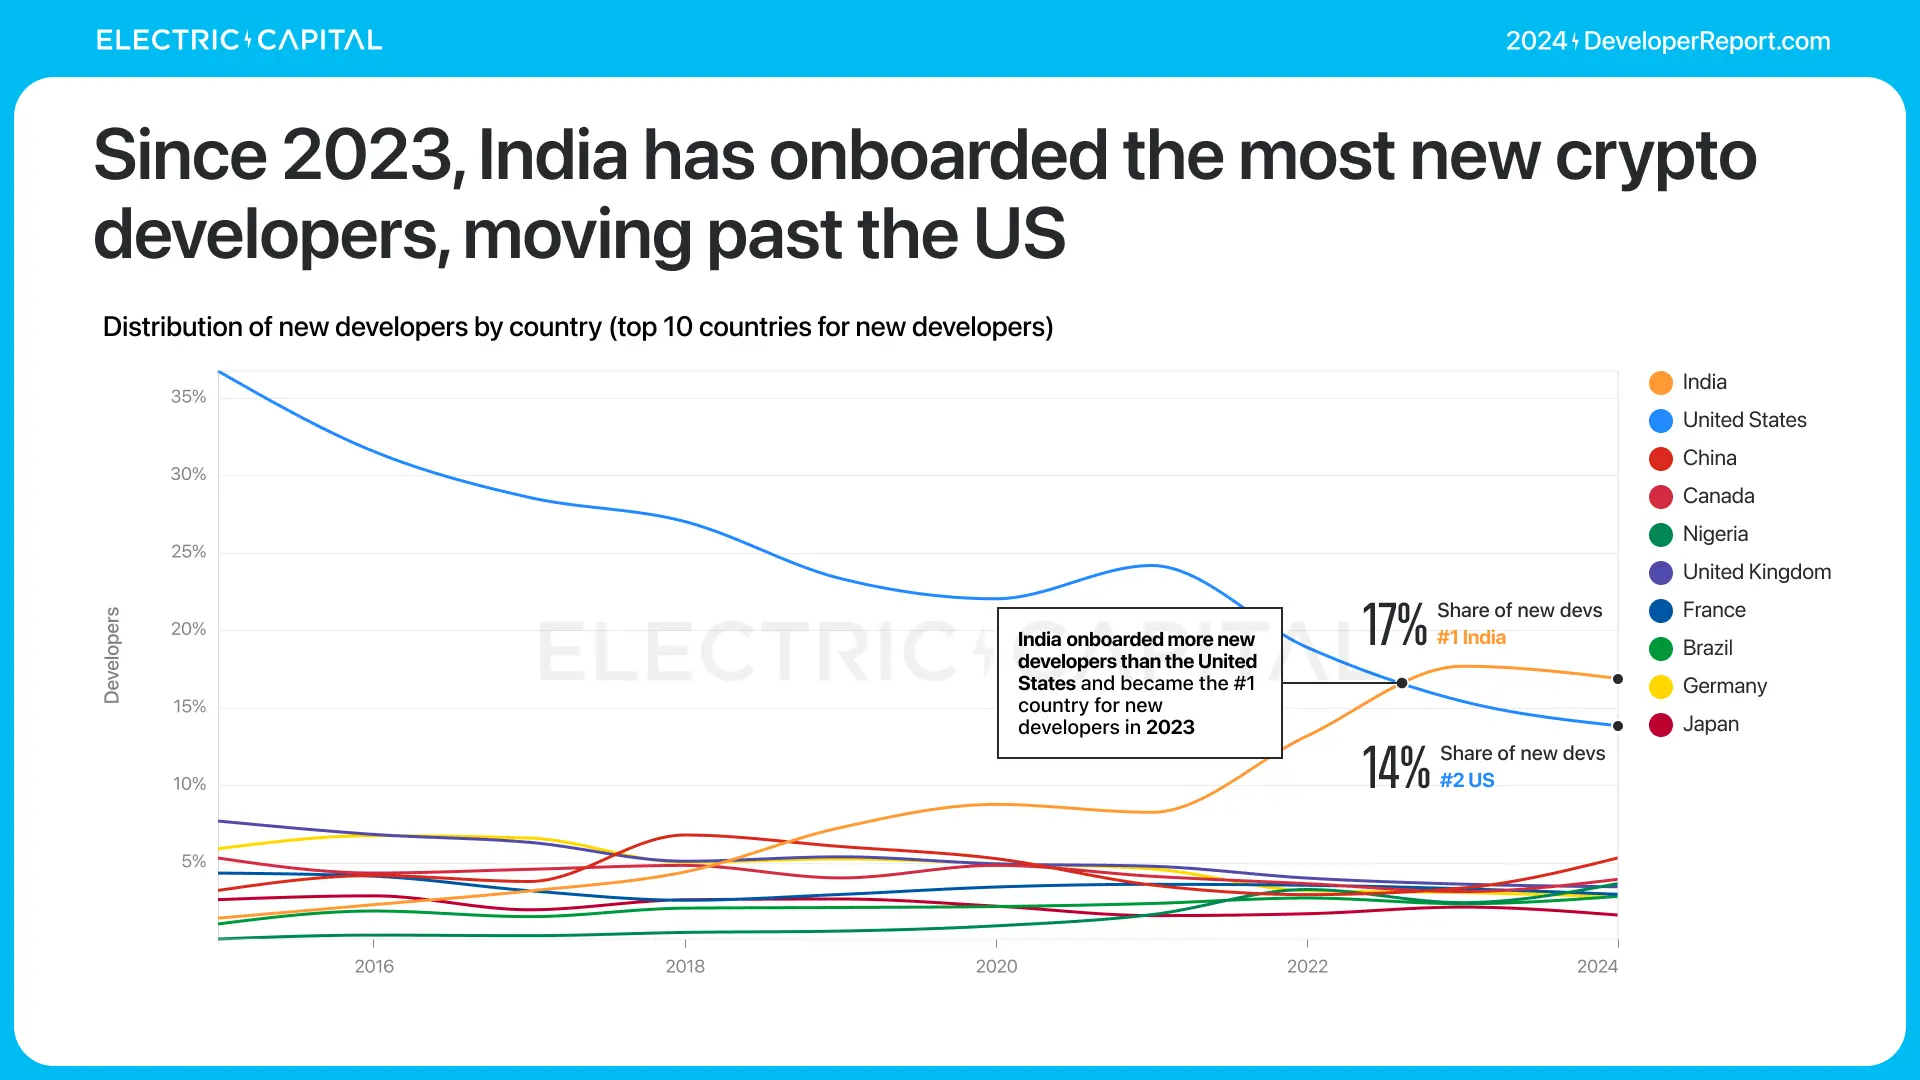
The United States, India, the United Kingdom, China, and Canada hold the largest shares of global crypto developers.
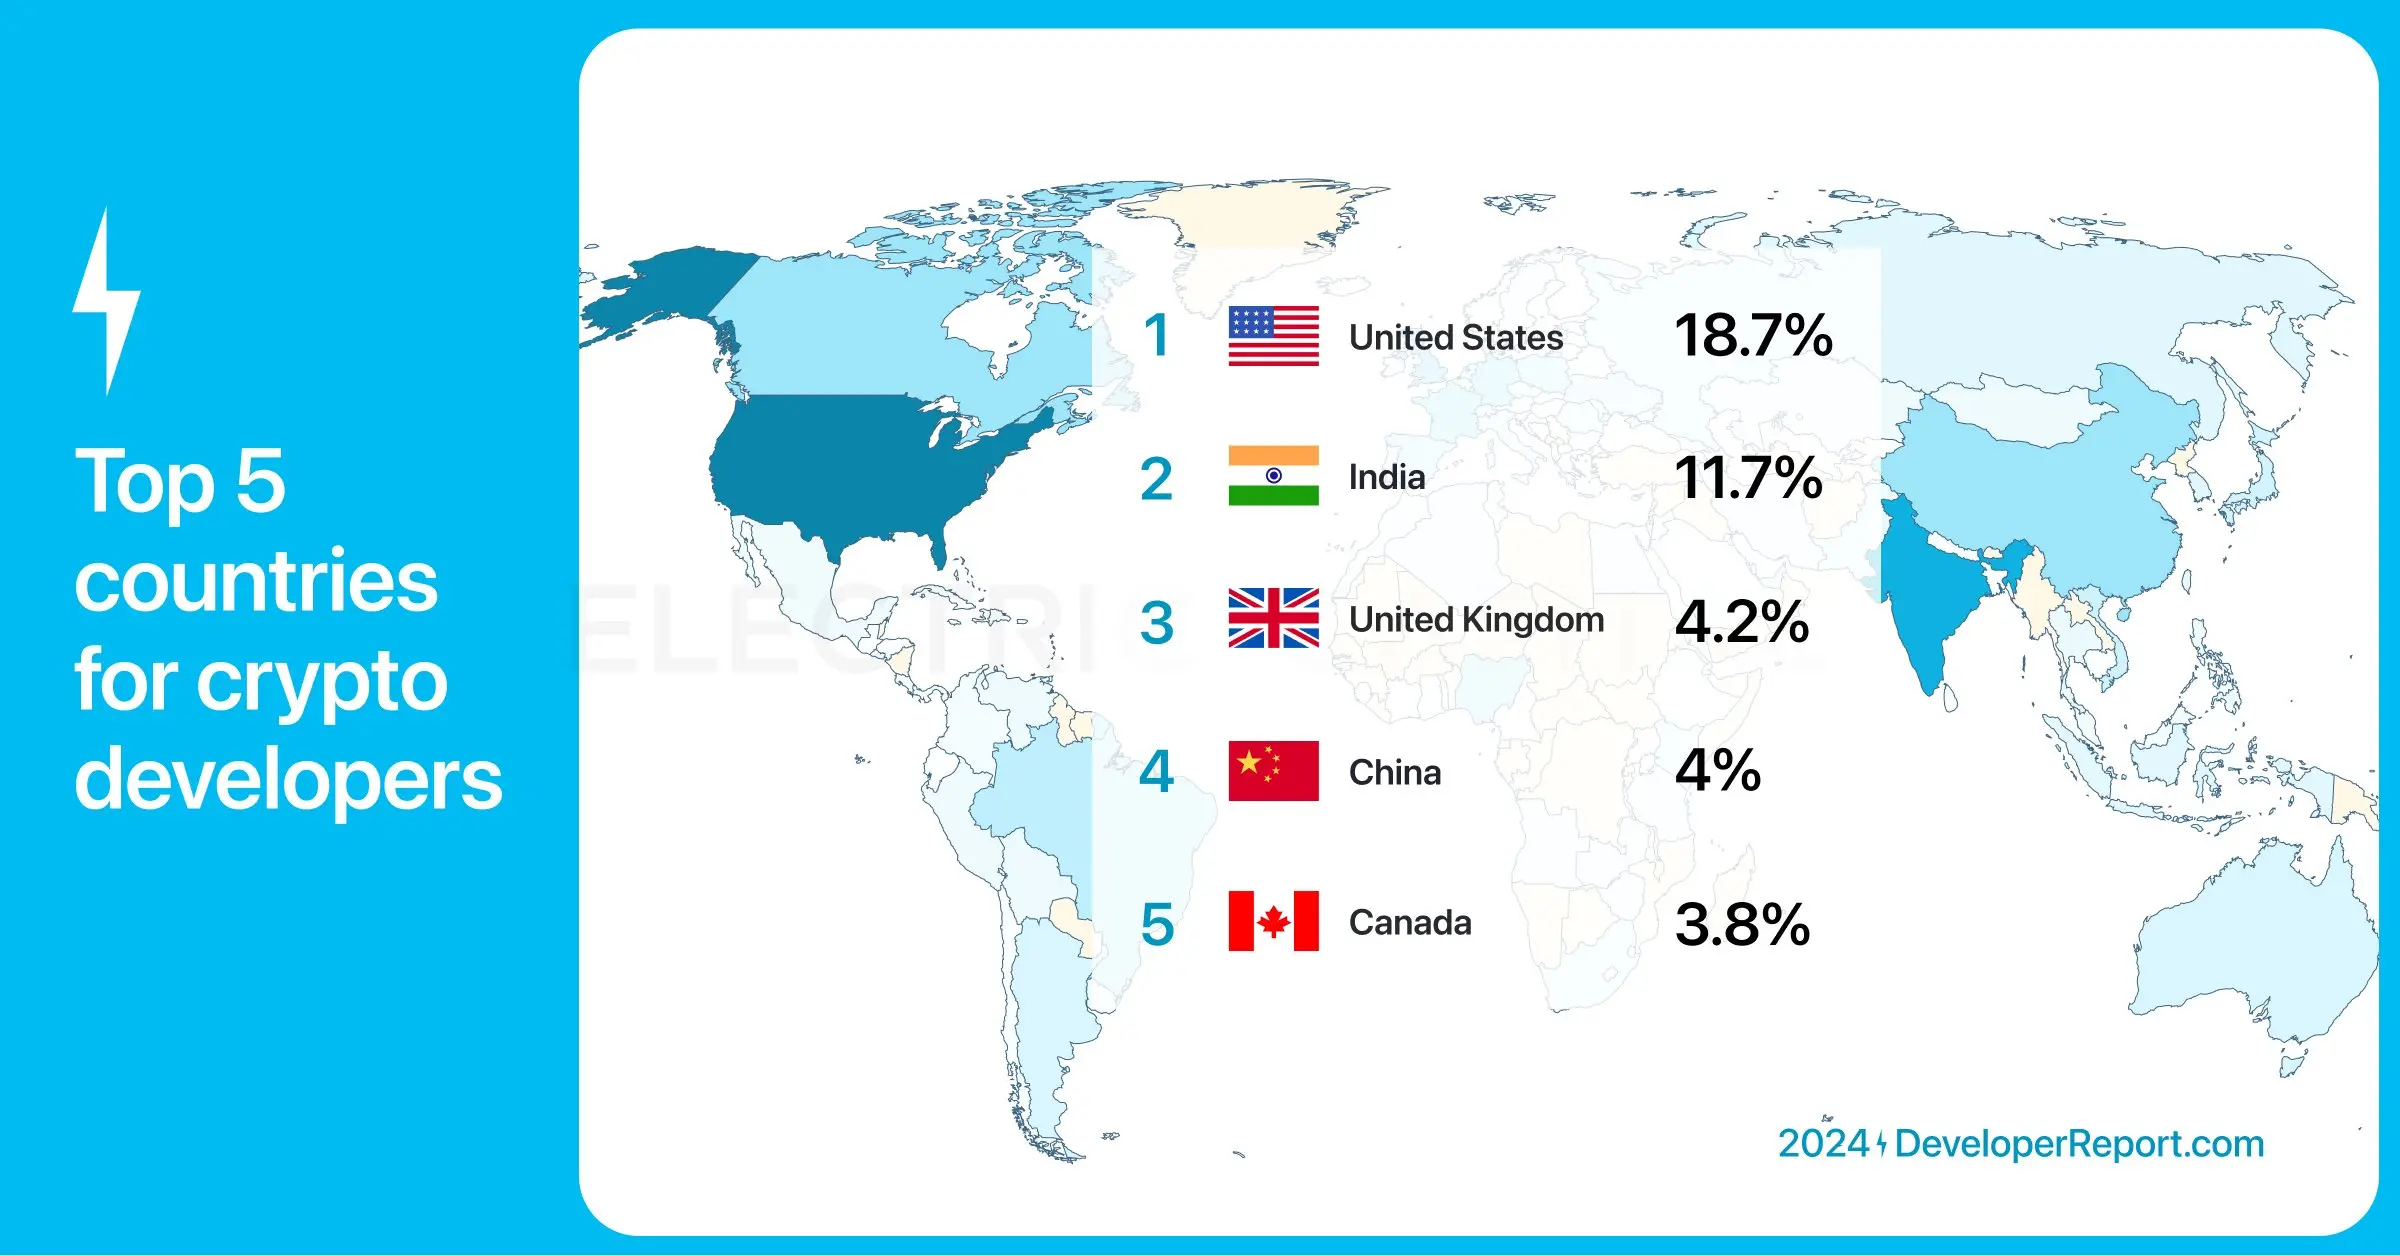
The United States still has the highest proportion of crypto developers, but it has been declining since 2015. India has risen from 10th to 2nd place.
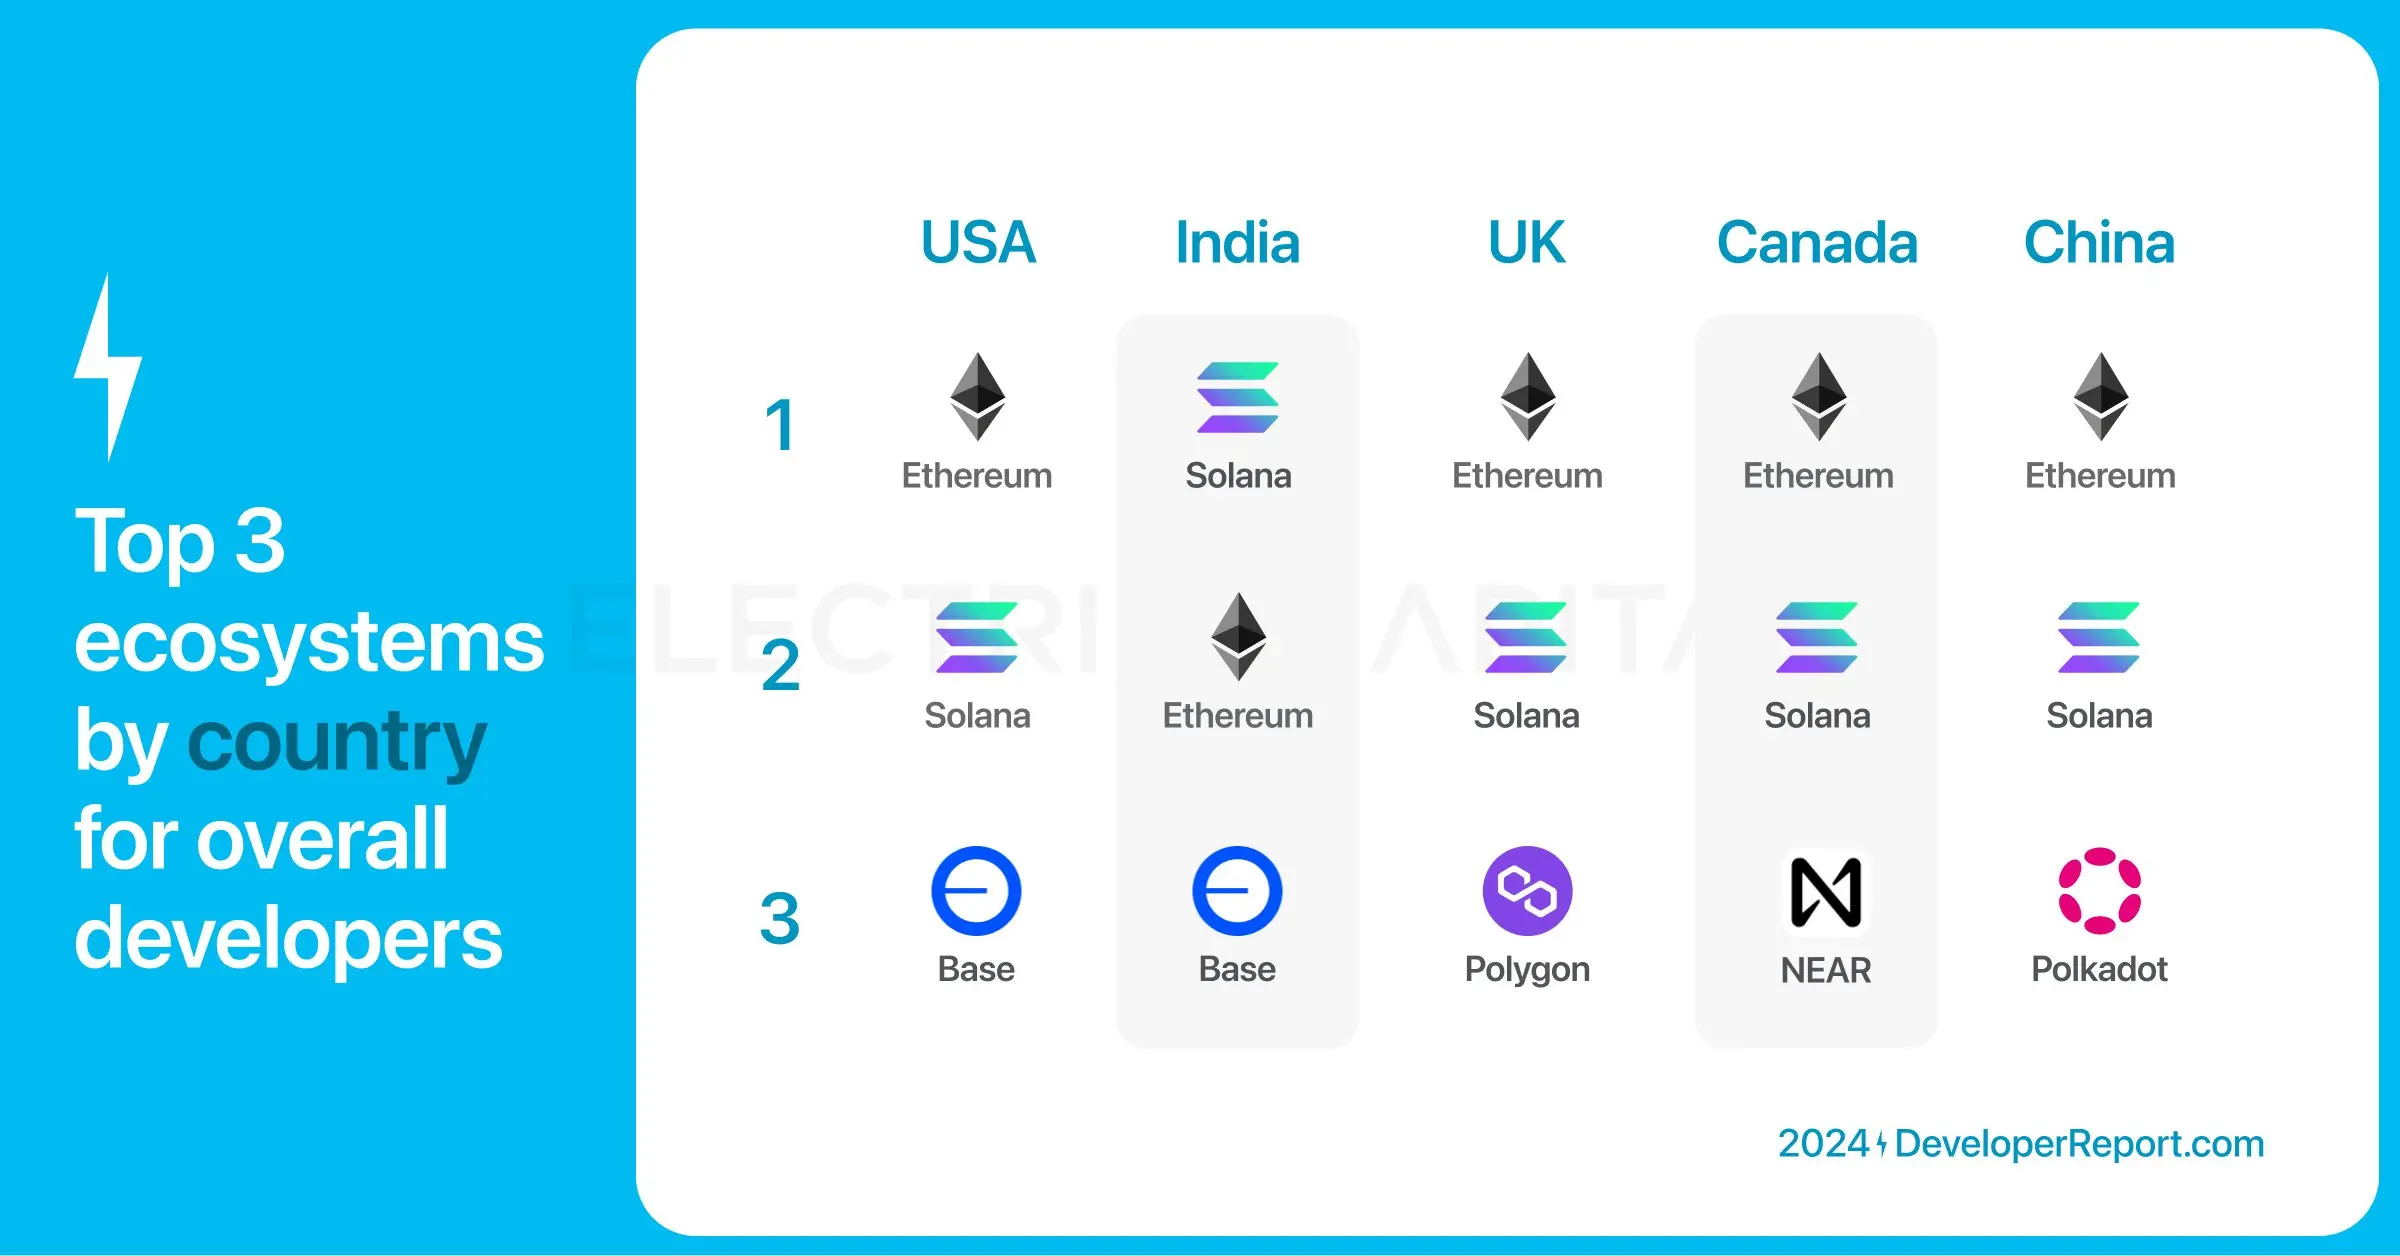
Top three ecosystems by developer proportion by country:
- Ethereum ranks first in the US, UK, China, and Canada, and second in India.
- Solana ranks first in India and second elsewhere.
- Base ranks third in the US and India.
- Polygon ranks third in the UK.
- NEAR Protocol ranks third in Canada.
- Polkadot ranks third in China.
India welcomed the most new crypto developers in 2024, with 17% of new crypto developers coming from India.
Let's focus on new developers—39,148 new developers explored the crypto space in 2024. We can break down these new developers by ecosystem.
Solana became the ecosystem with the highest number of new monthly developers in July 2024.
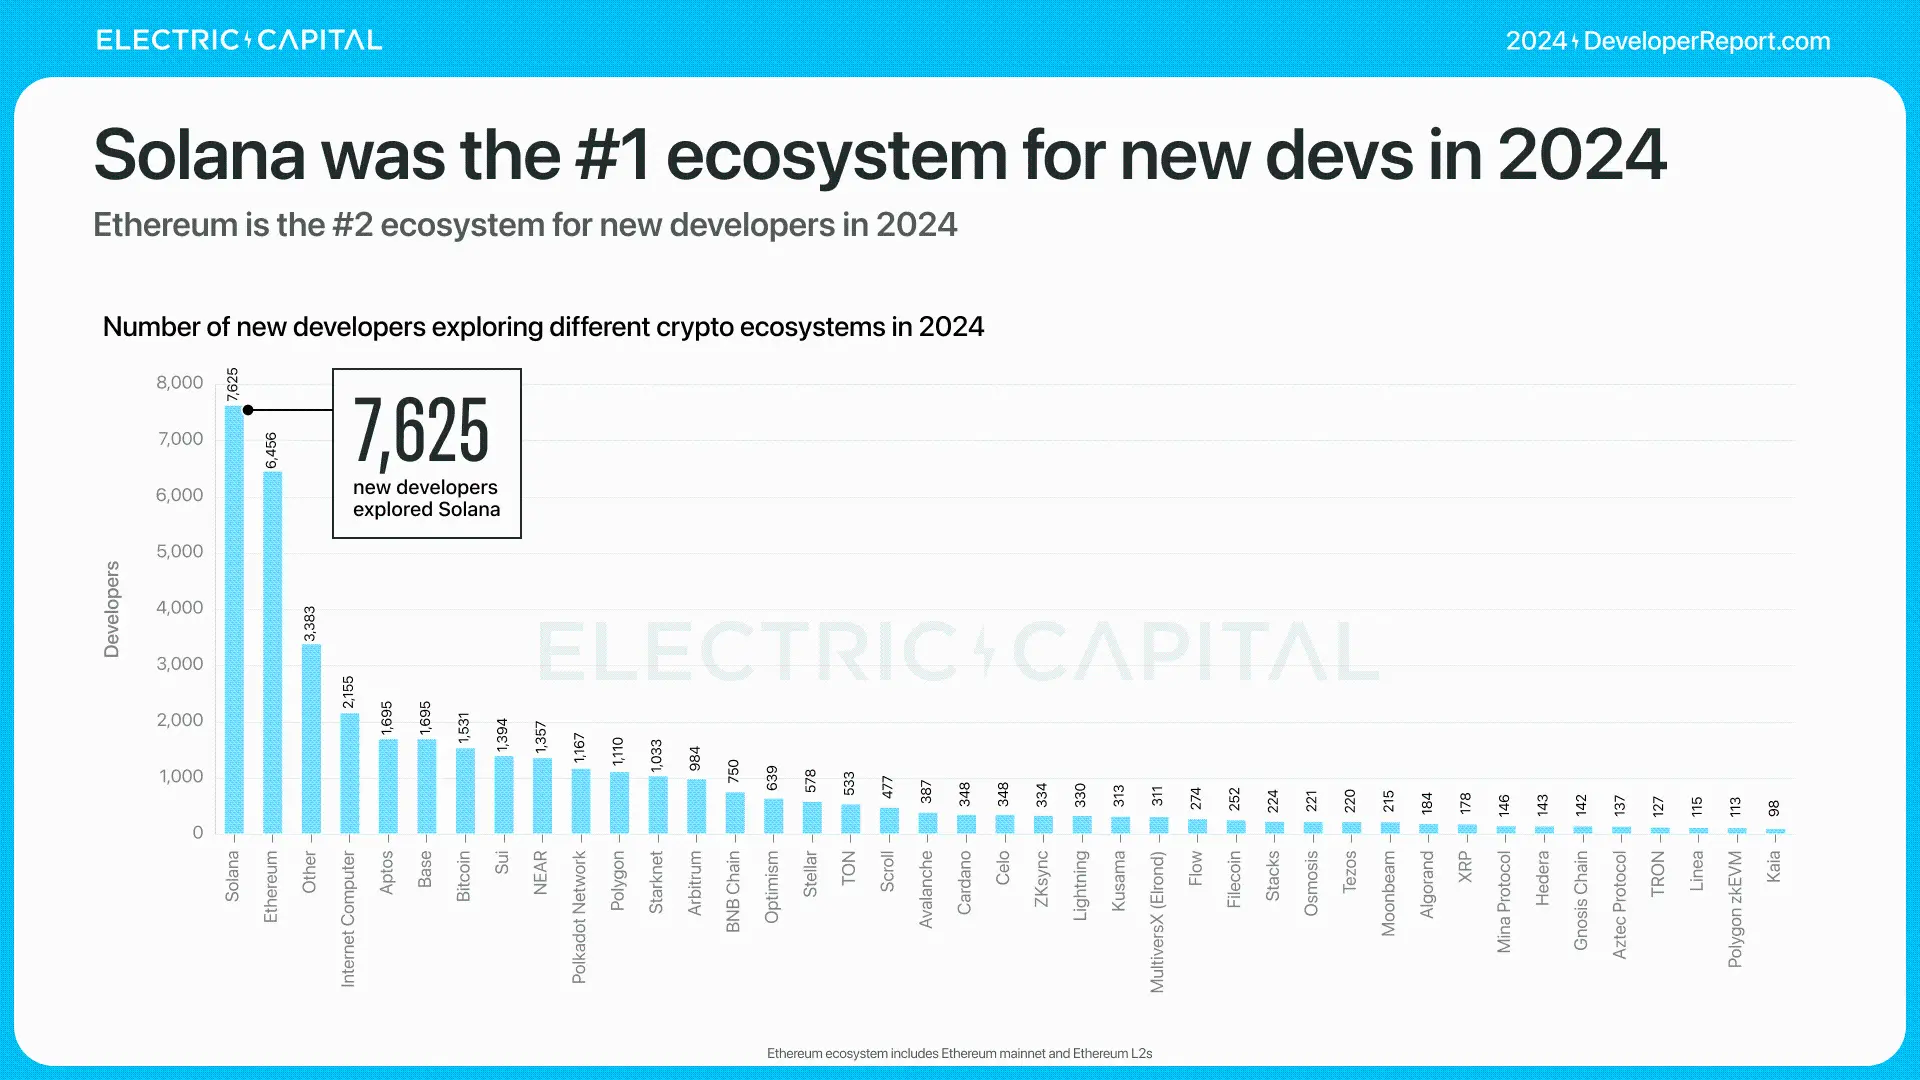
Overall situation of new developers in 2024:
Solana is the ecosystem with the most new developers, ranking first.
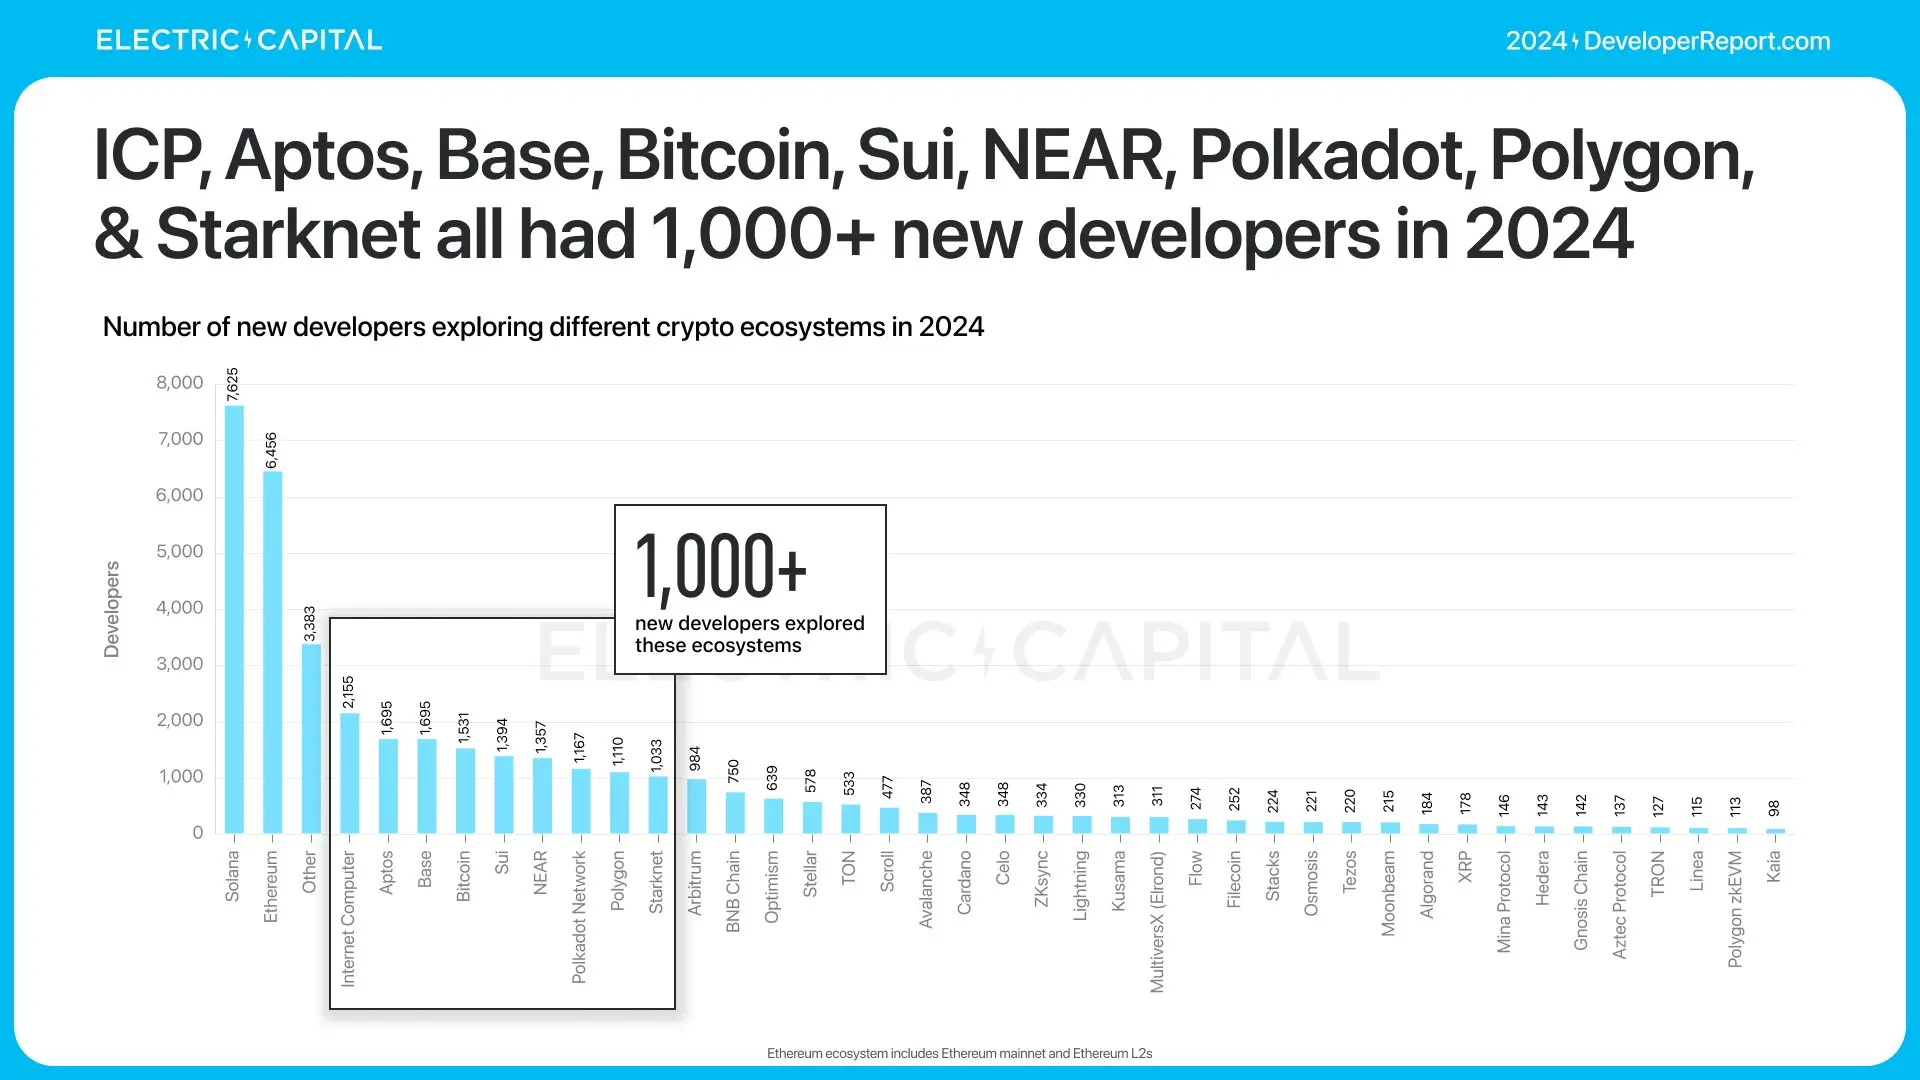
Ethereum ranks second. Dfinity, Aptos, Base, Bitcoin, SuiNetwork, NEAR Protocol, Polkadot, Polygon, and Starknet all welcomed over 1,000 new developers.
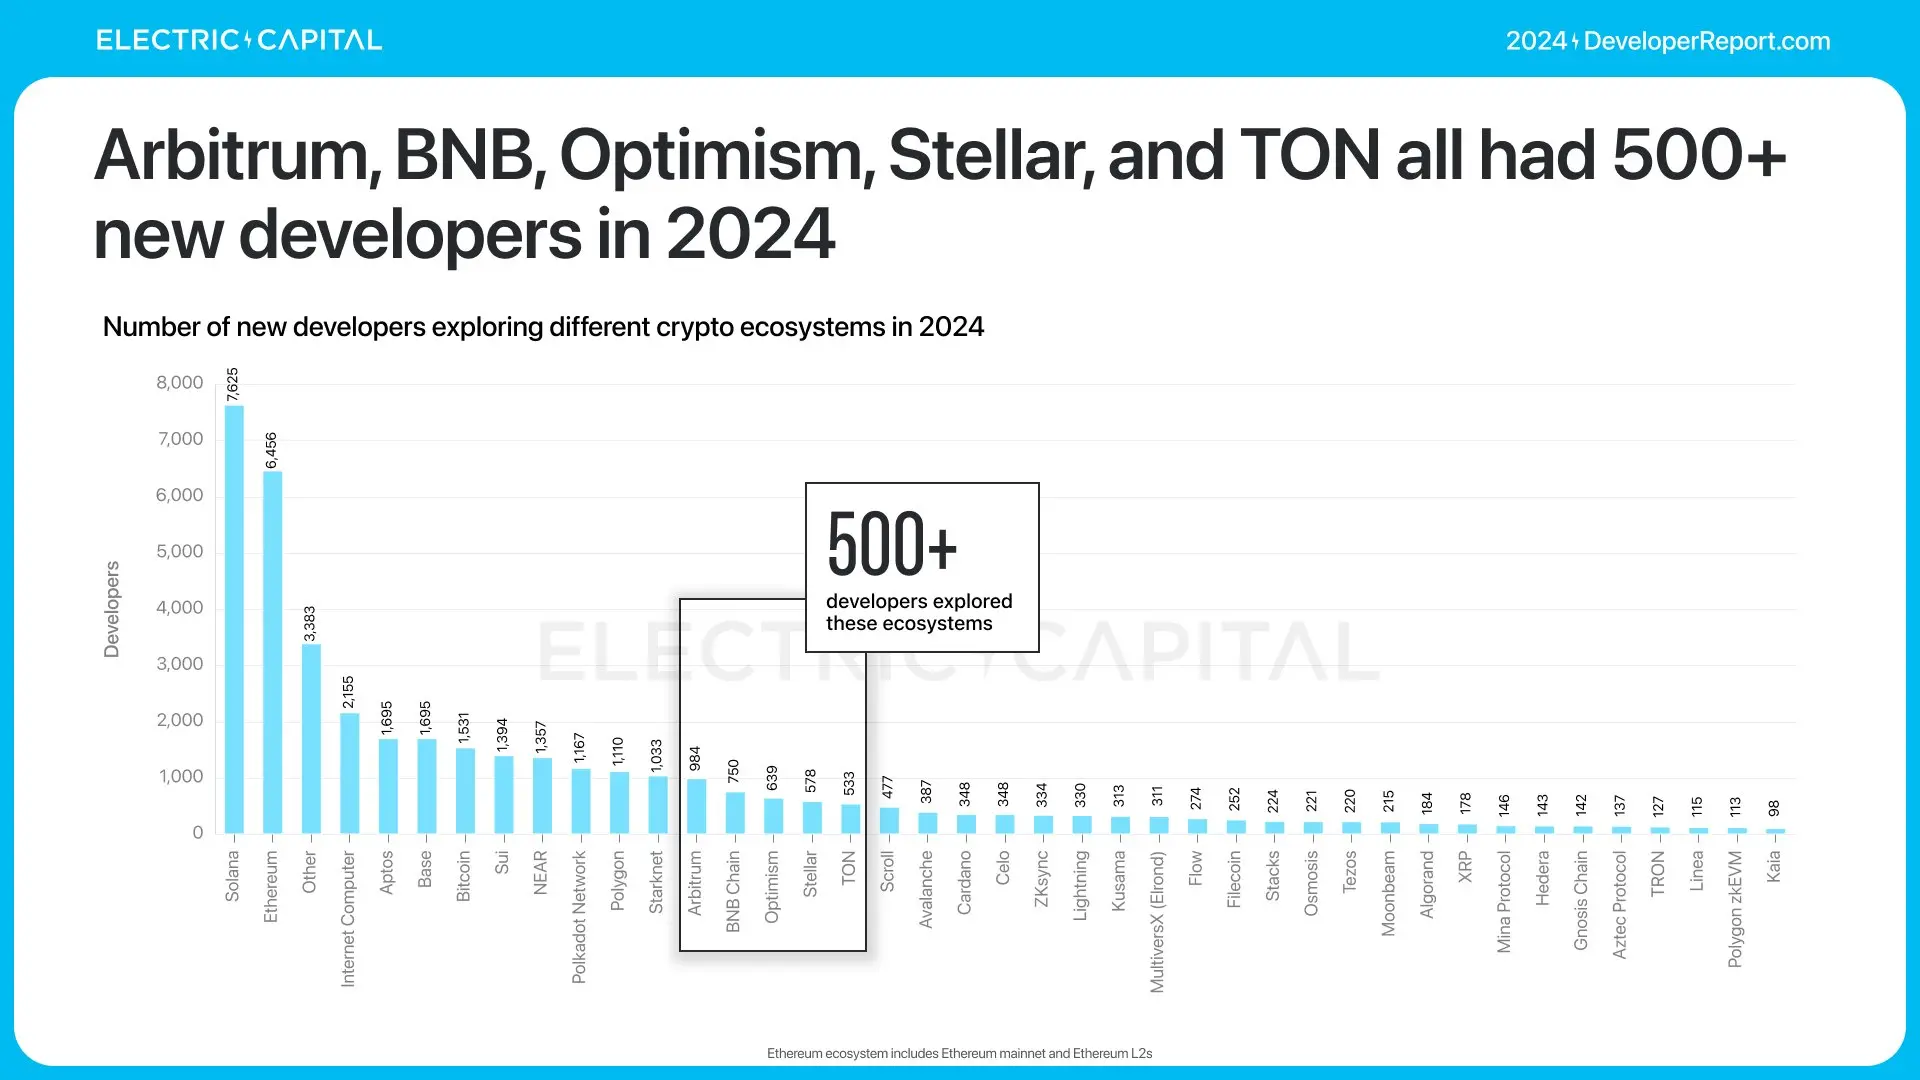
Arbitrum, BNBCHAIN, Optimism, StellarOrg, and ton_blockchain all welcomed over 500 new developers.
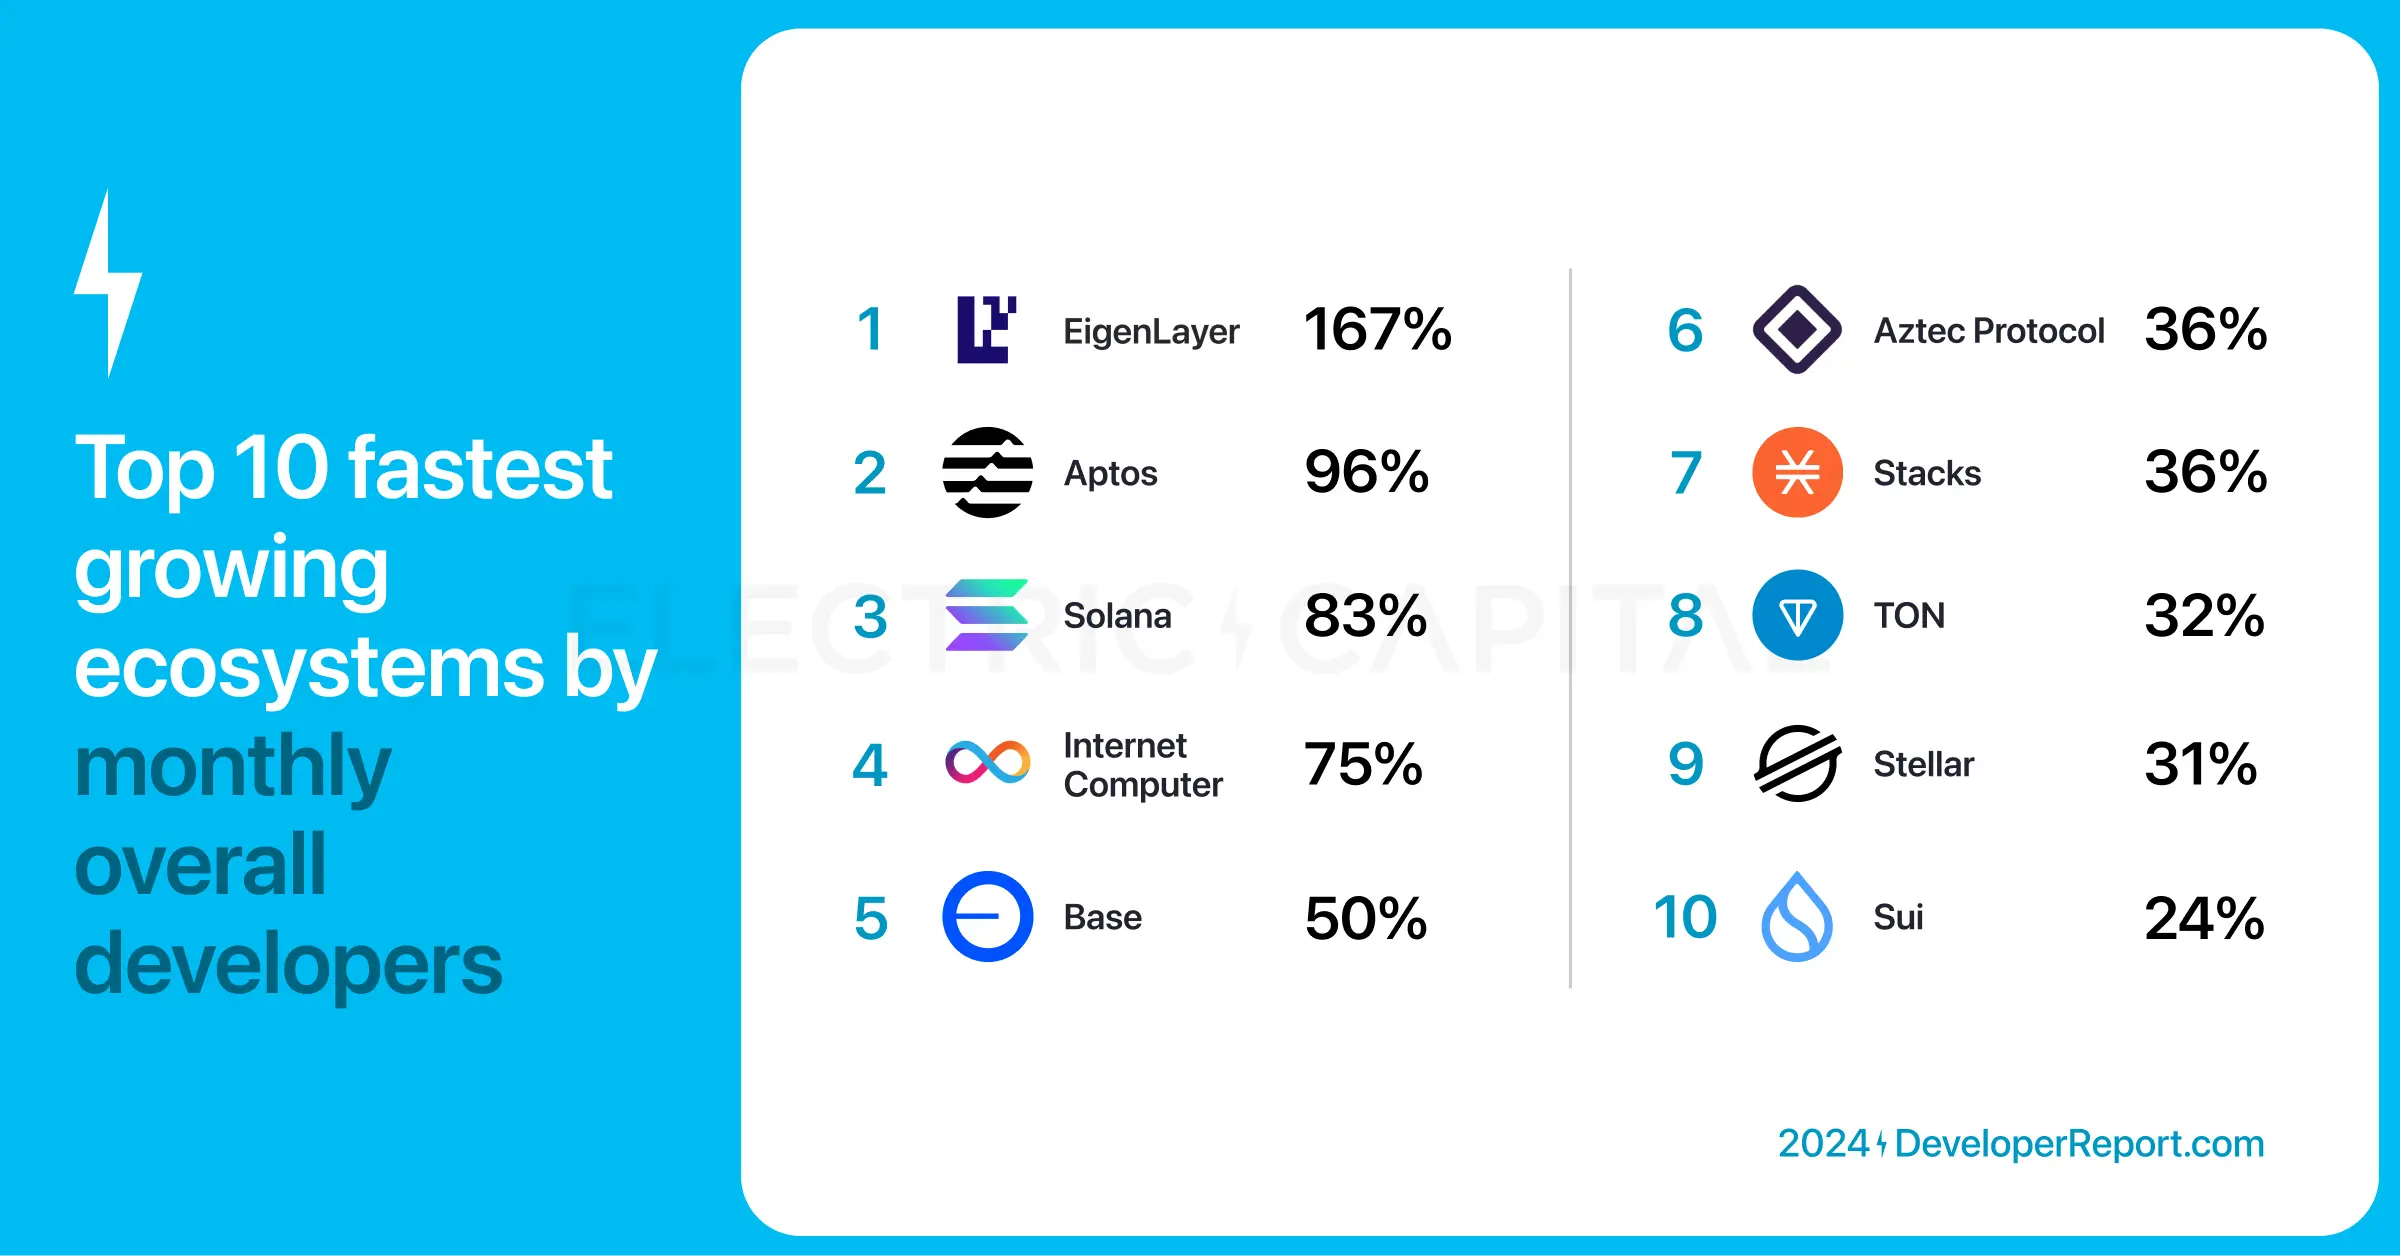
Which ecosystems have the fastest growth in total developer numbers? Total developer numbers reflect the interest of new developers and hackathon participants.
Based on data from Q3 2023 and Q4 2024, the top ten ecosystems with the fastest growth in total developer numbers are:
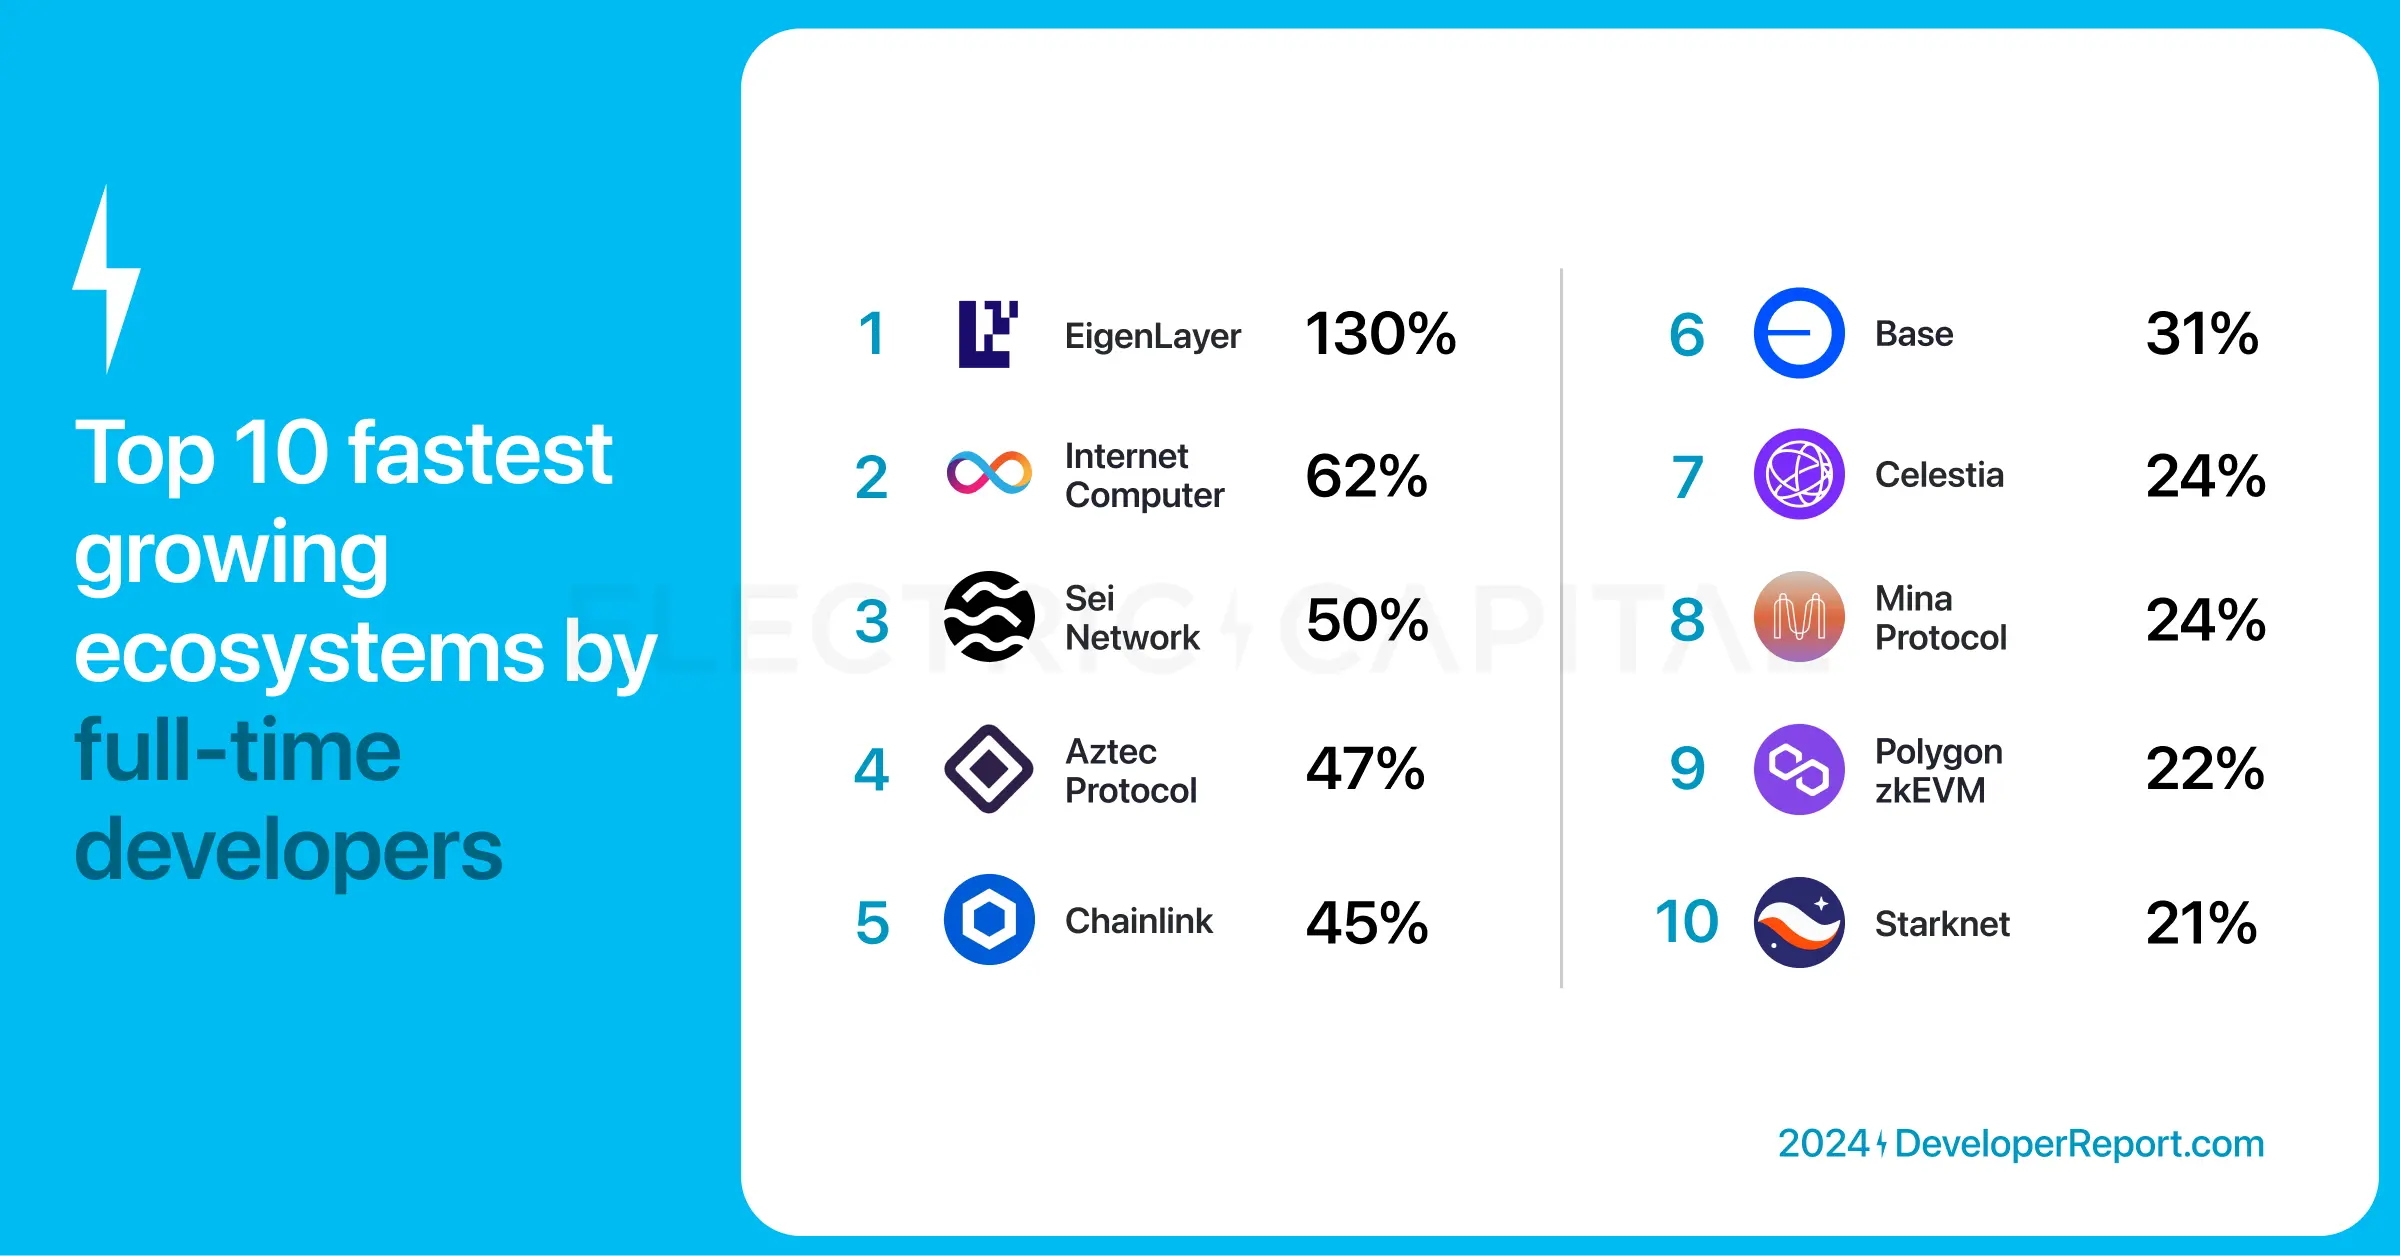
Which ecosystems have the fastest growth in full-time developer numbers? Full-time developers submit code for more than 10 days a month, contributing stable work to the ecosystem.
Based on data from Q3 2023 and Q4 2024, the top ten ecosystems with the fastest growth in full-time developer numbers are:
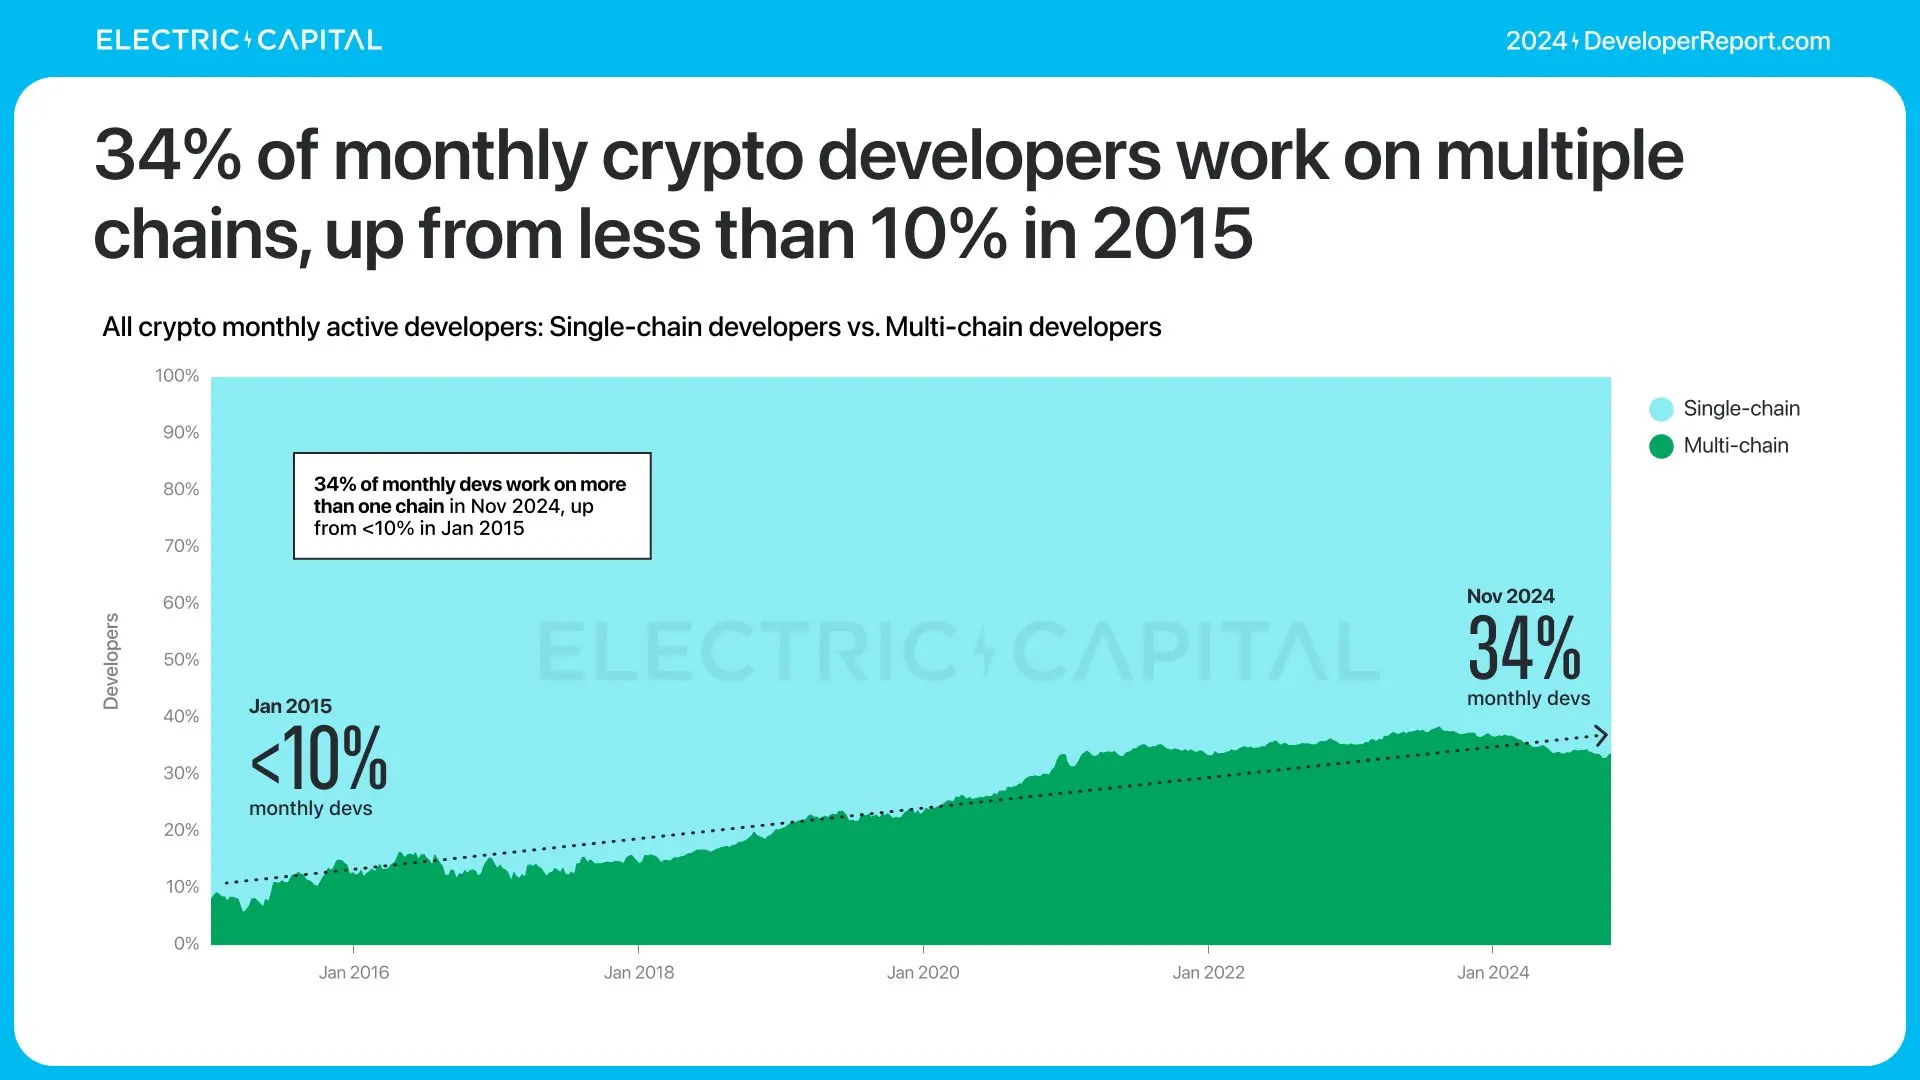
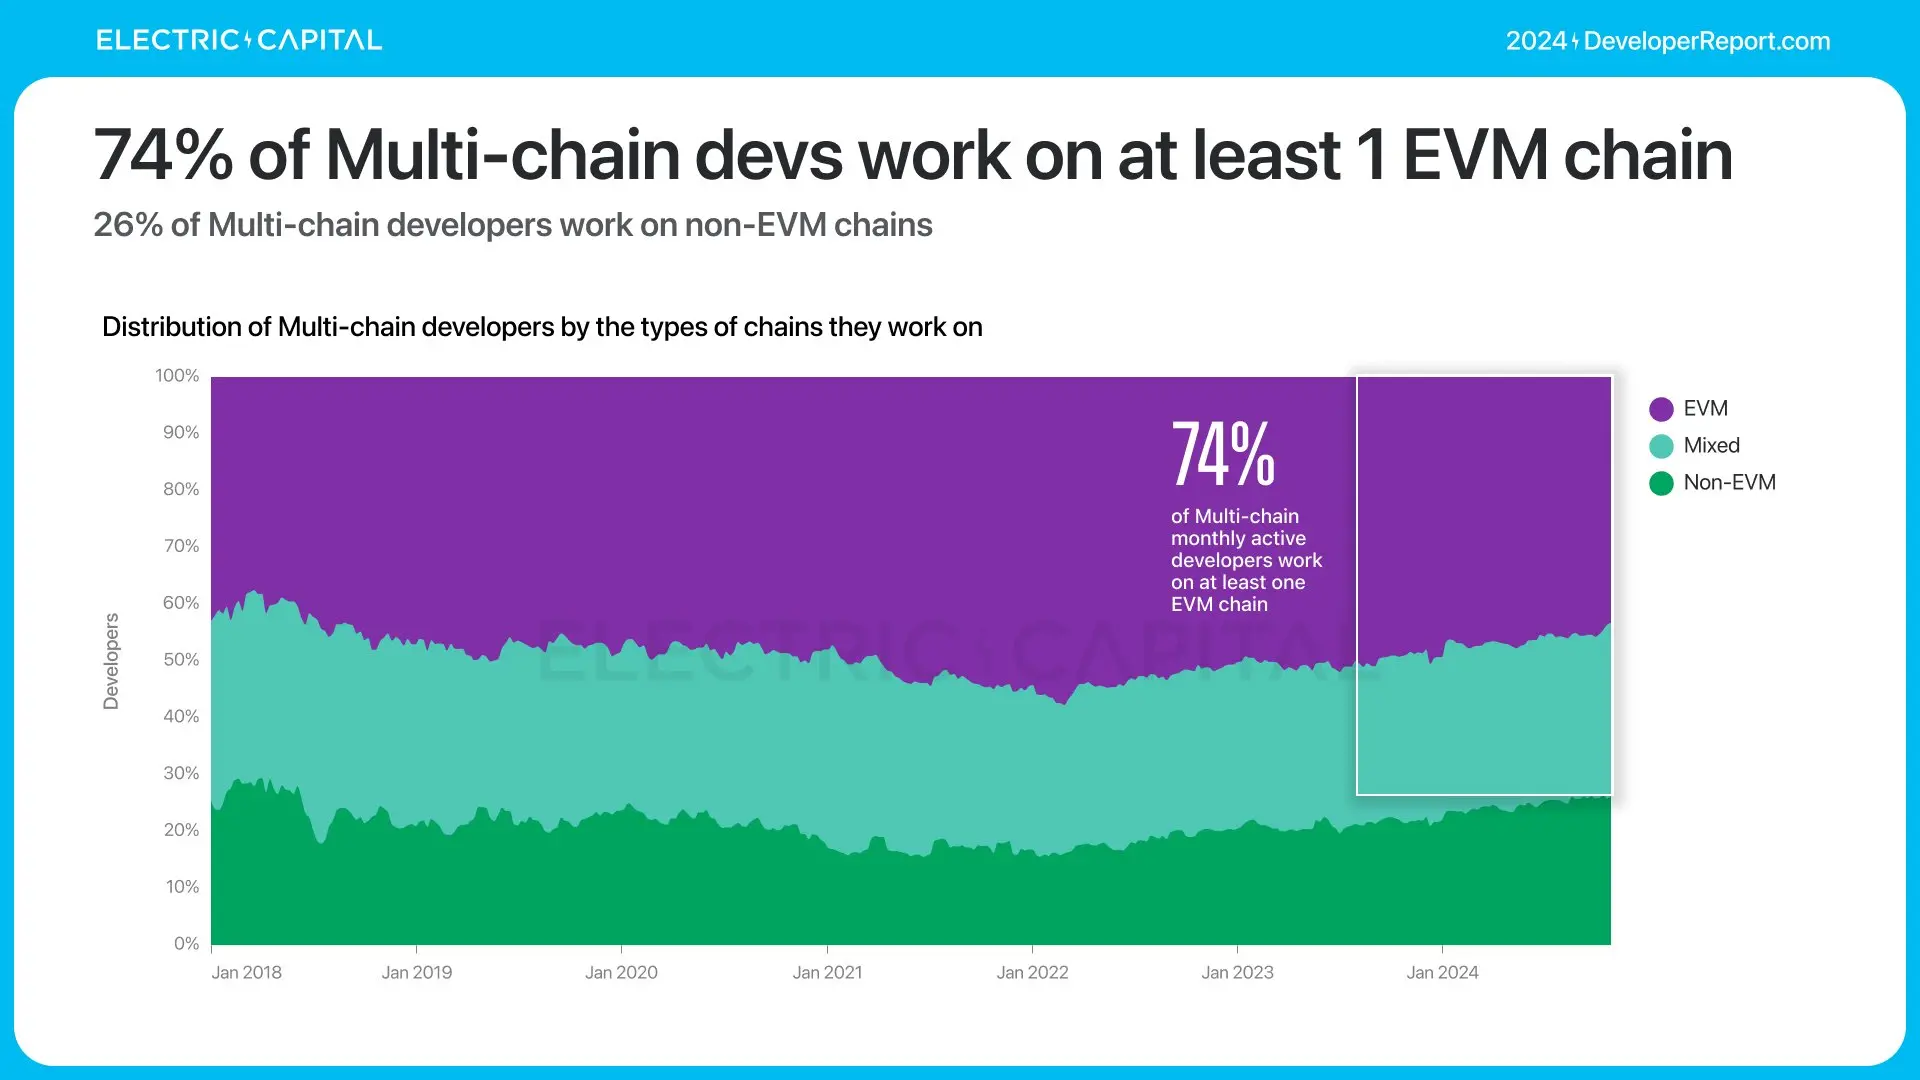
Many developers are active across multiple chains—now, one in three crypto developers works across multiple chains, and this trend is growing. The proportion of monthly active multi-chain developers has increased from less than 10% in 2015 to 34% in 2024.
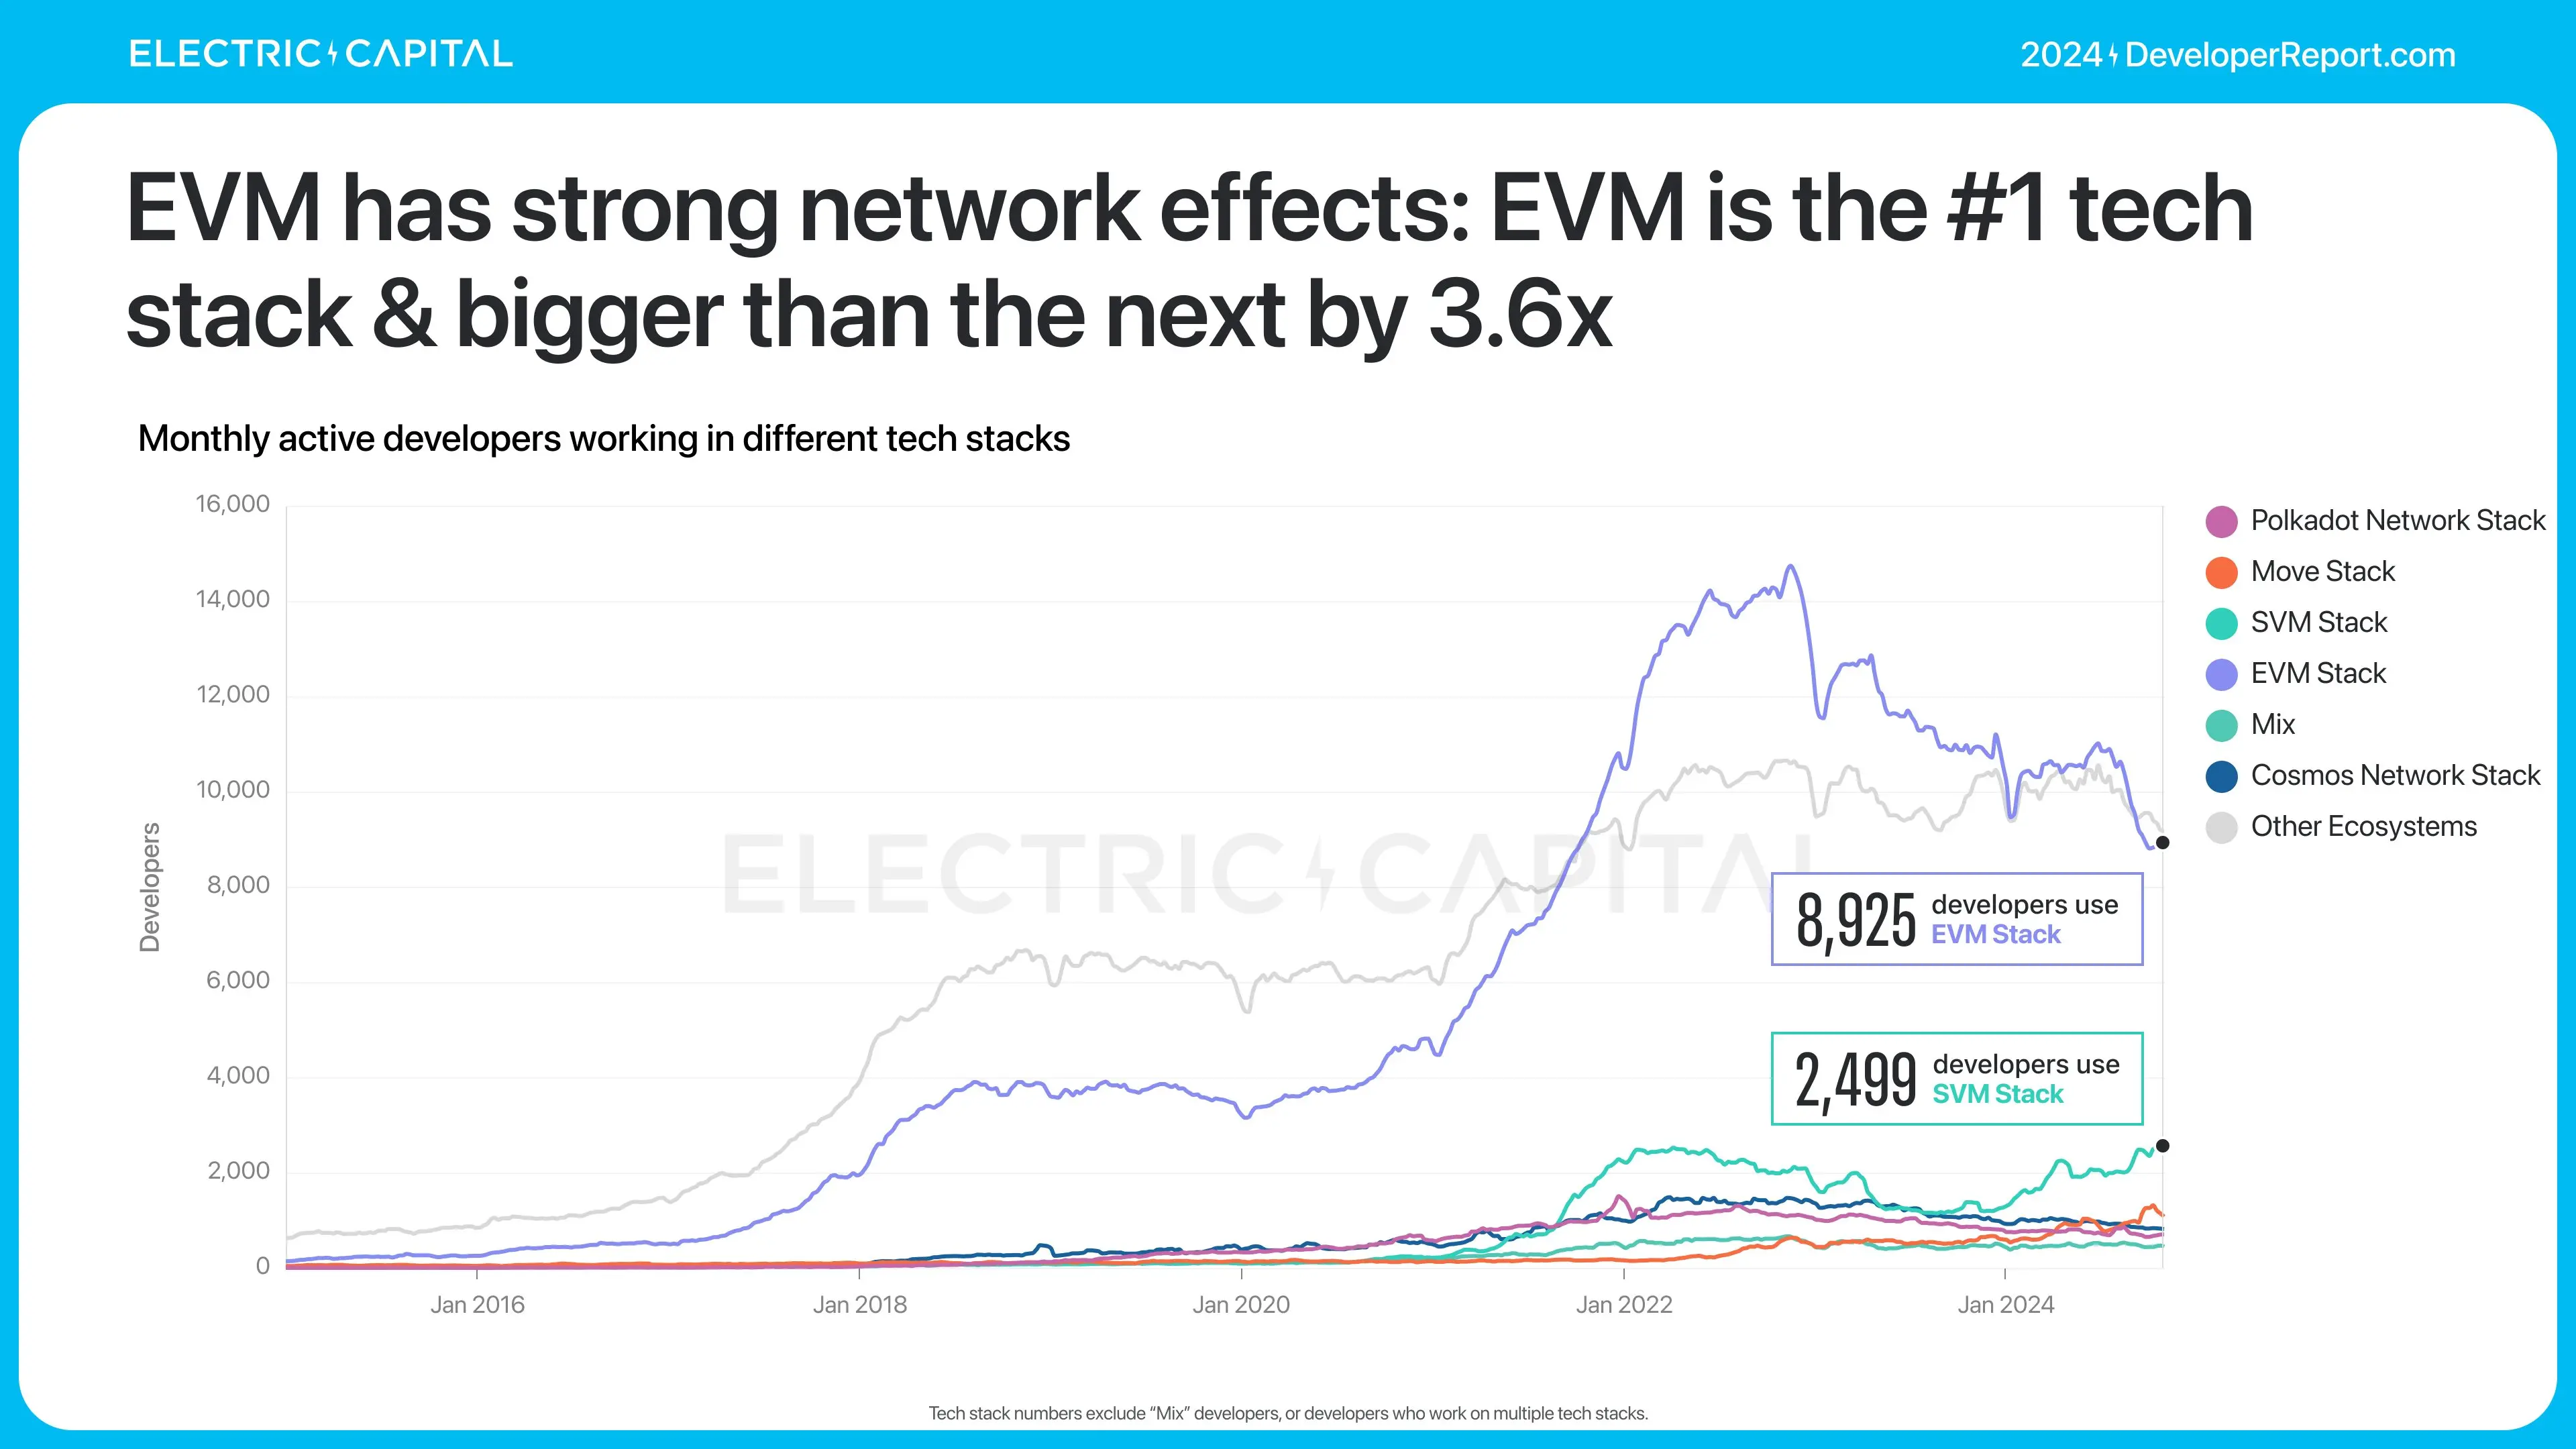
Chains with the most multi-chain developers share developer resources with Ethereum.
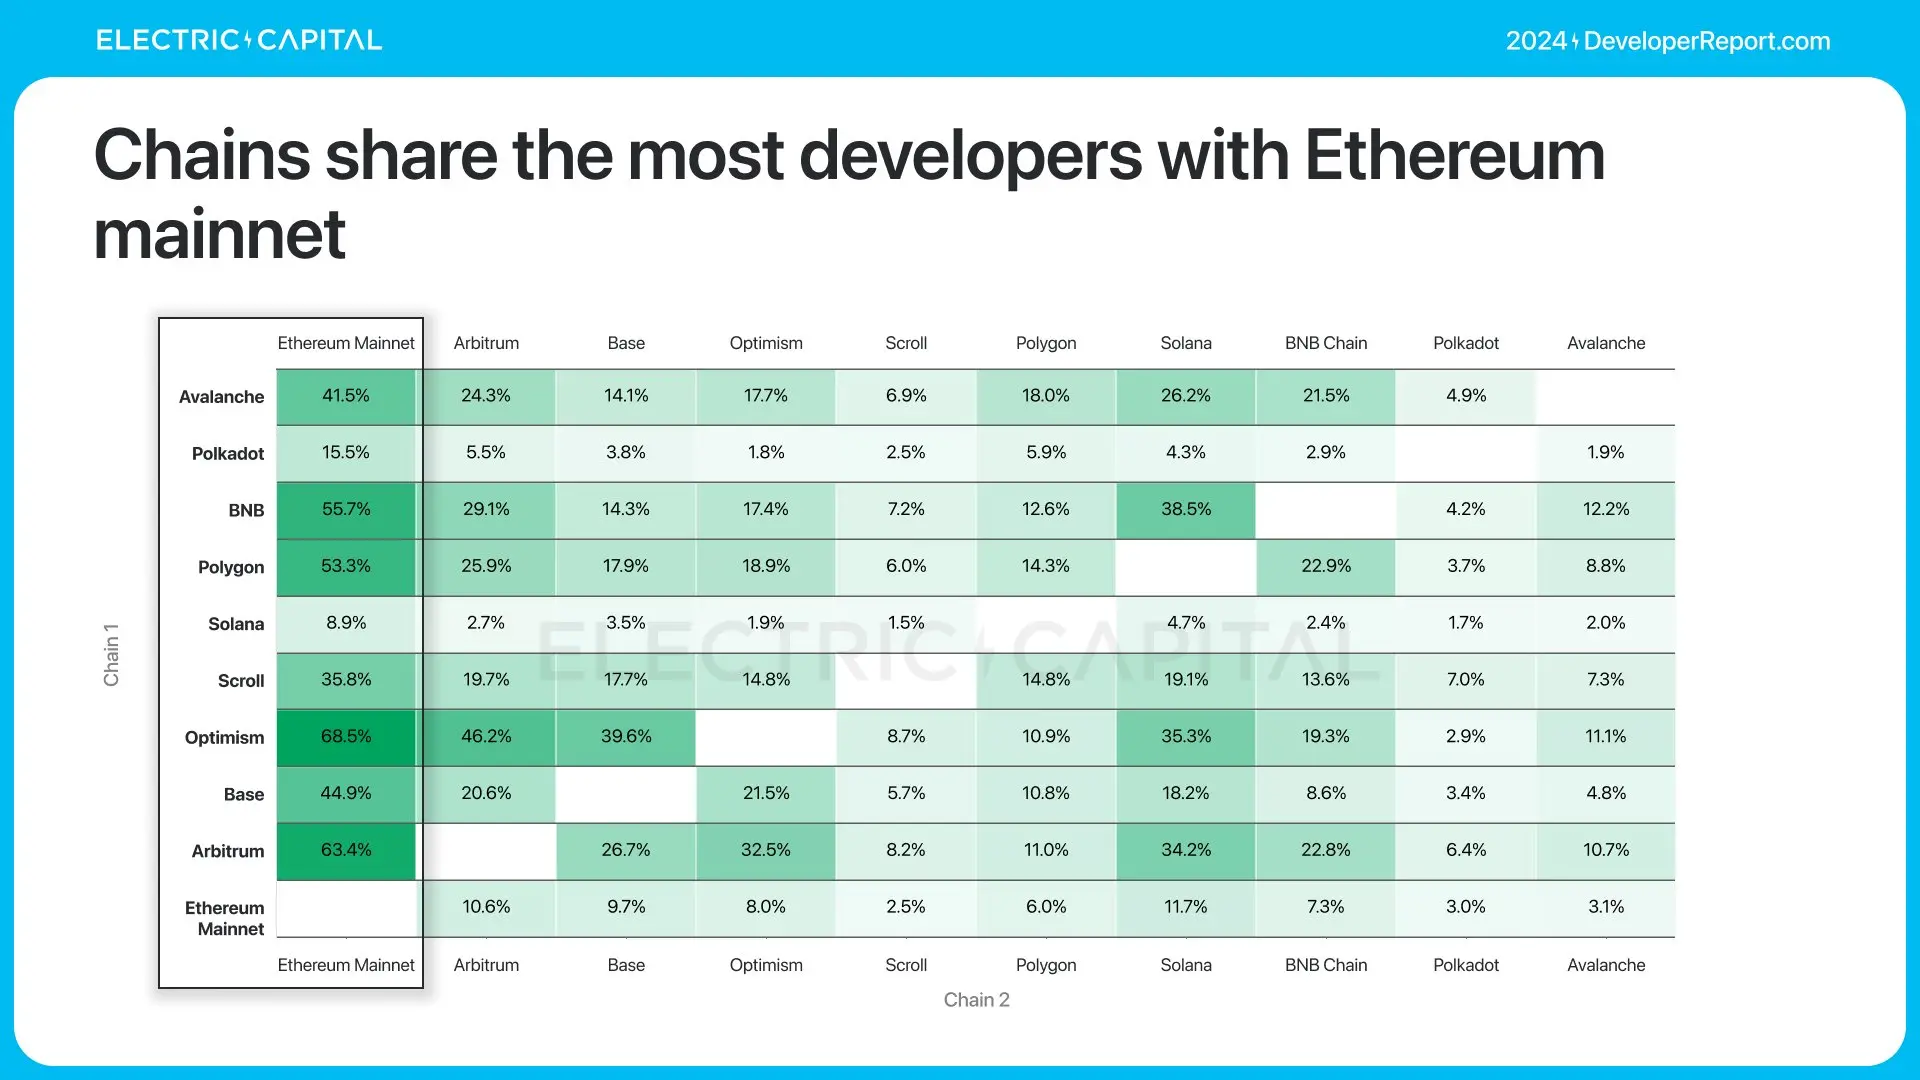
EVM chains share the most developers and have significant network effects: 74% of multi-chain developers work on EVM chains.
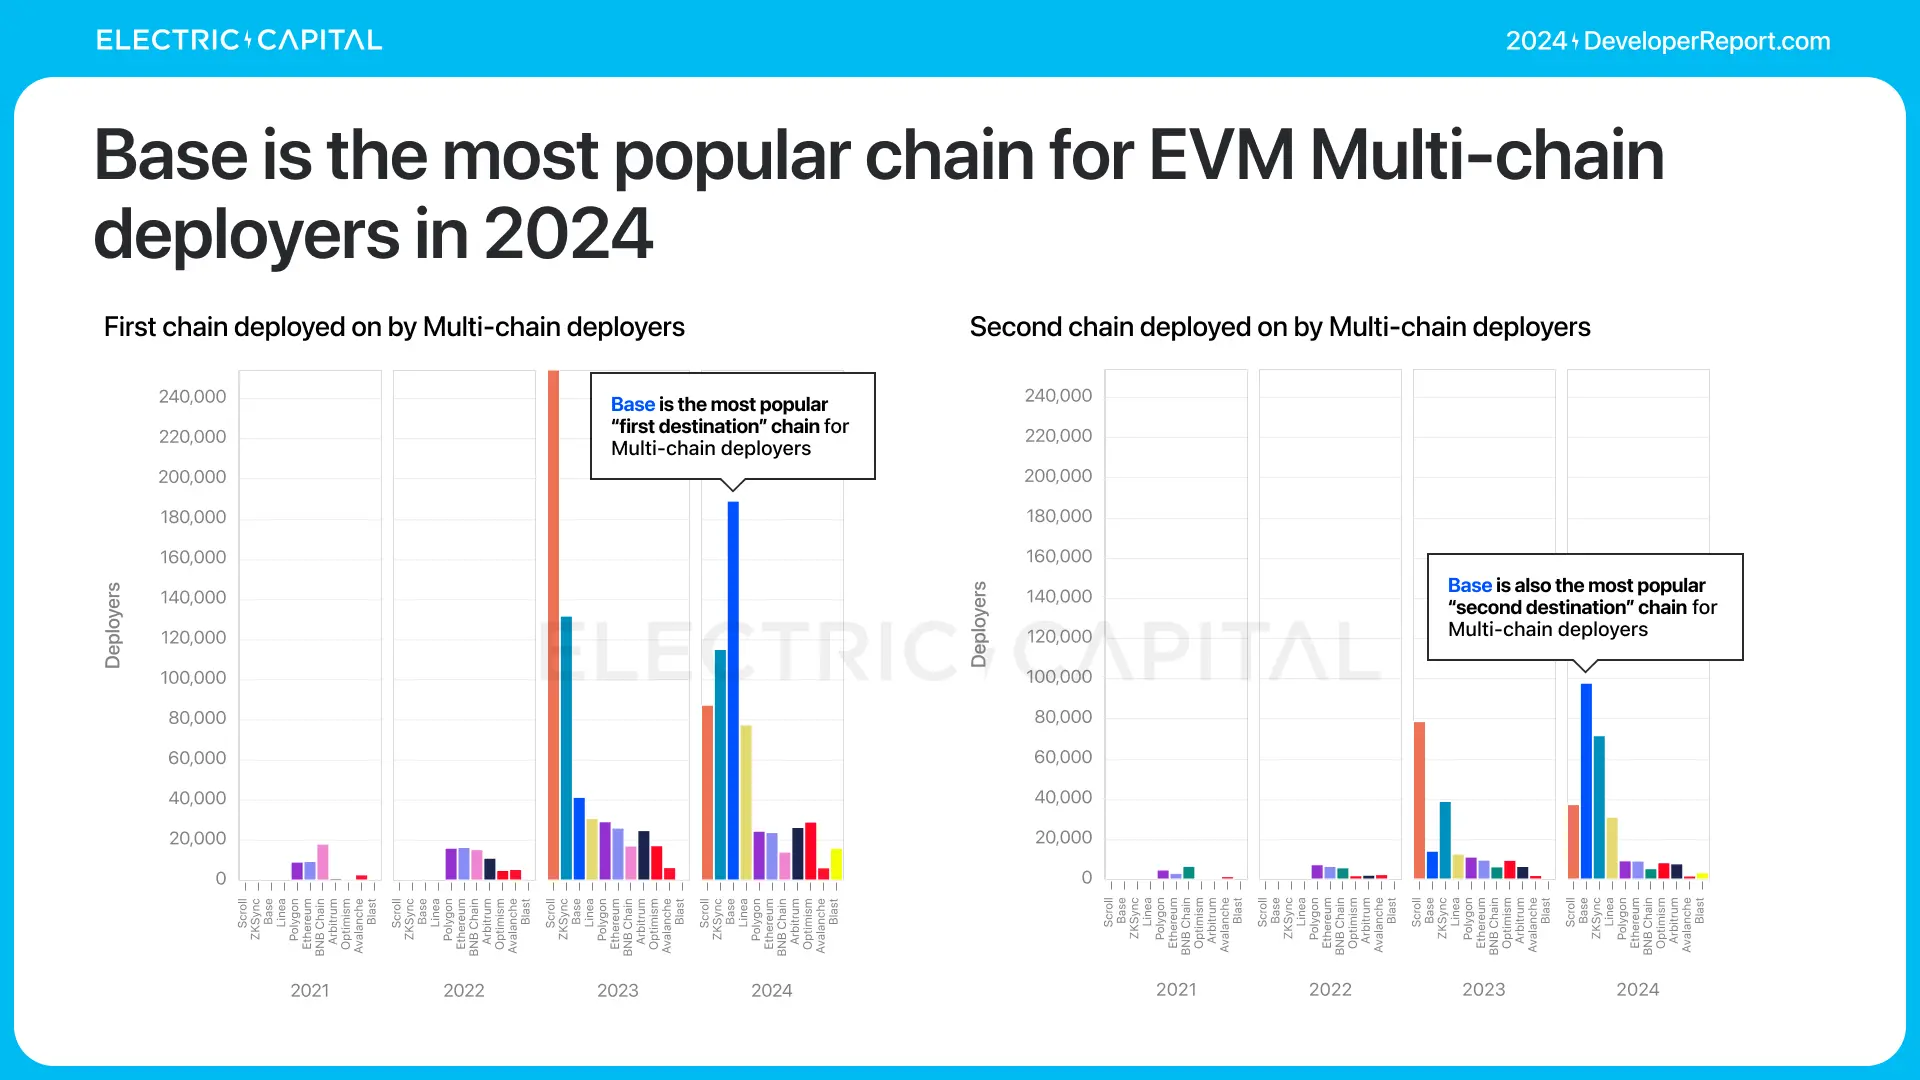
Since 2021, the proportion of EVM cross-chain deployers has increased fourfold.
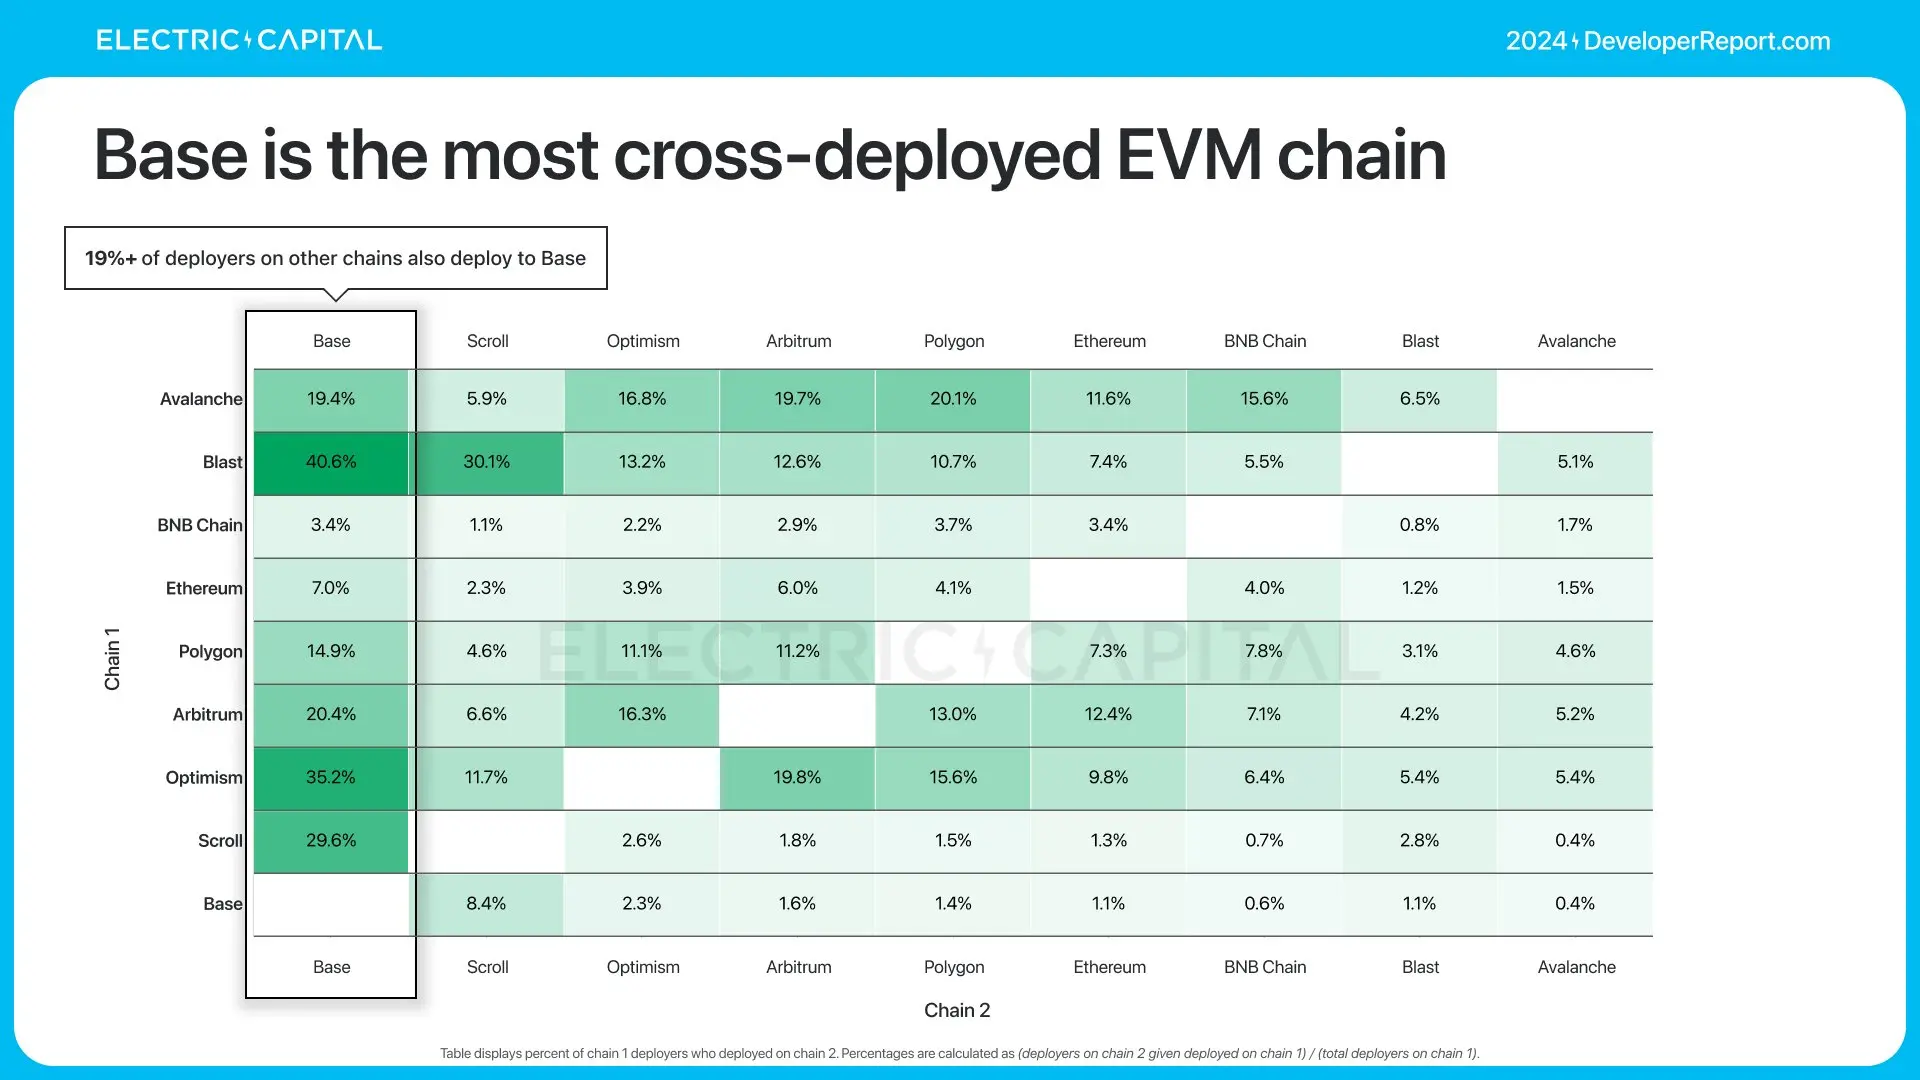
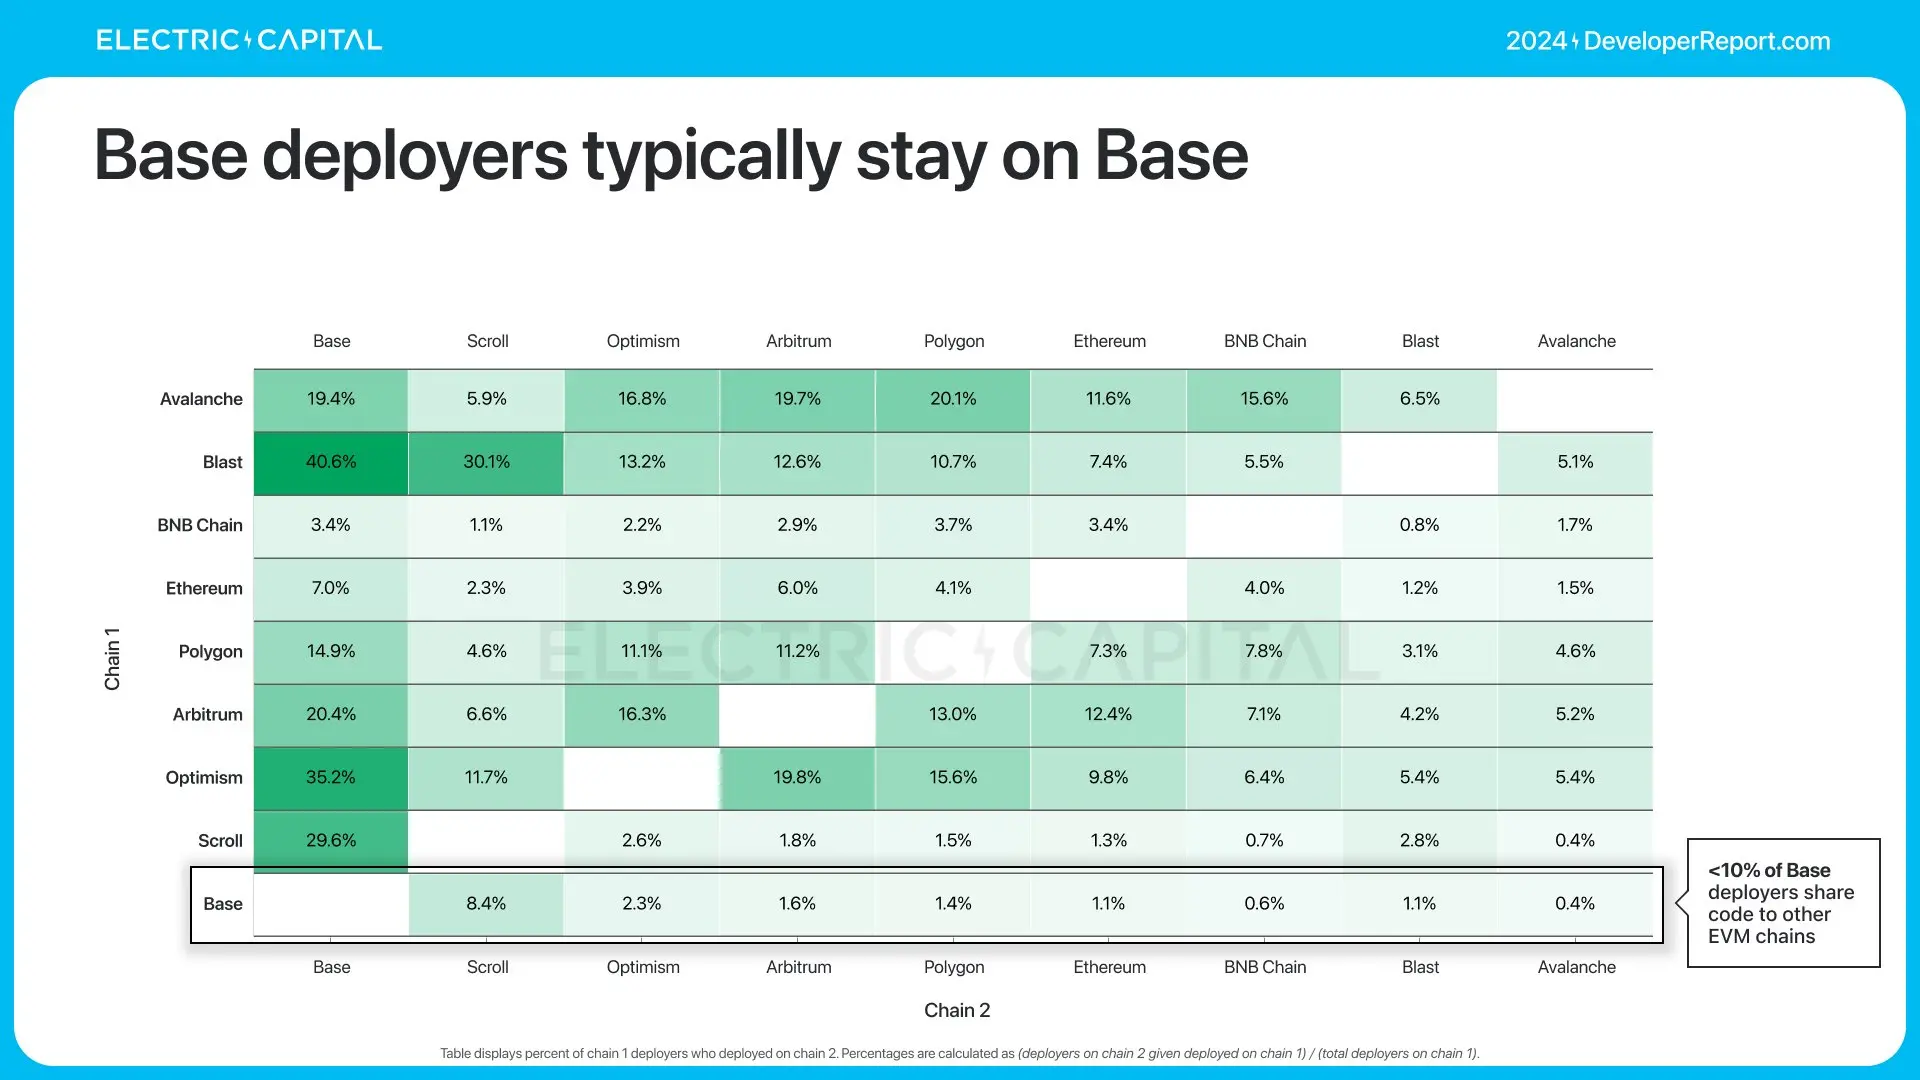
Base is the most popular chain for EVM multi-chain deployers in 2024, but deployers on Base tend to stay on the Base chain.
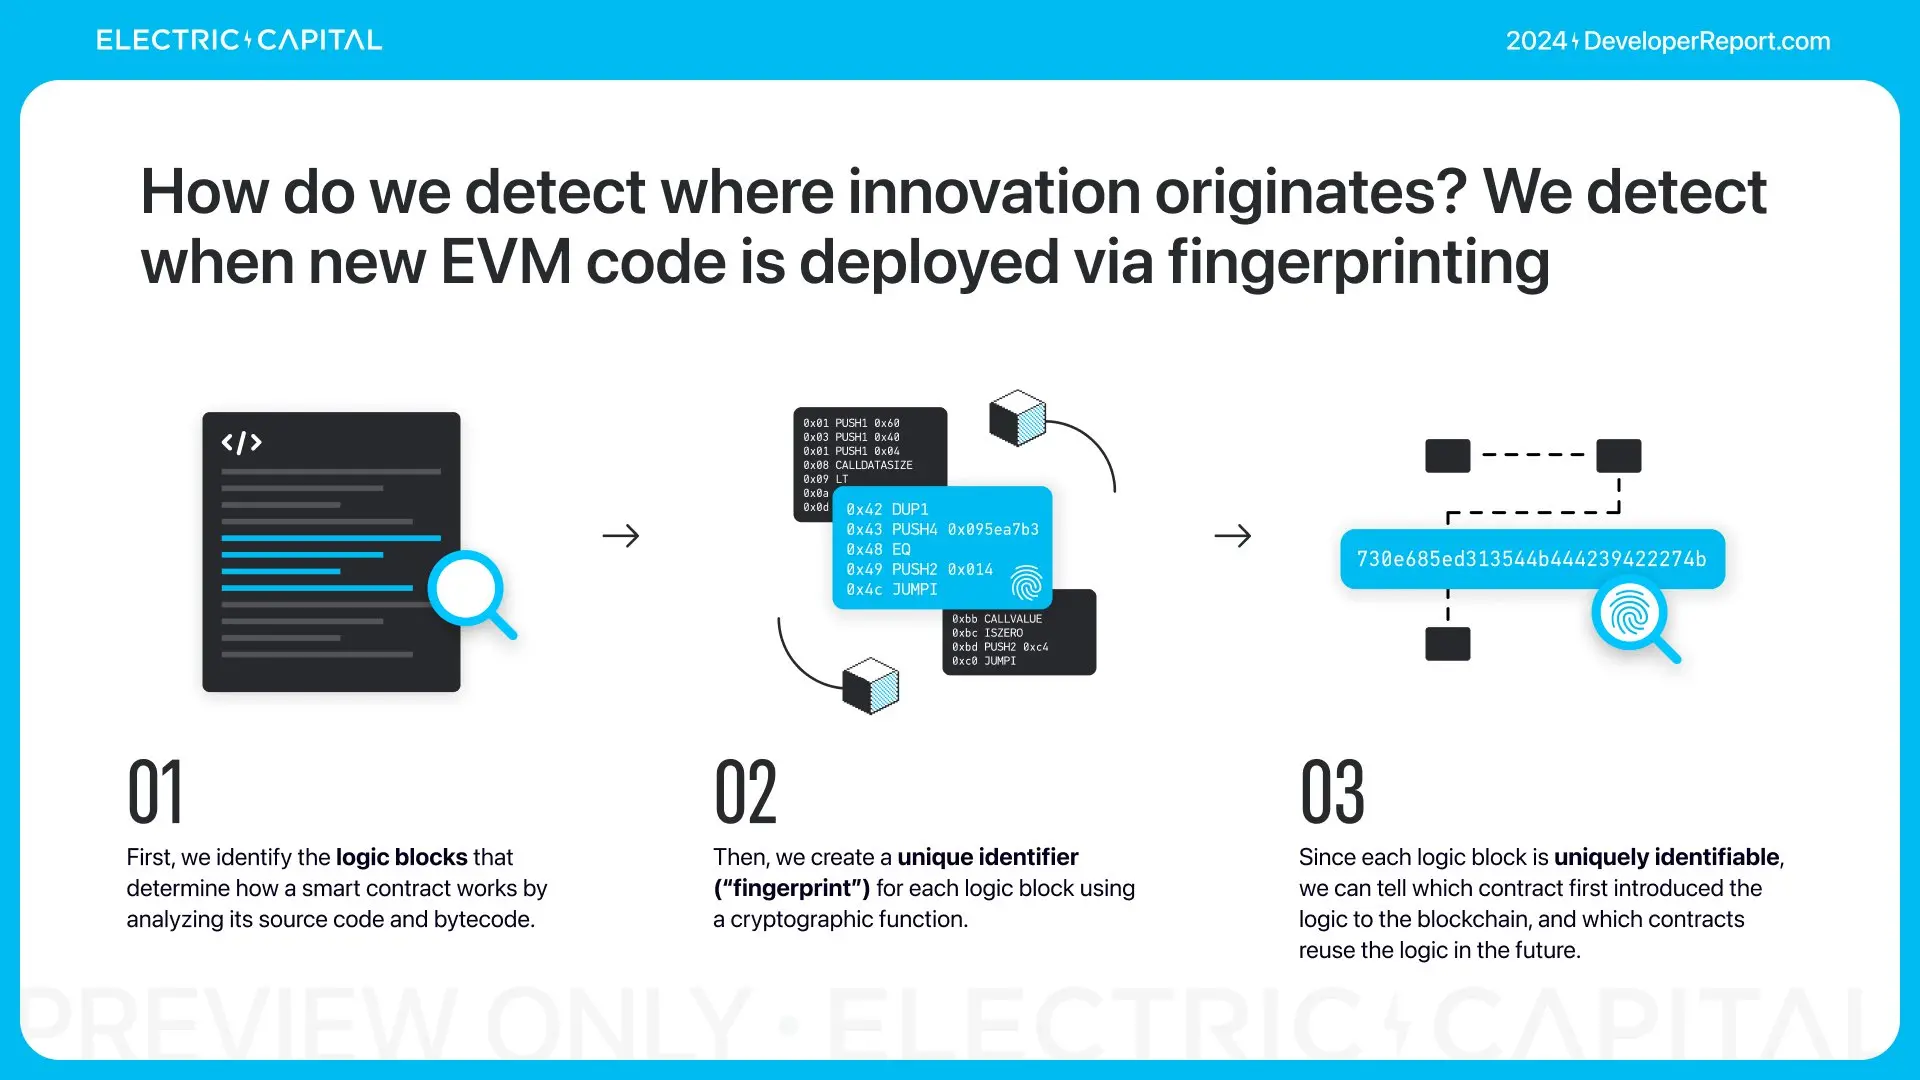
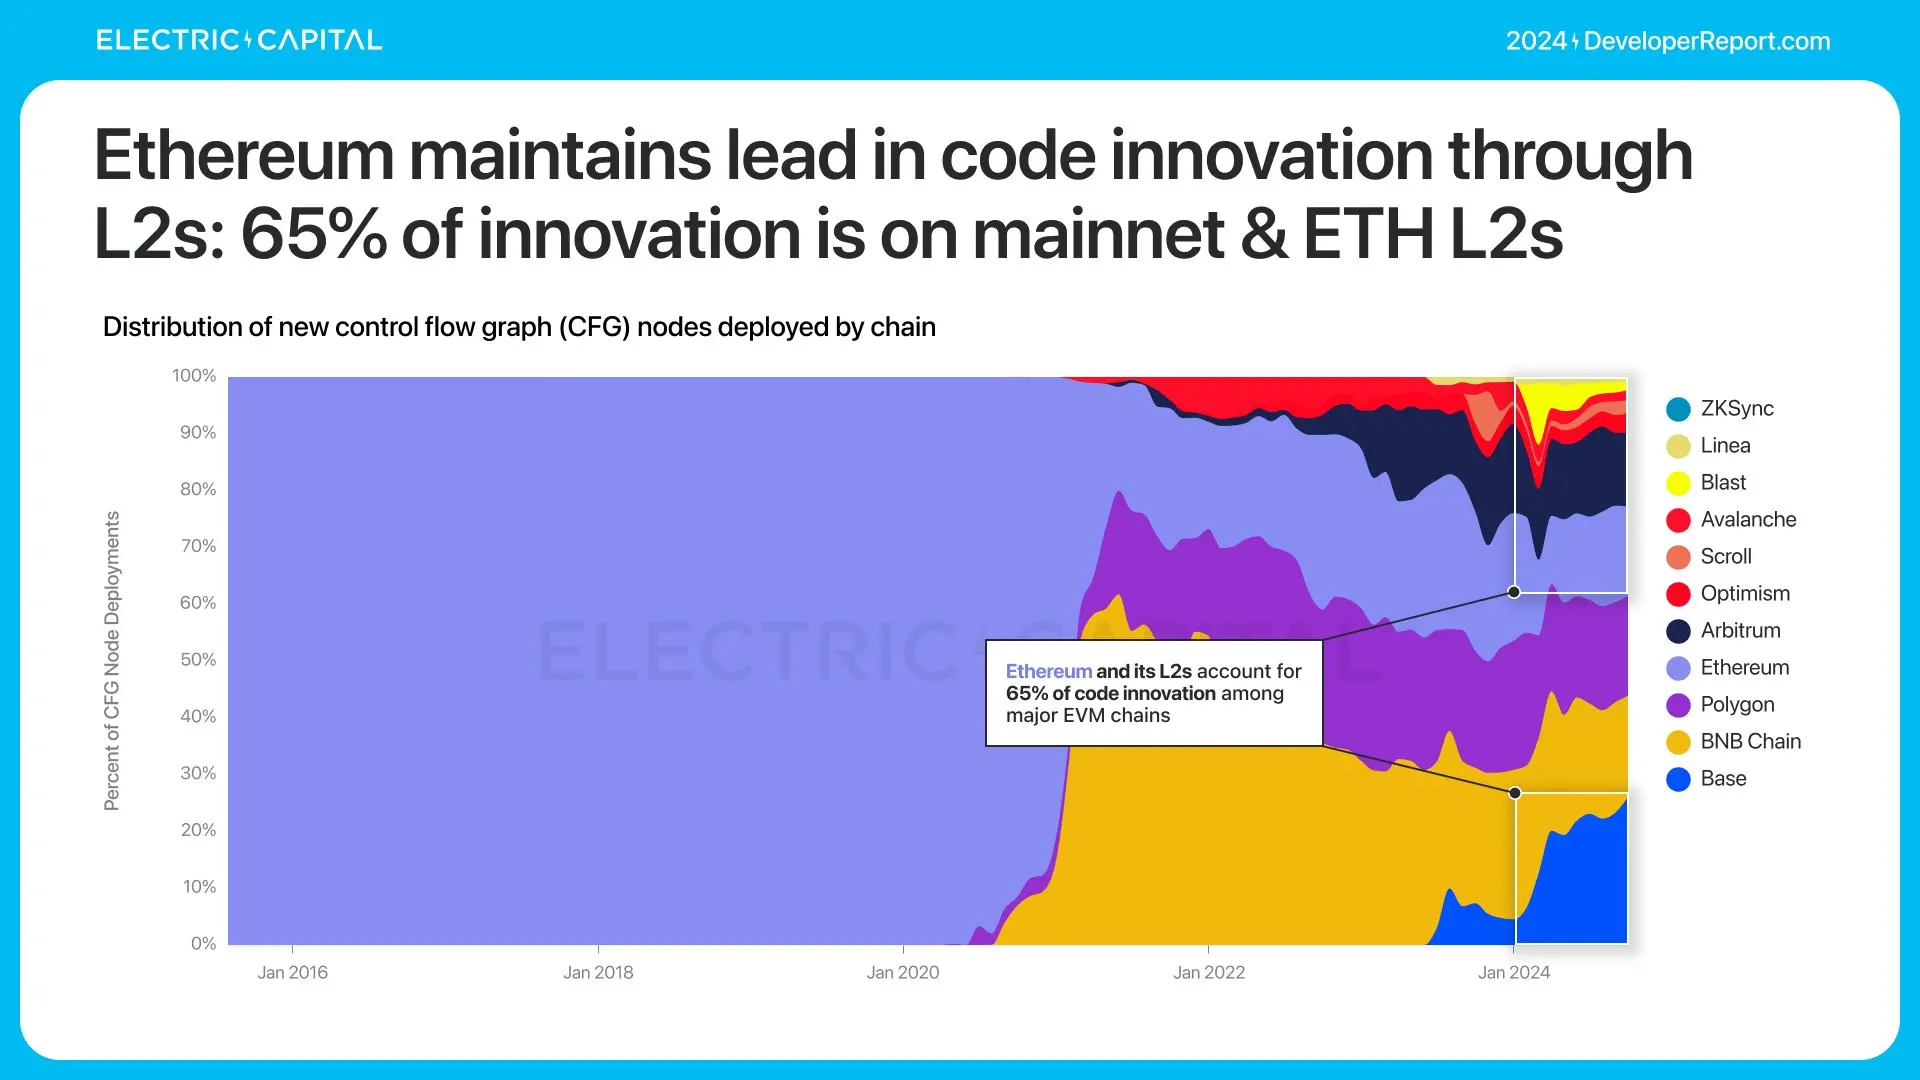
As deployers release code across multiple chains, where is most of the original code being written?
Before 2020, almost all original on-chain code logic on EVM was written on Ethereum.
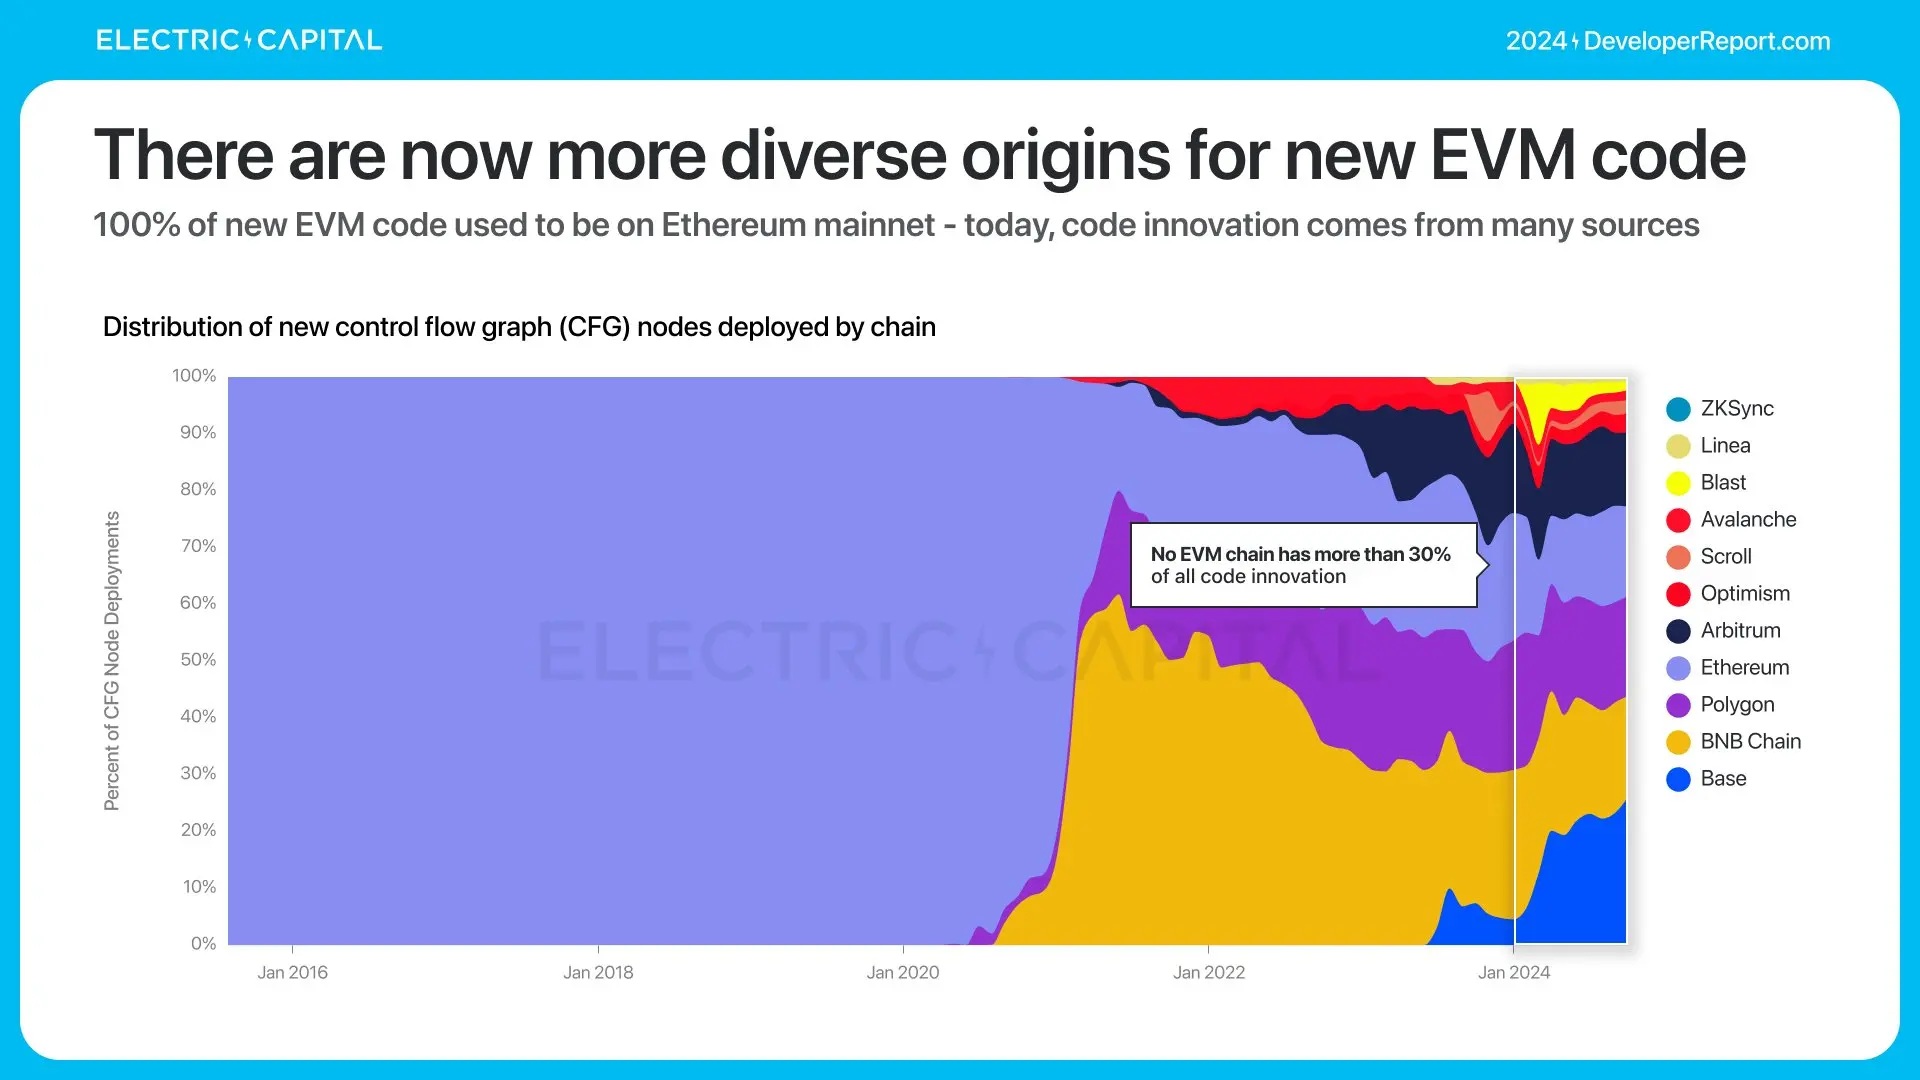
Currently, no EVM chain has a code innovation share exceeding 30%.
Base now accounts for 25% of all original on-chain code logic across EVM chains, the highest among all major EVM chains.
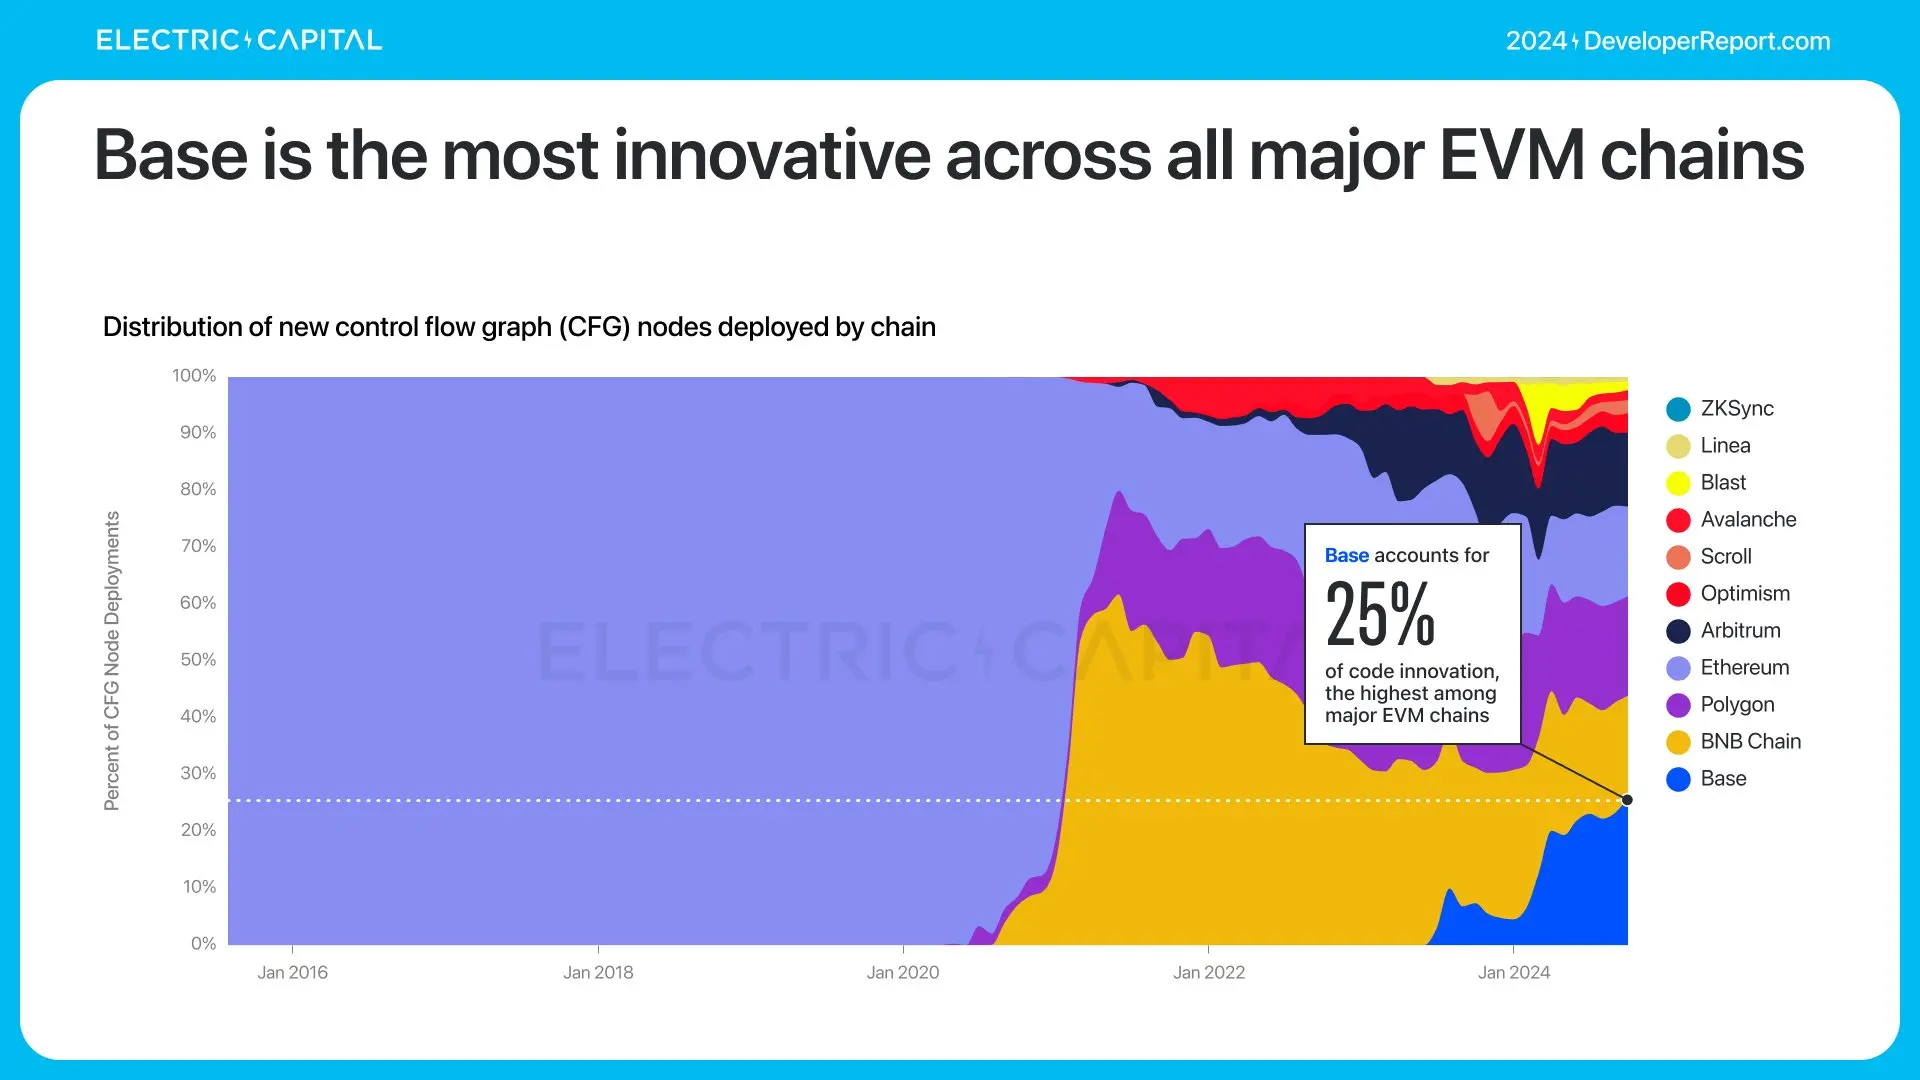
This is how the Ethereum ecosystem maintains its lead in code innovation—through L2 chains. 65% of innovation occurs on the mainnet and ETH L2 chains.
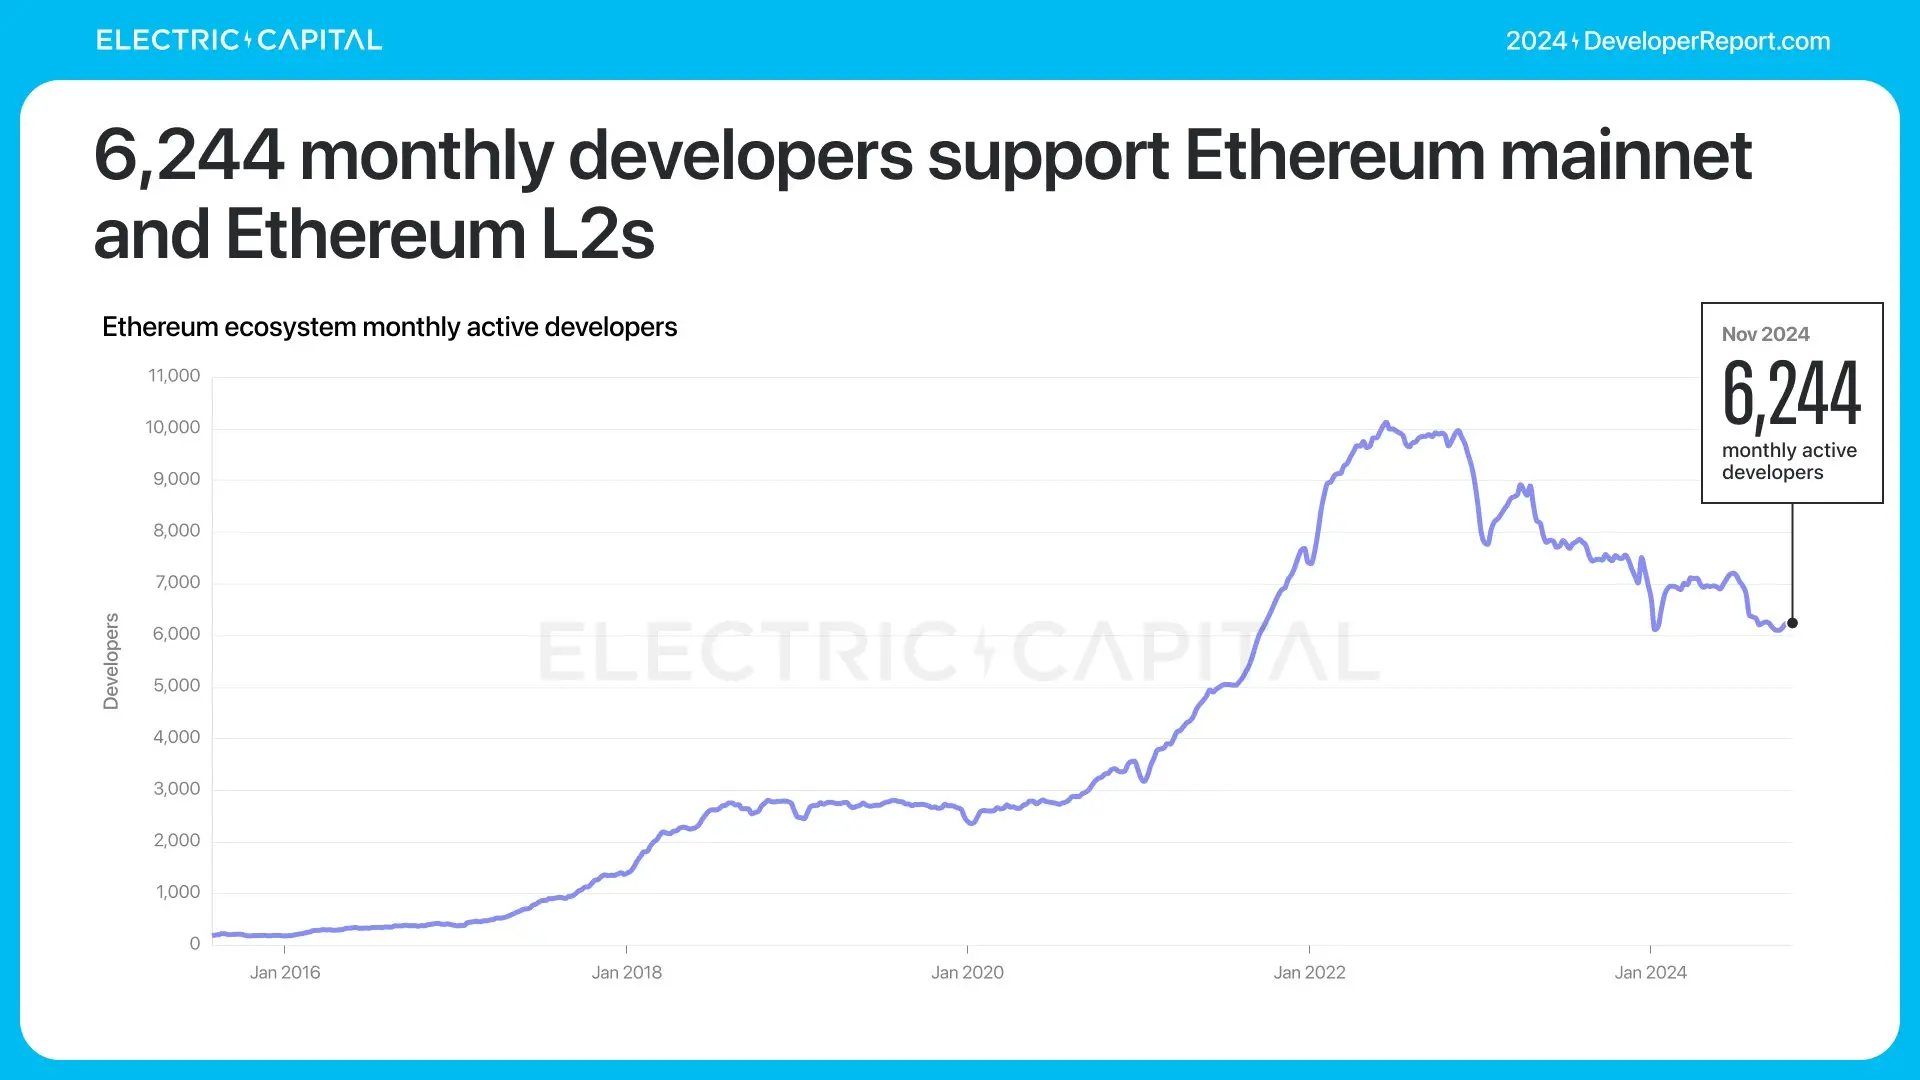
The Ethereum ecosystem demonstrates strong network effects through its dominance in EVM and multi-chain developers. How is this ecosystem performing?
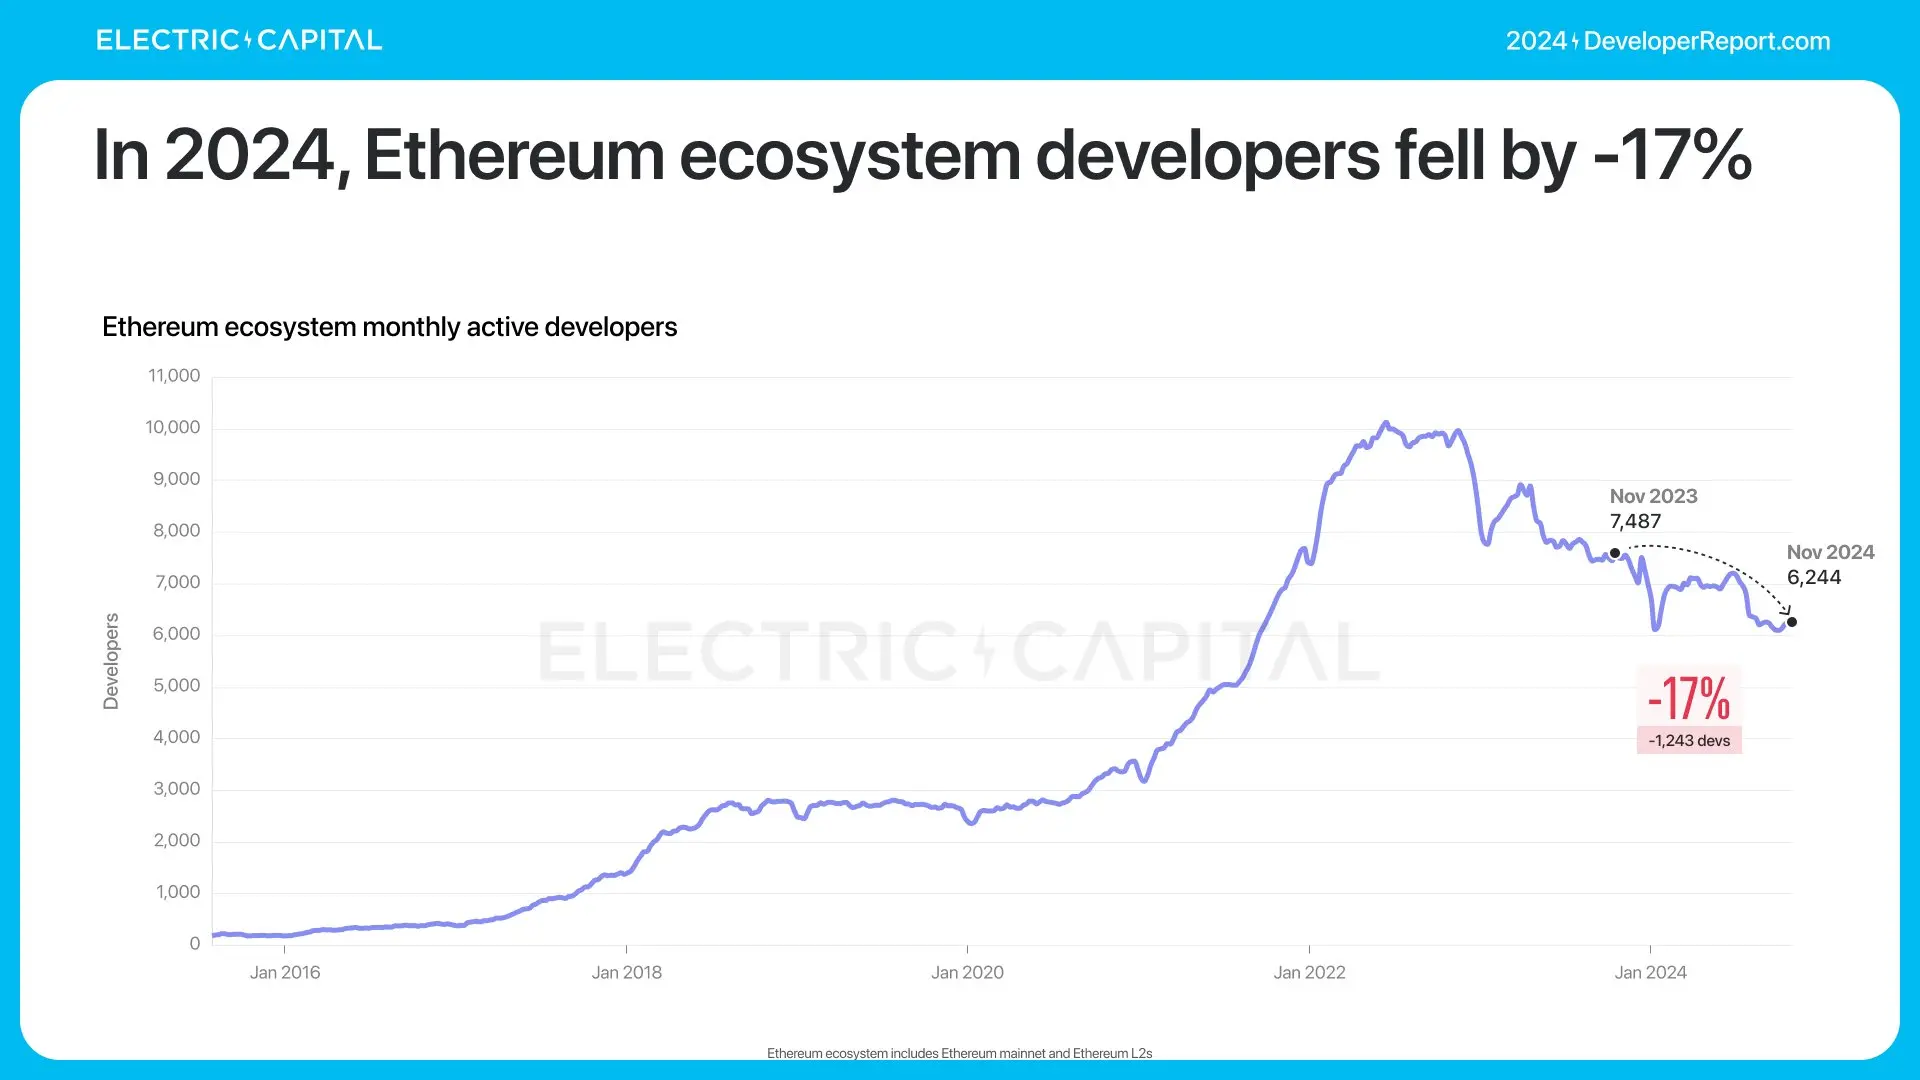
Ethereum has 6,244 monthly active developers, a year-over-year decrease of 17%.
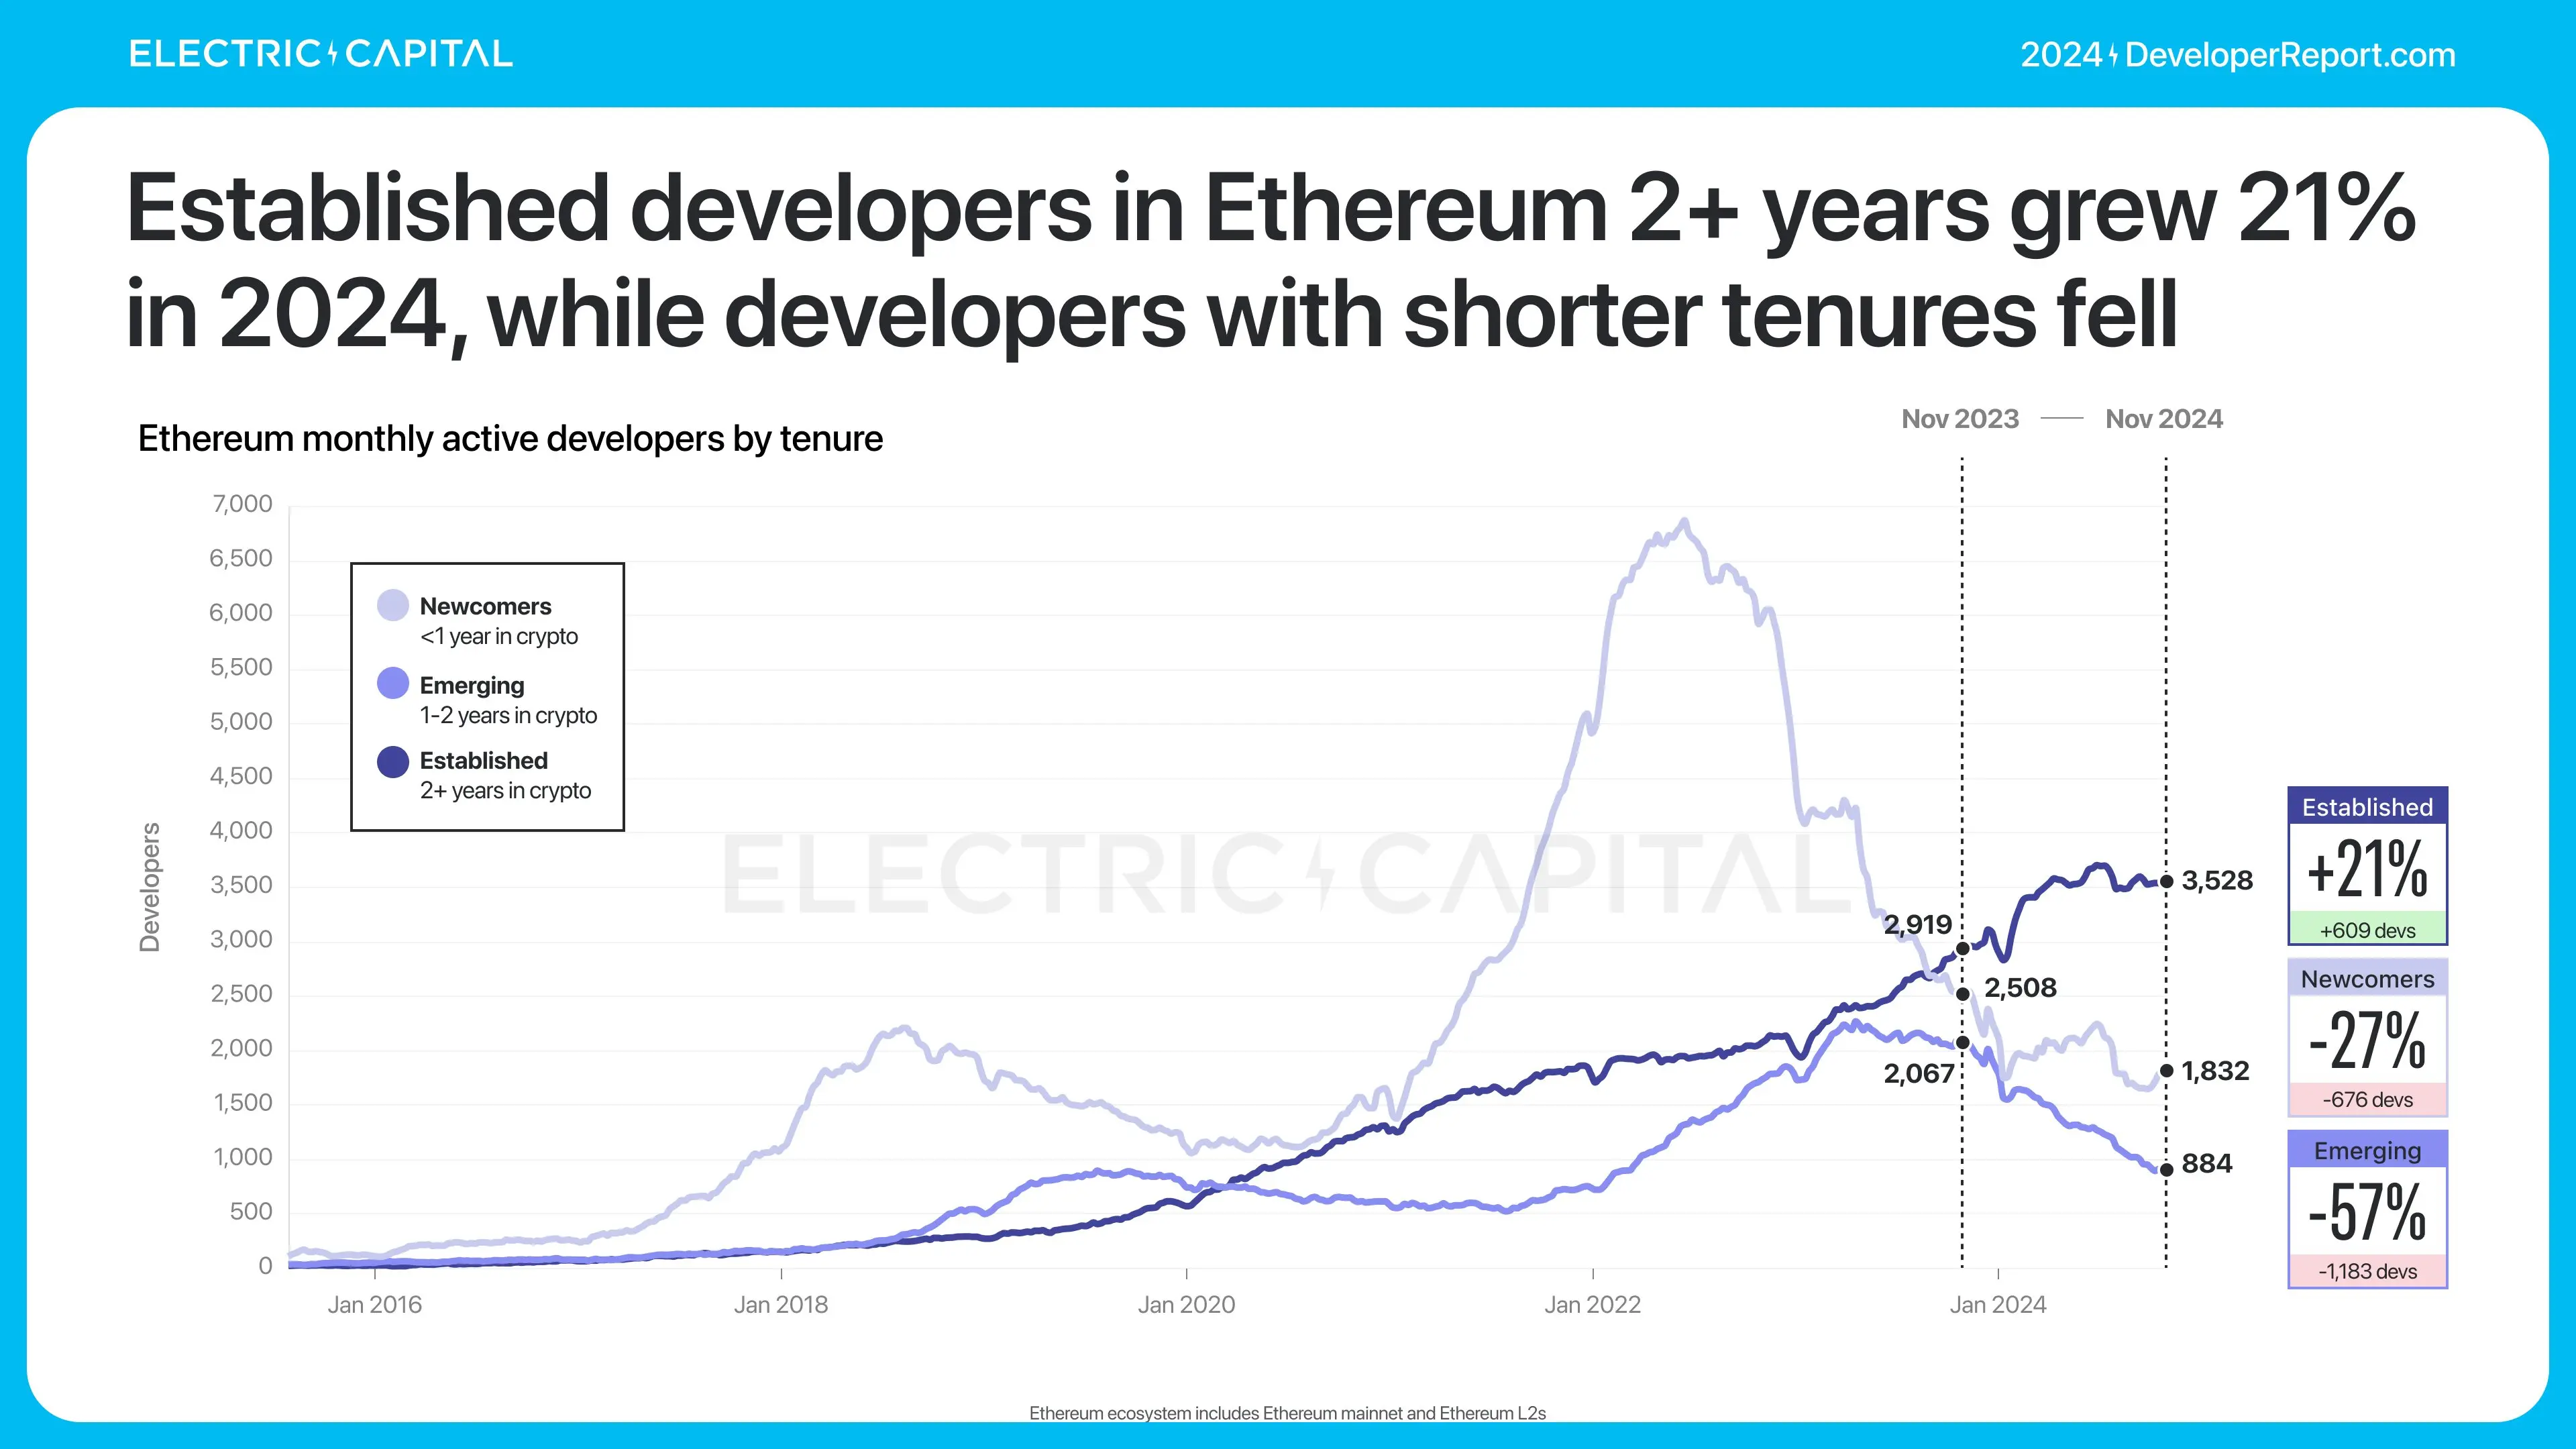
Most of the losses come from developers who joined after 2021. Among developers already working on Ethereum, those with over 2 years of experience have increased by 21%.
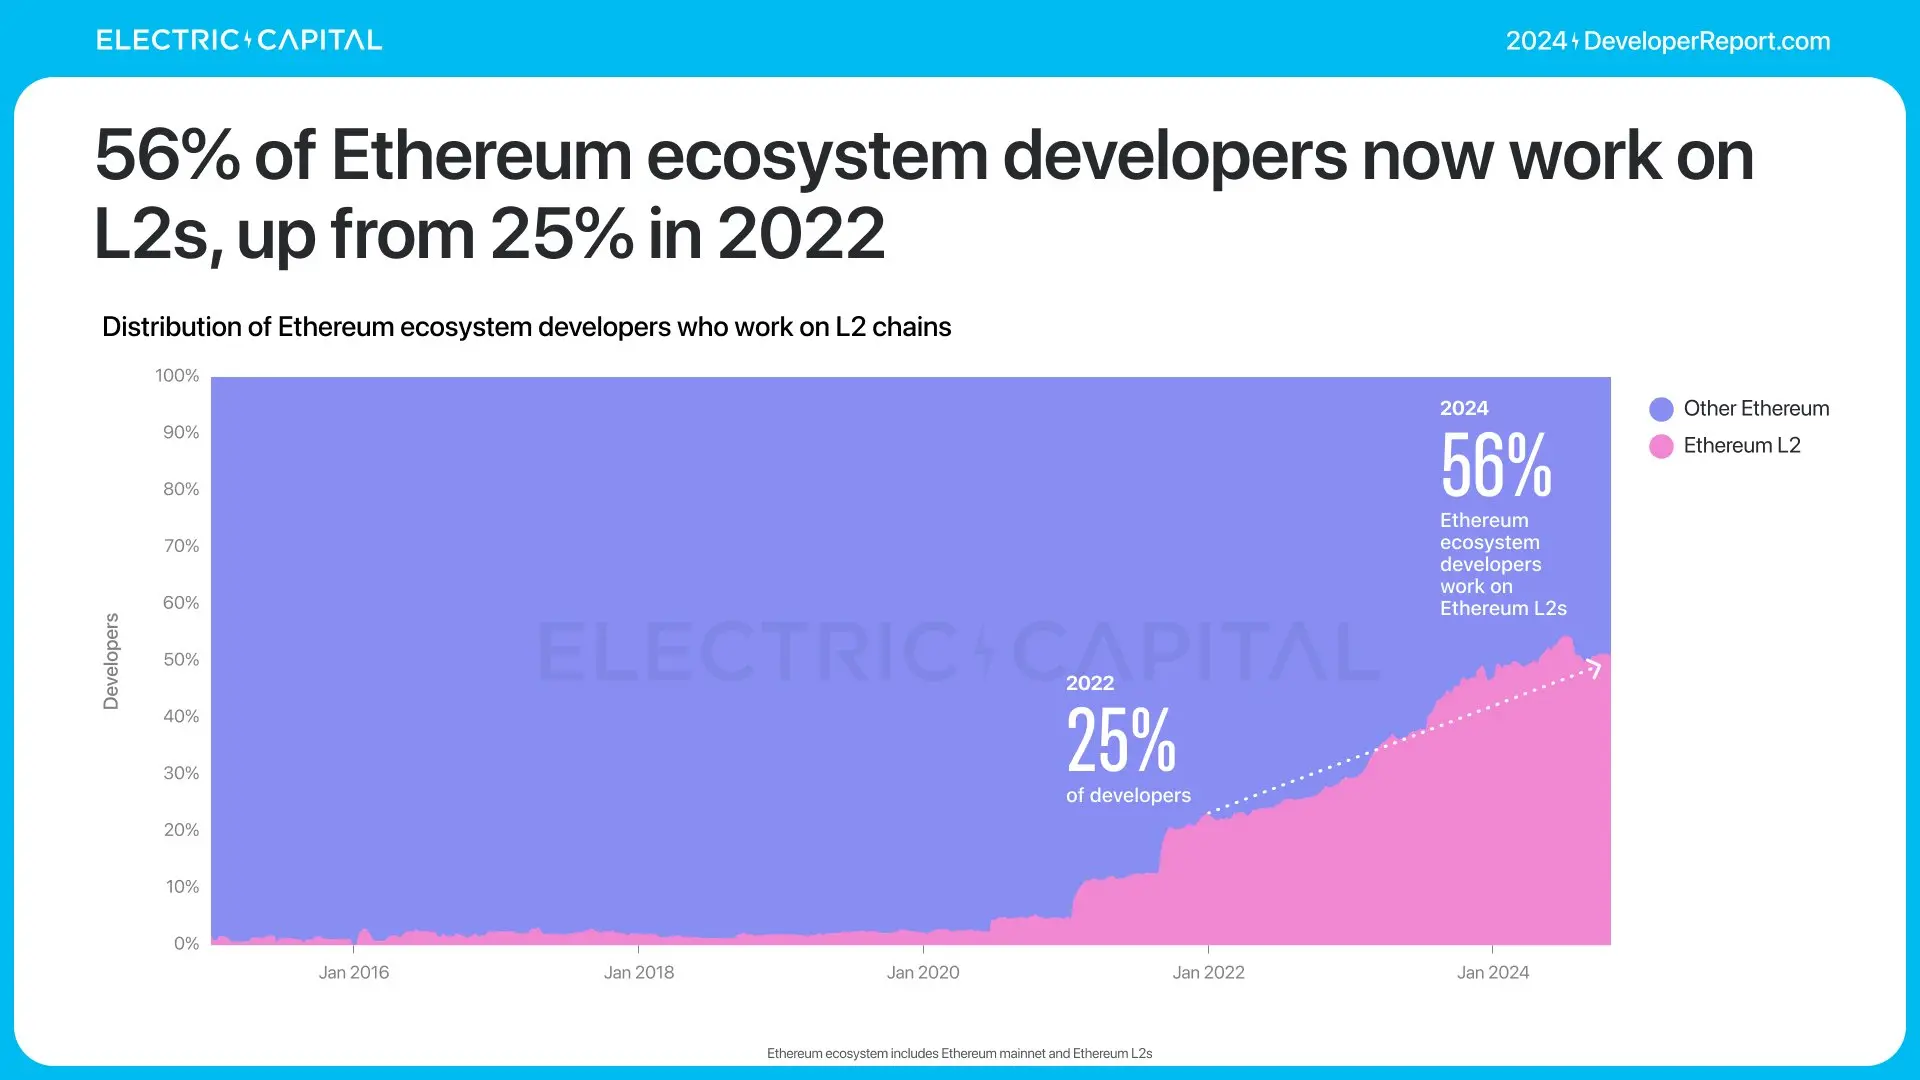
Now, more than half of Ethereum developers are working on Ethereum L2 chains, up from 25% in 2022.
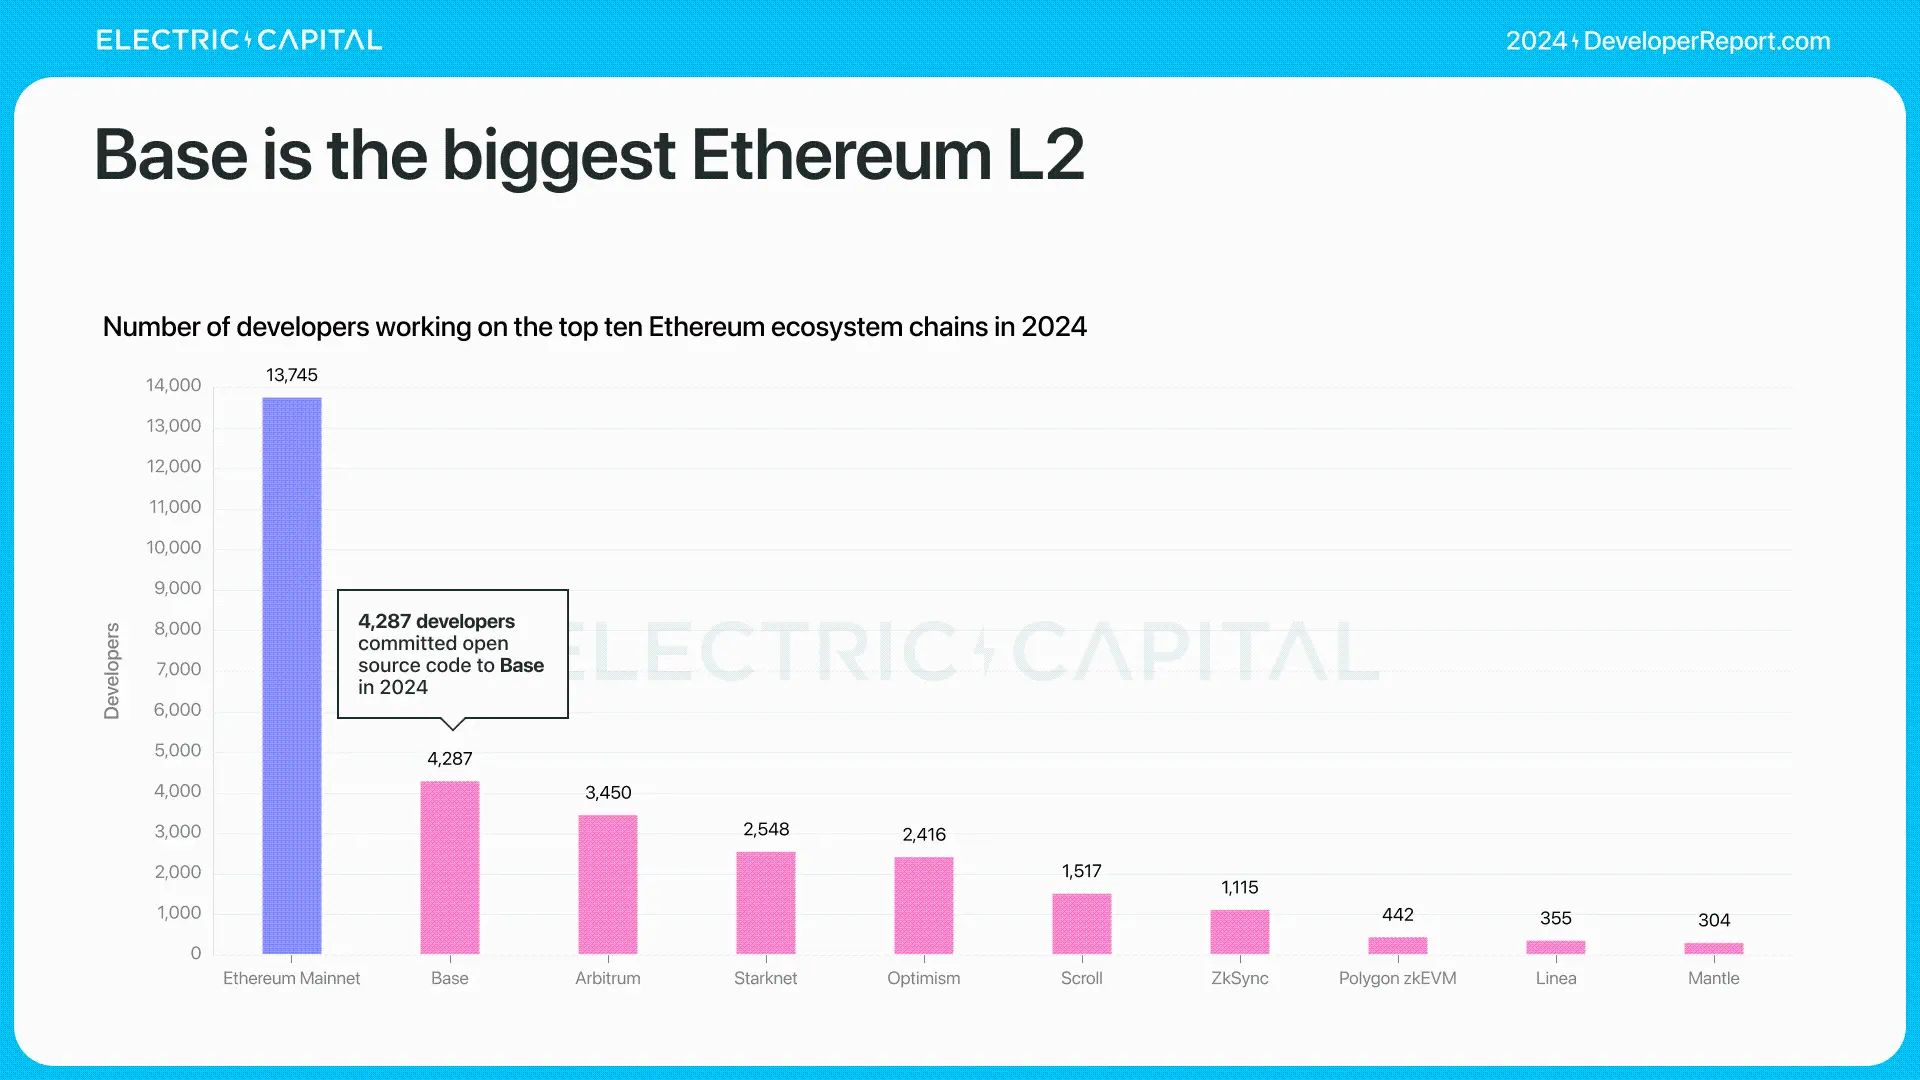
Ethereum L2 chains have experienced significant growth in developers over the past 4 years. The total number of monthly active developers on Ethereum L2 chains is 3,592, with an average annual growth of 67% since Arbitrum's launch in 2021.
Base is the largest Ethereum L2 chain.

Arbitrum, Starknet, and Optimism all have over 2,000 developers in 2024.
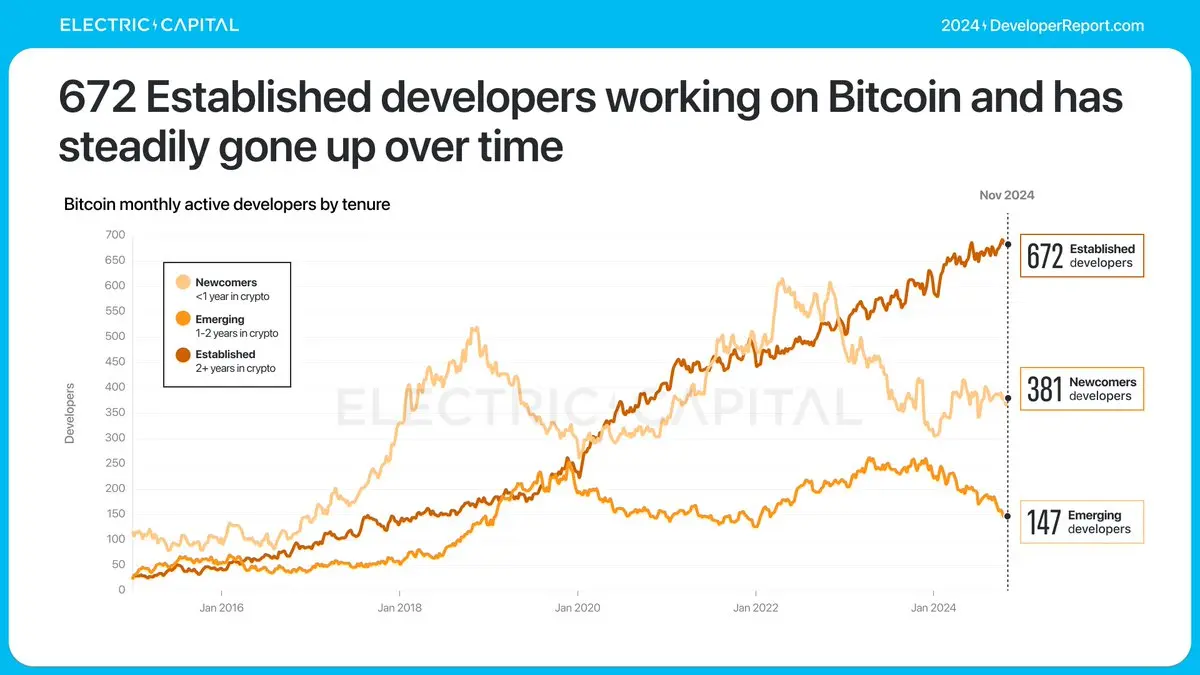
In 2024, Bitcoin has 1,200 monthly active developers, remaining stable.
Experienced Bitcoin developers (those with over 2 years in Bitcoin development) are steadily increasing. Currently, the number of monthly active experienced Bitcoin developers has reached a new high of 672.
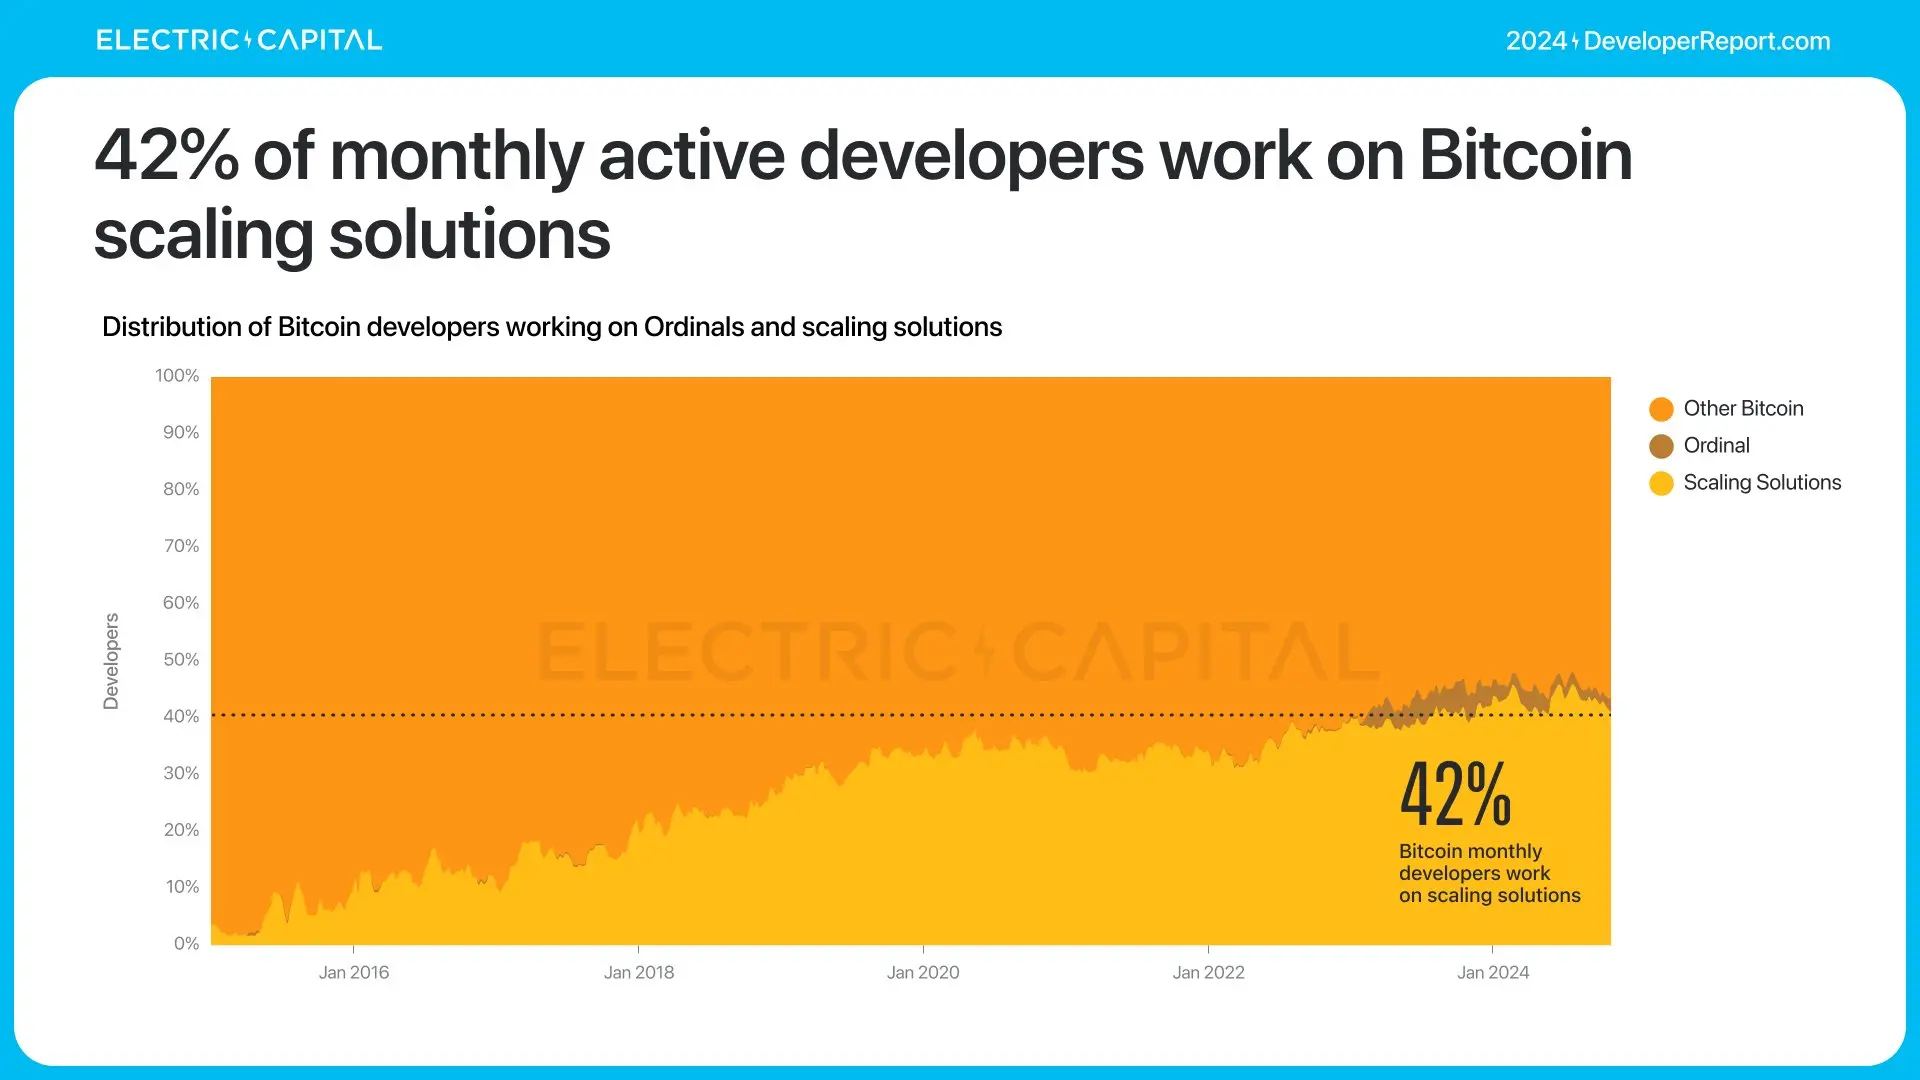
42% of Bitcoin developers—almost half—are working on Bitcoin scaling solutions.
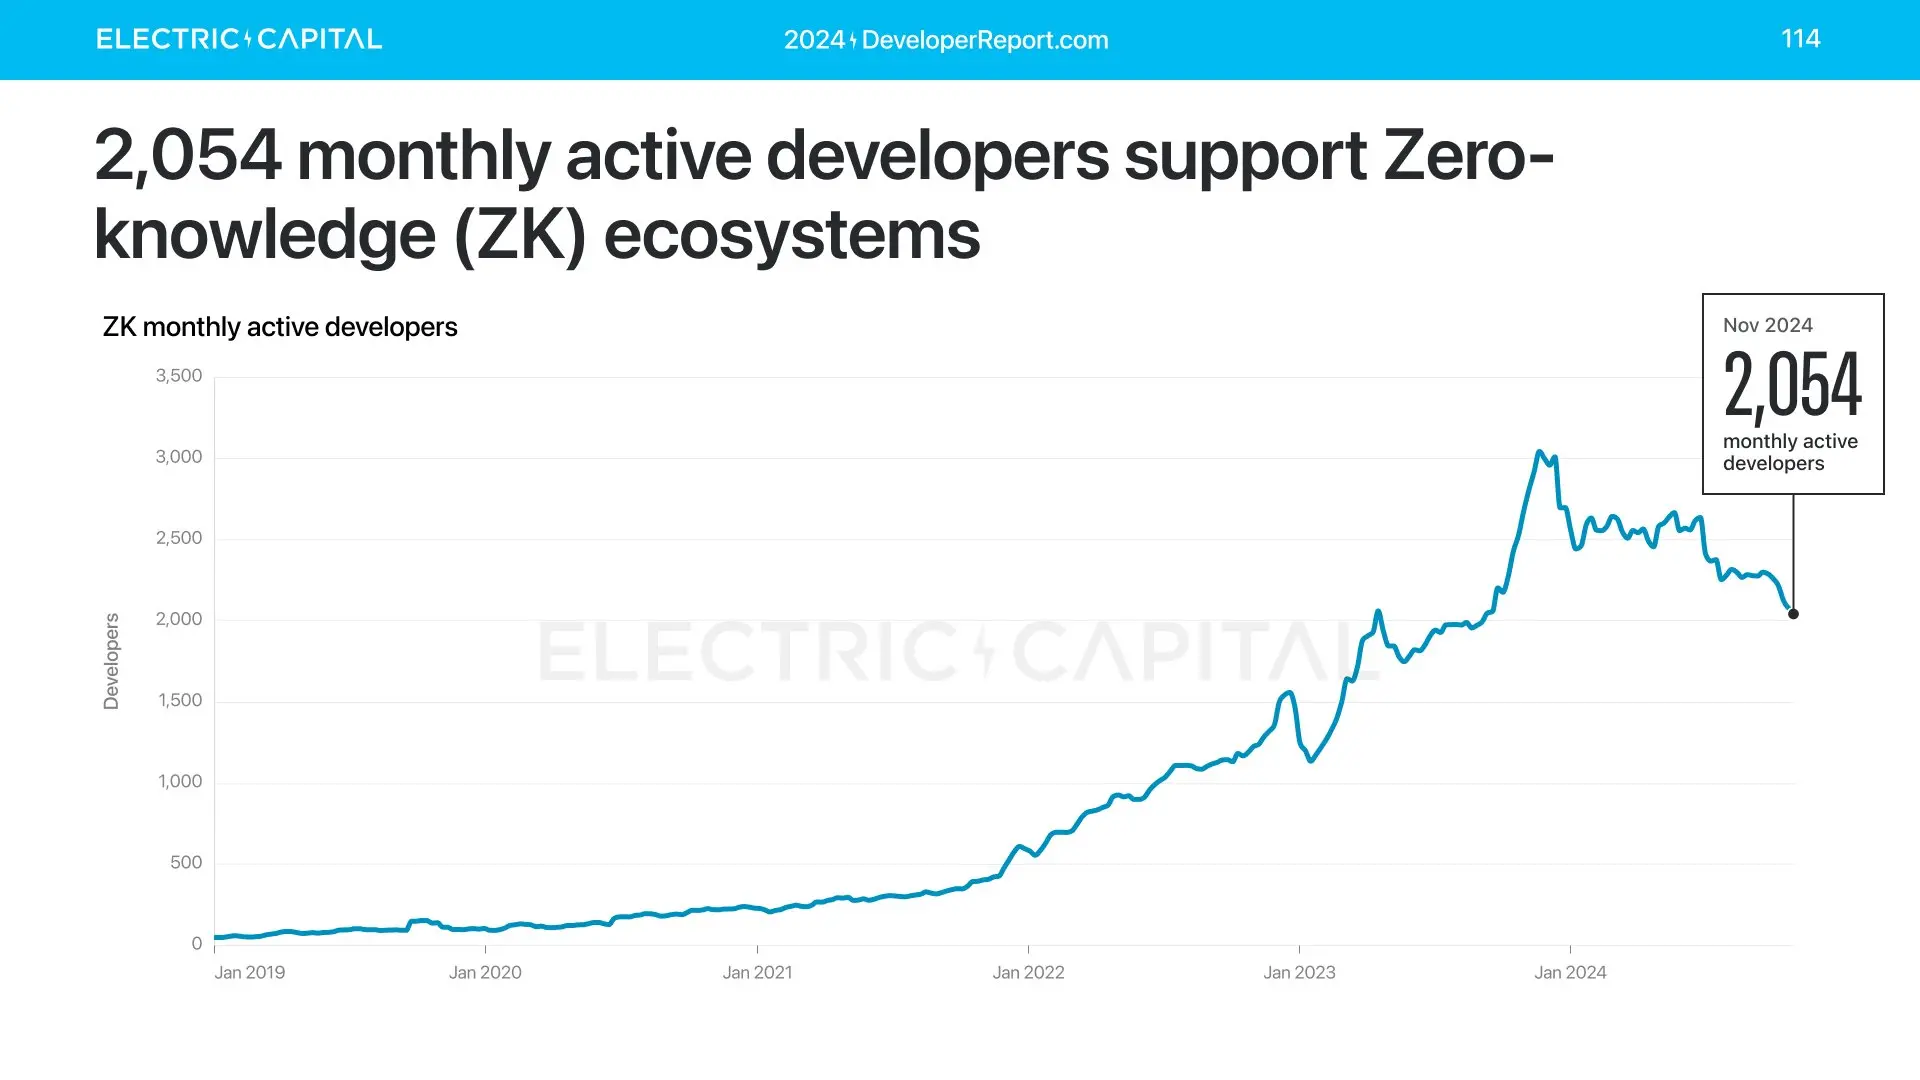
Zero-knowledge proofs (ZK) are a developer-centric, research-driven field. How is its development?
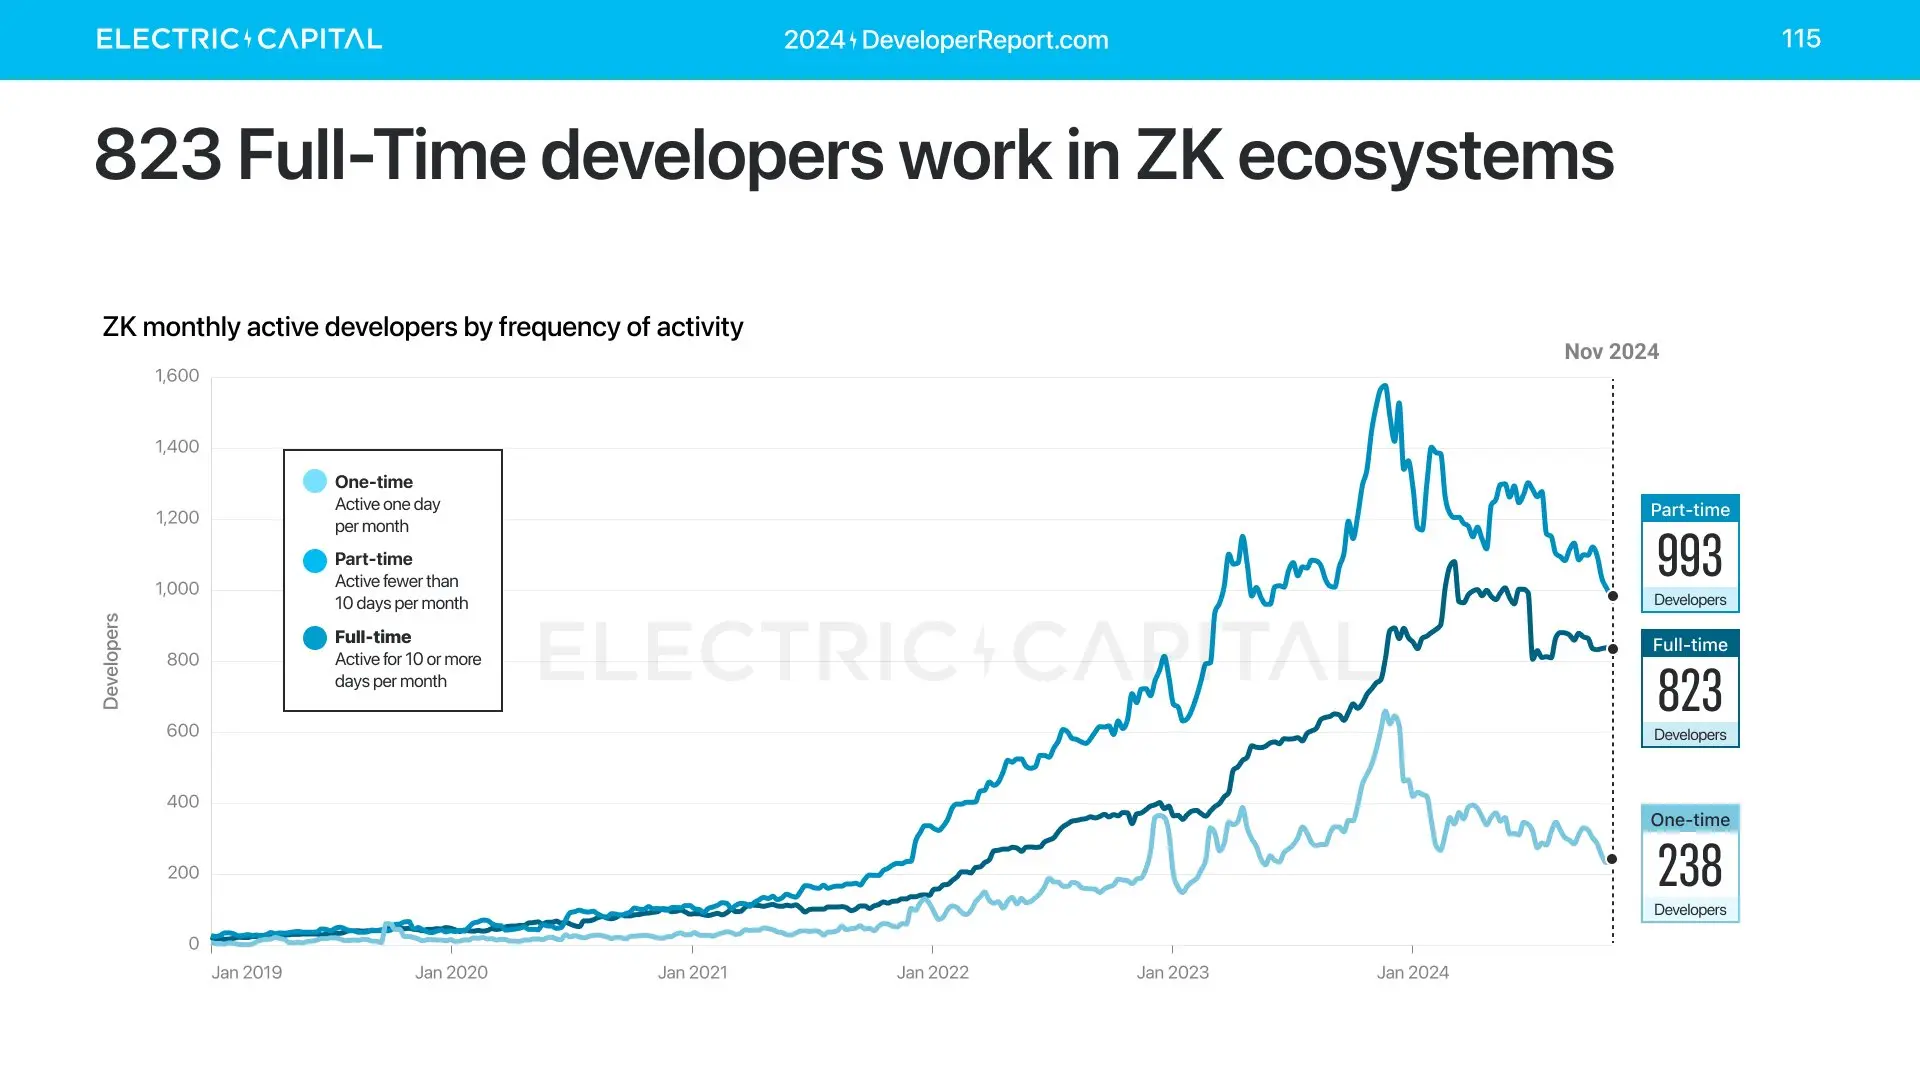
Over 2,000 monthly active developers are working in the ZK ecosystem, with 823 being full-time developers who submit code for more than 10 days a month.
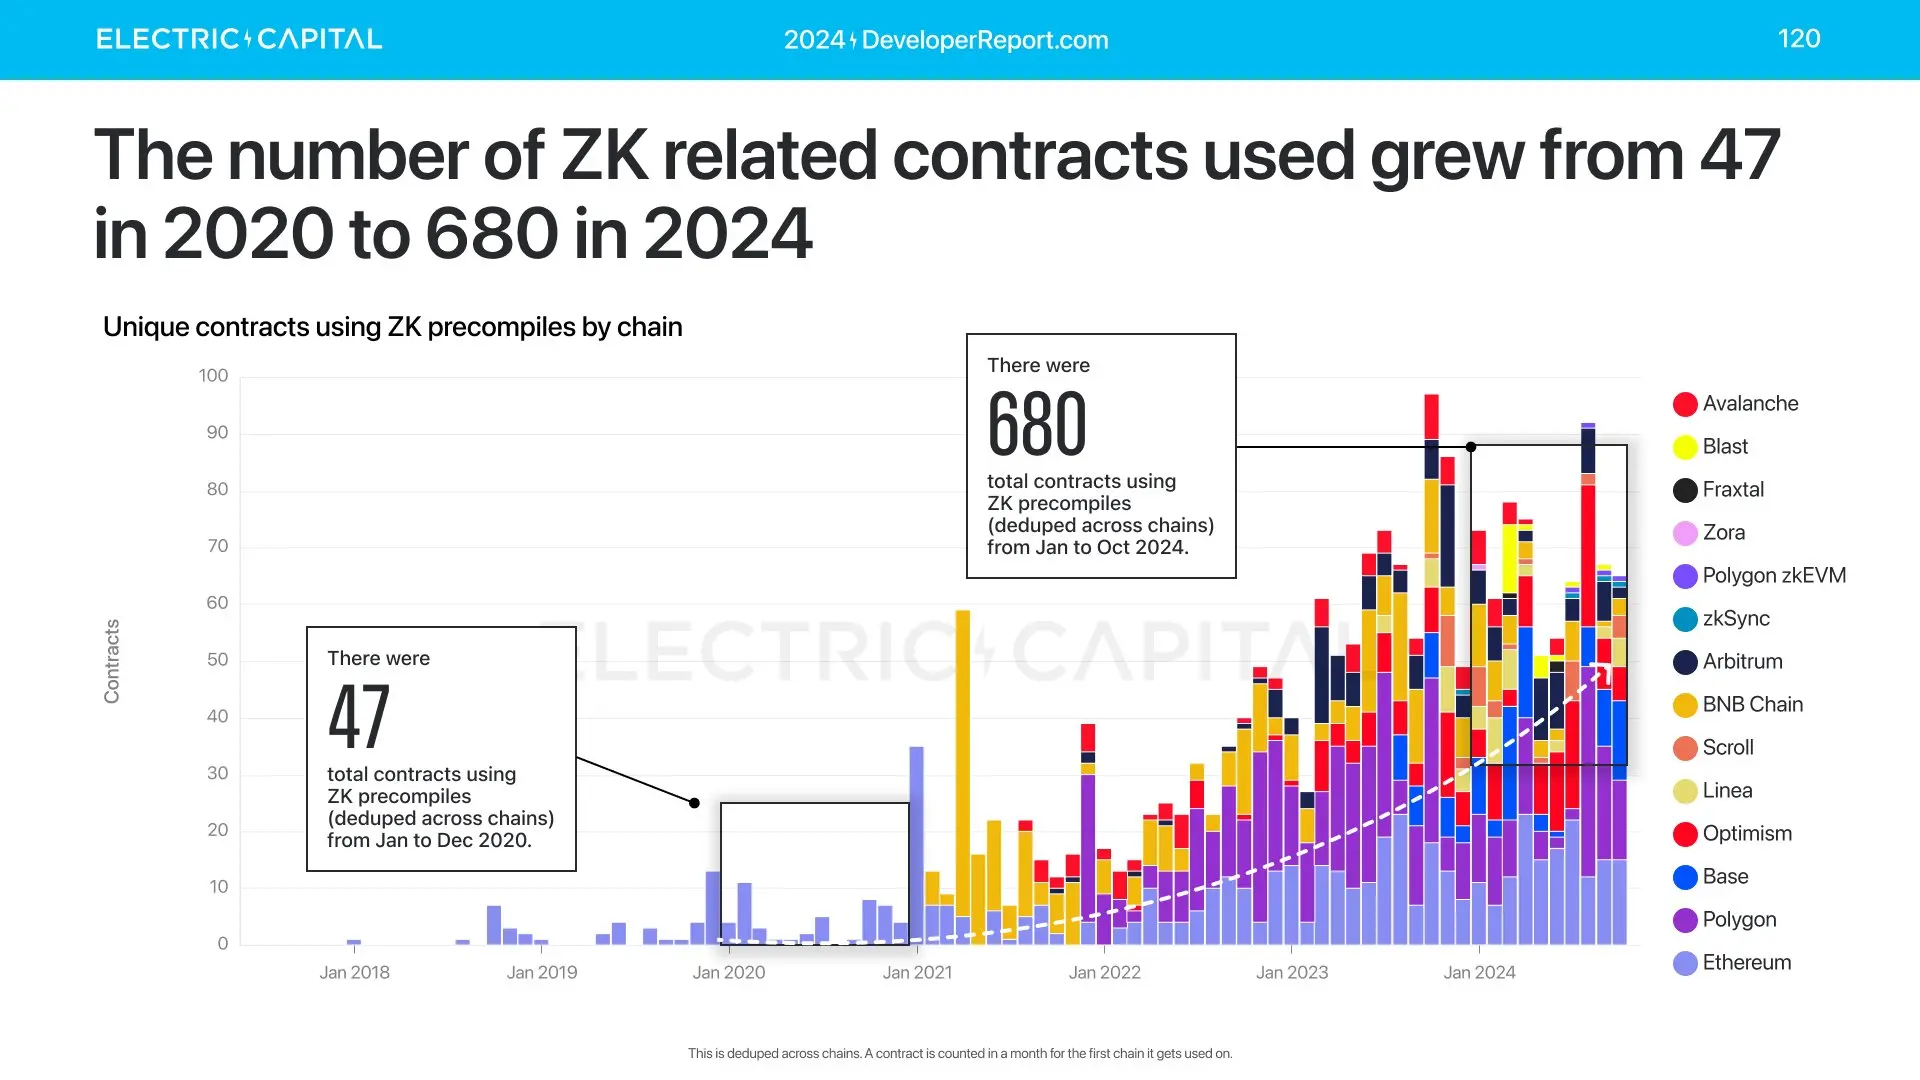
 The on-chain deployments of zero-knowledge proofs (ZK) have also increased from 40 in 2020 to 639 in 2024.
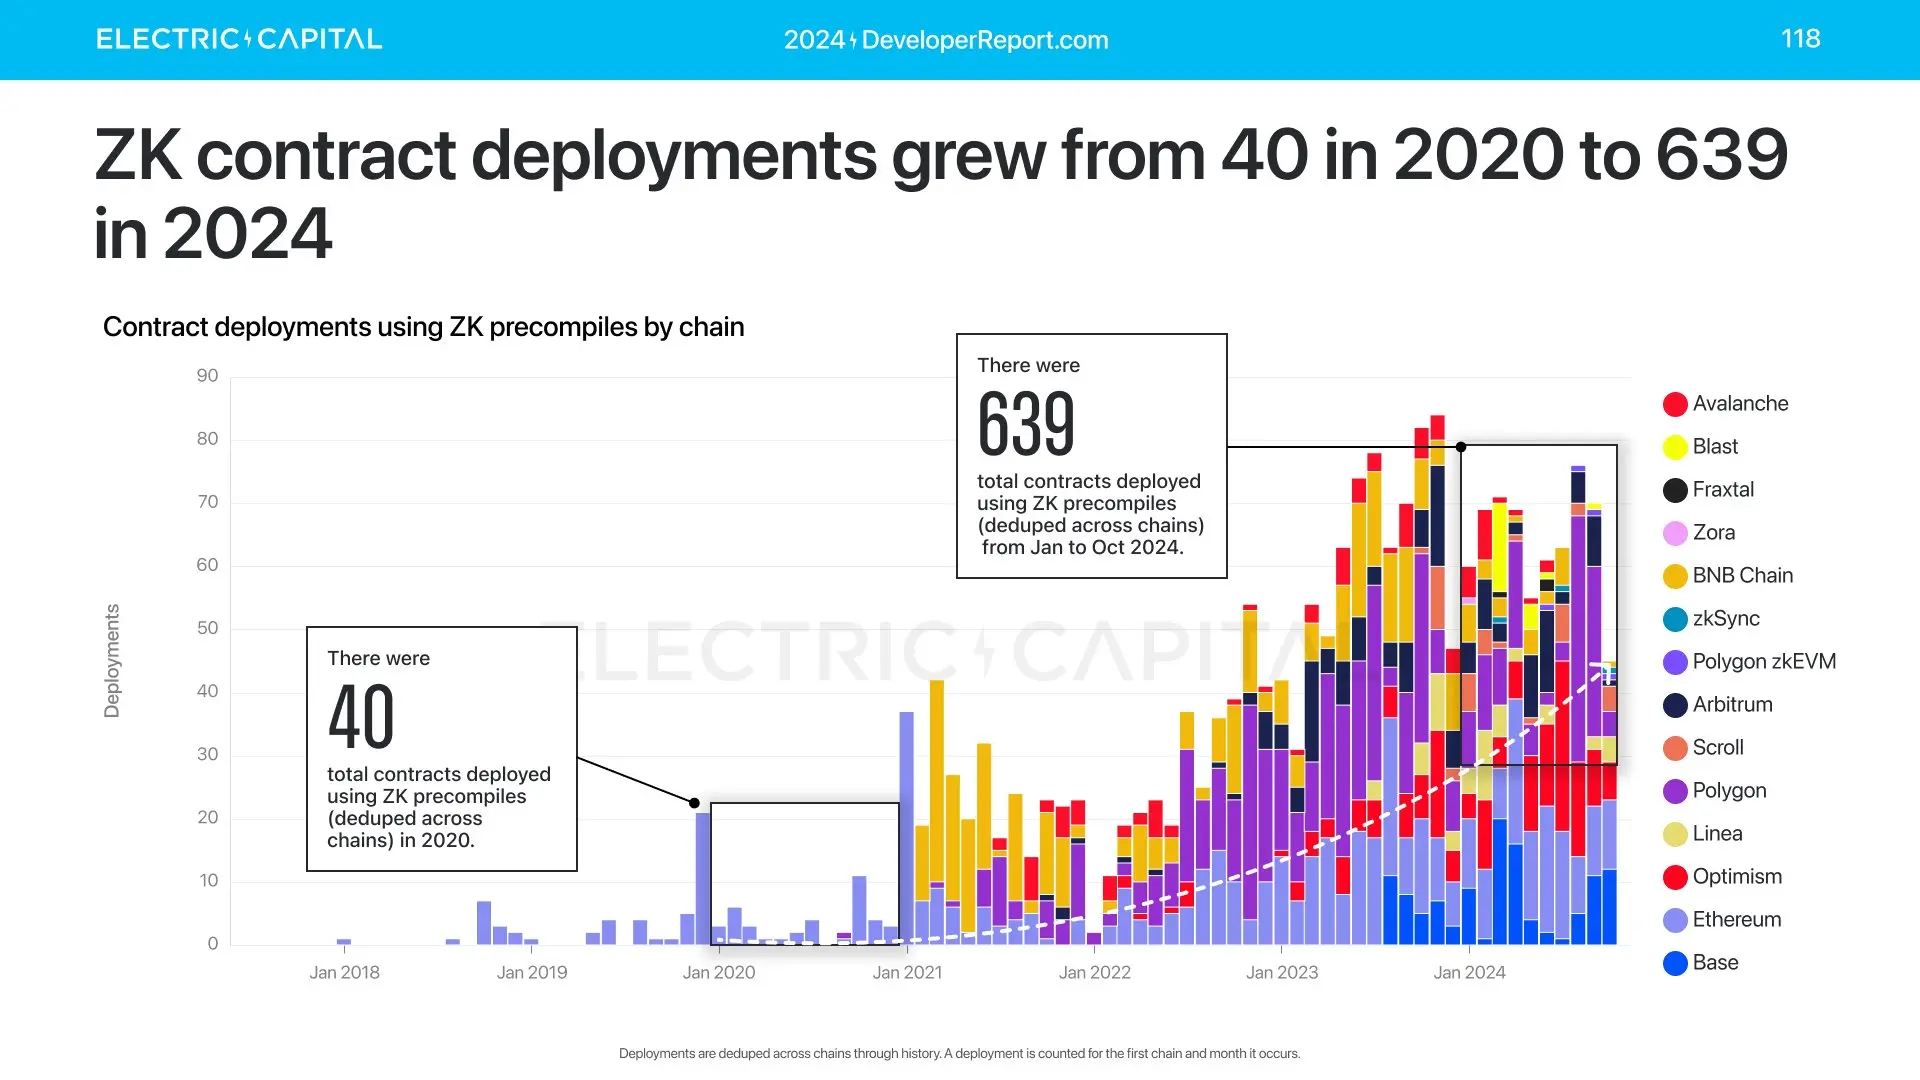
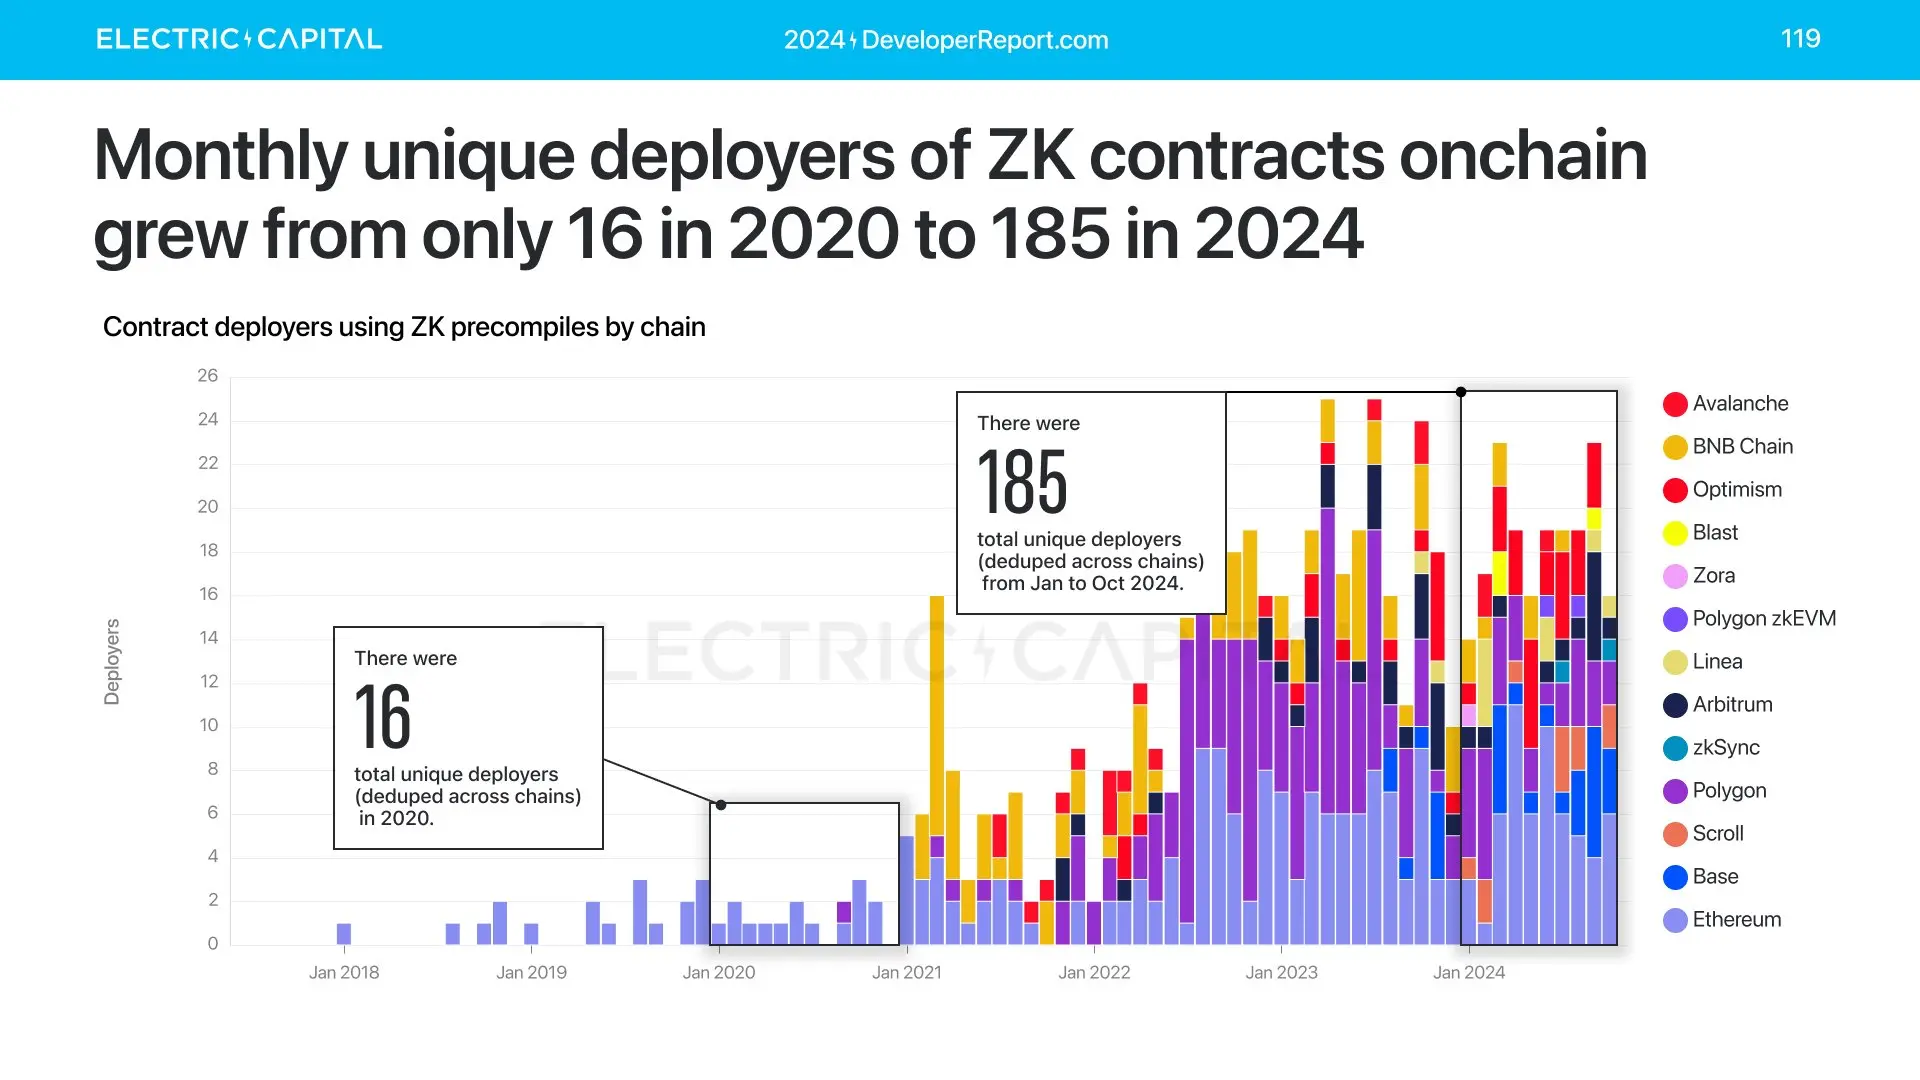
Although the numbers remain relatively flat, they show clear growth. The number of deployers has also increased.
ZK is also gaining usage—contracts using ZK precompiles have increased from 47 in 2020 to 680 this year.
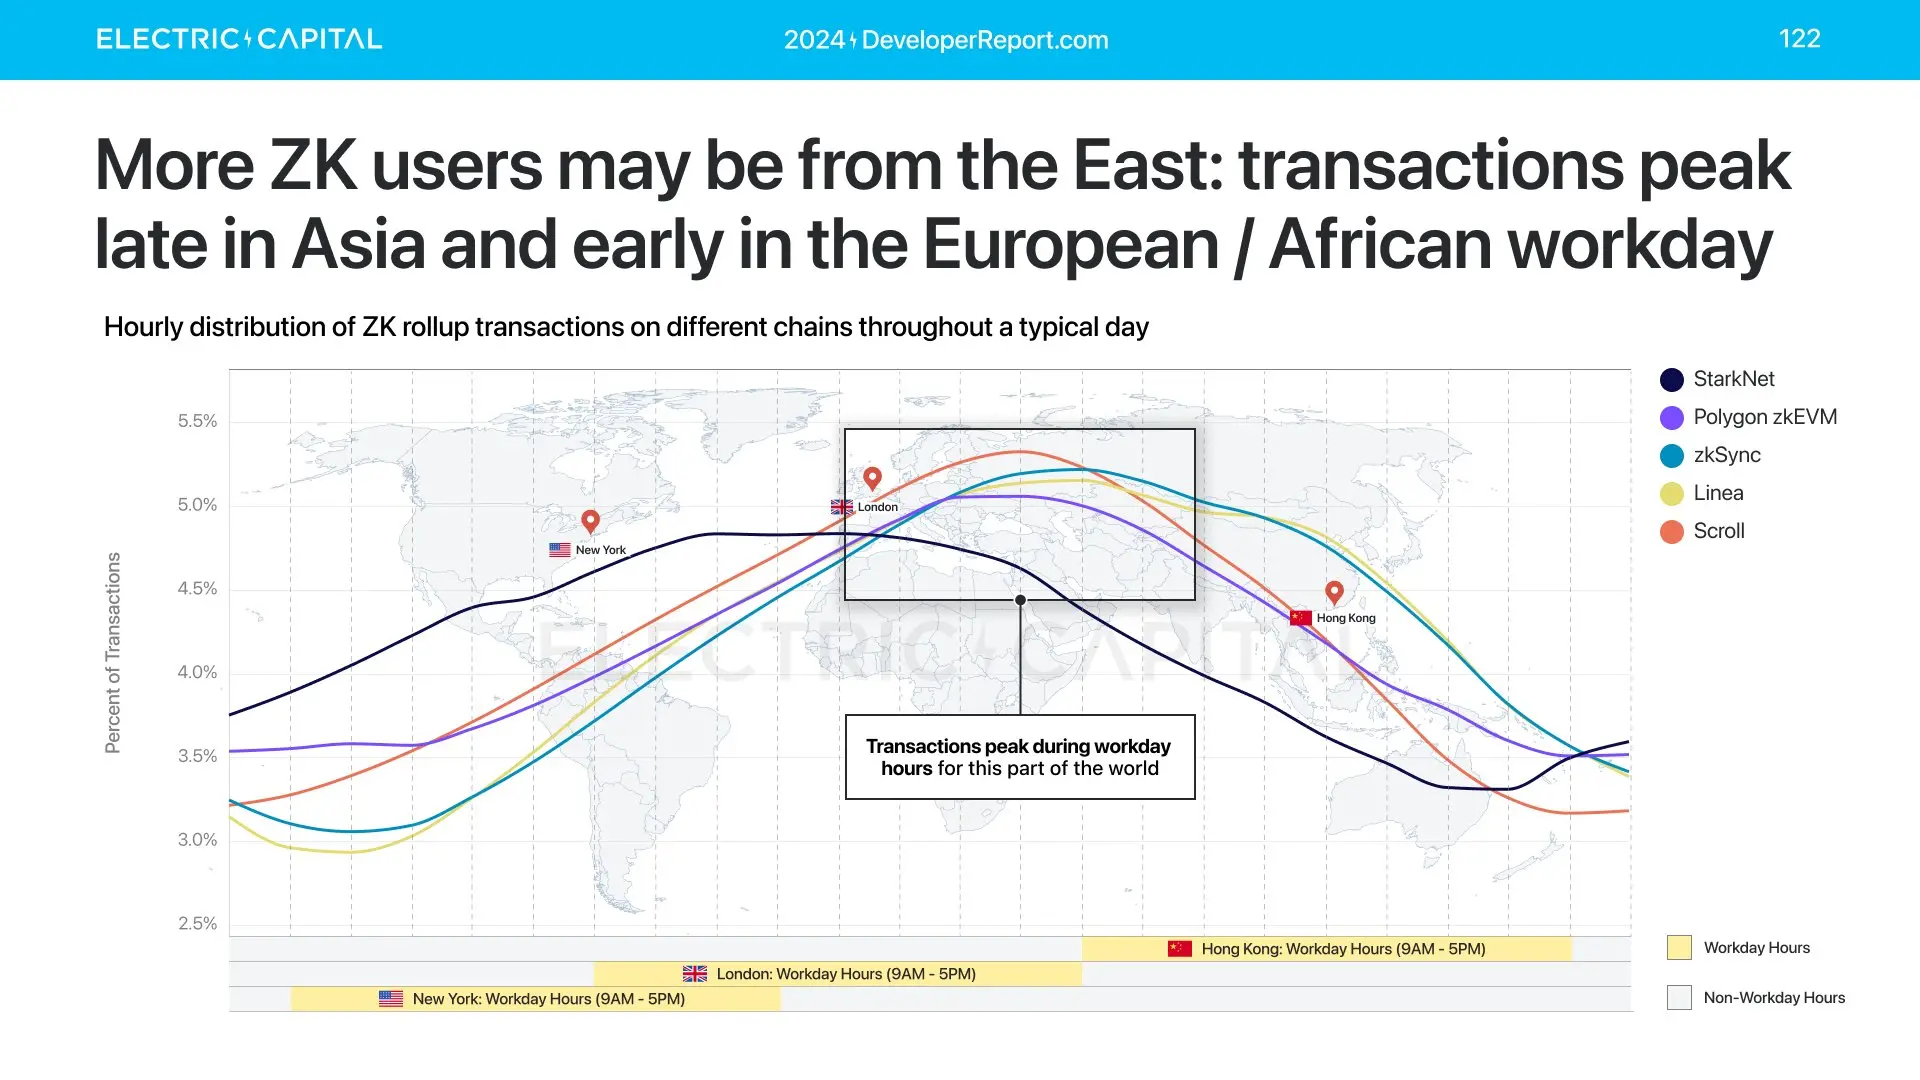
When are zero-knowledge proof (ZK) developers and users active?
Deployers of ZK Rollup contracts are active during working hours in the Eastern Hemisphere, and ZK users are as well.
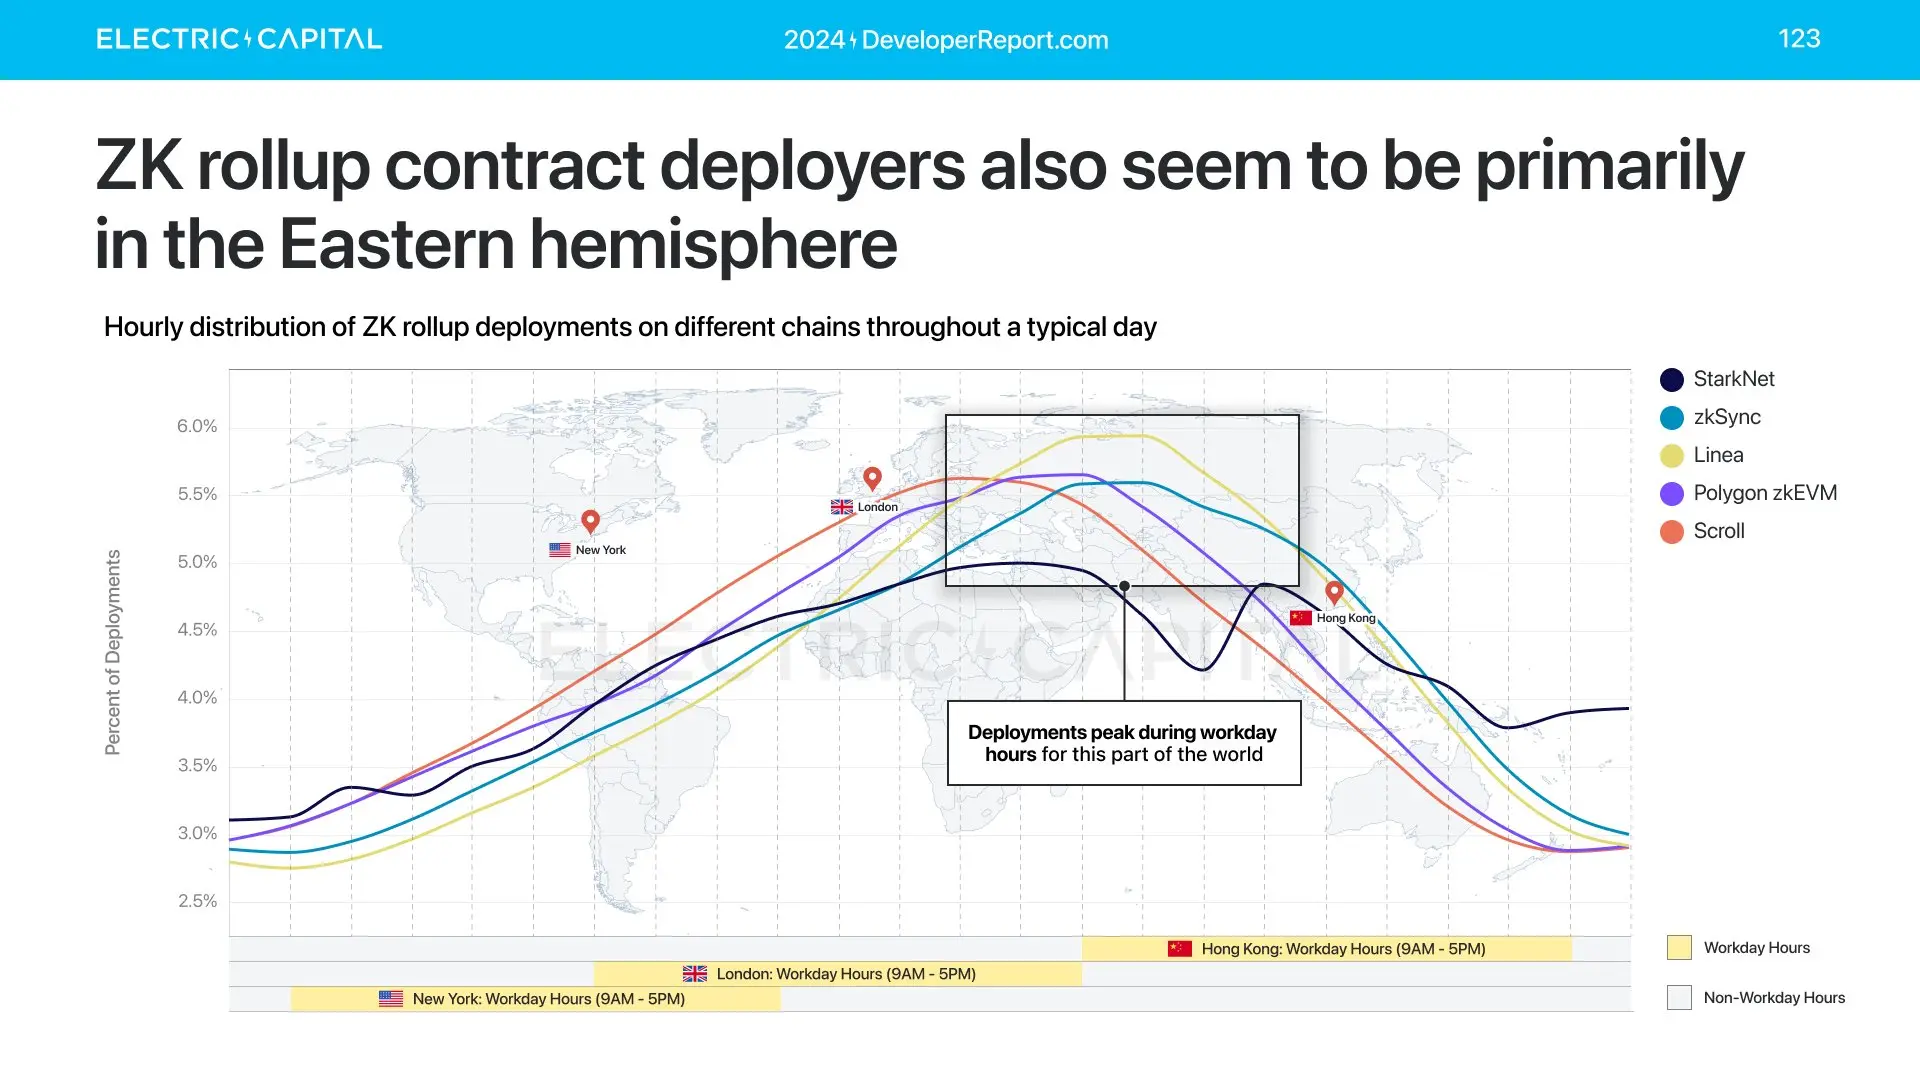
ZK users and deployers seem to be concentrated in the Eastern Hemisphere, particularly in Eastern Europe, Africa, and Asia.
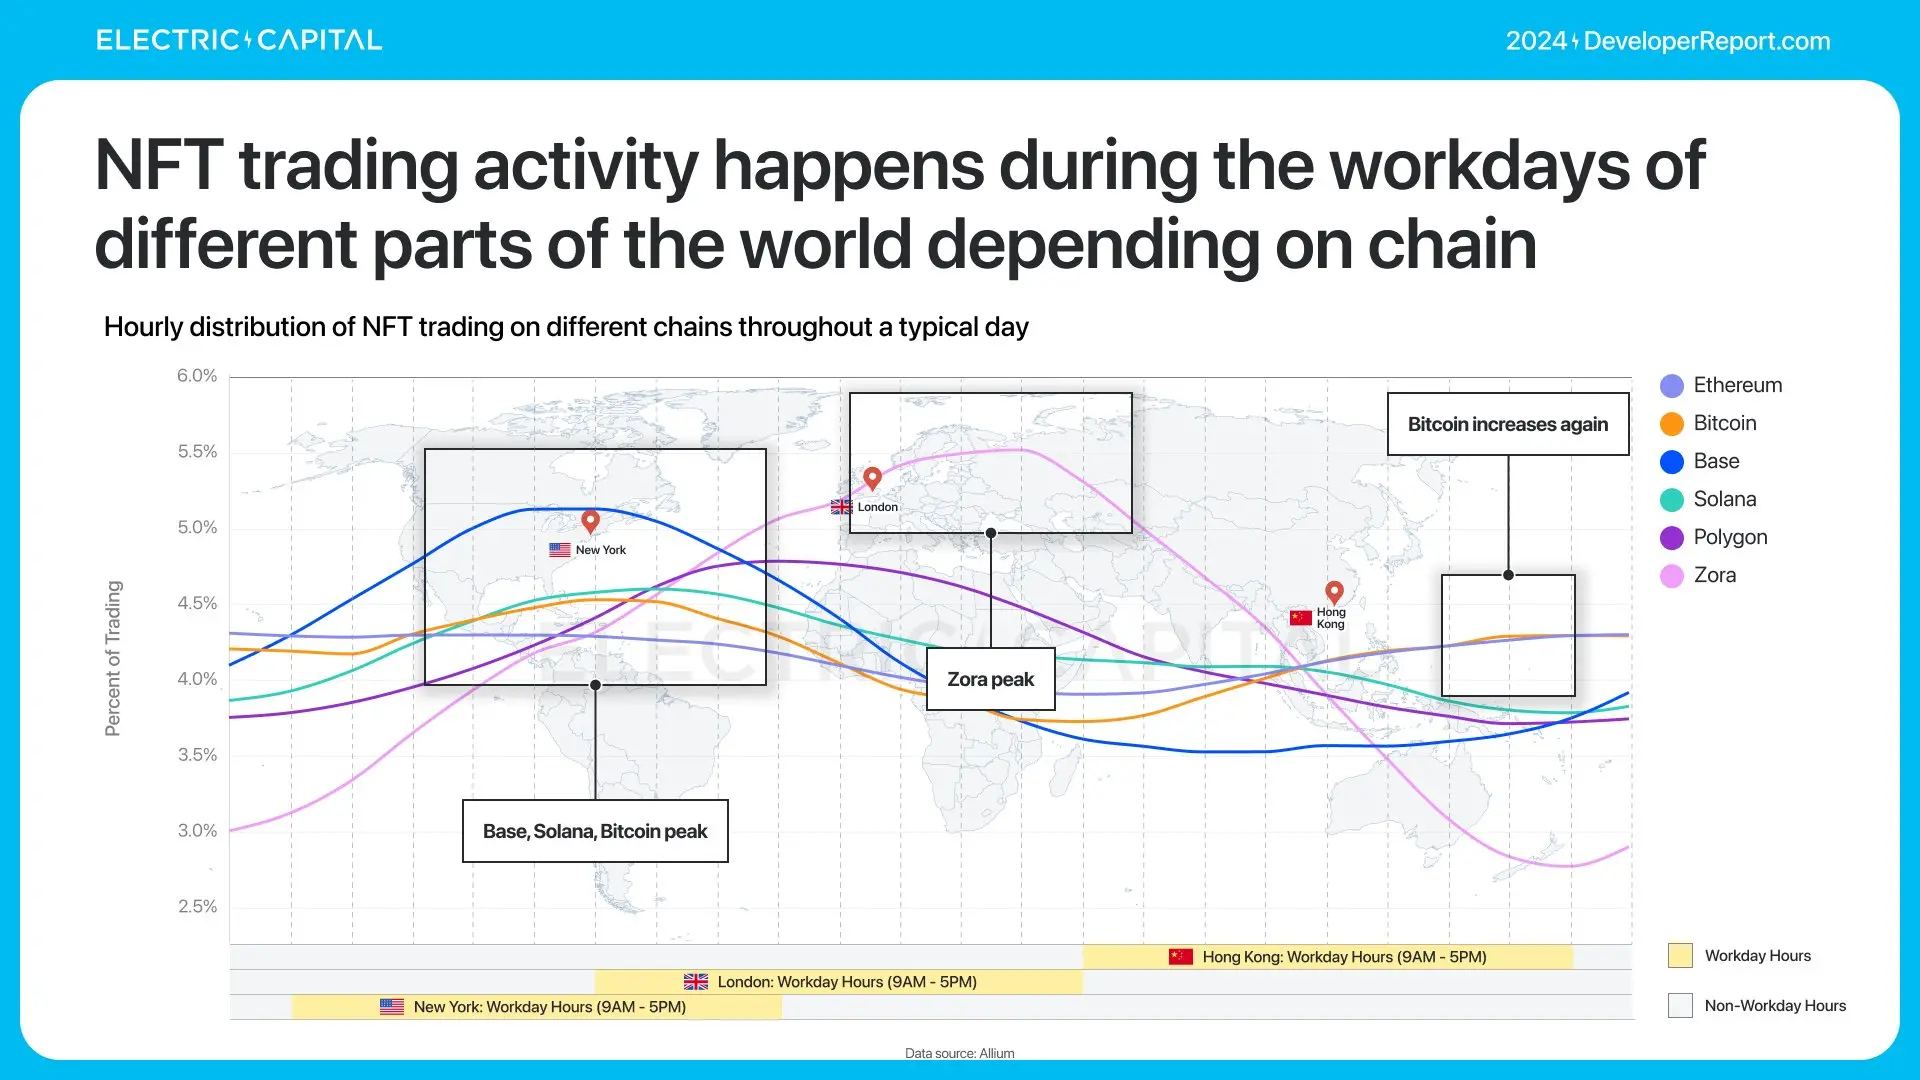
NFTs and DeFi are established application scenarios in the crypto space—most top smart contracts are related to NFTs or DeFi. How are these application scenarios developing? Let's start with NFTs.
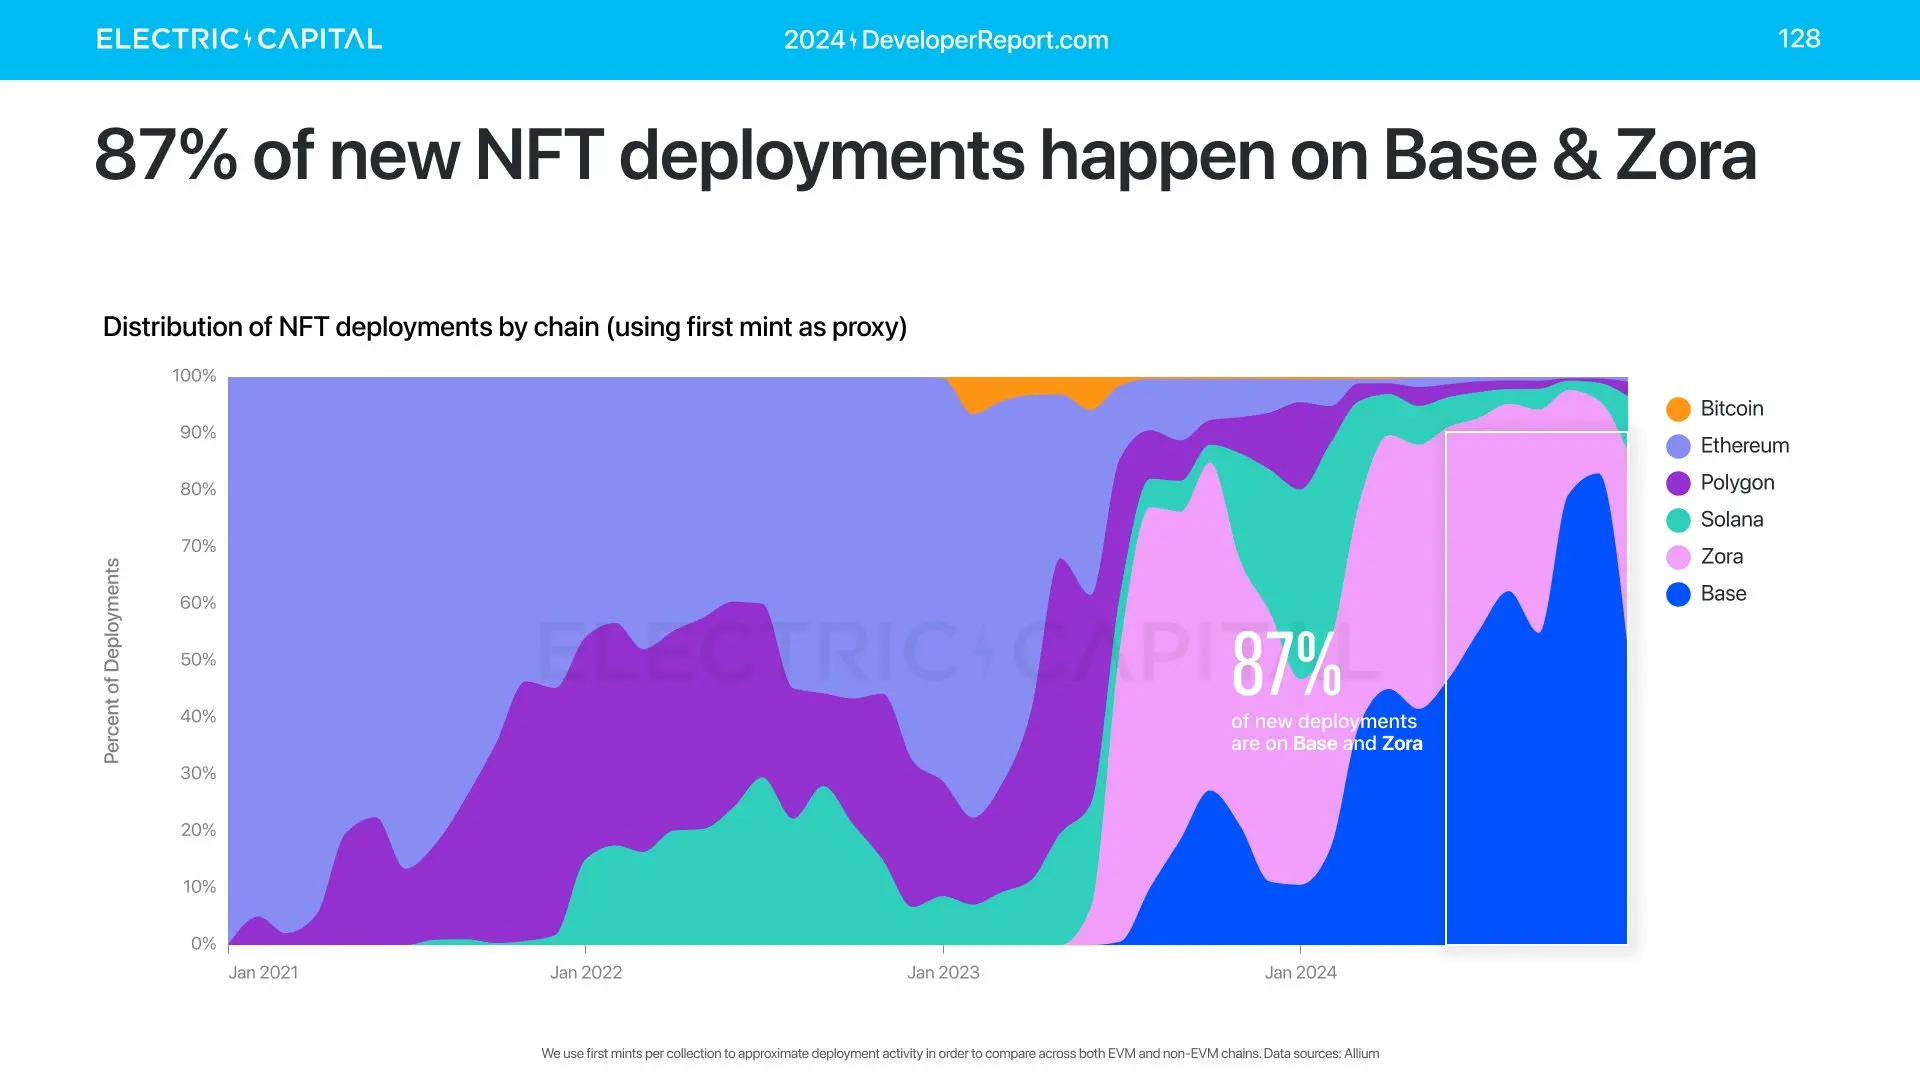
On all major NFT-active chains (Bitcoin, Ethereum, Polygon, Solana, Zora, Base), NFT deployments have increased more than threefold year-over-year.
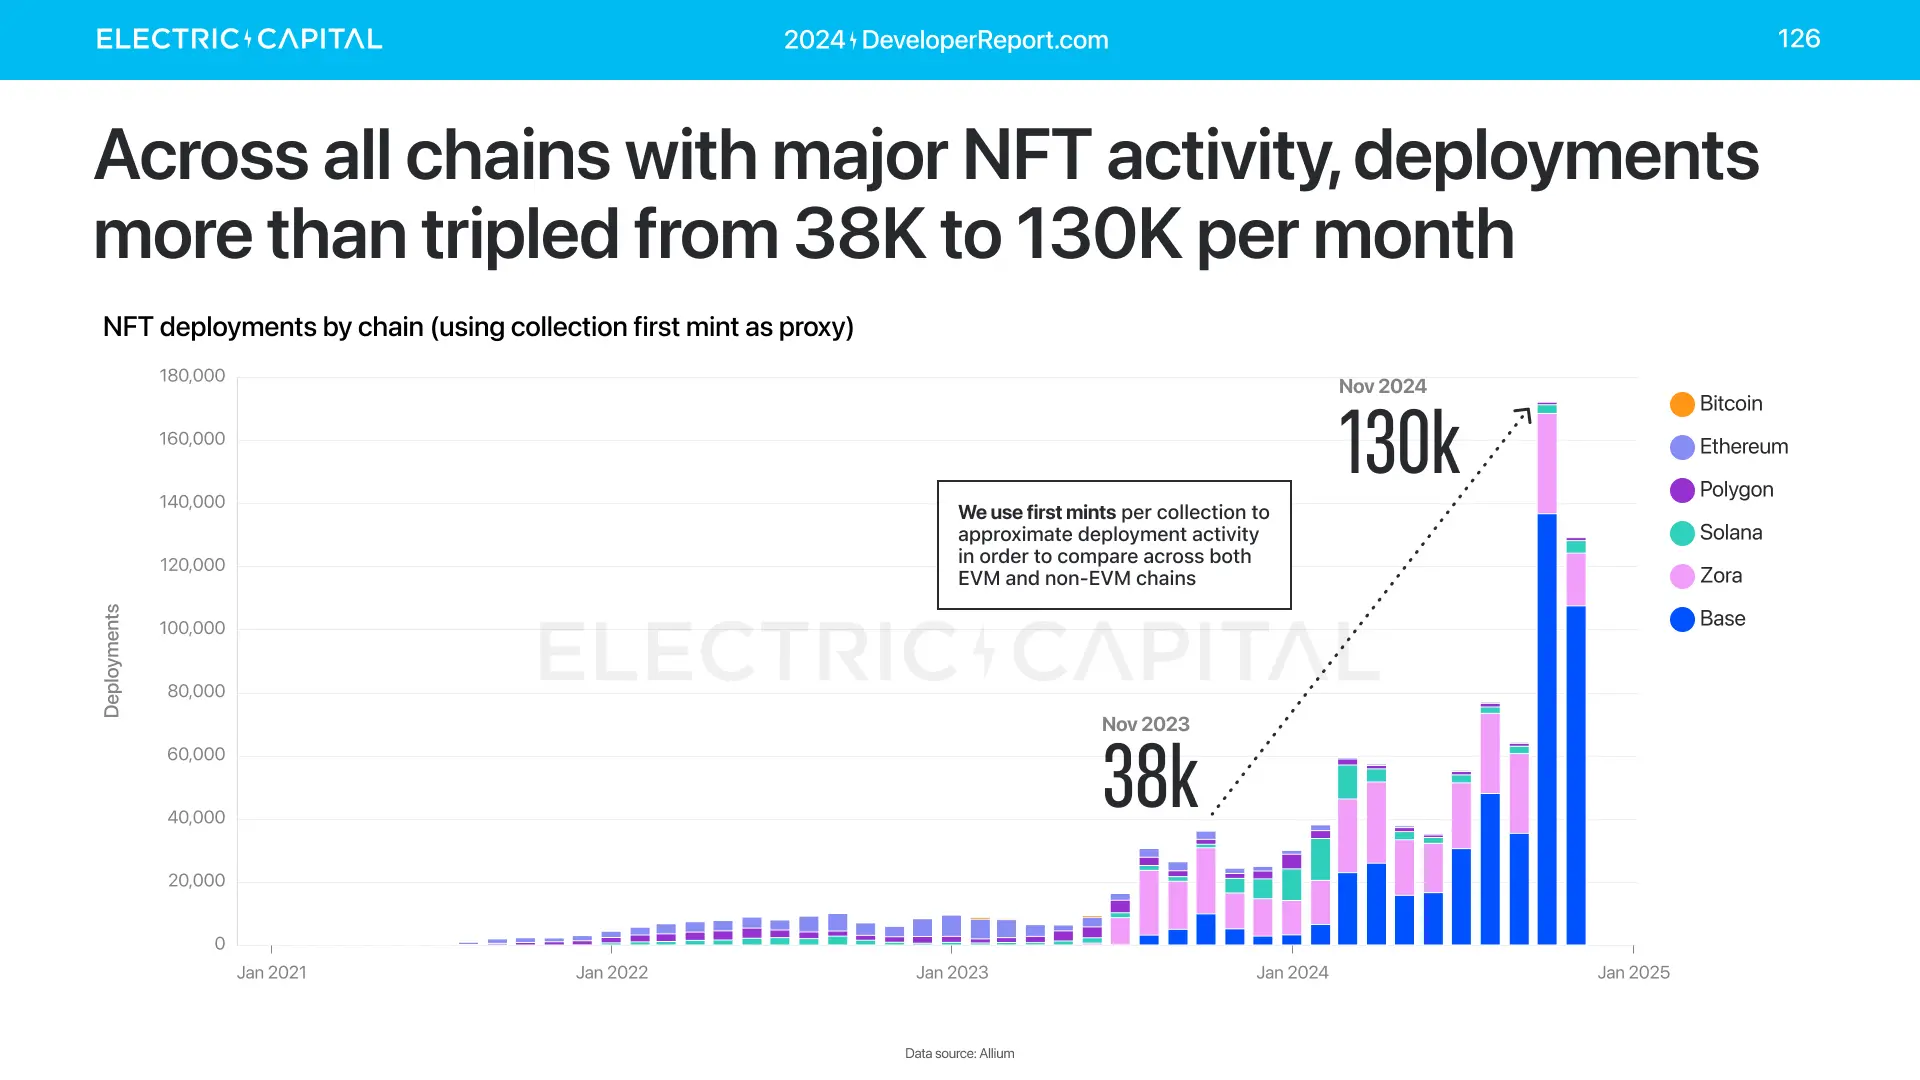
NFT deployments have reached an all-time high. 87% of new deployments occurred on Base and Zora.
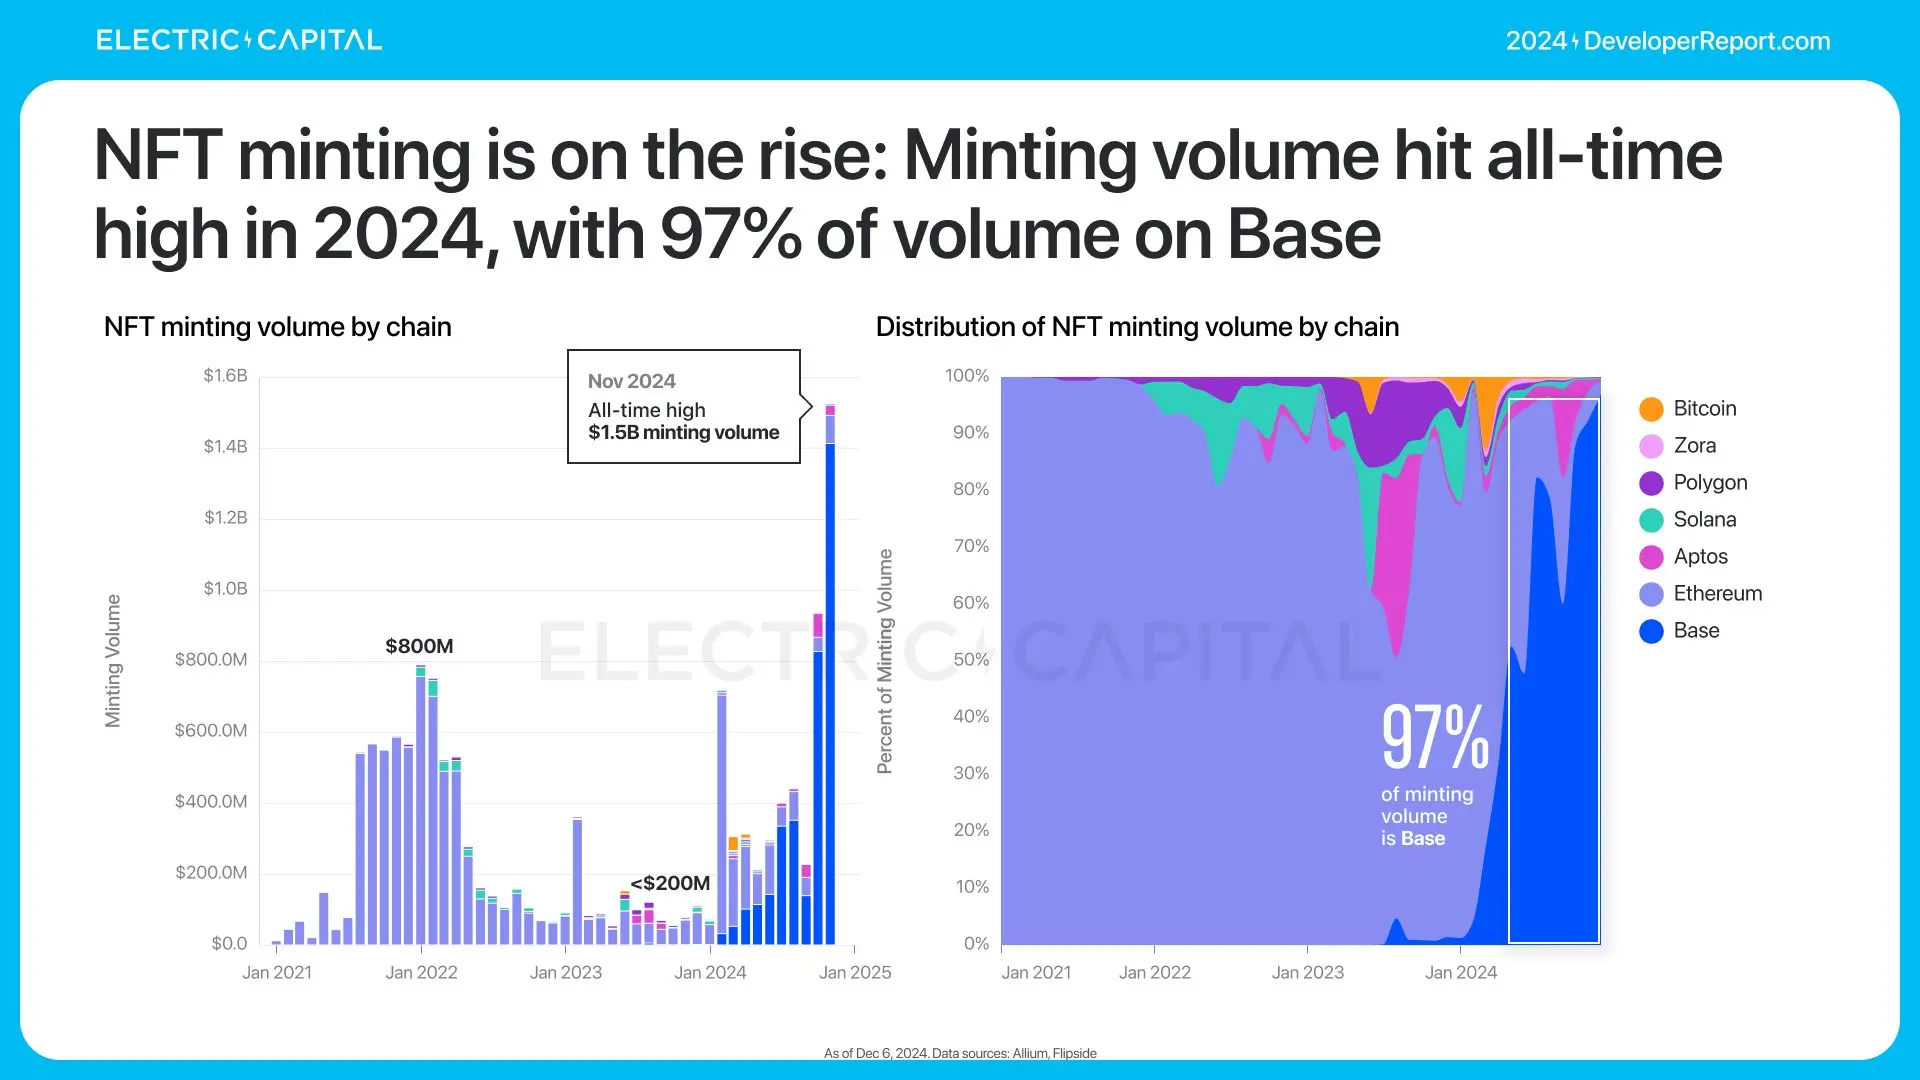
NFT activity has significantly shifted towards minting.
In 2024, NFT minting reached an all-time high, with 97% of minting occurring on Base.
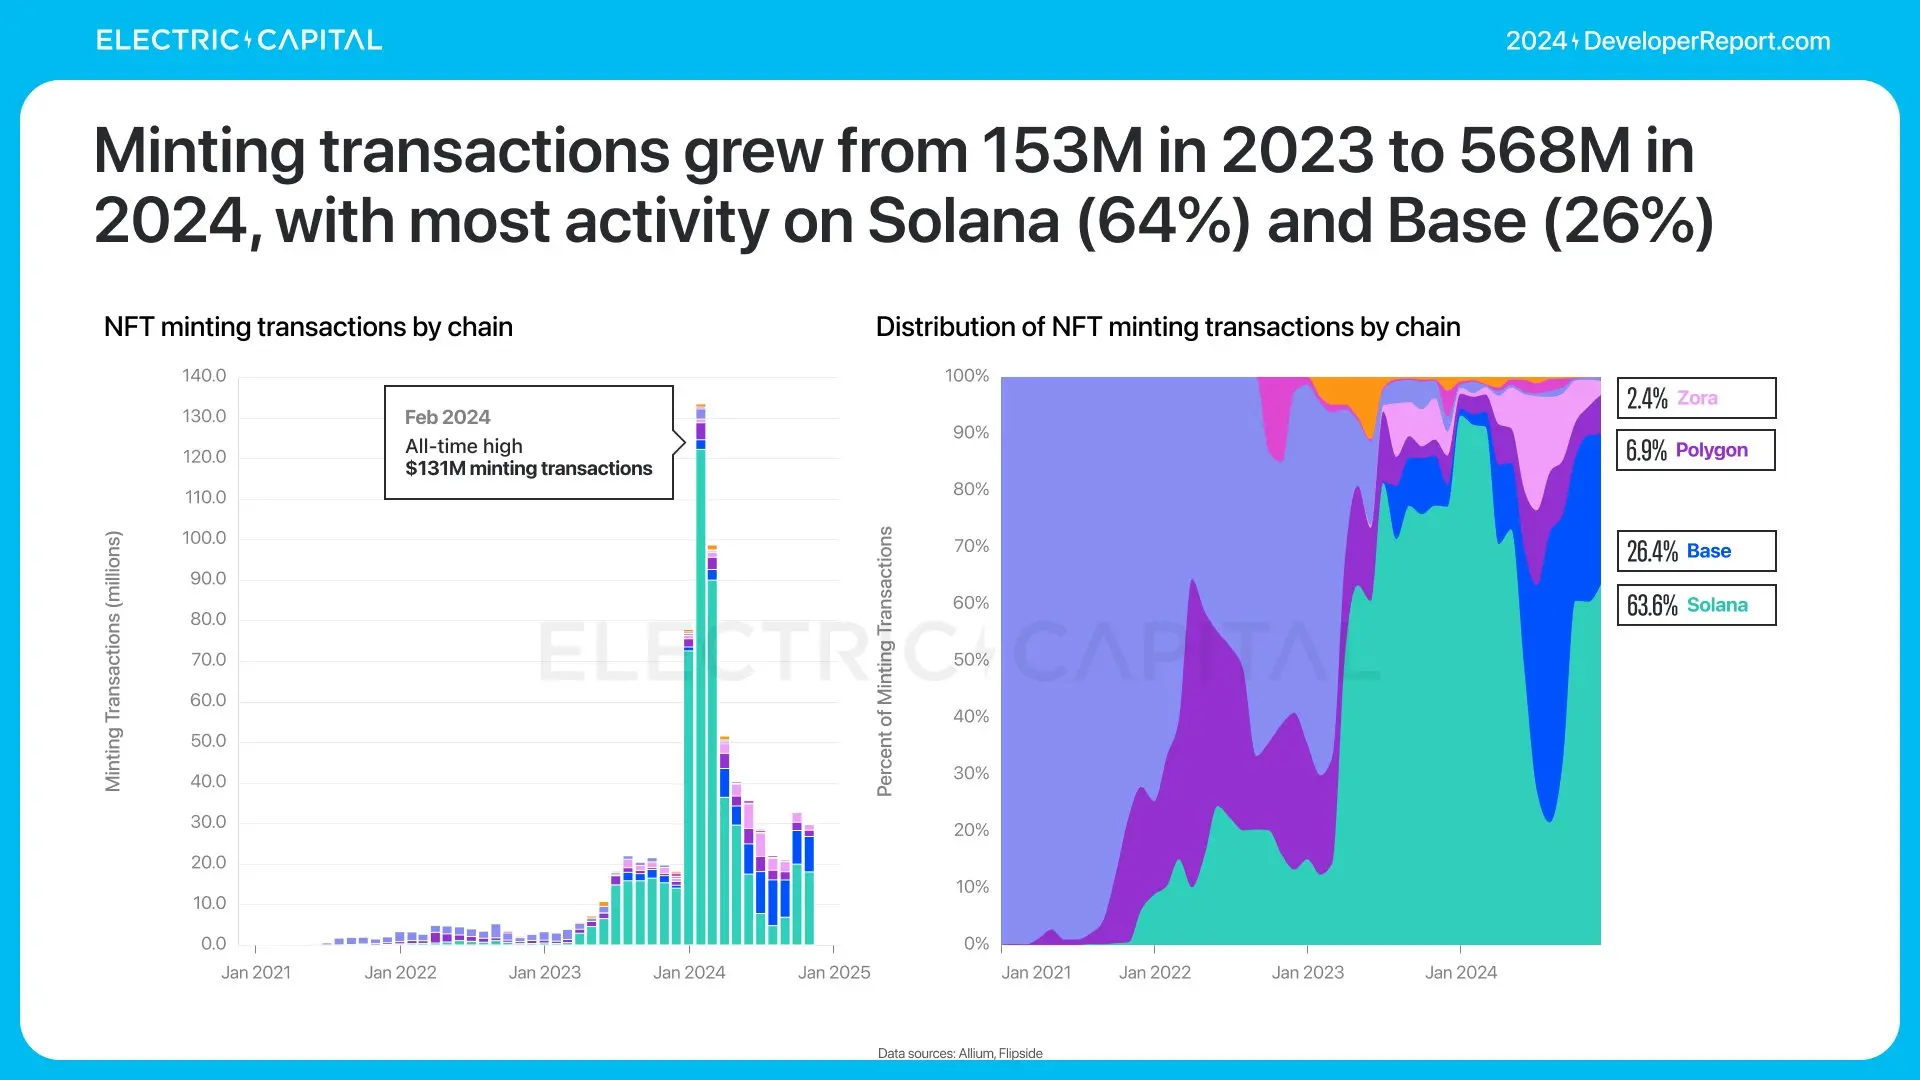
Solana has 57% of minting wallets, capturing 64% of minting transactions.
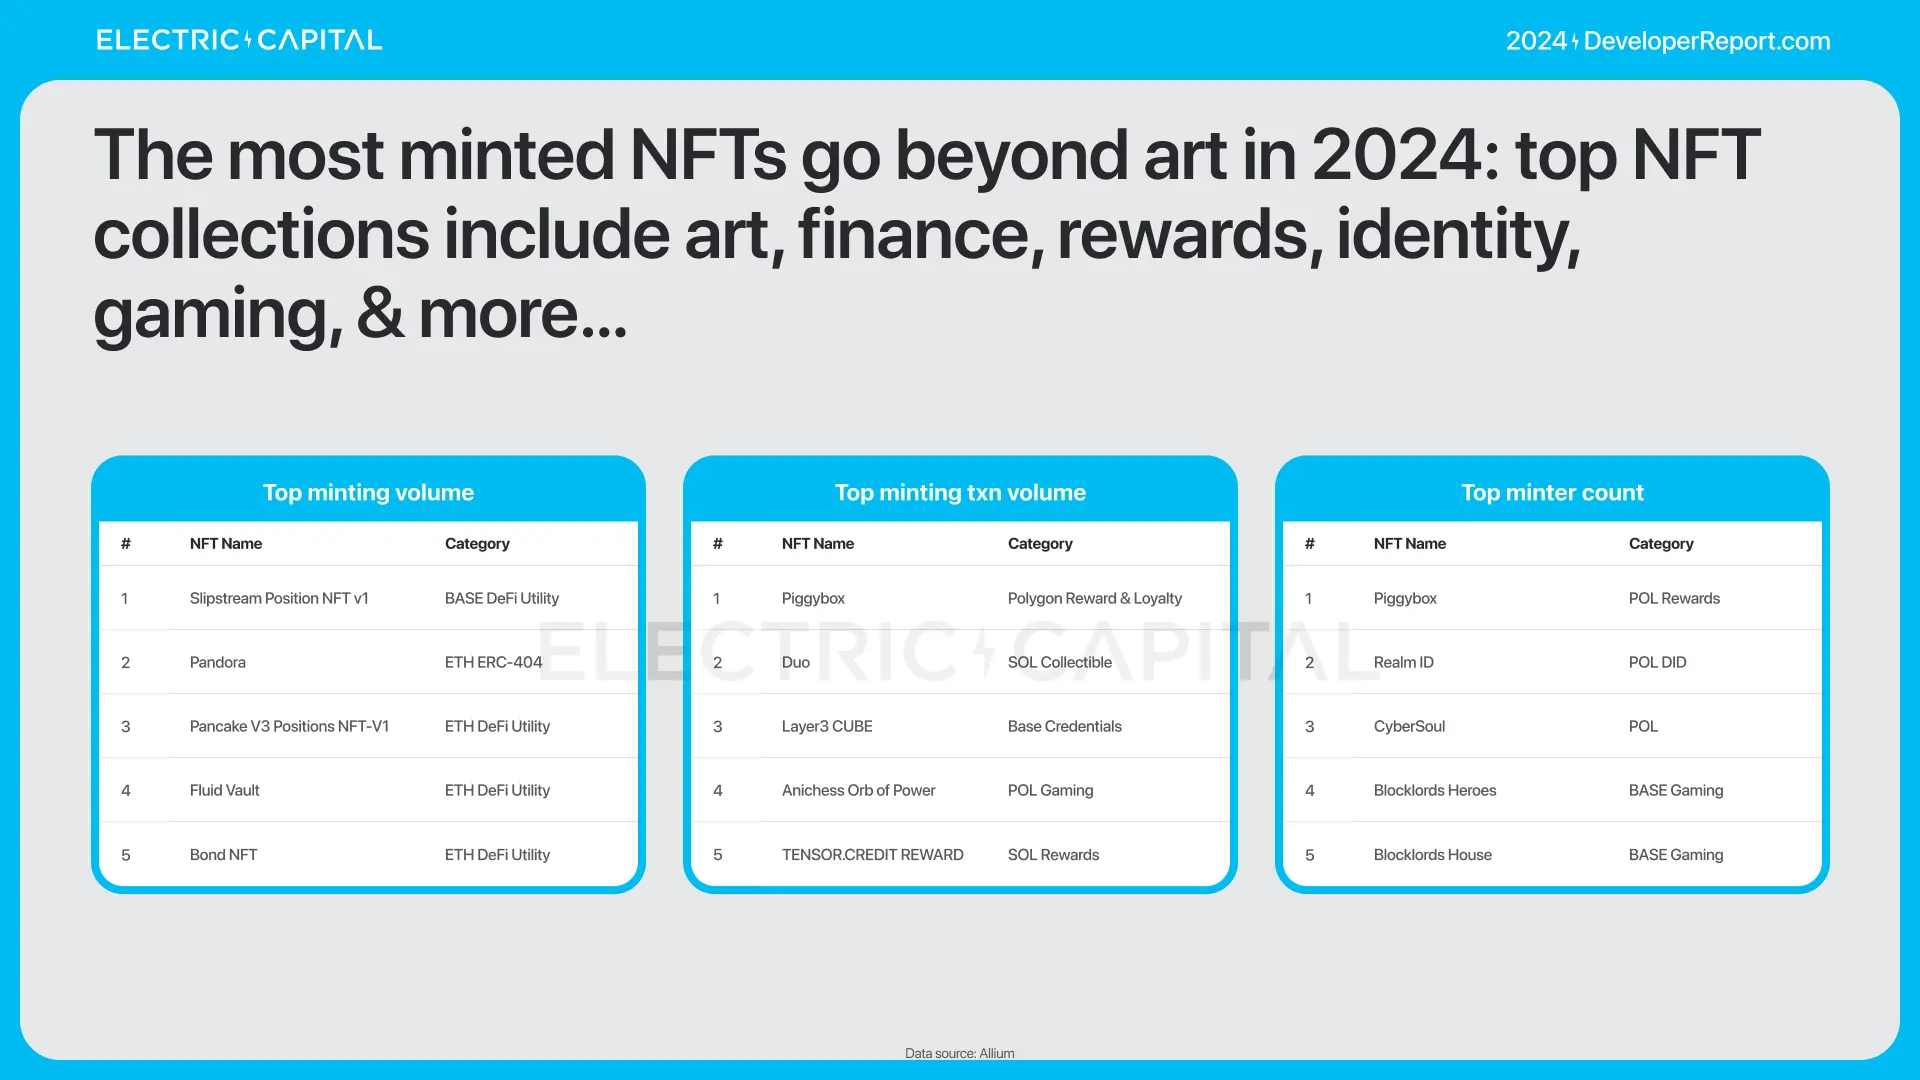
The increase in minting activity is due to NFTs expanding beyond the art sector in 2024, covering more application scenarios.
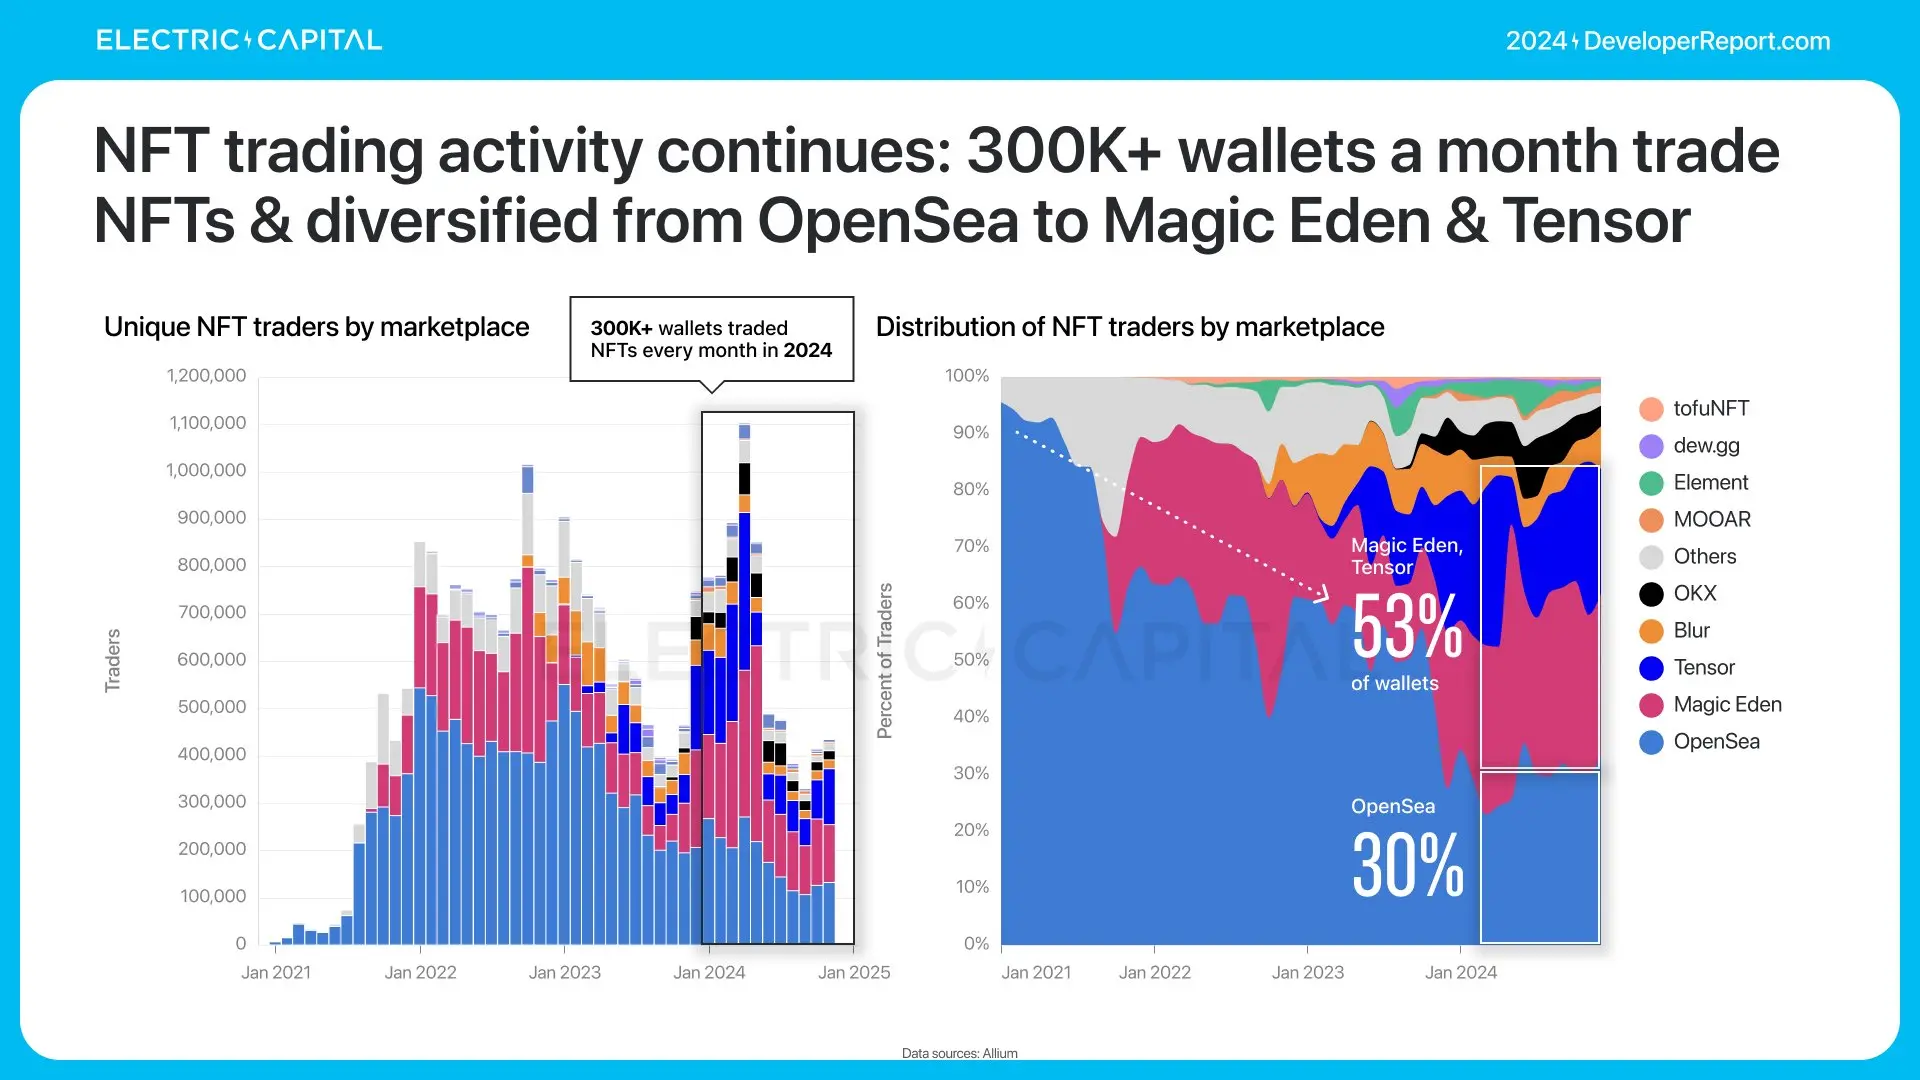
NFT trading remains an important foundational application and has expanded from OpenSea to platforms like Magic Eden and Tensor.
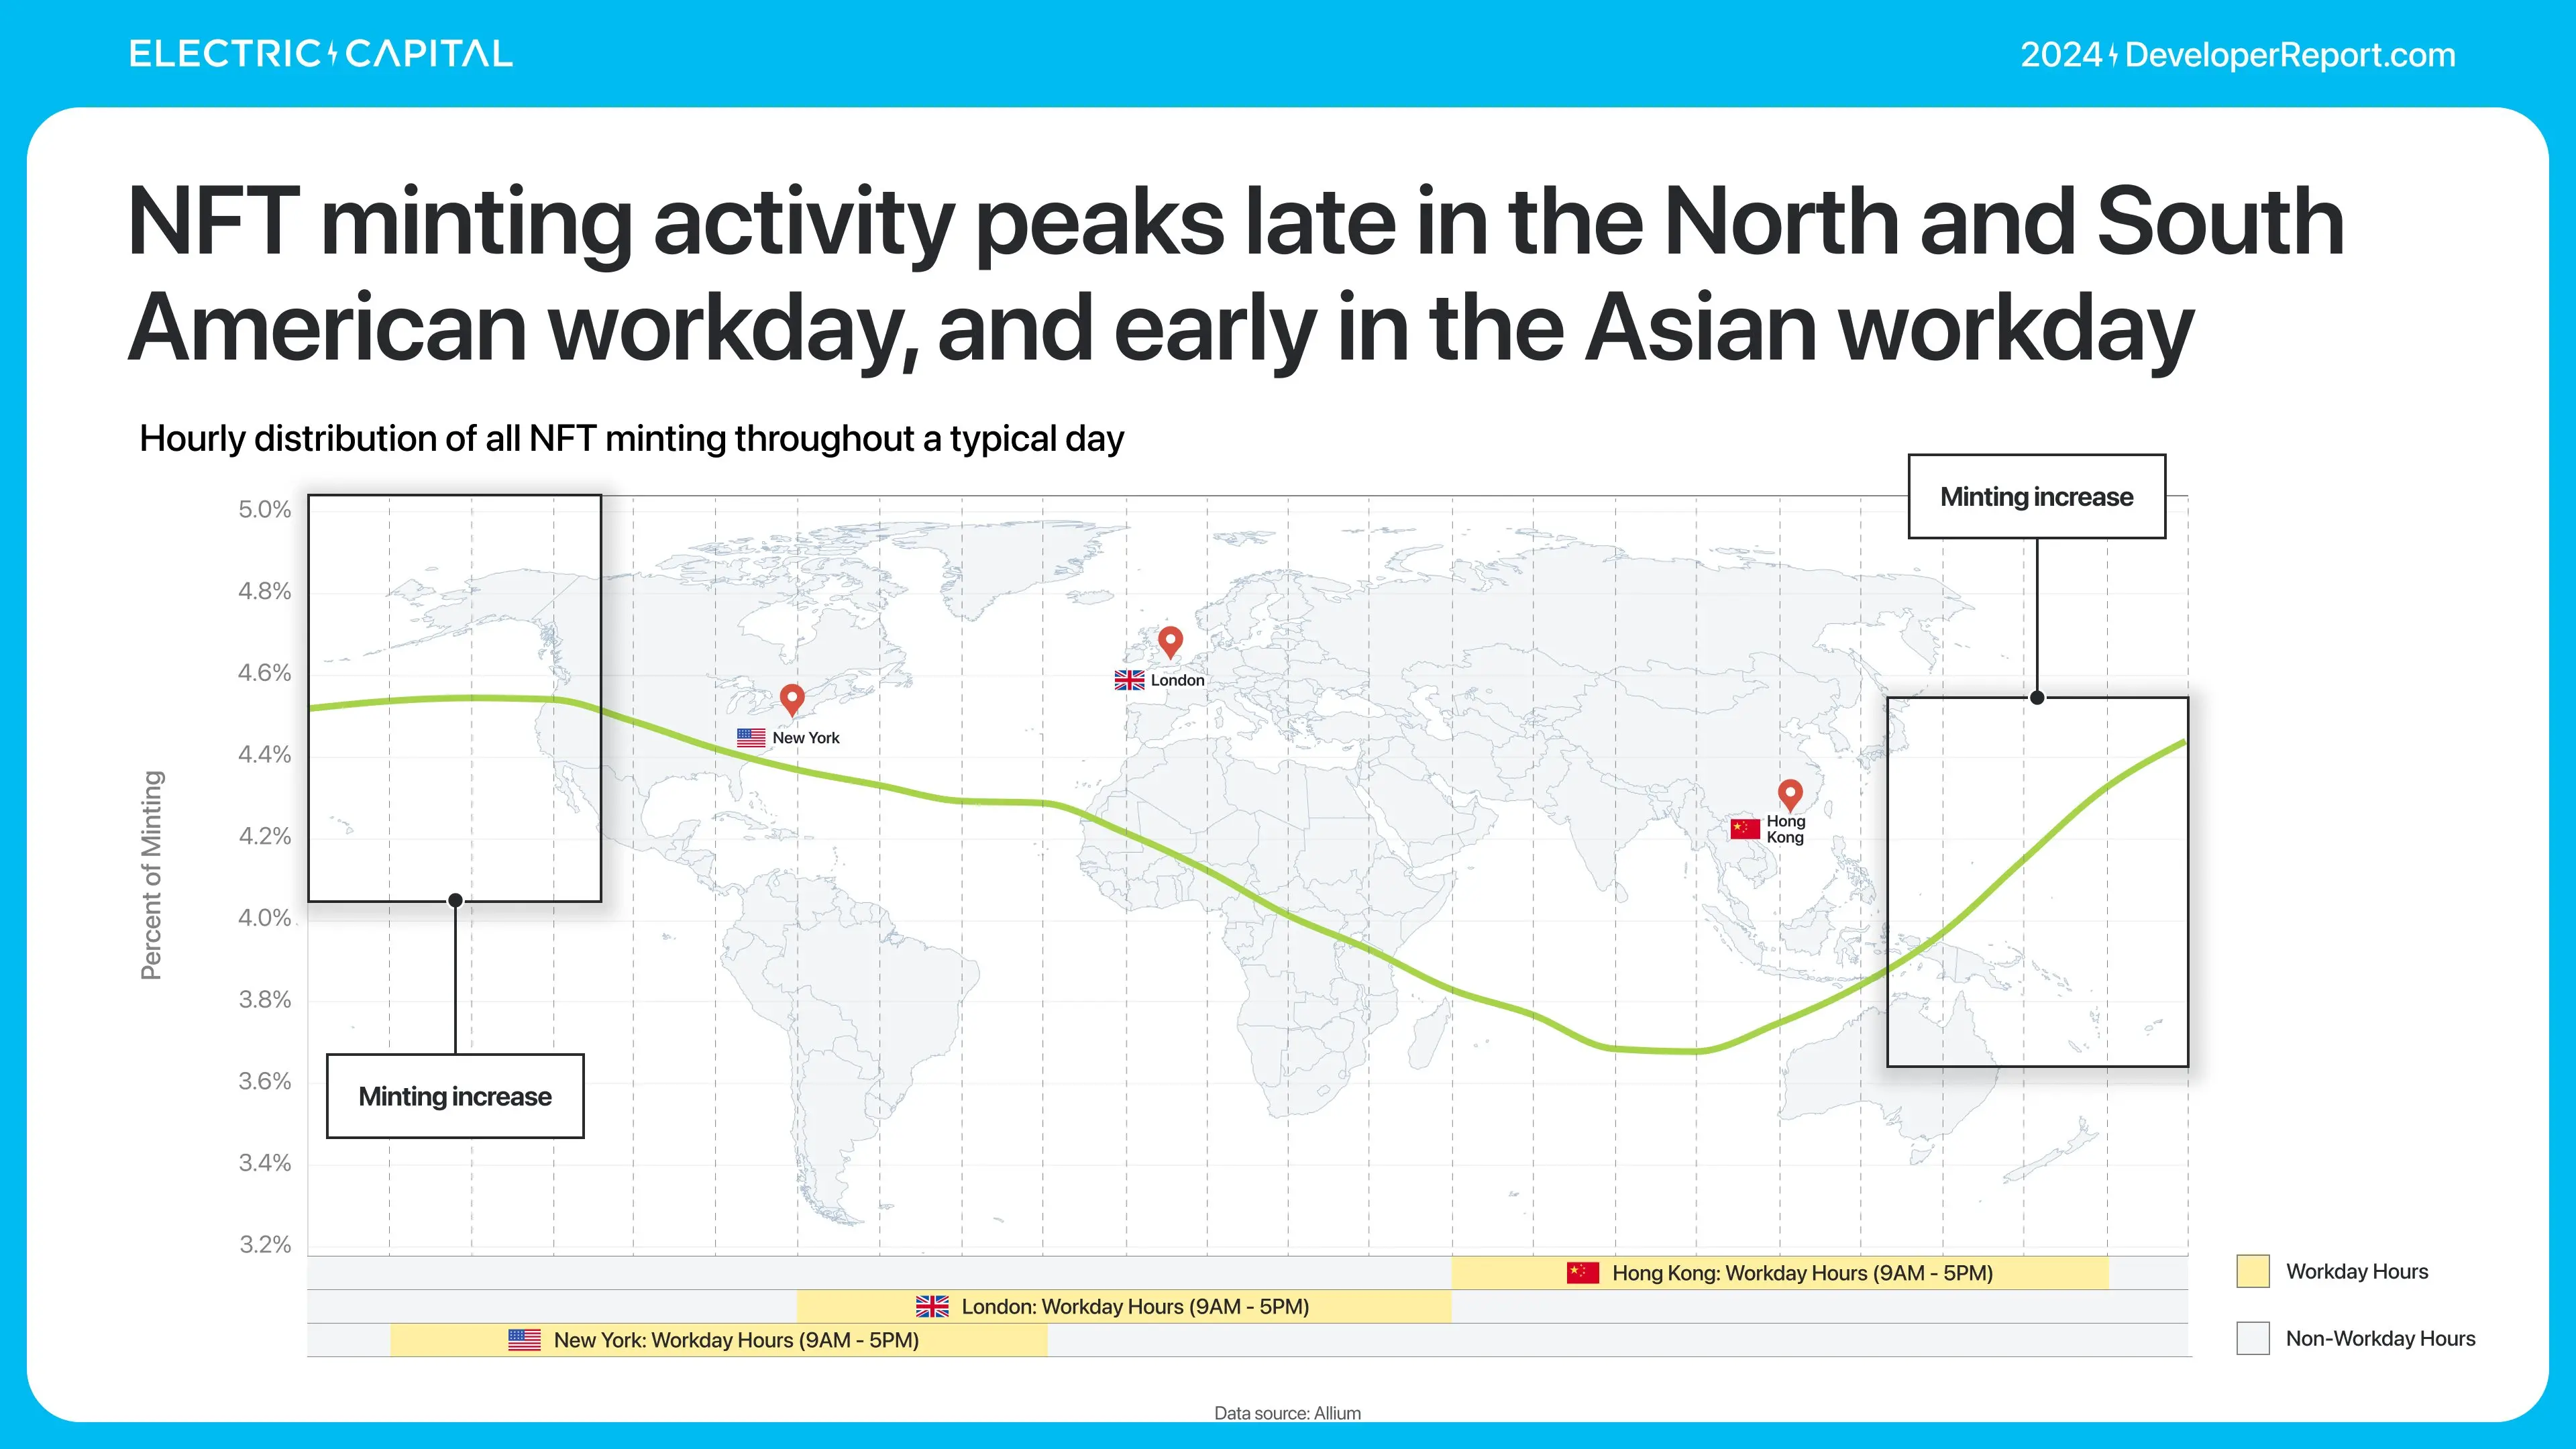
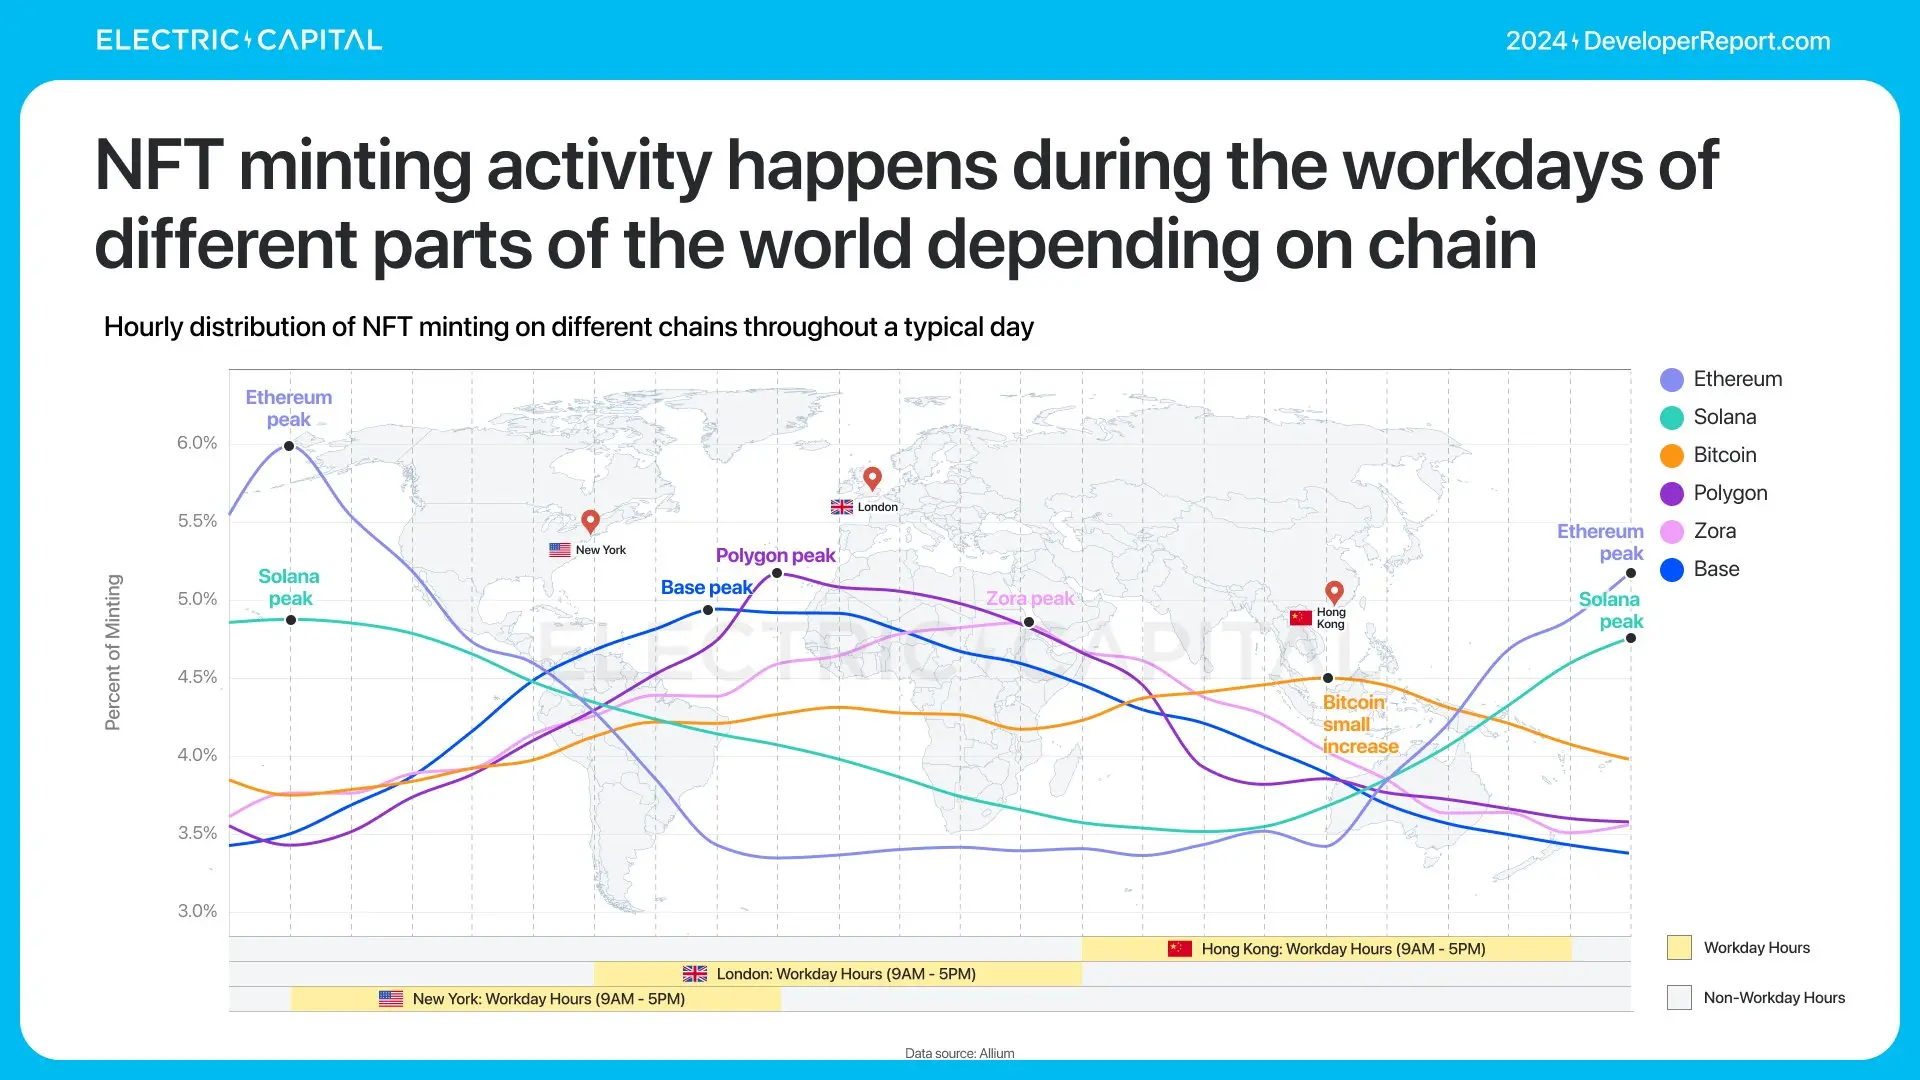
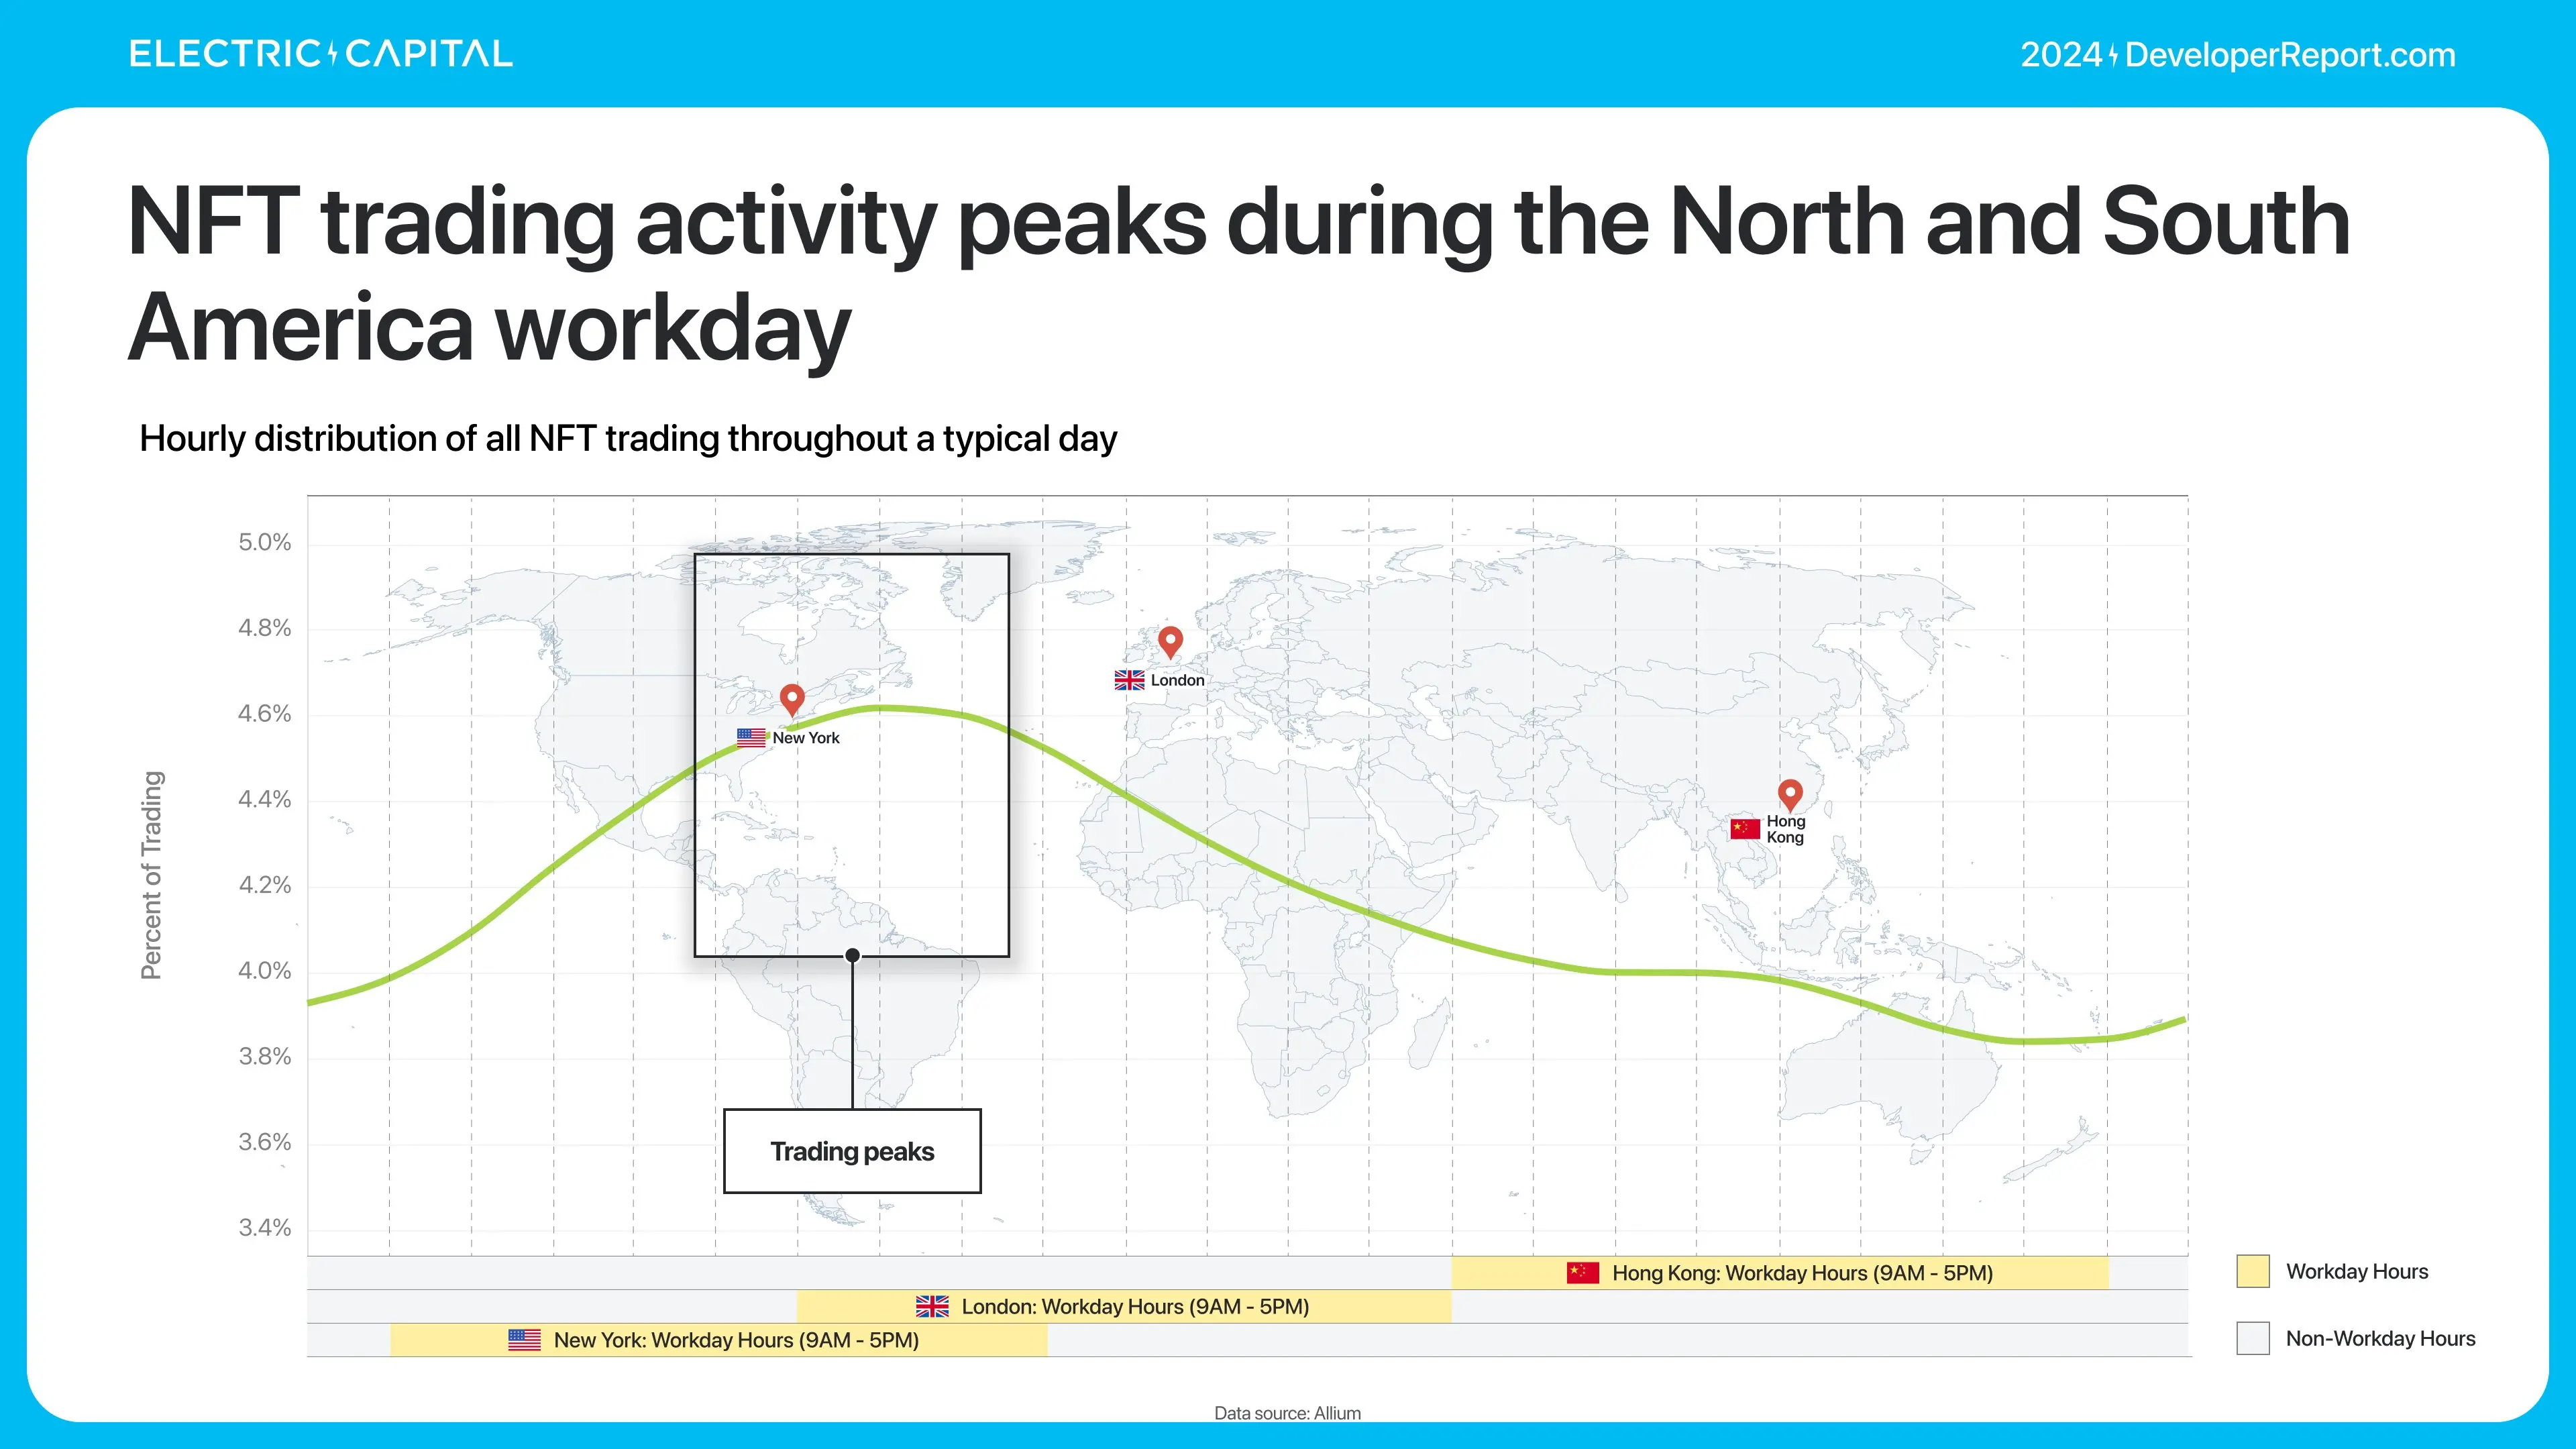
The trading volume of NFT minting and trading has peaked in different regions—indicating the presence of different user groups.
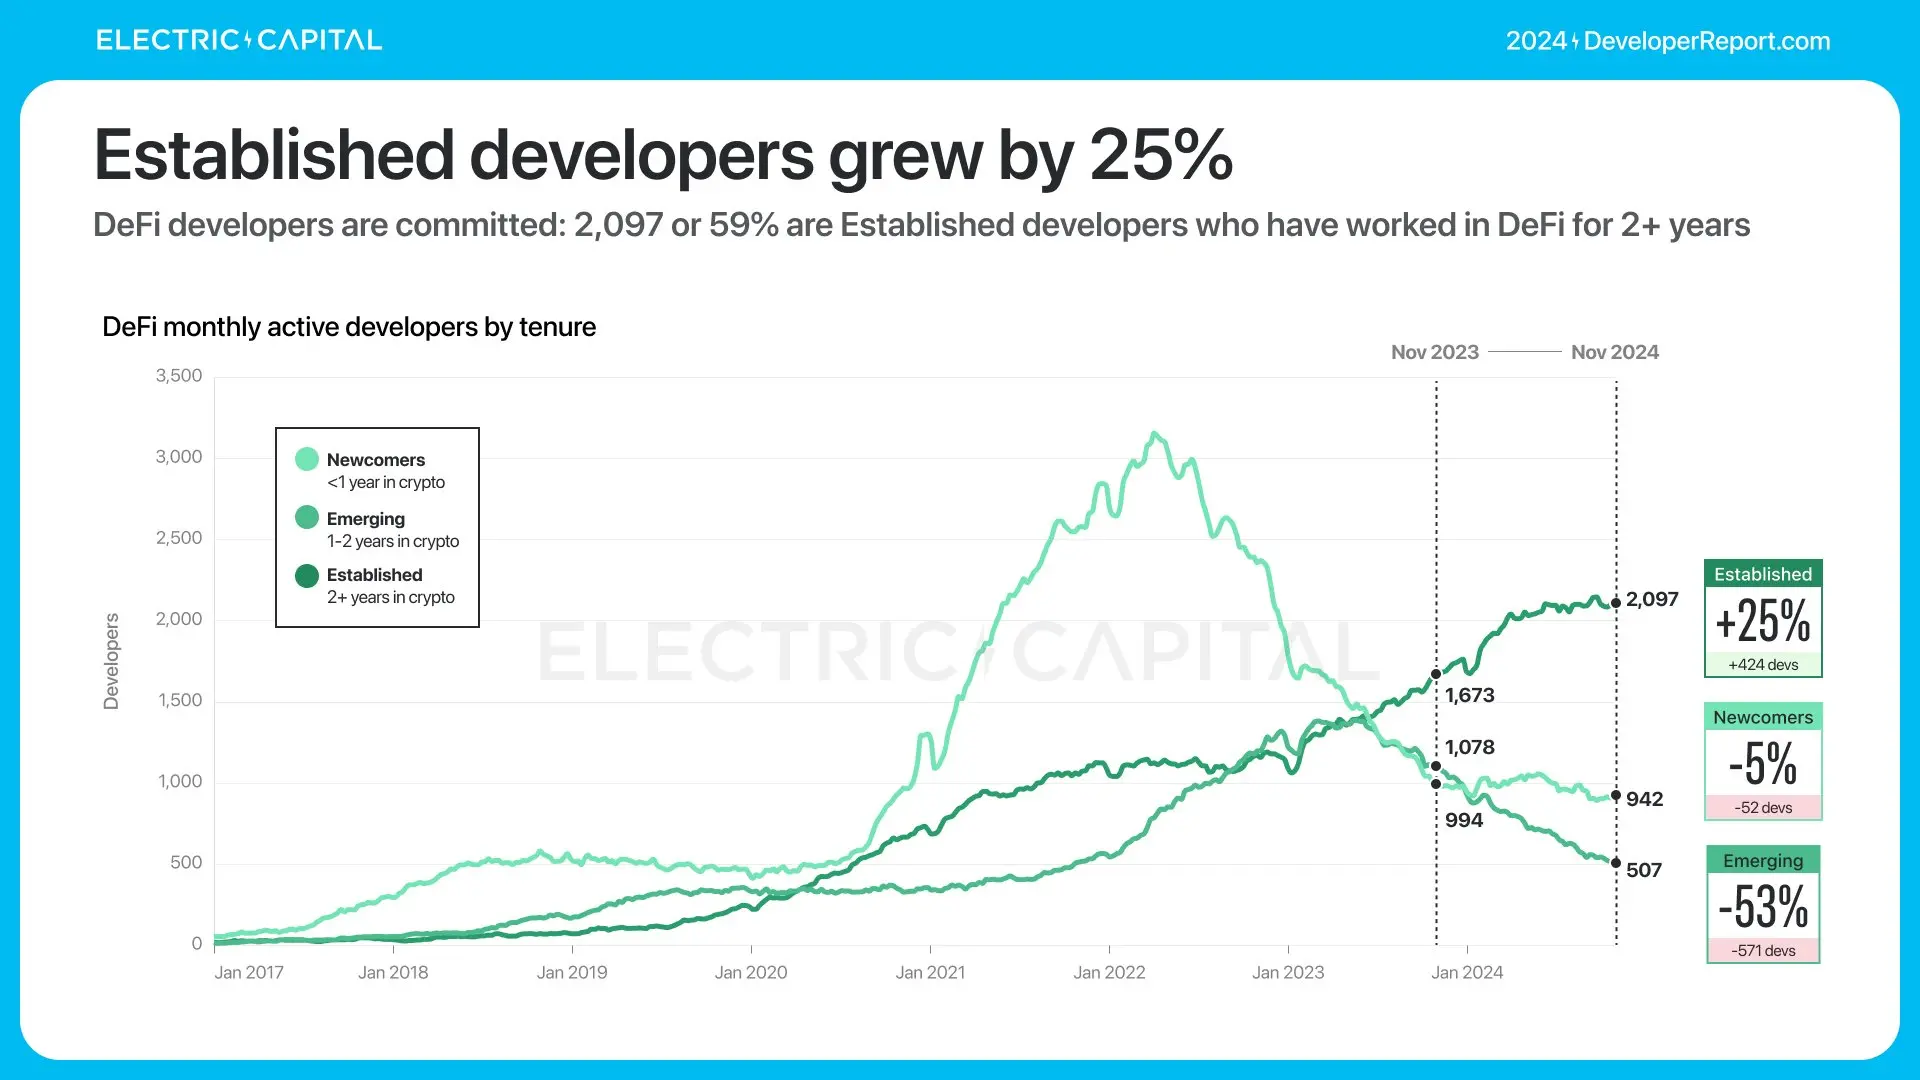
3,532 monthly active developers are engaged in DeFi development. DeFi developers are experienced—2,097 of them (59%) have been working in DeFi for over 2 years.
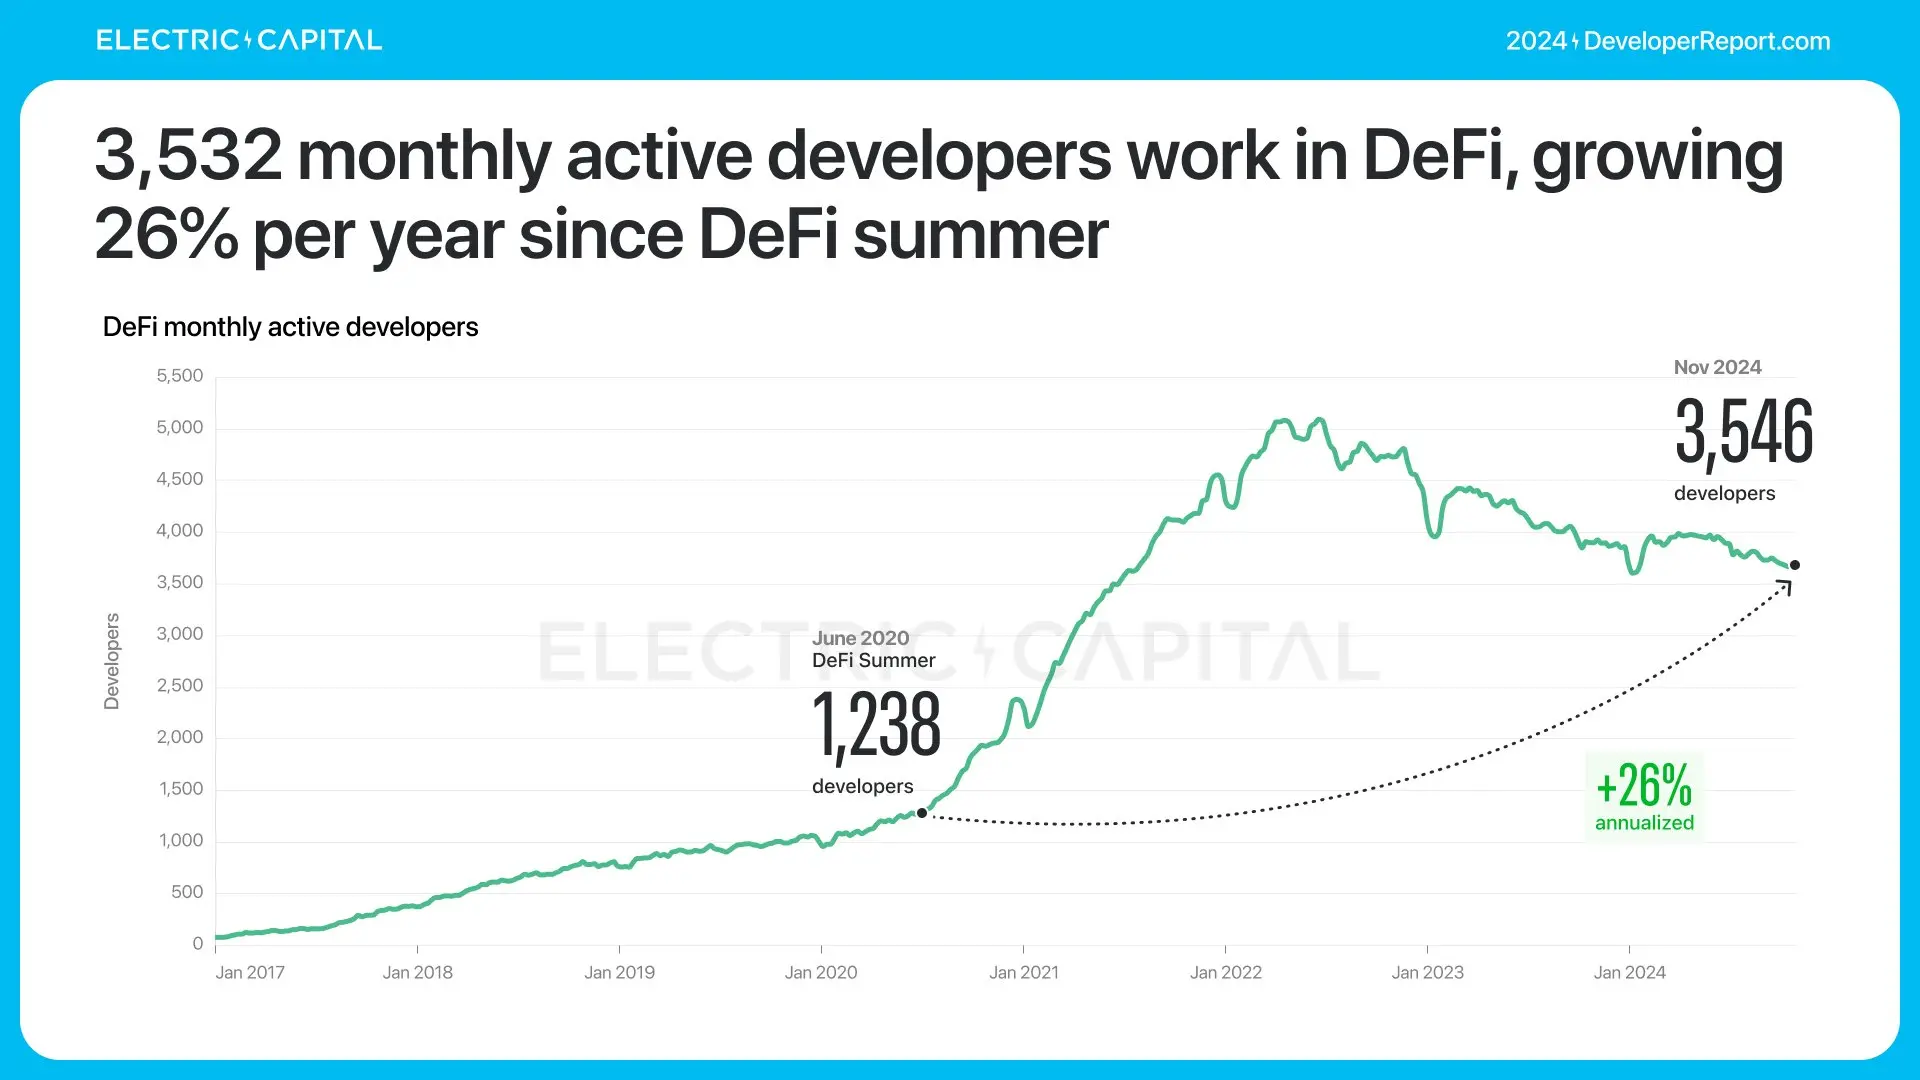
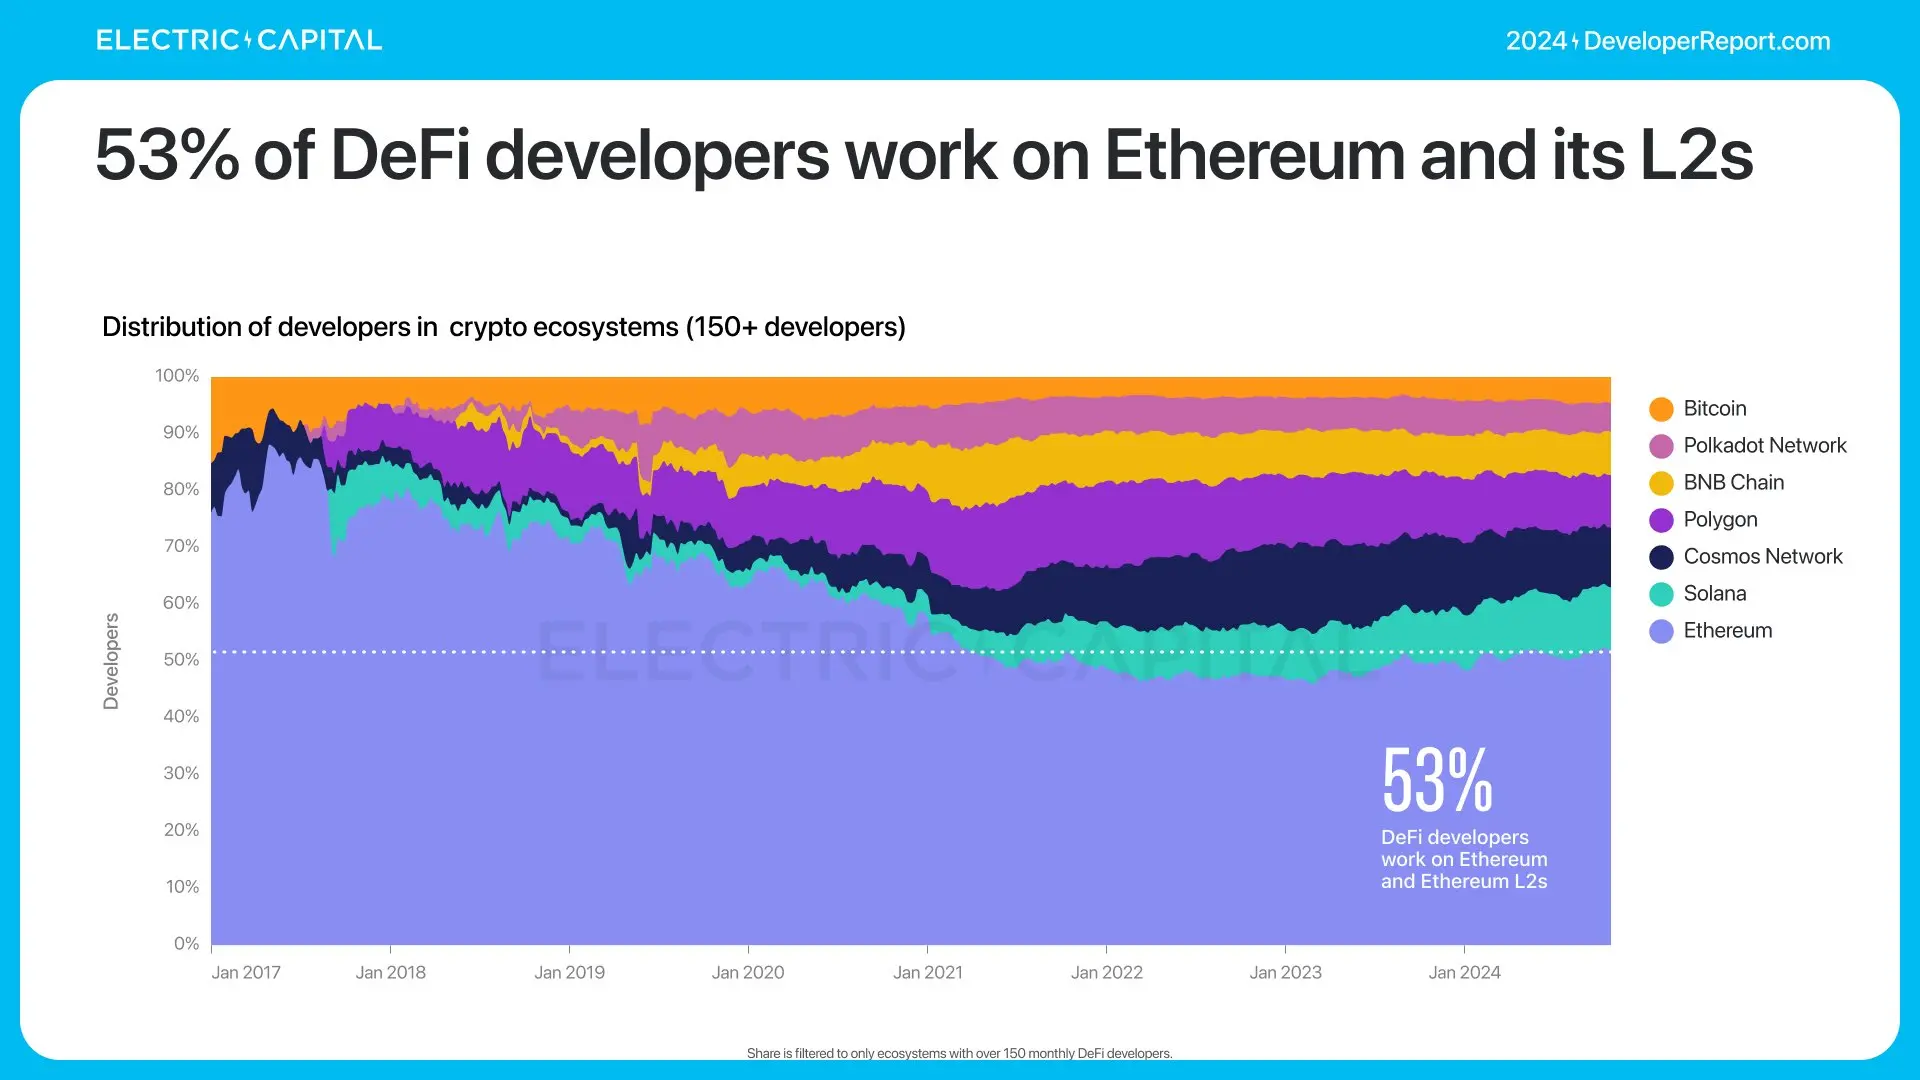
53% of DeFi developers work on Ethereum and its L2 chains.
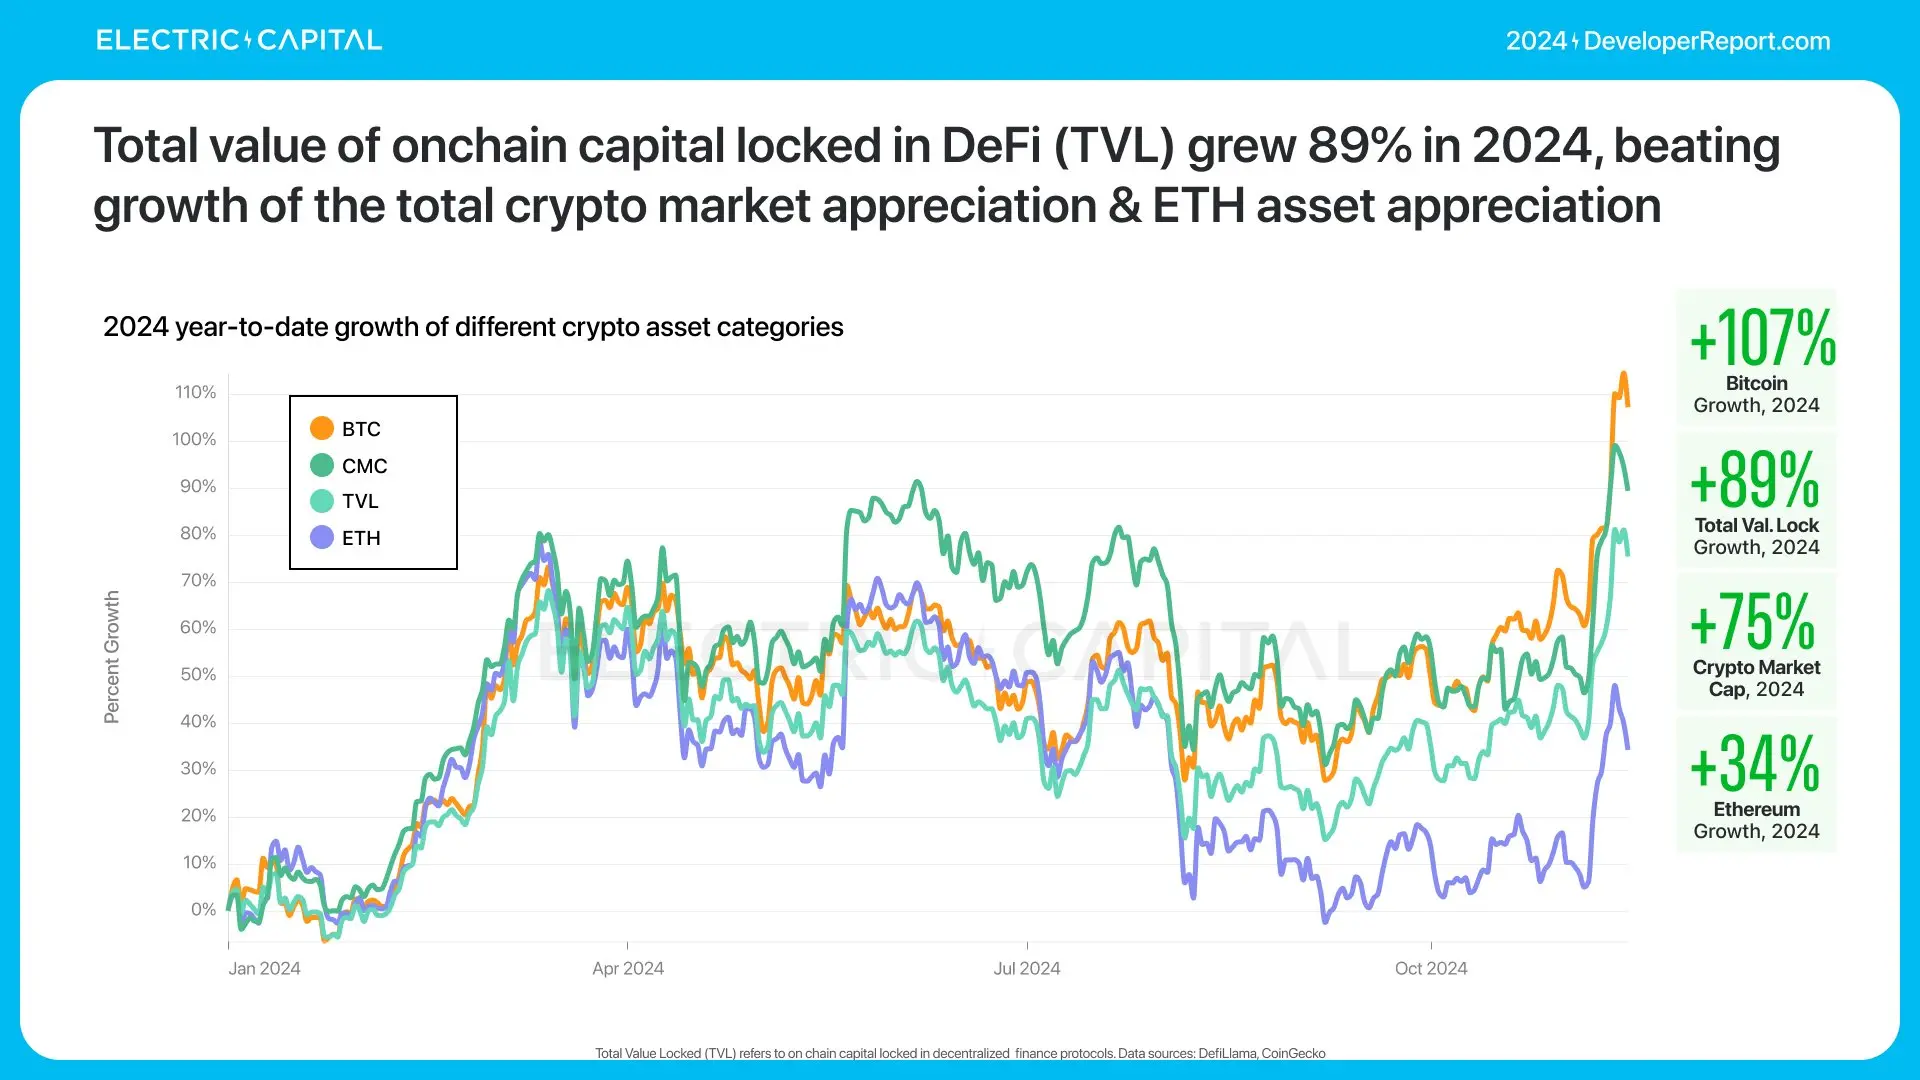
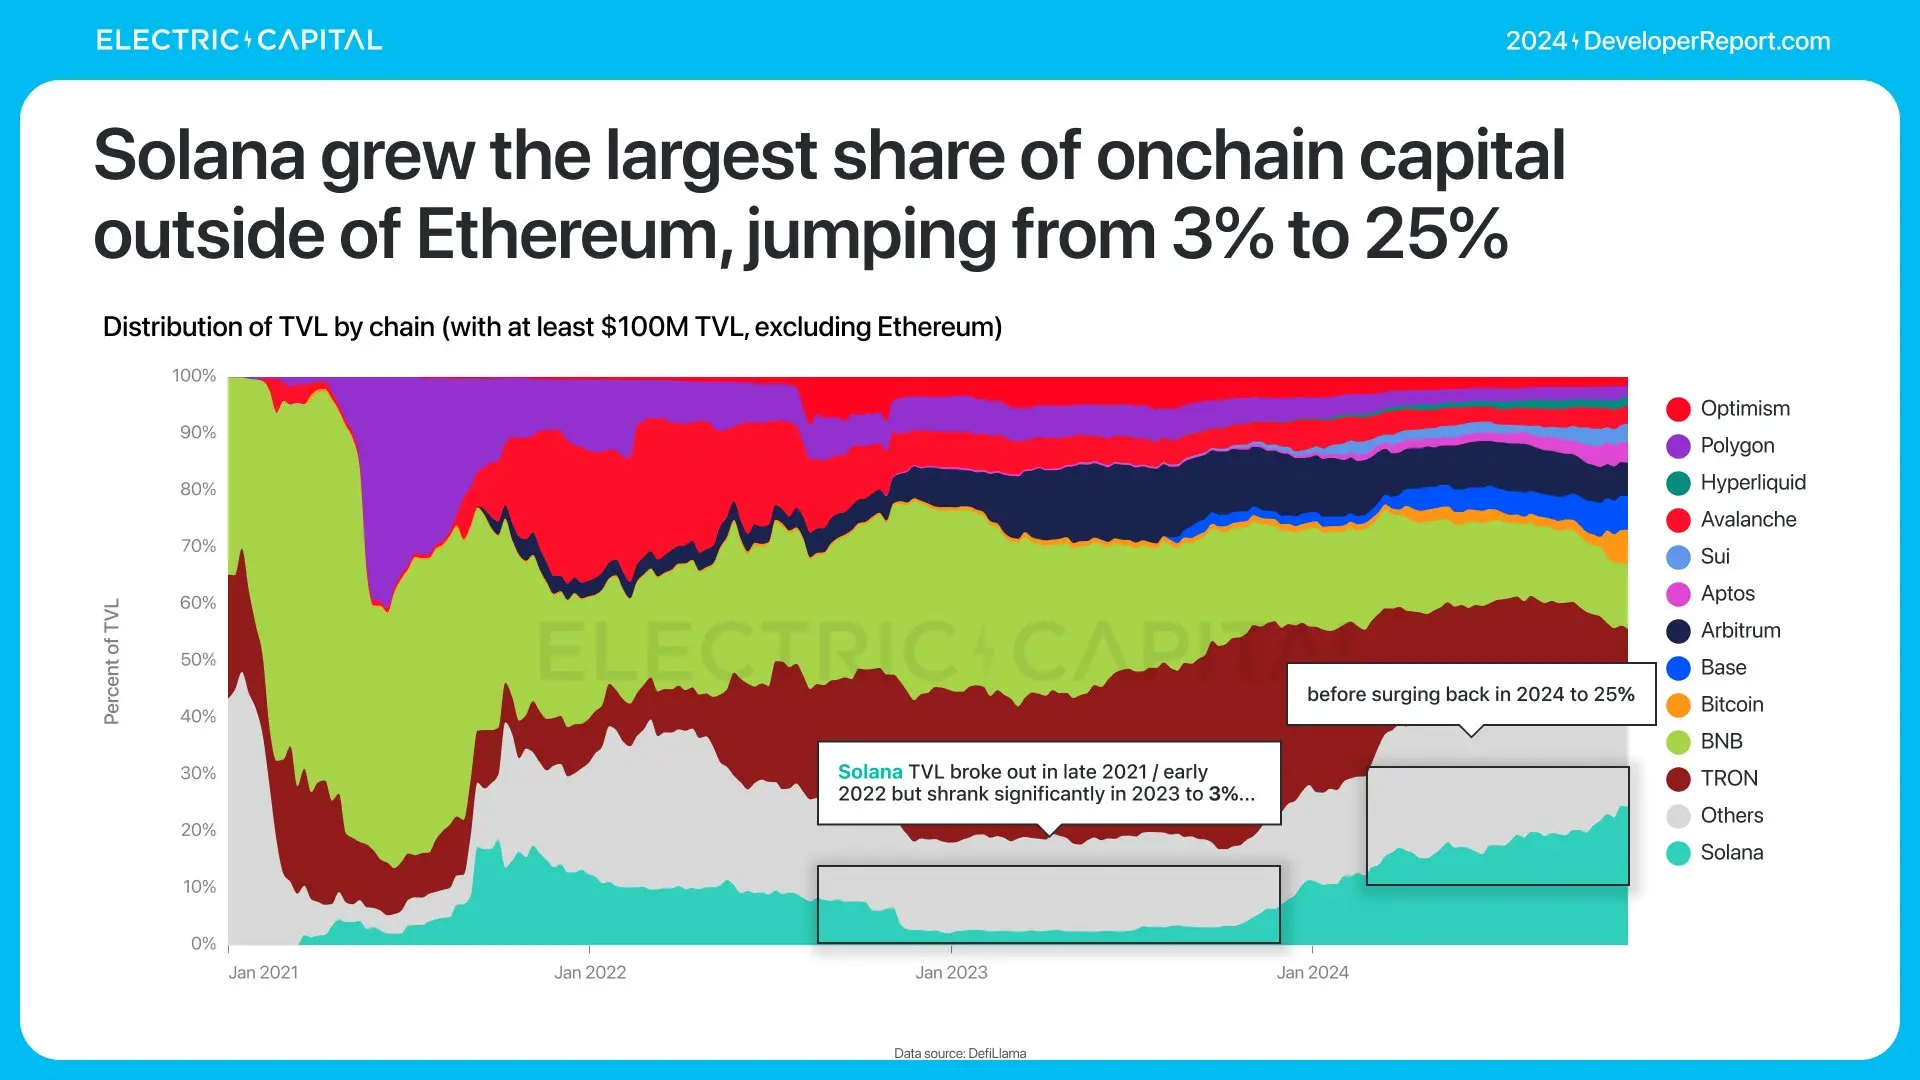
In 2024, the total value locked (TVL) in DeFi grew by 89%.
Ethereum's TVL dominates, being 7 times that of the second-largest chain.
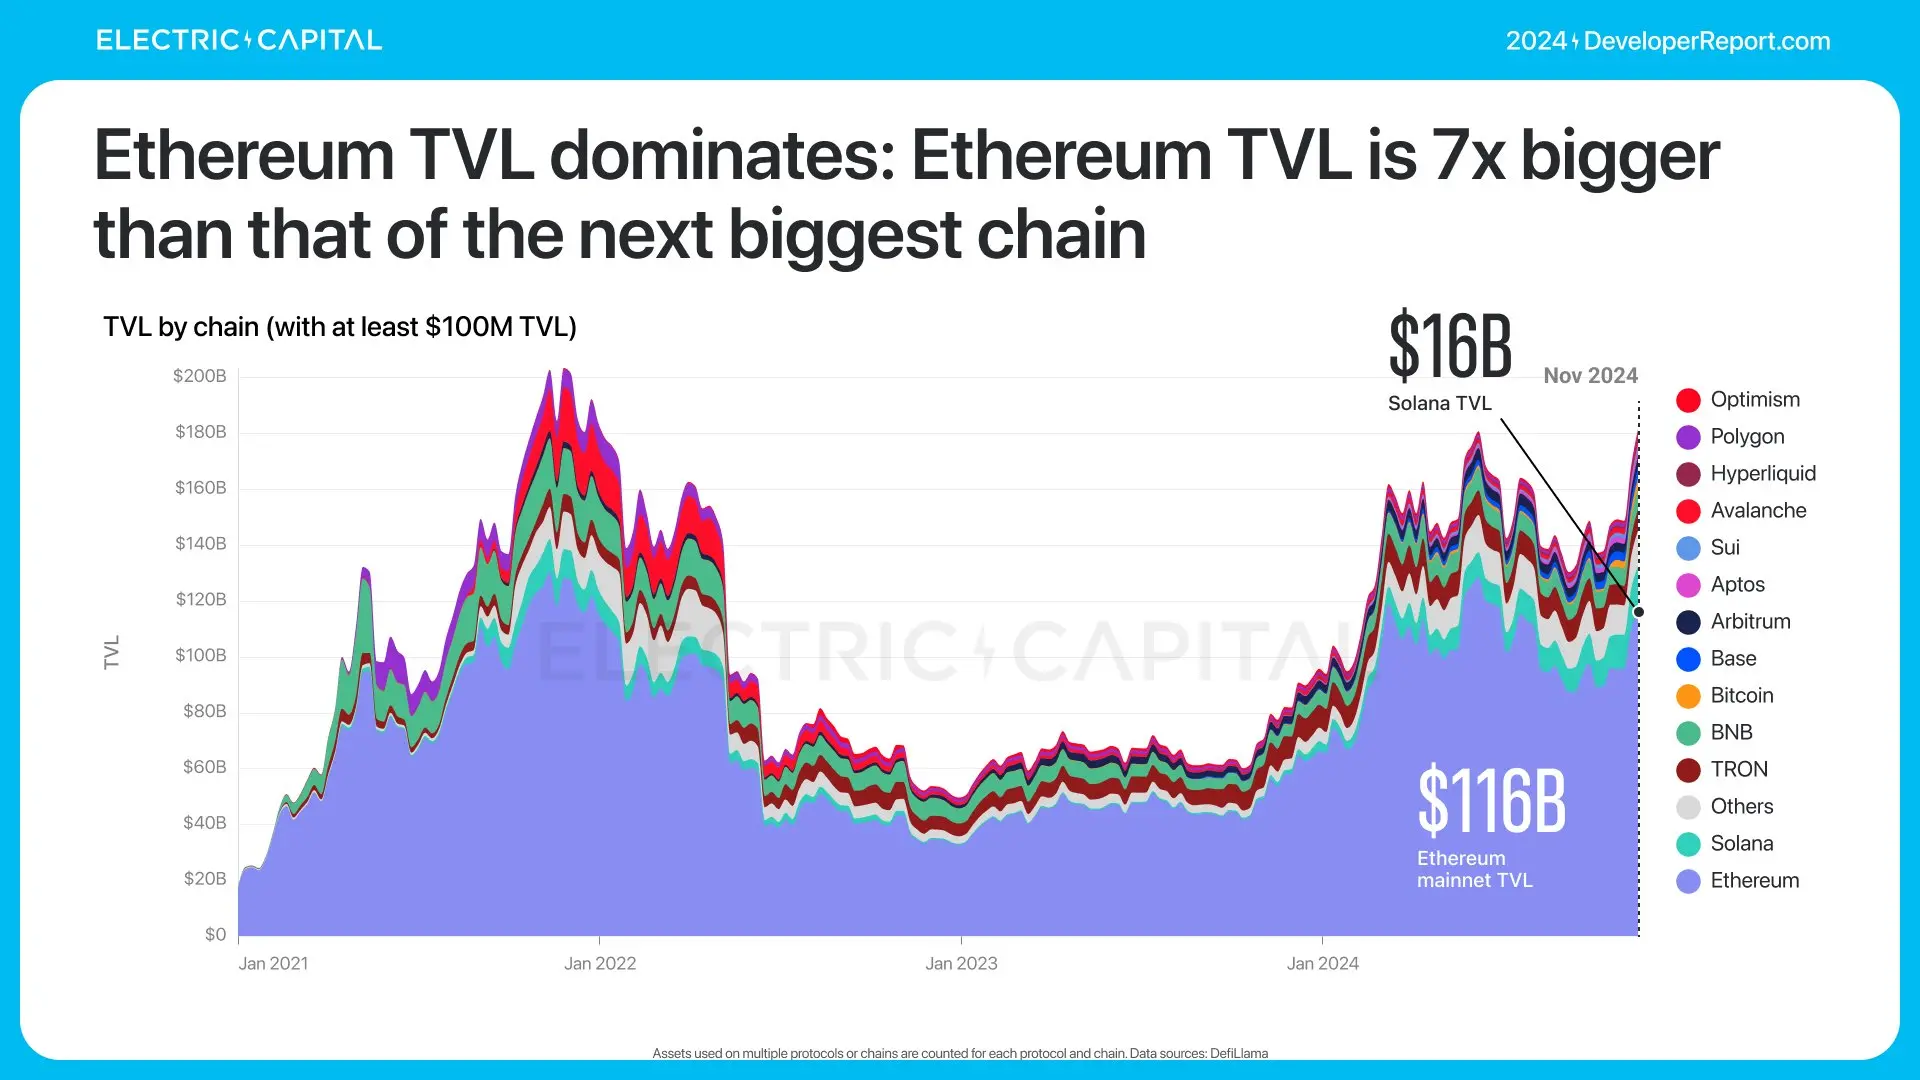
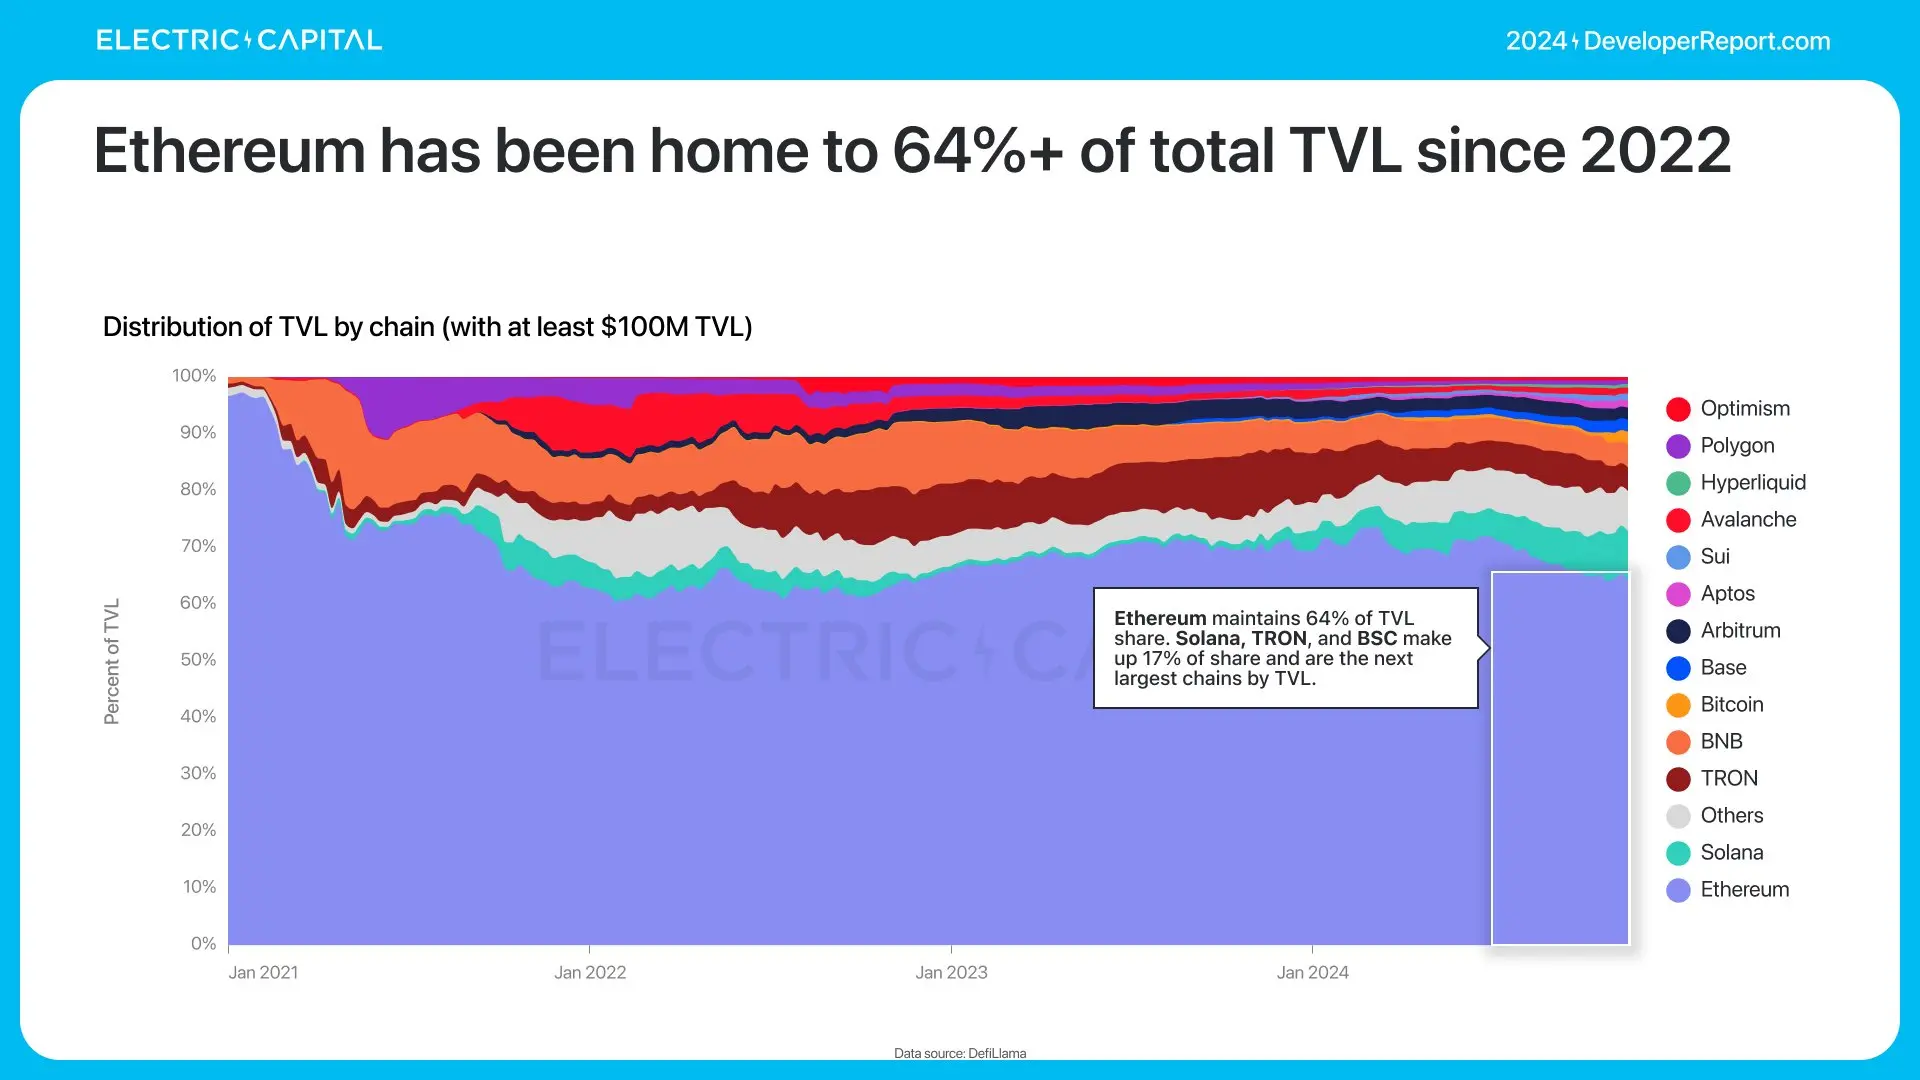
Most of the TVL has consistently been concentrated on Ethereum.
Non-Ethereum TVL has grown from 3% to 36% over the past 3 years.
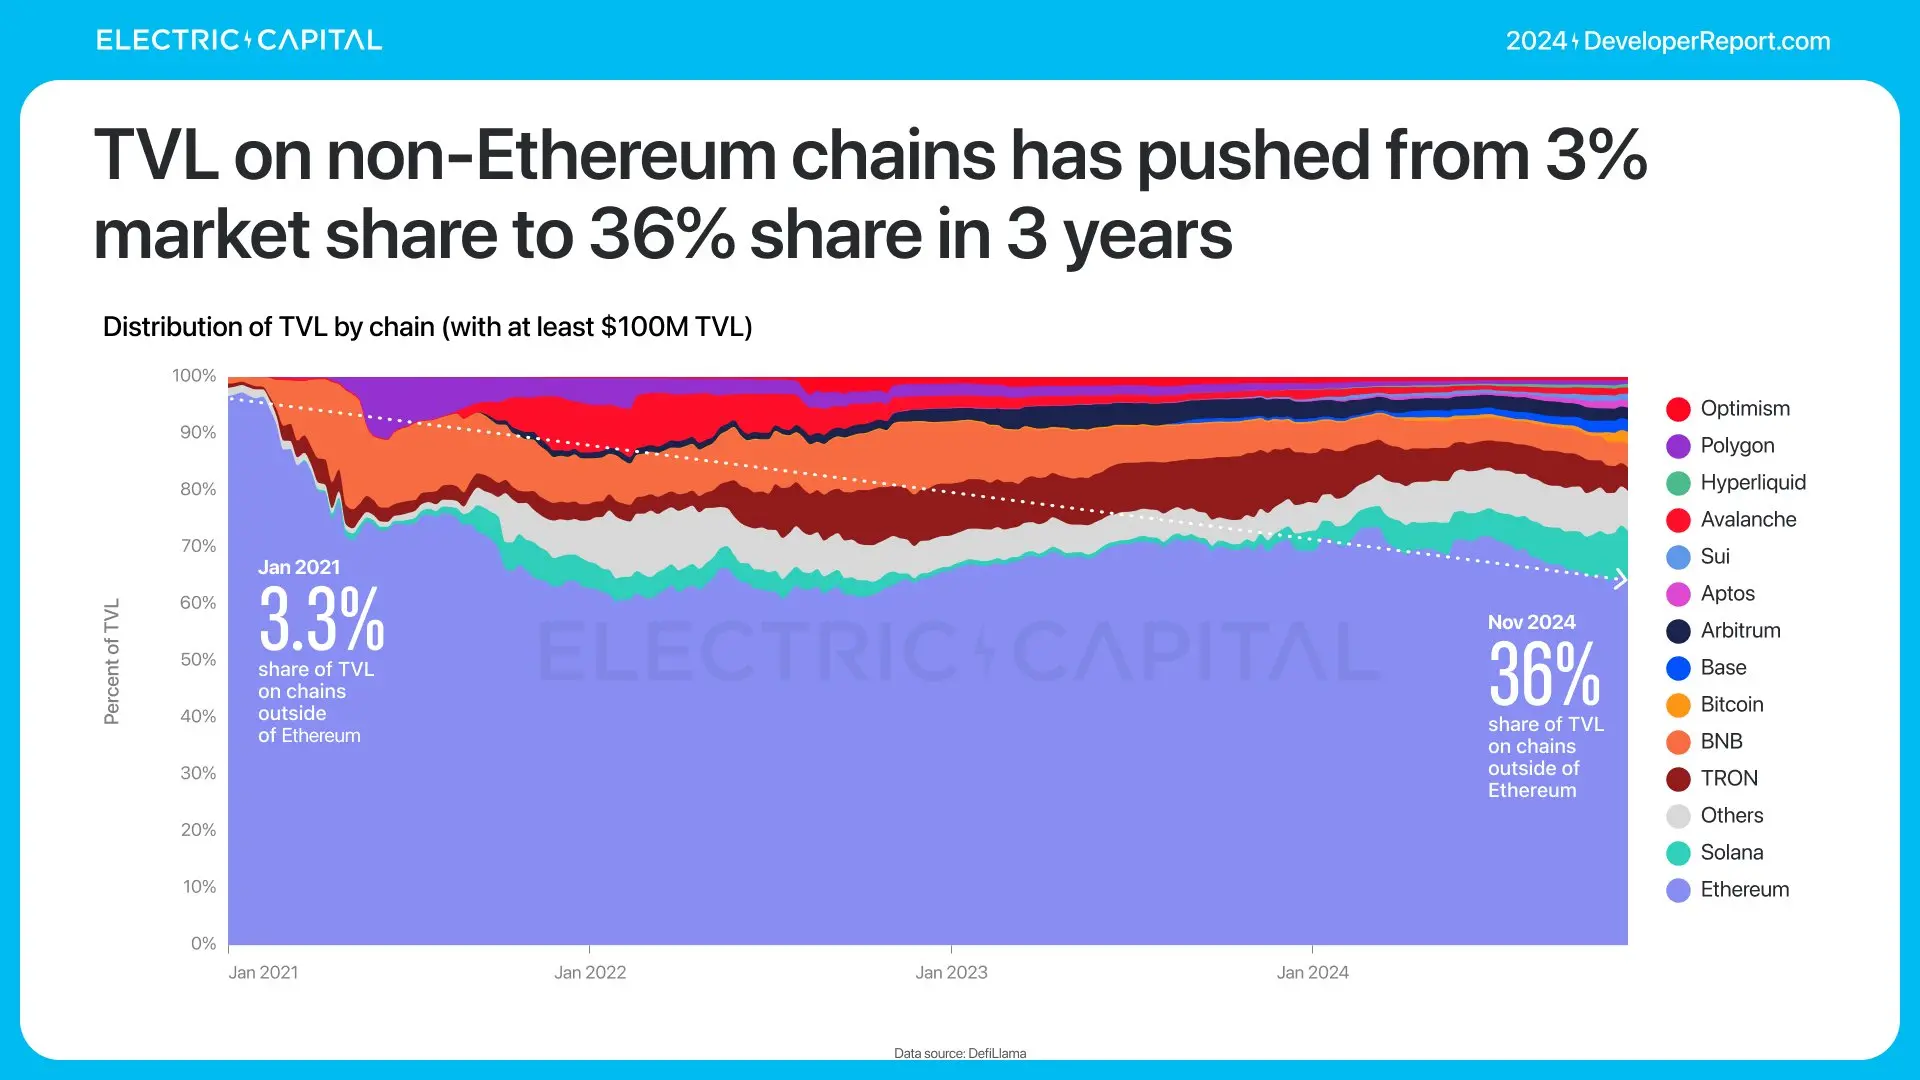
The largest leap in TVL share occurred on Solana.
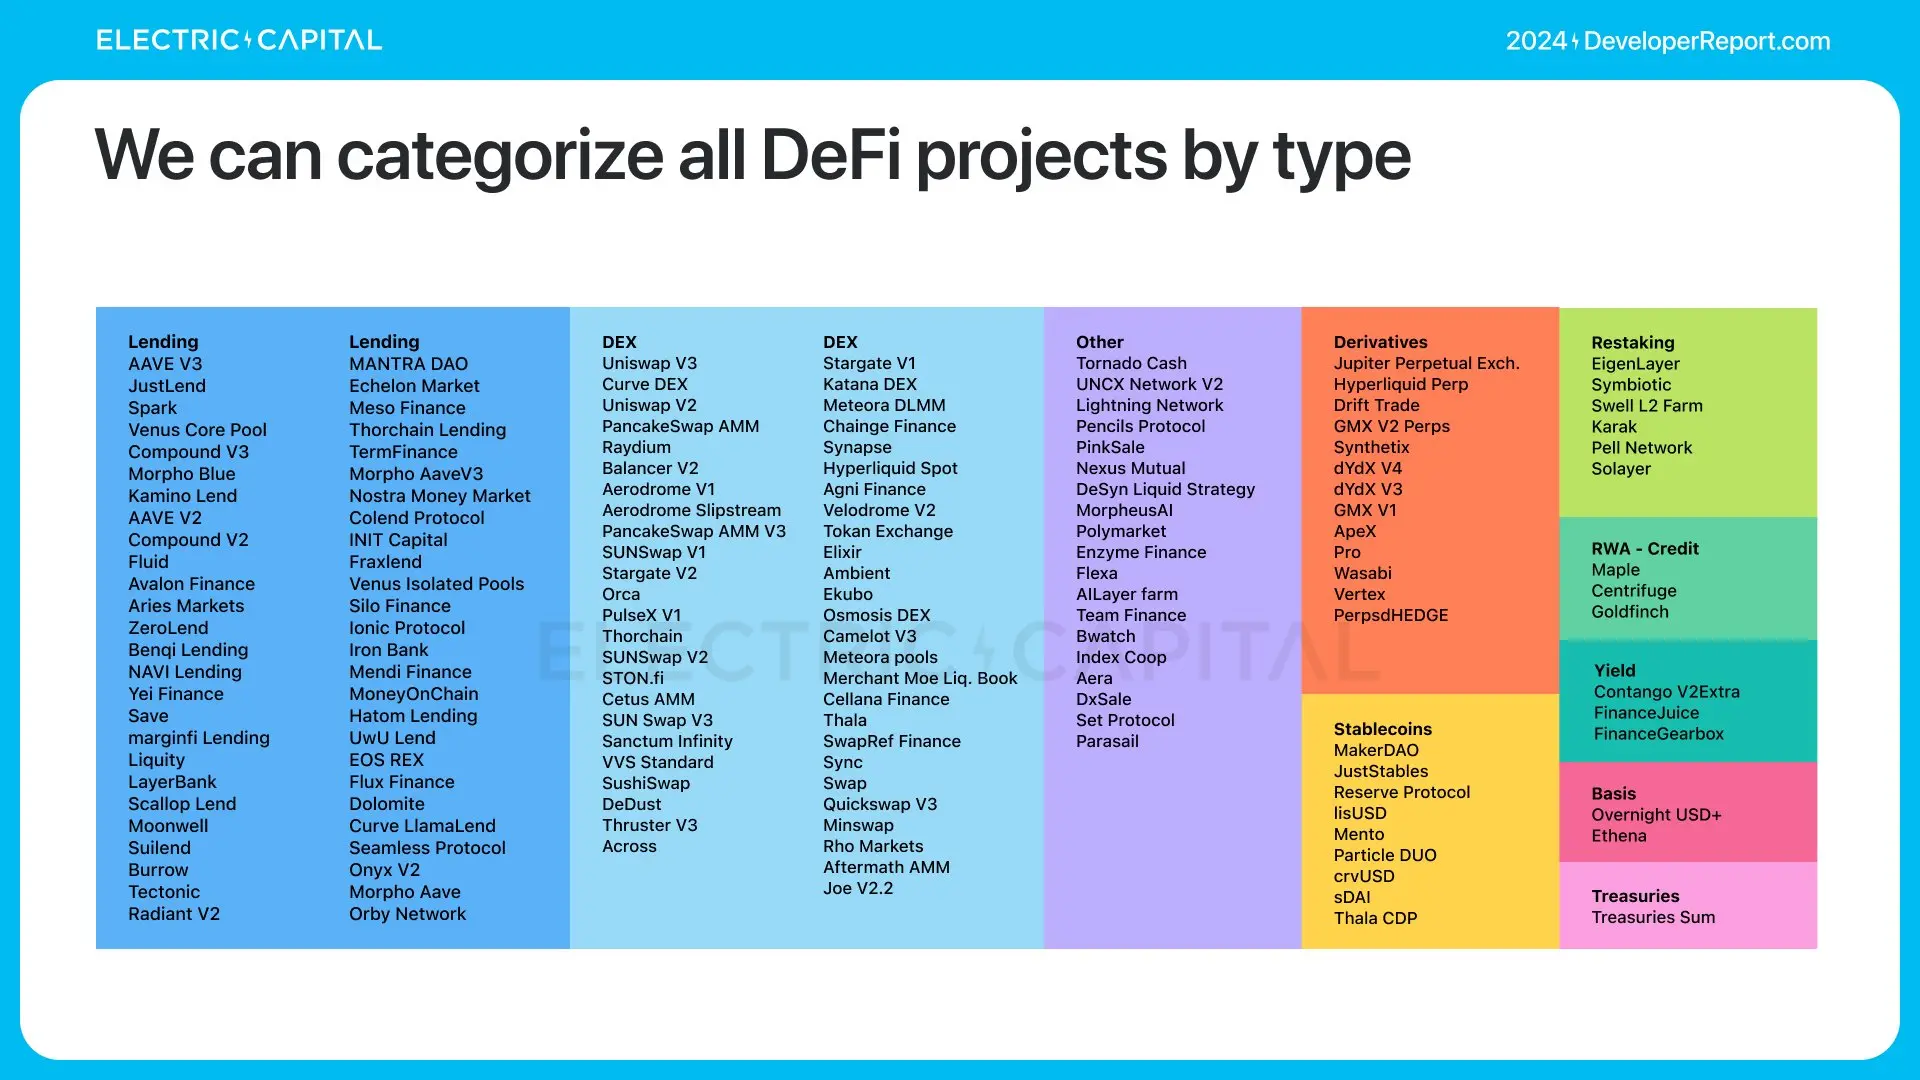
What is driving all this TVL growth? We can categorize DeFi developers by developer type.
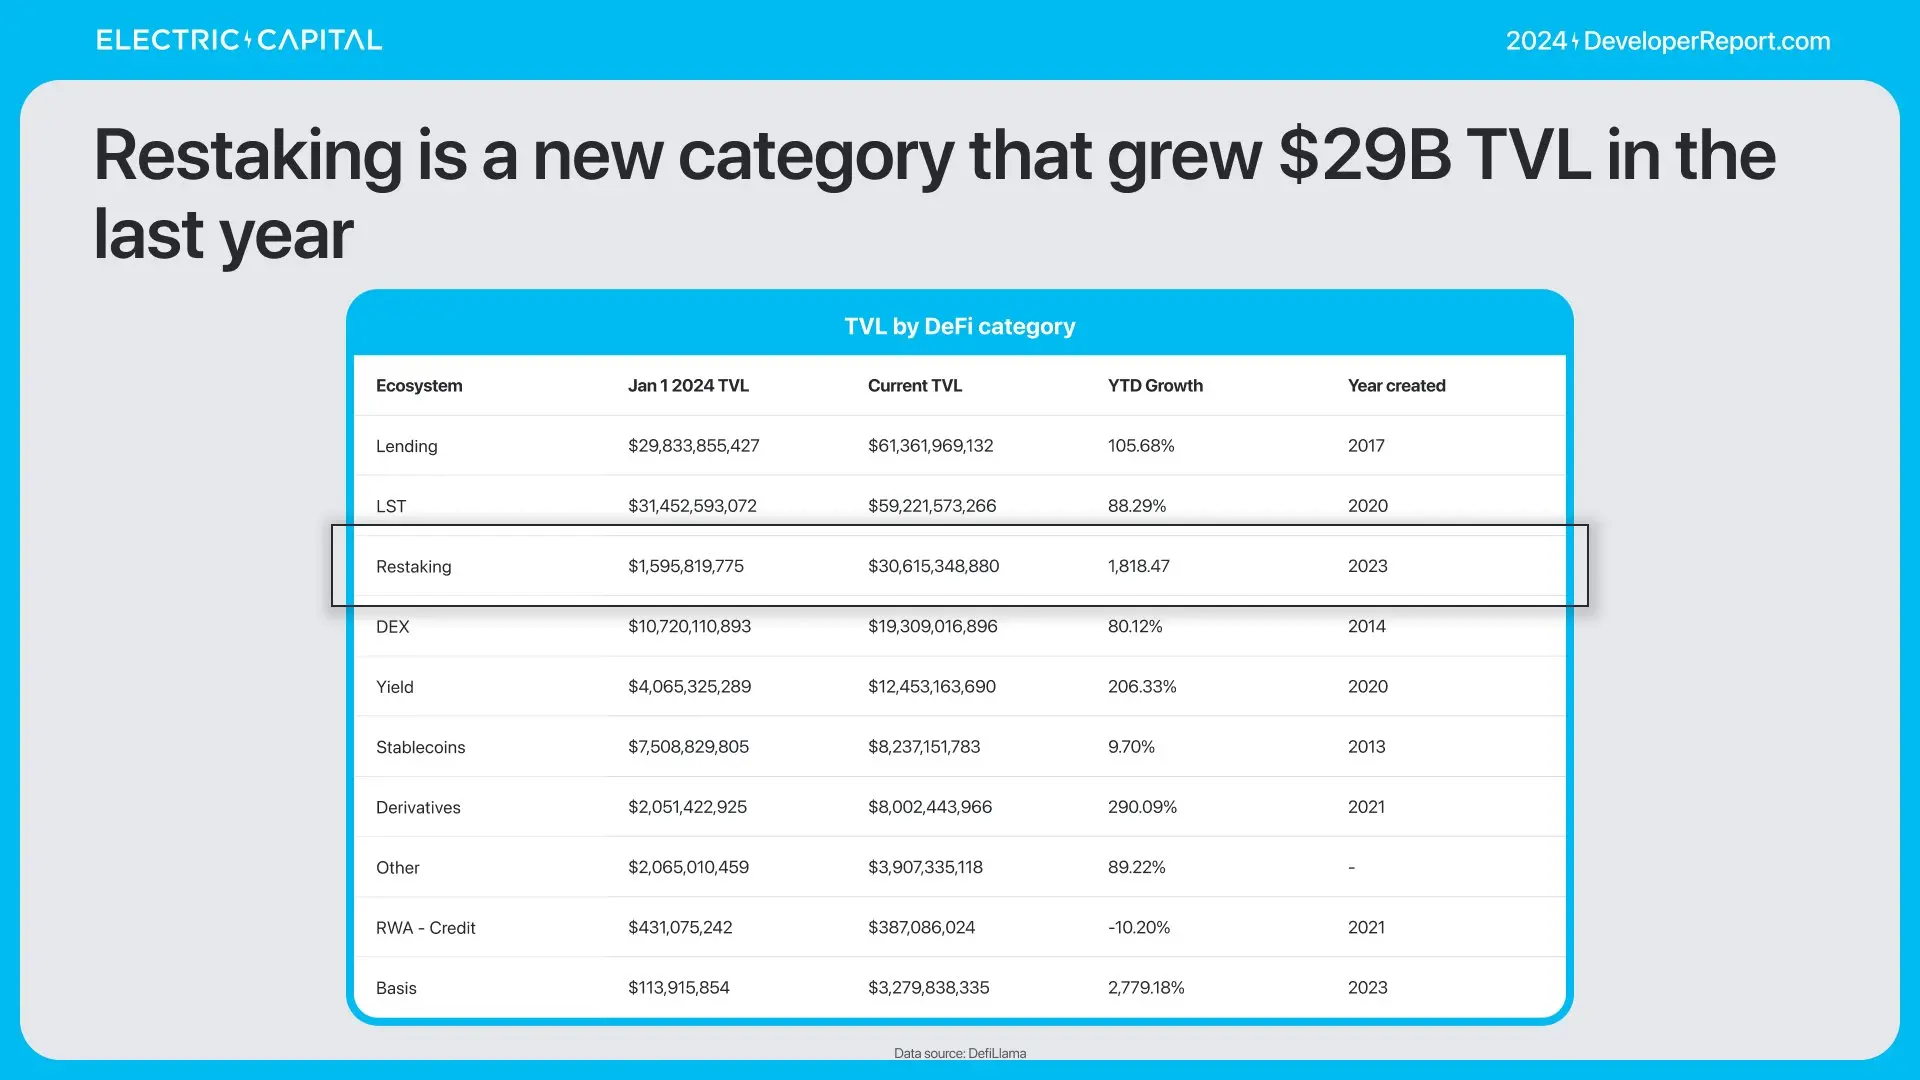
In the past year, restaking has grown by $29 billion in TVL.
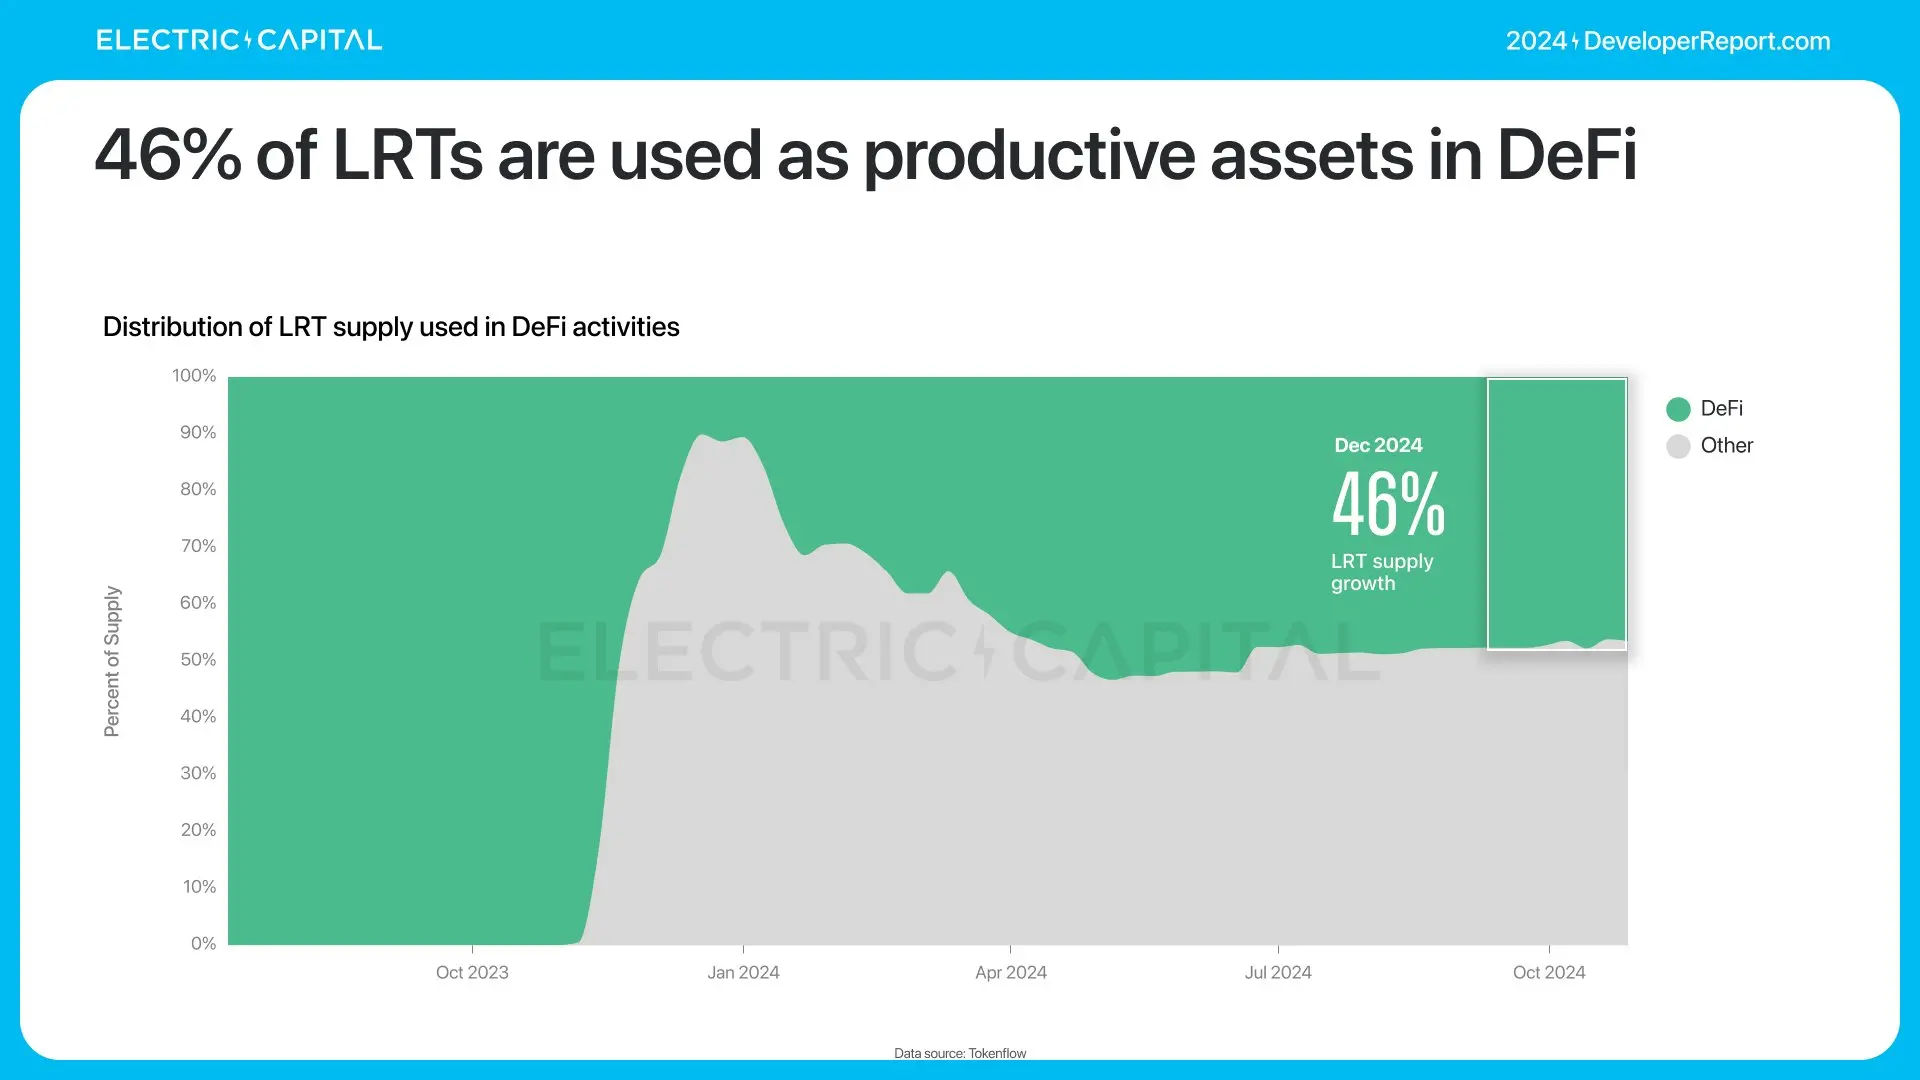
LRTs have grown to over 3.5 million ETH.
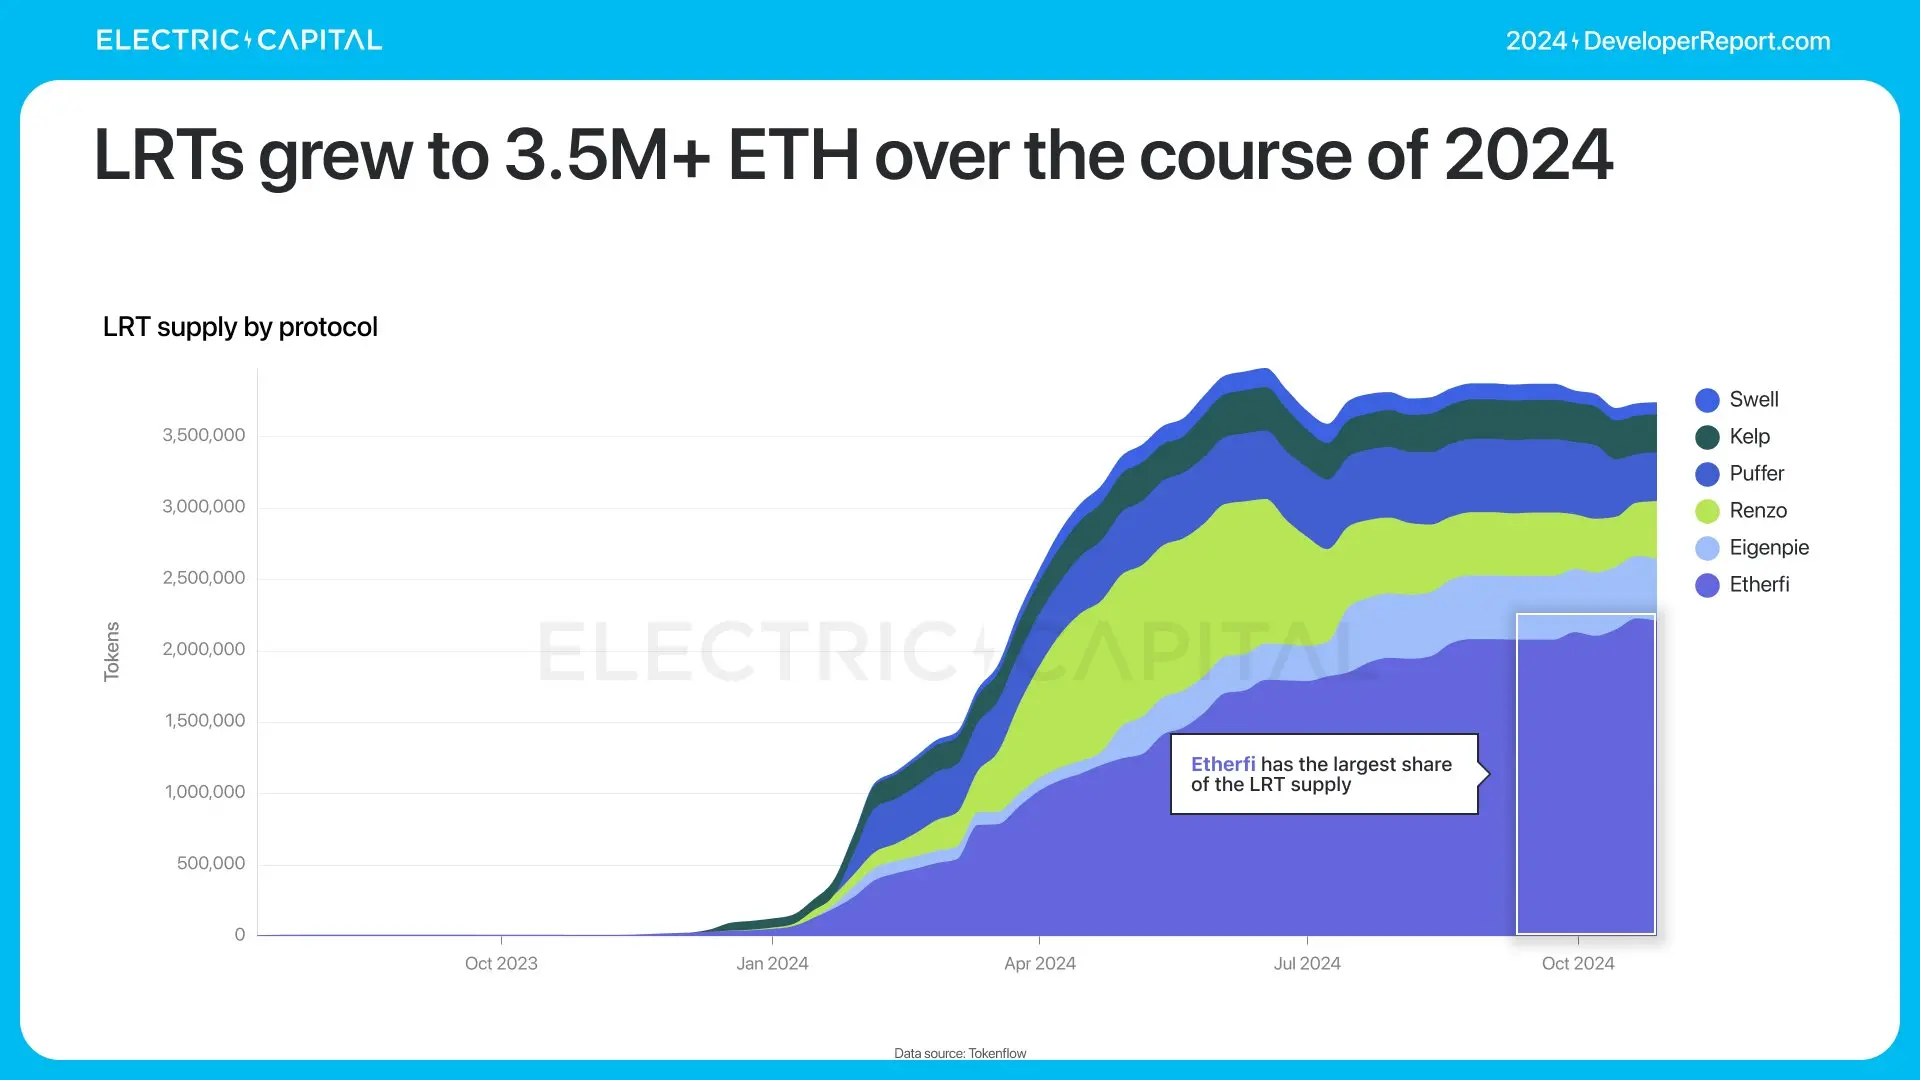
46% of LRTs are used in DeFi.
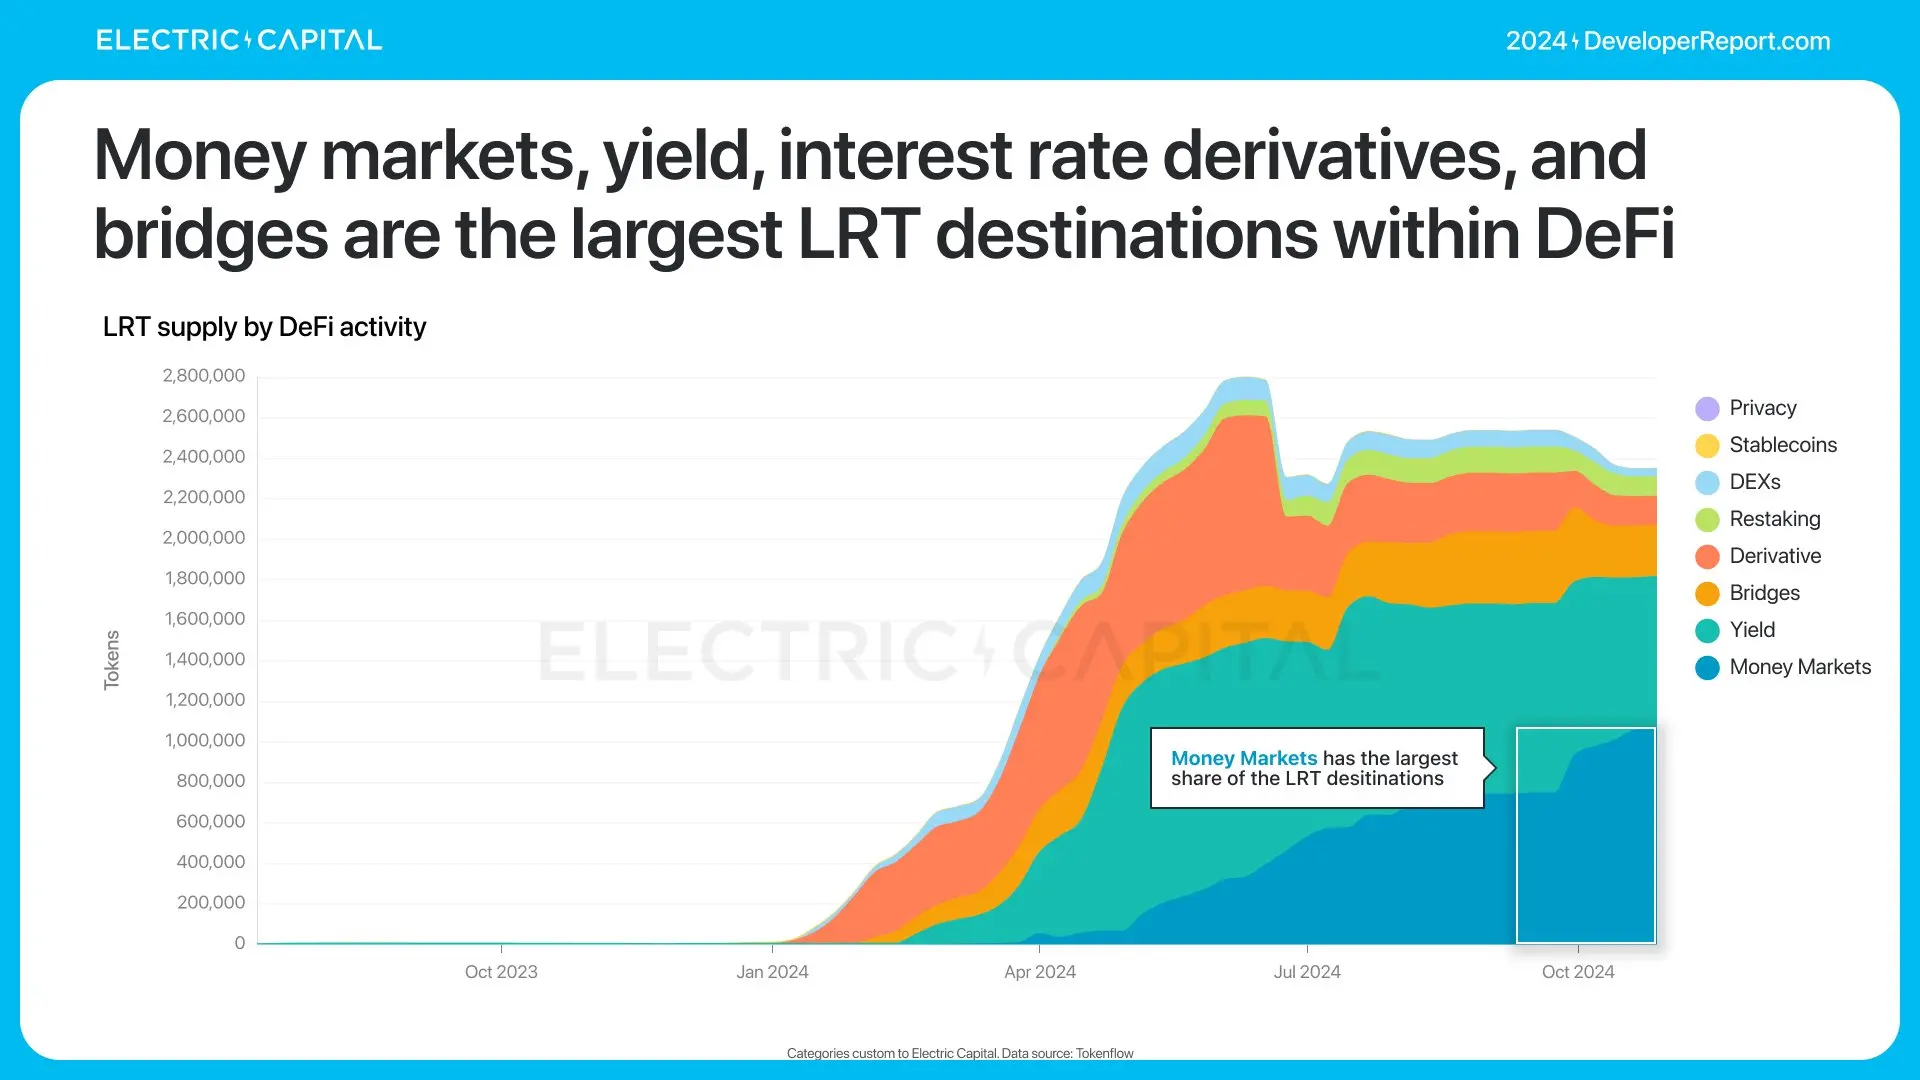
Most LRTs are deposited in money markets, yield, interest rate derivatives, and bridging platforms.
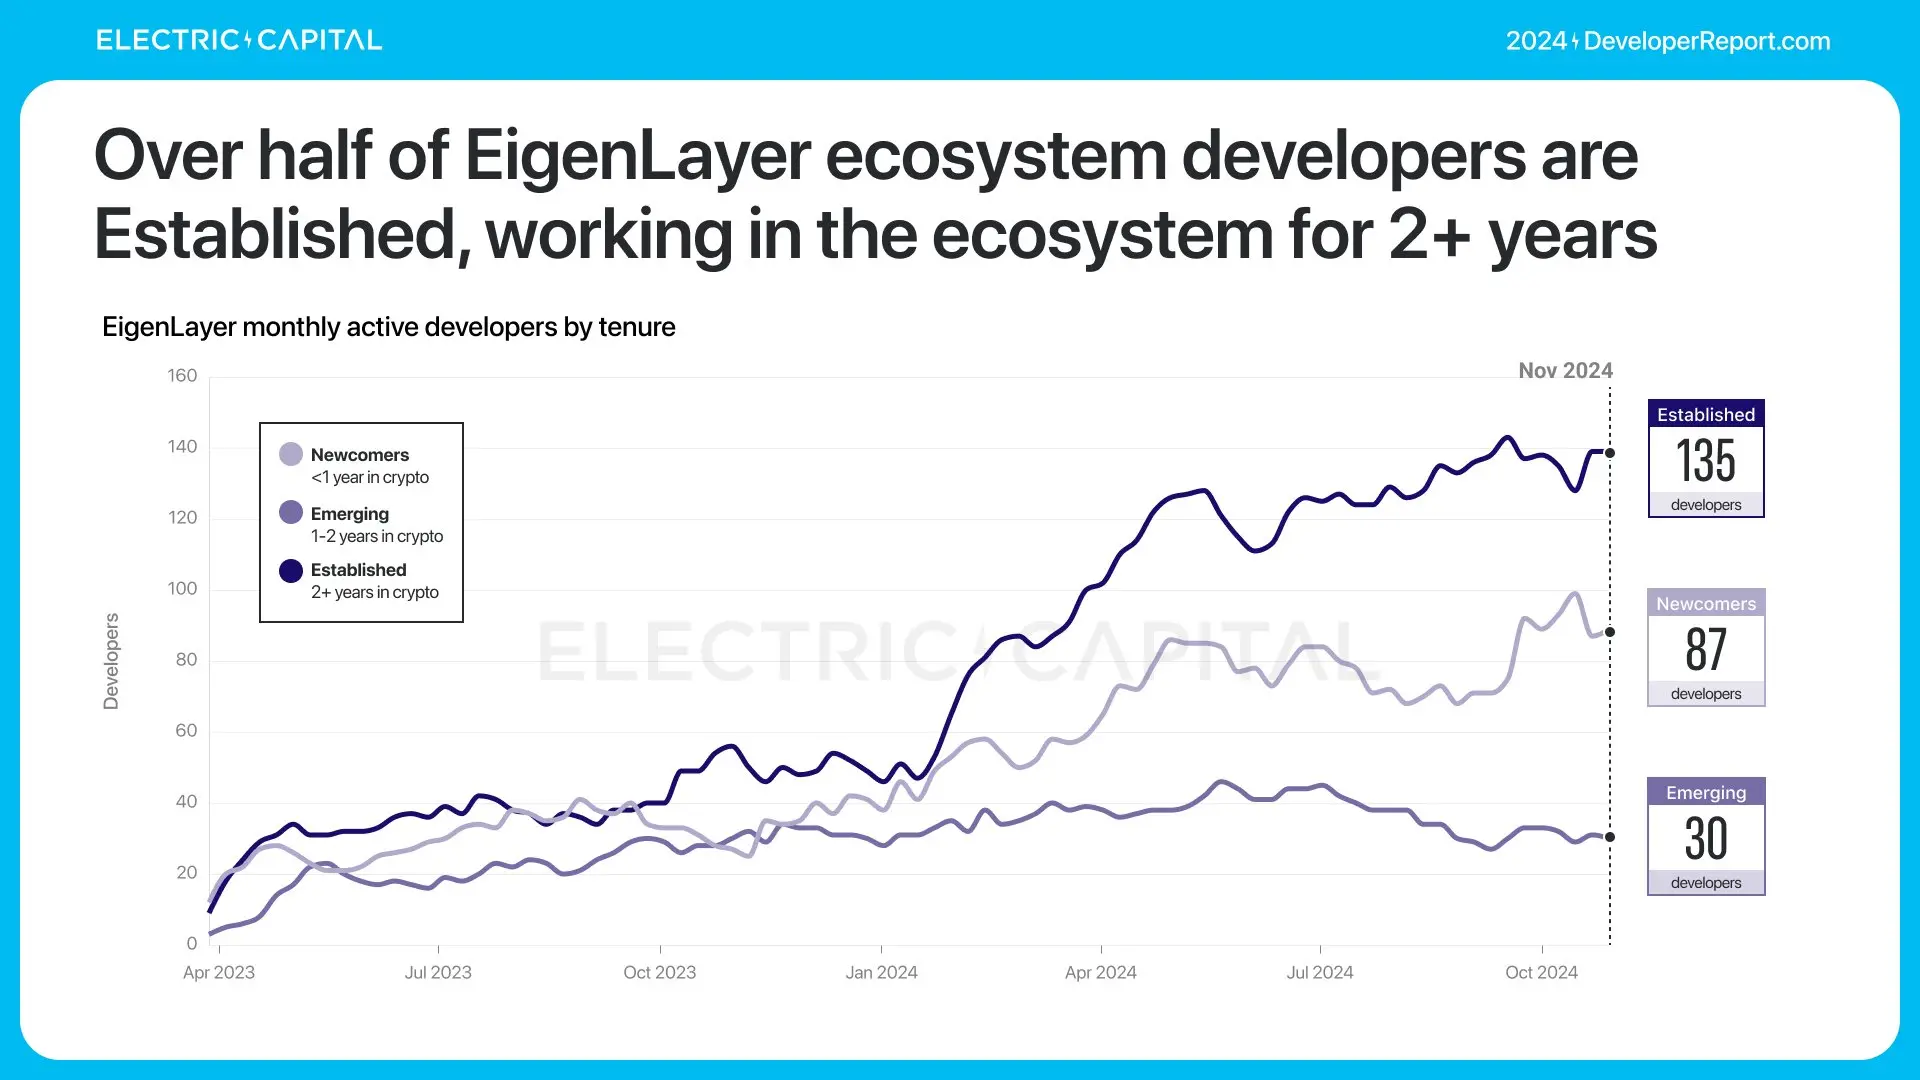
Eigenlayer facilitated the creation of LRTs as a domain. So, how is the developer ecosystem of Eigenlayer developing?
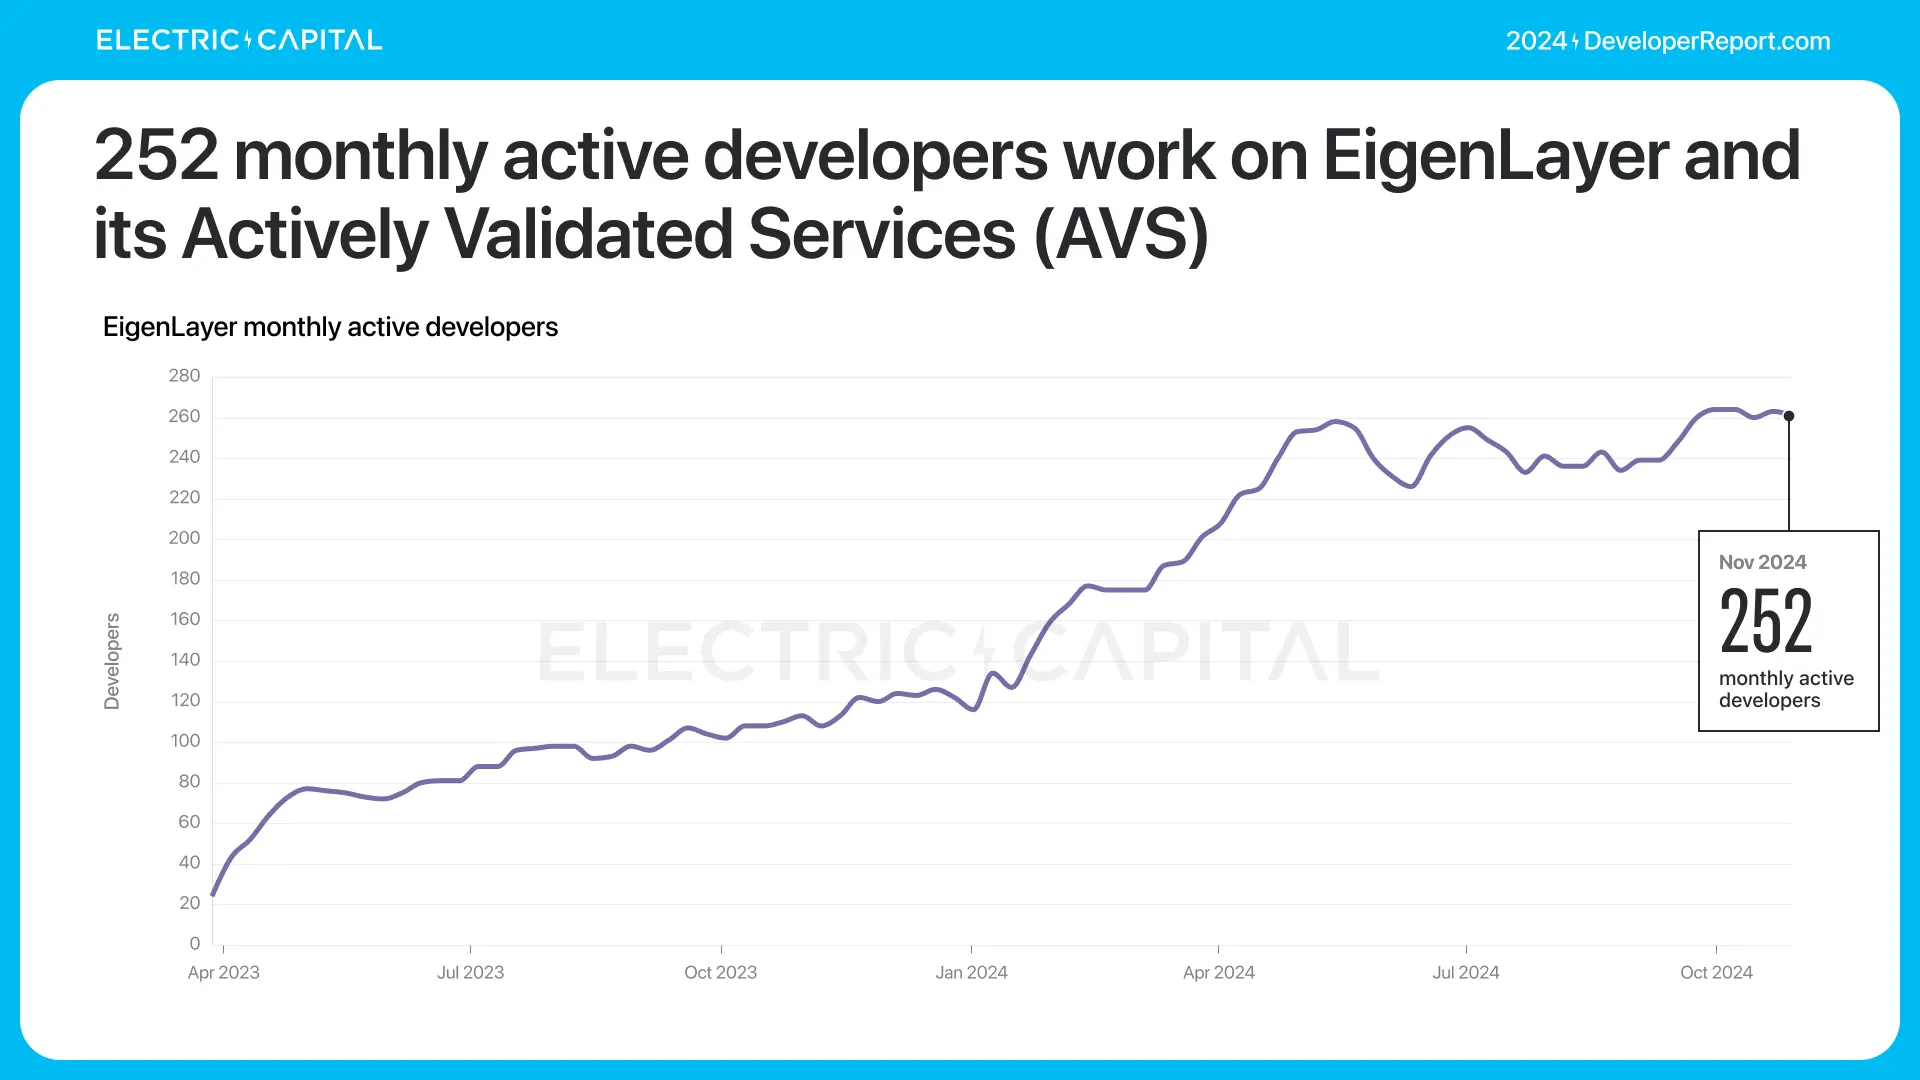
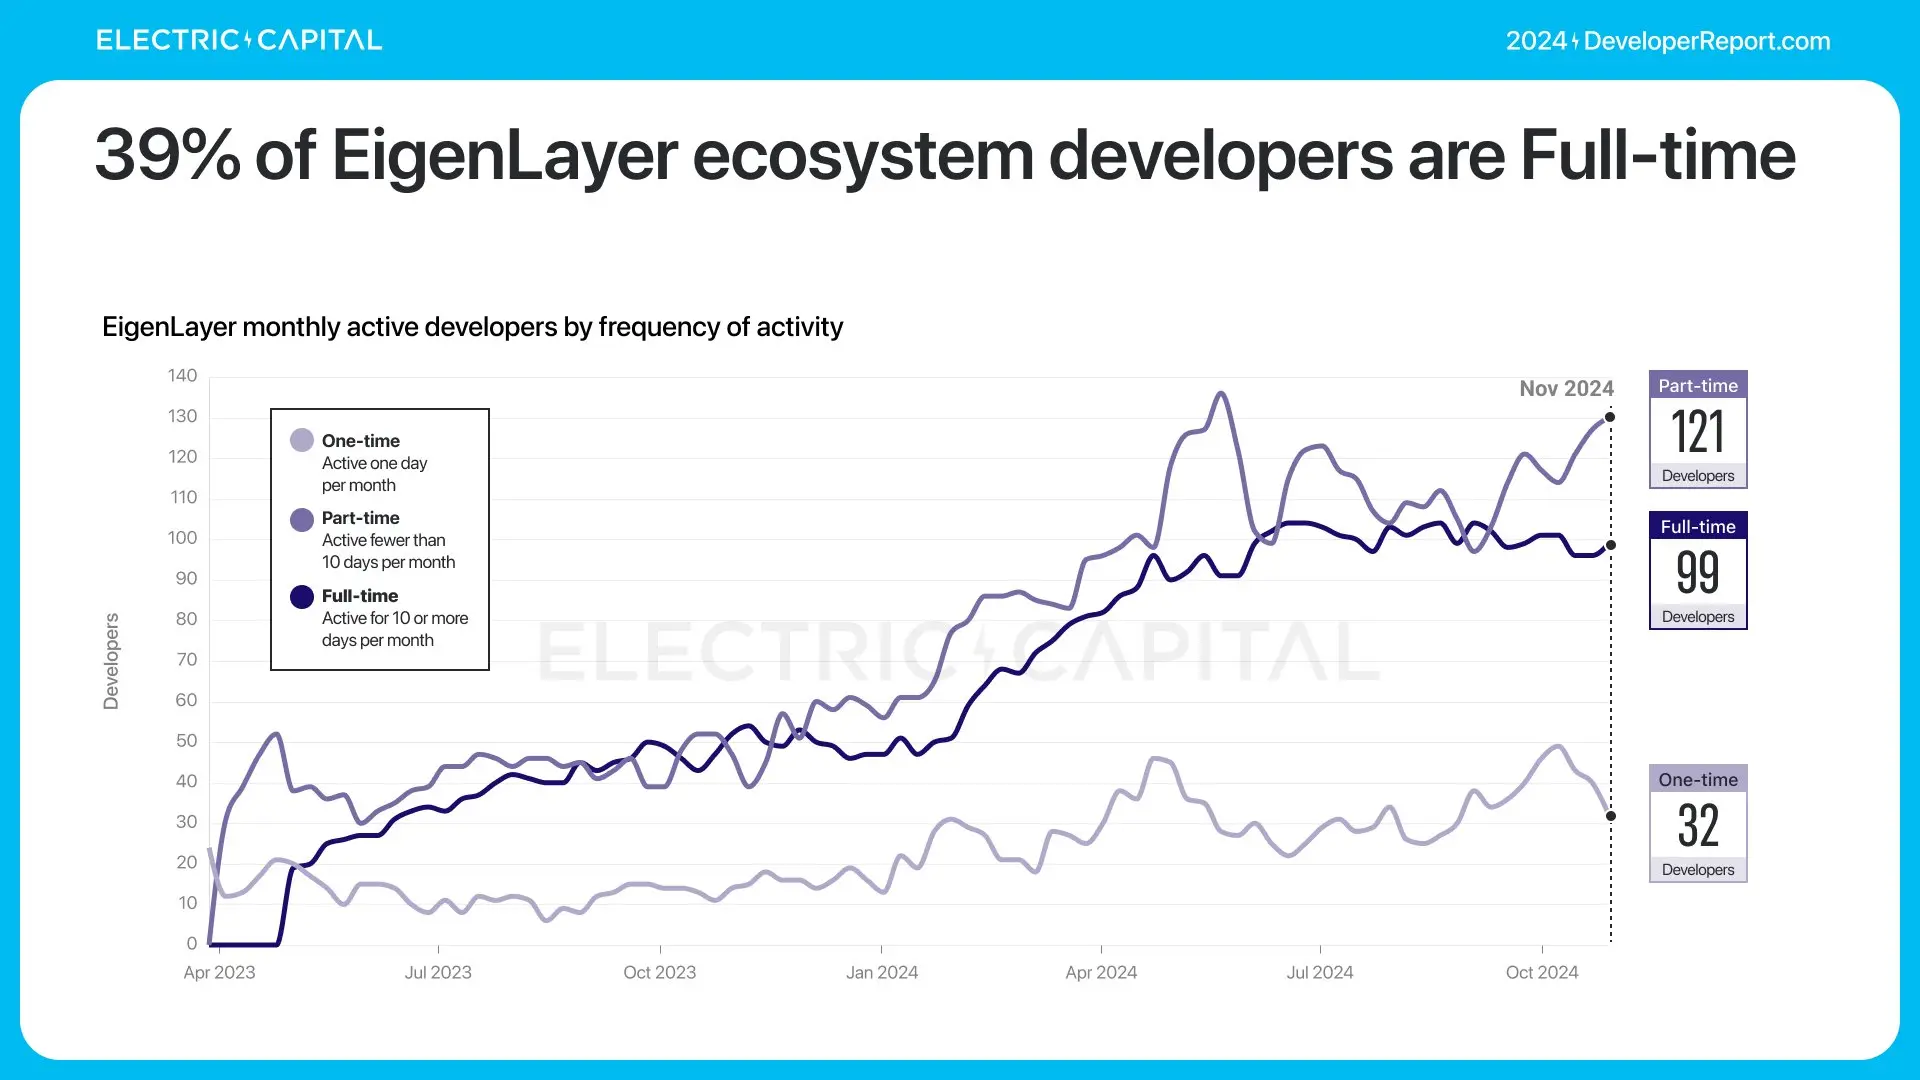
There are 252 monthly active developers working in the Eigenlayer ecosystem. Eigenlayer developers are highly engaged: 39% are full-time developers, and over half of the developers have been working in this ecosystem for more than 2 years.
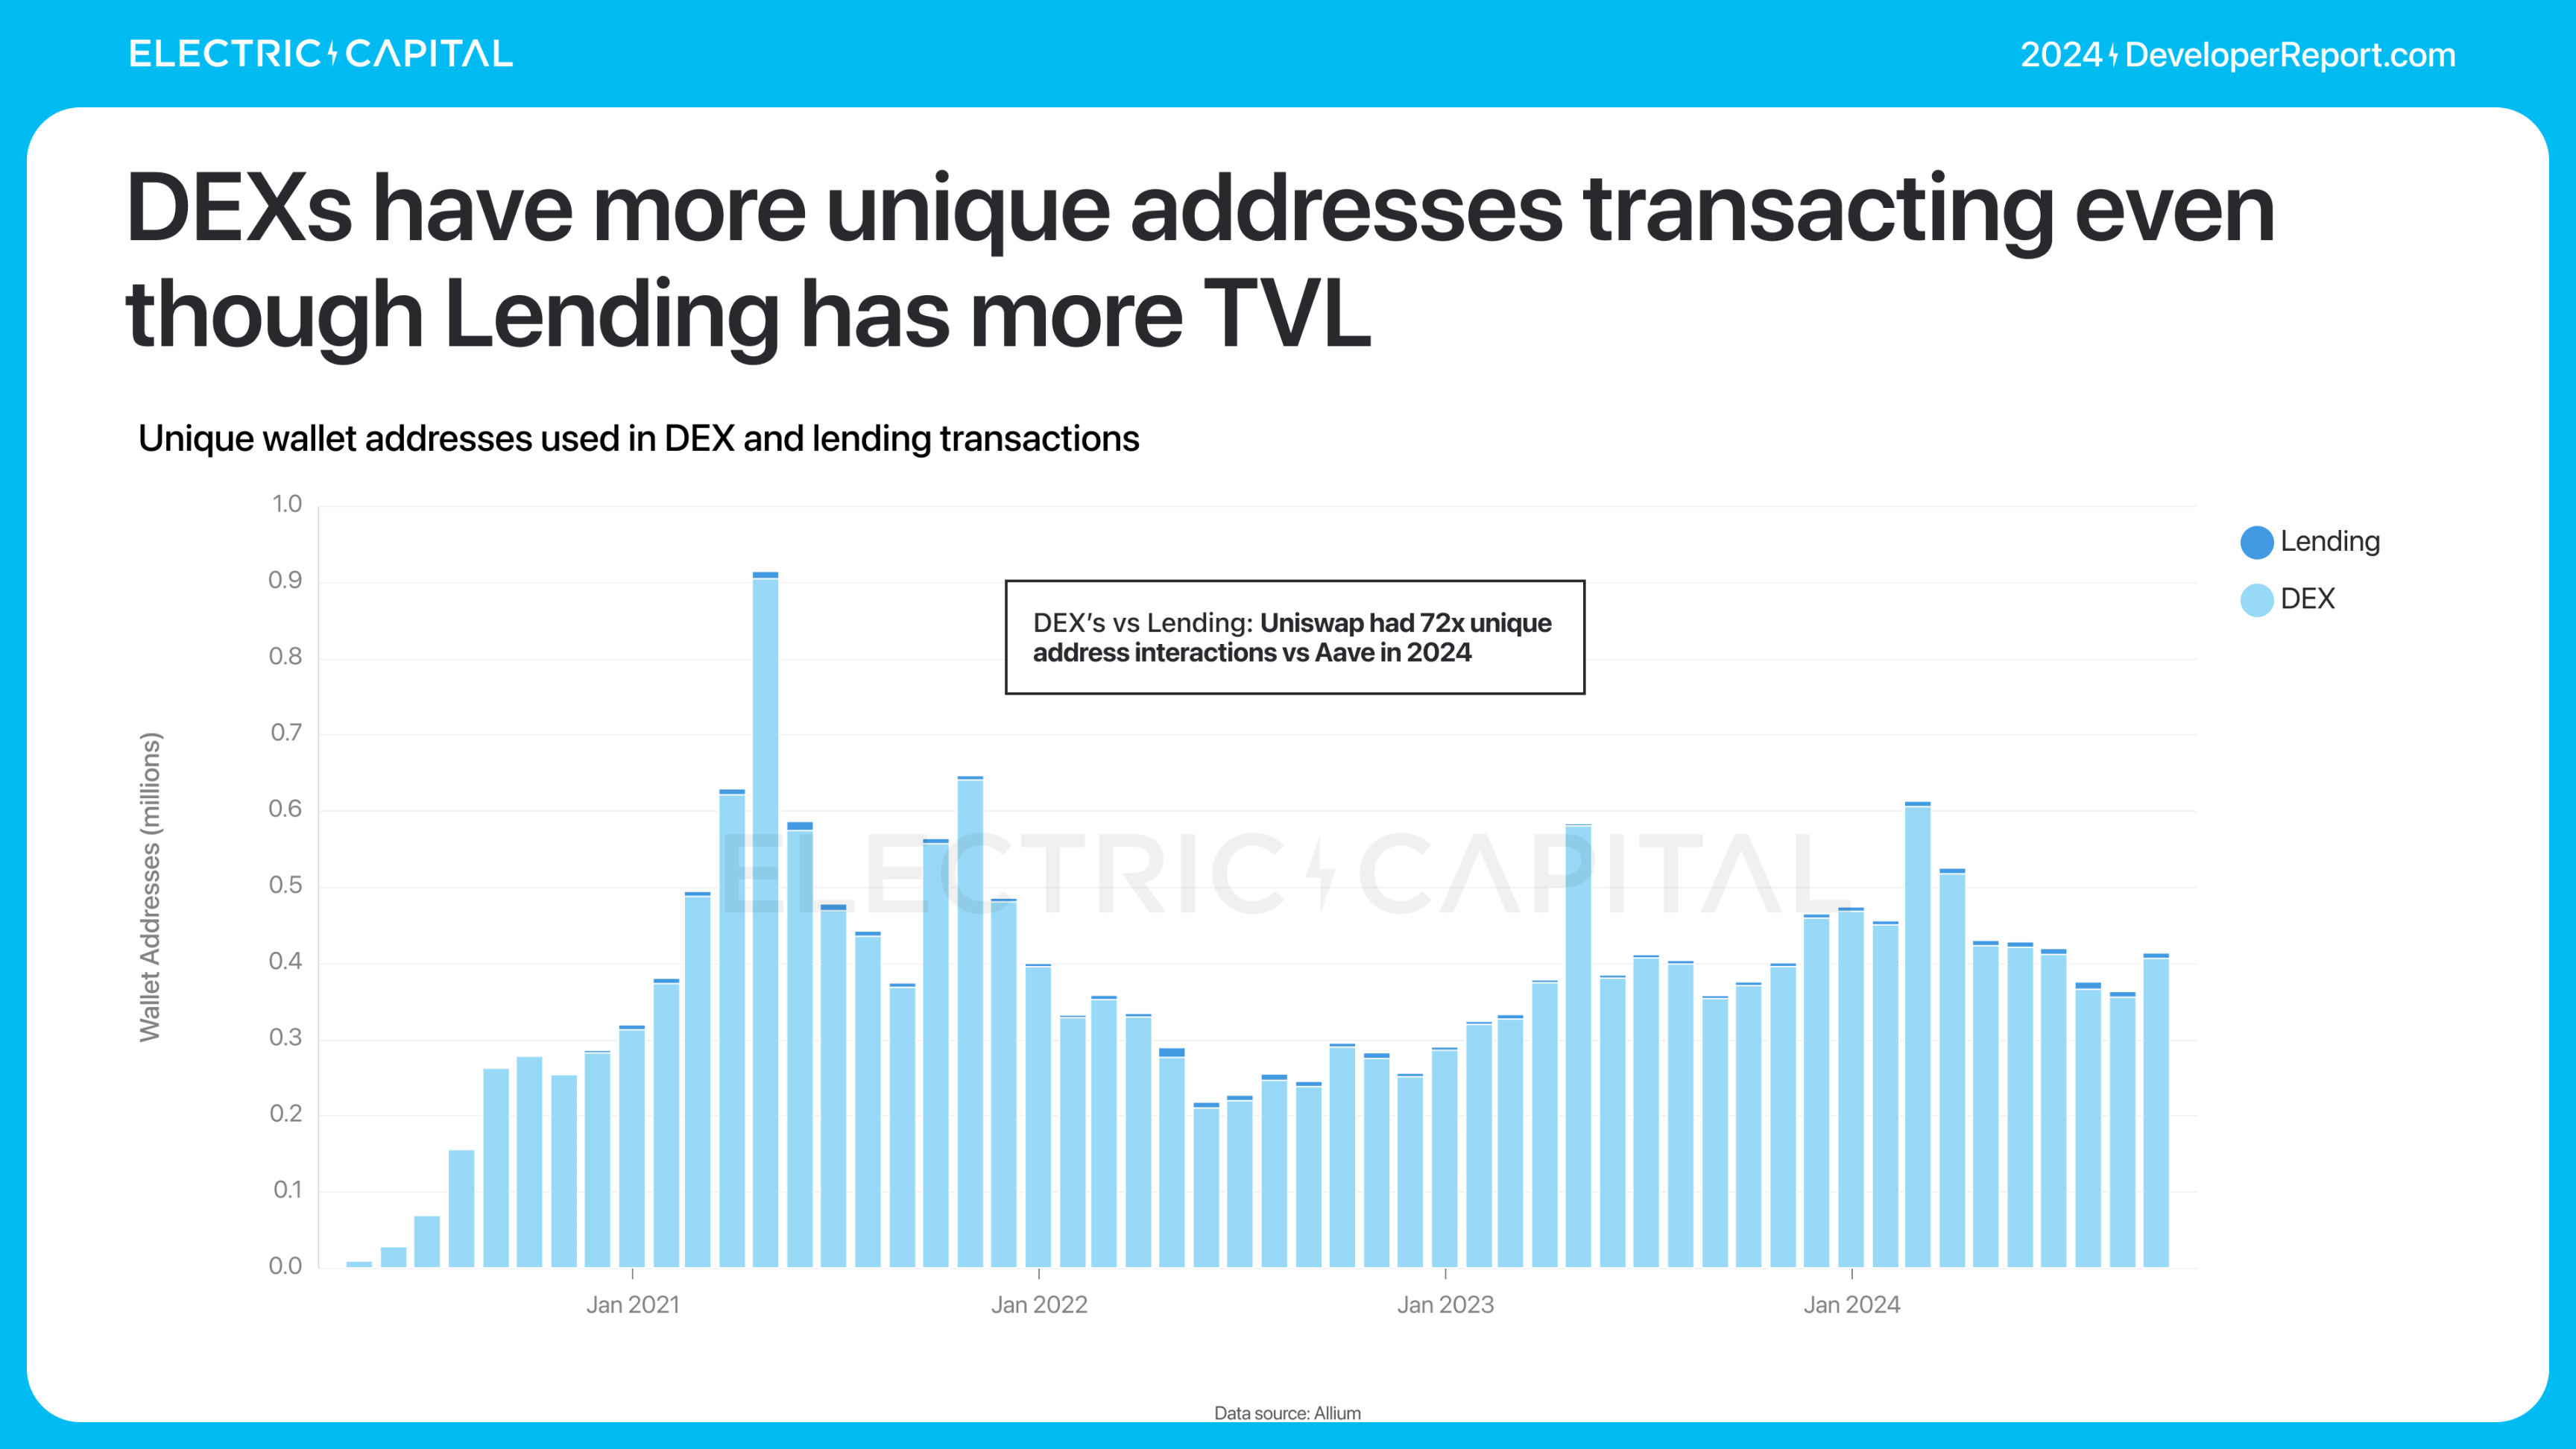
TVL is not the only metric we use to understand DeFi usage. Although the TVL of lending platforms is 3 times that of DEXs, DEXs have a higher unique address trading volume. For example—comparing DEXs with lending platforms: in 2024, Uniswap's unique address interactions were 72 times that of AAVE. 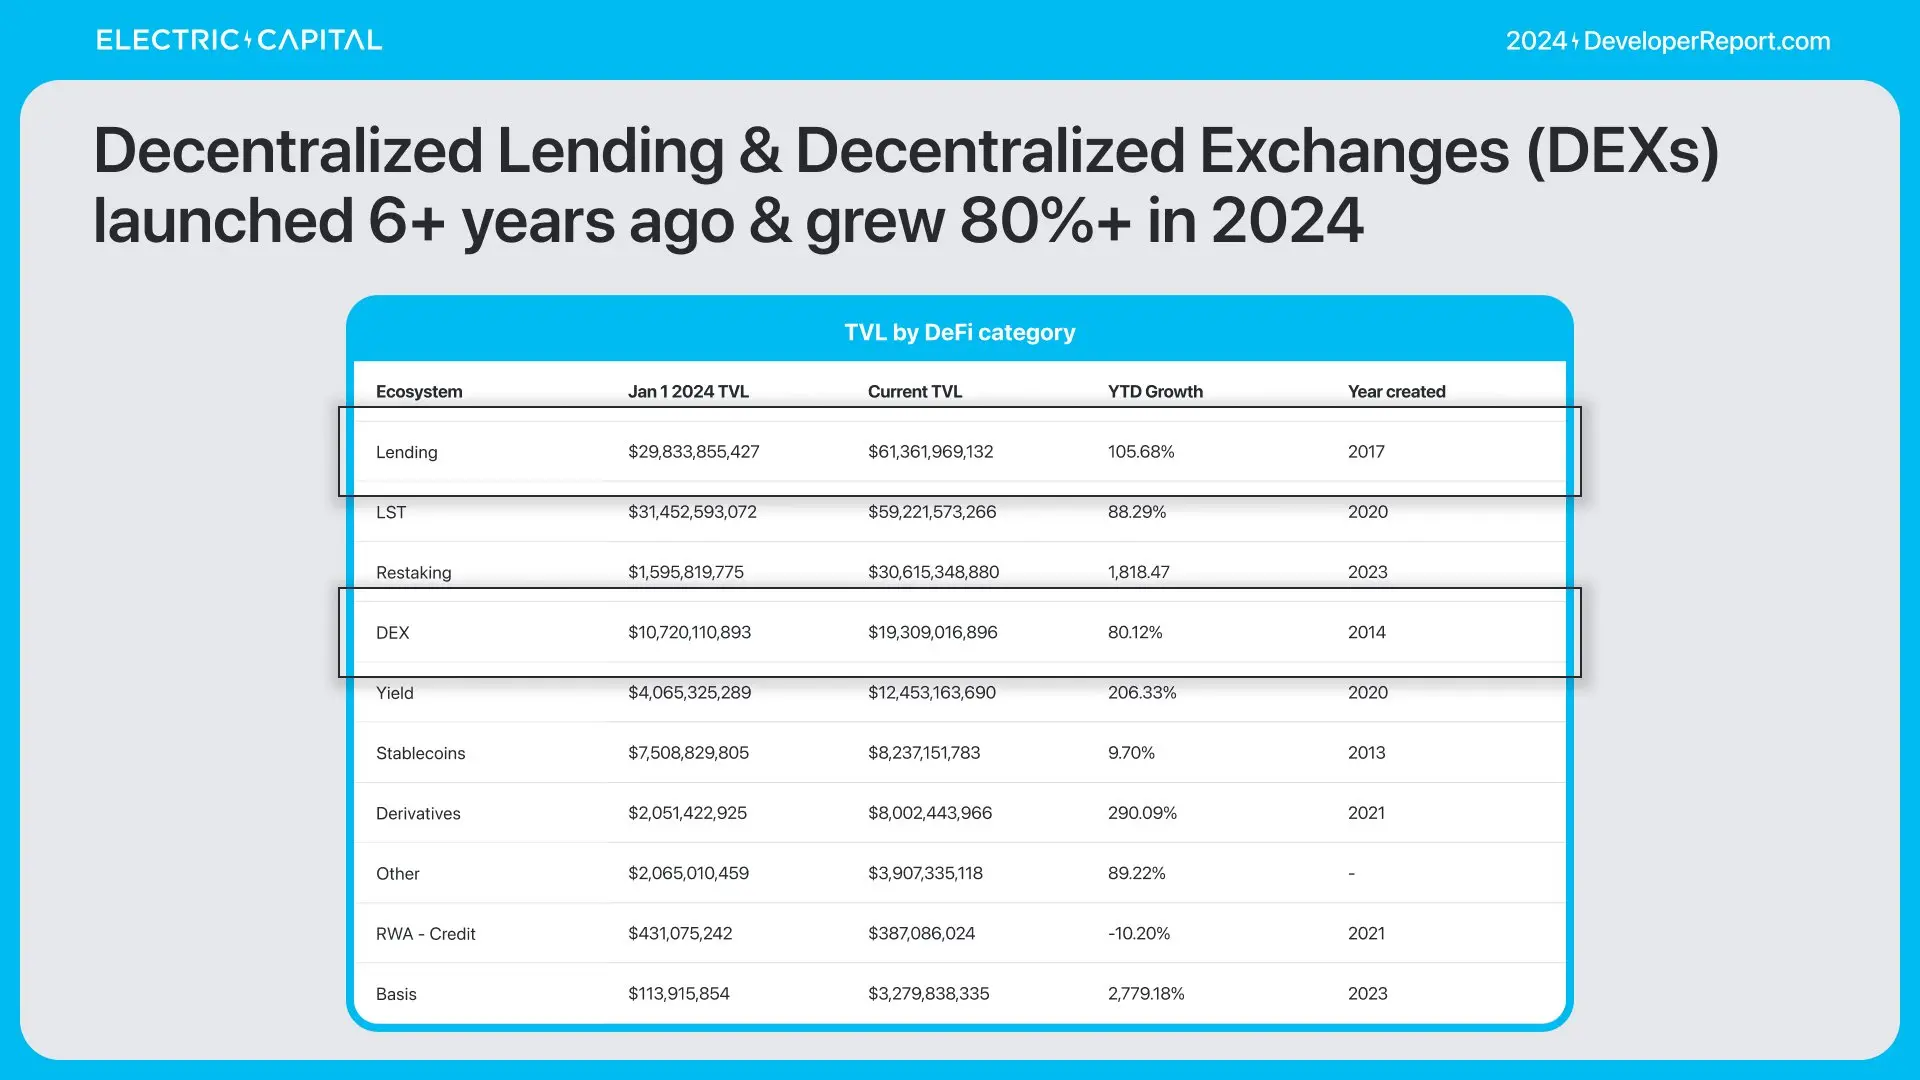
In 2024, DEX trading volume nearly doubled, reaching $209 billion per month.
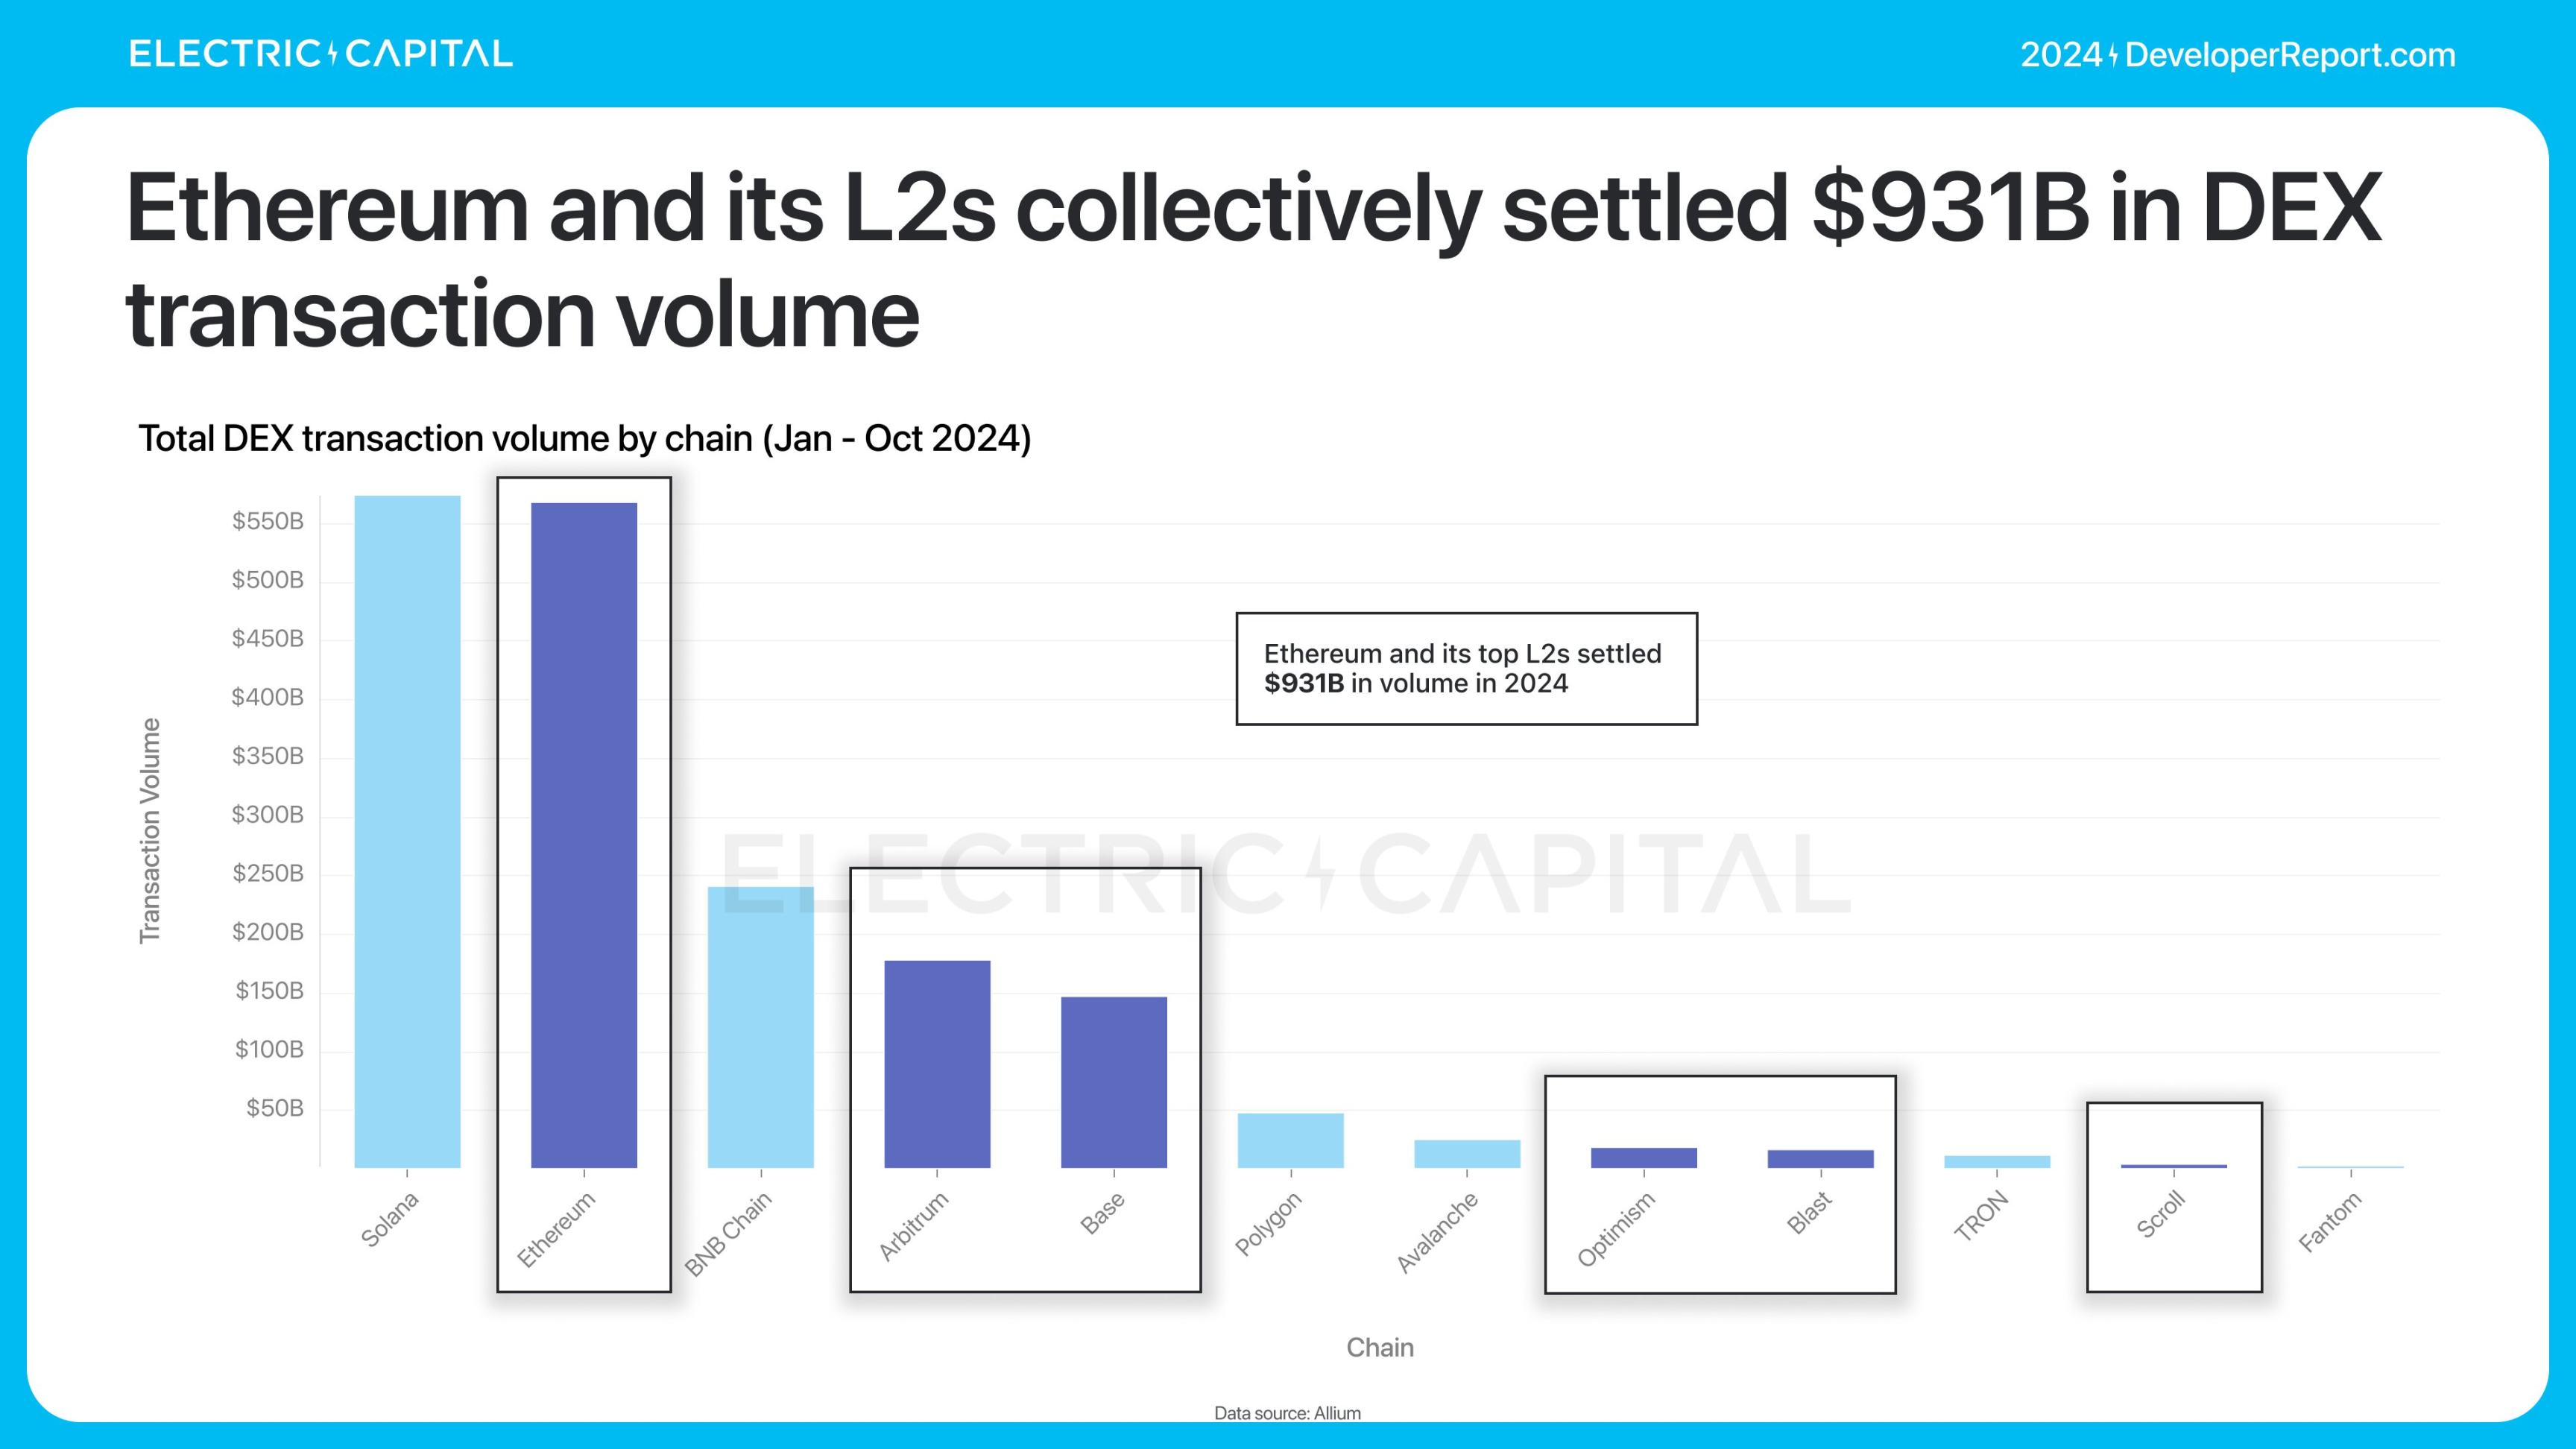
Solana and Ethereum settled the most trading volume—over 2 times that of the second-largest chain.
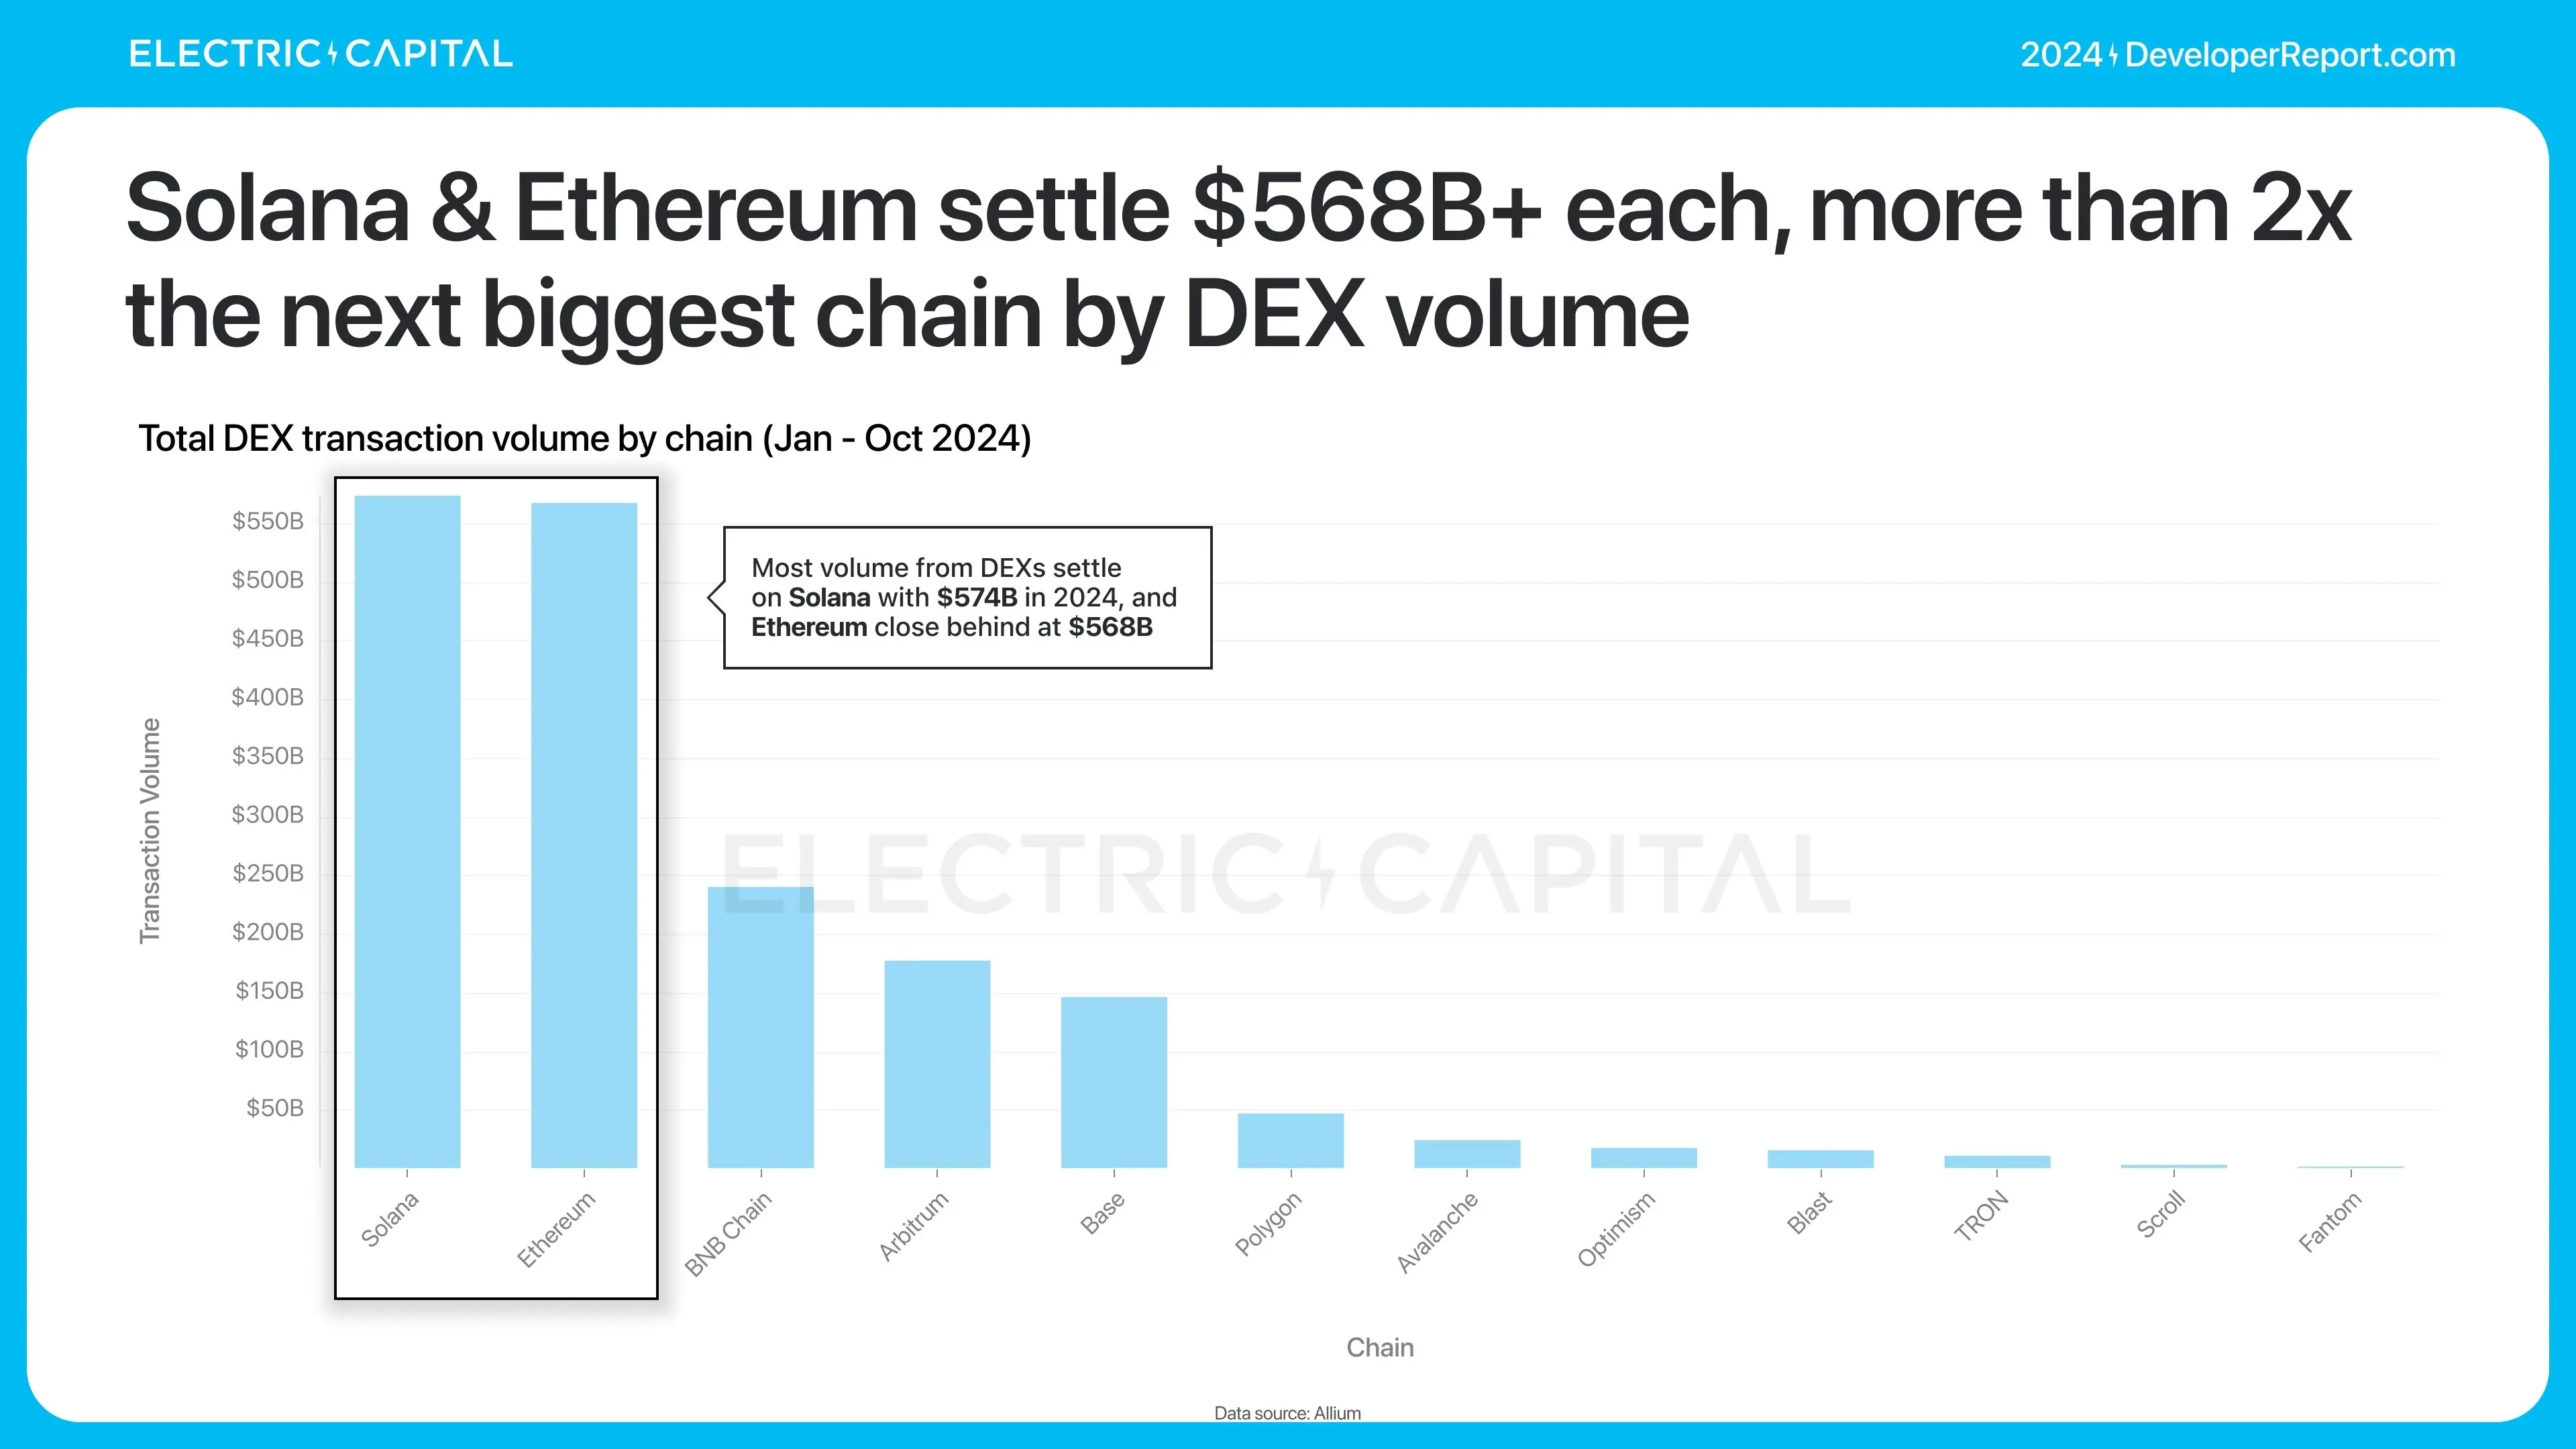
Solana settled the most trading volume in 2024, reaching $574 billion. The total DEX trading volume on Ethereum mainnet and its L2 chains was $931 billion.
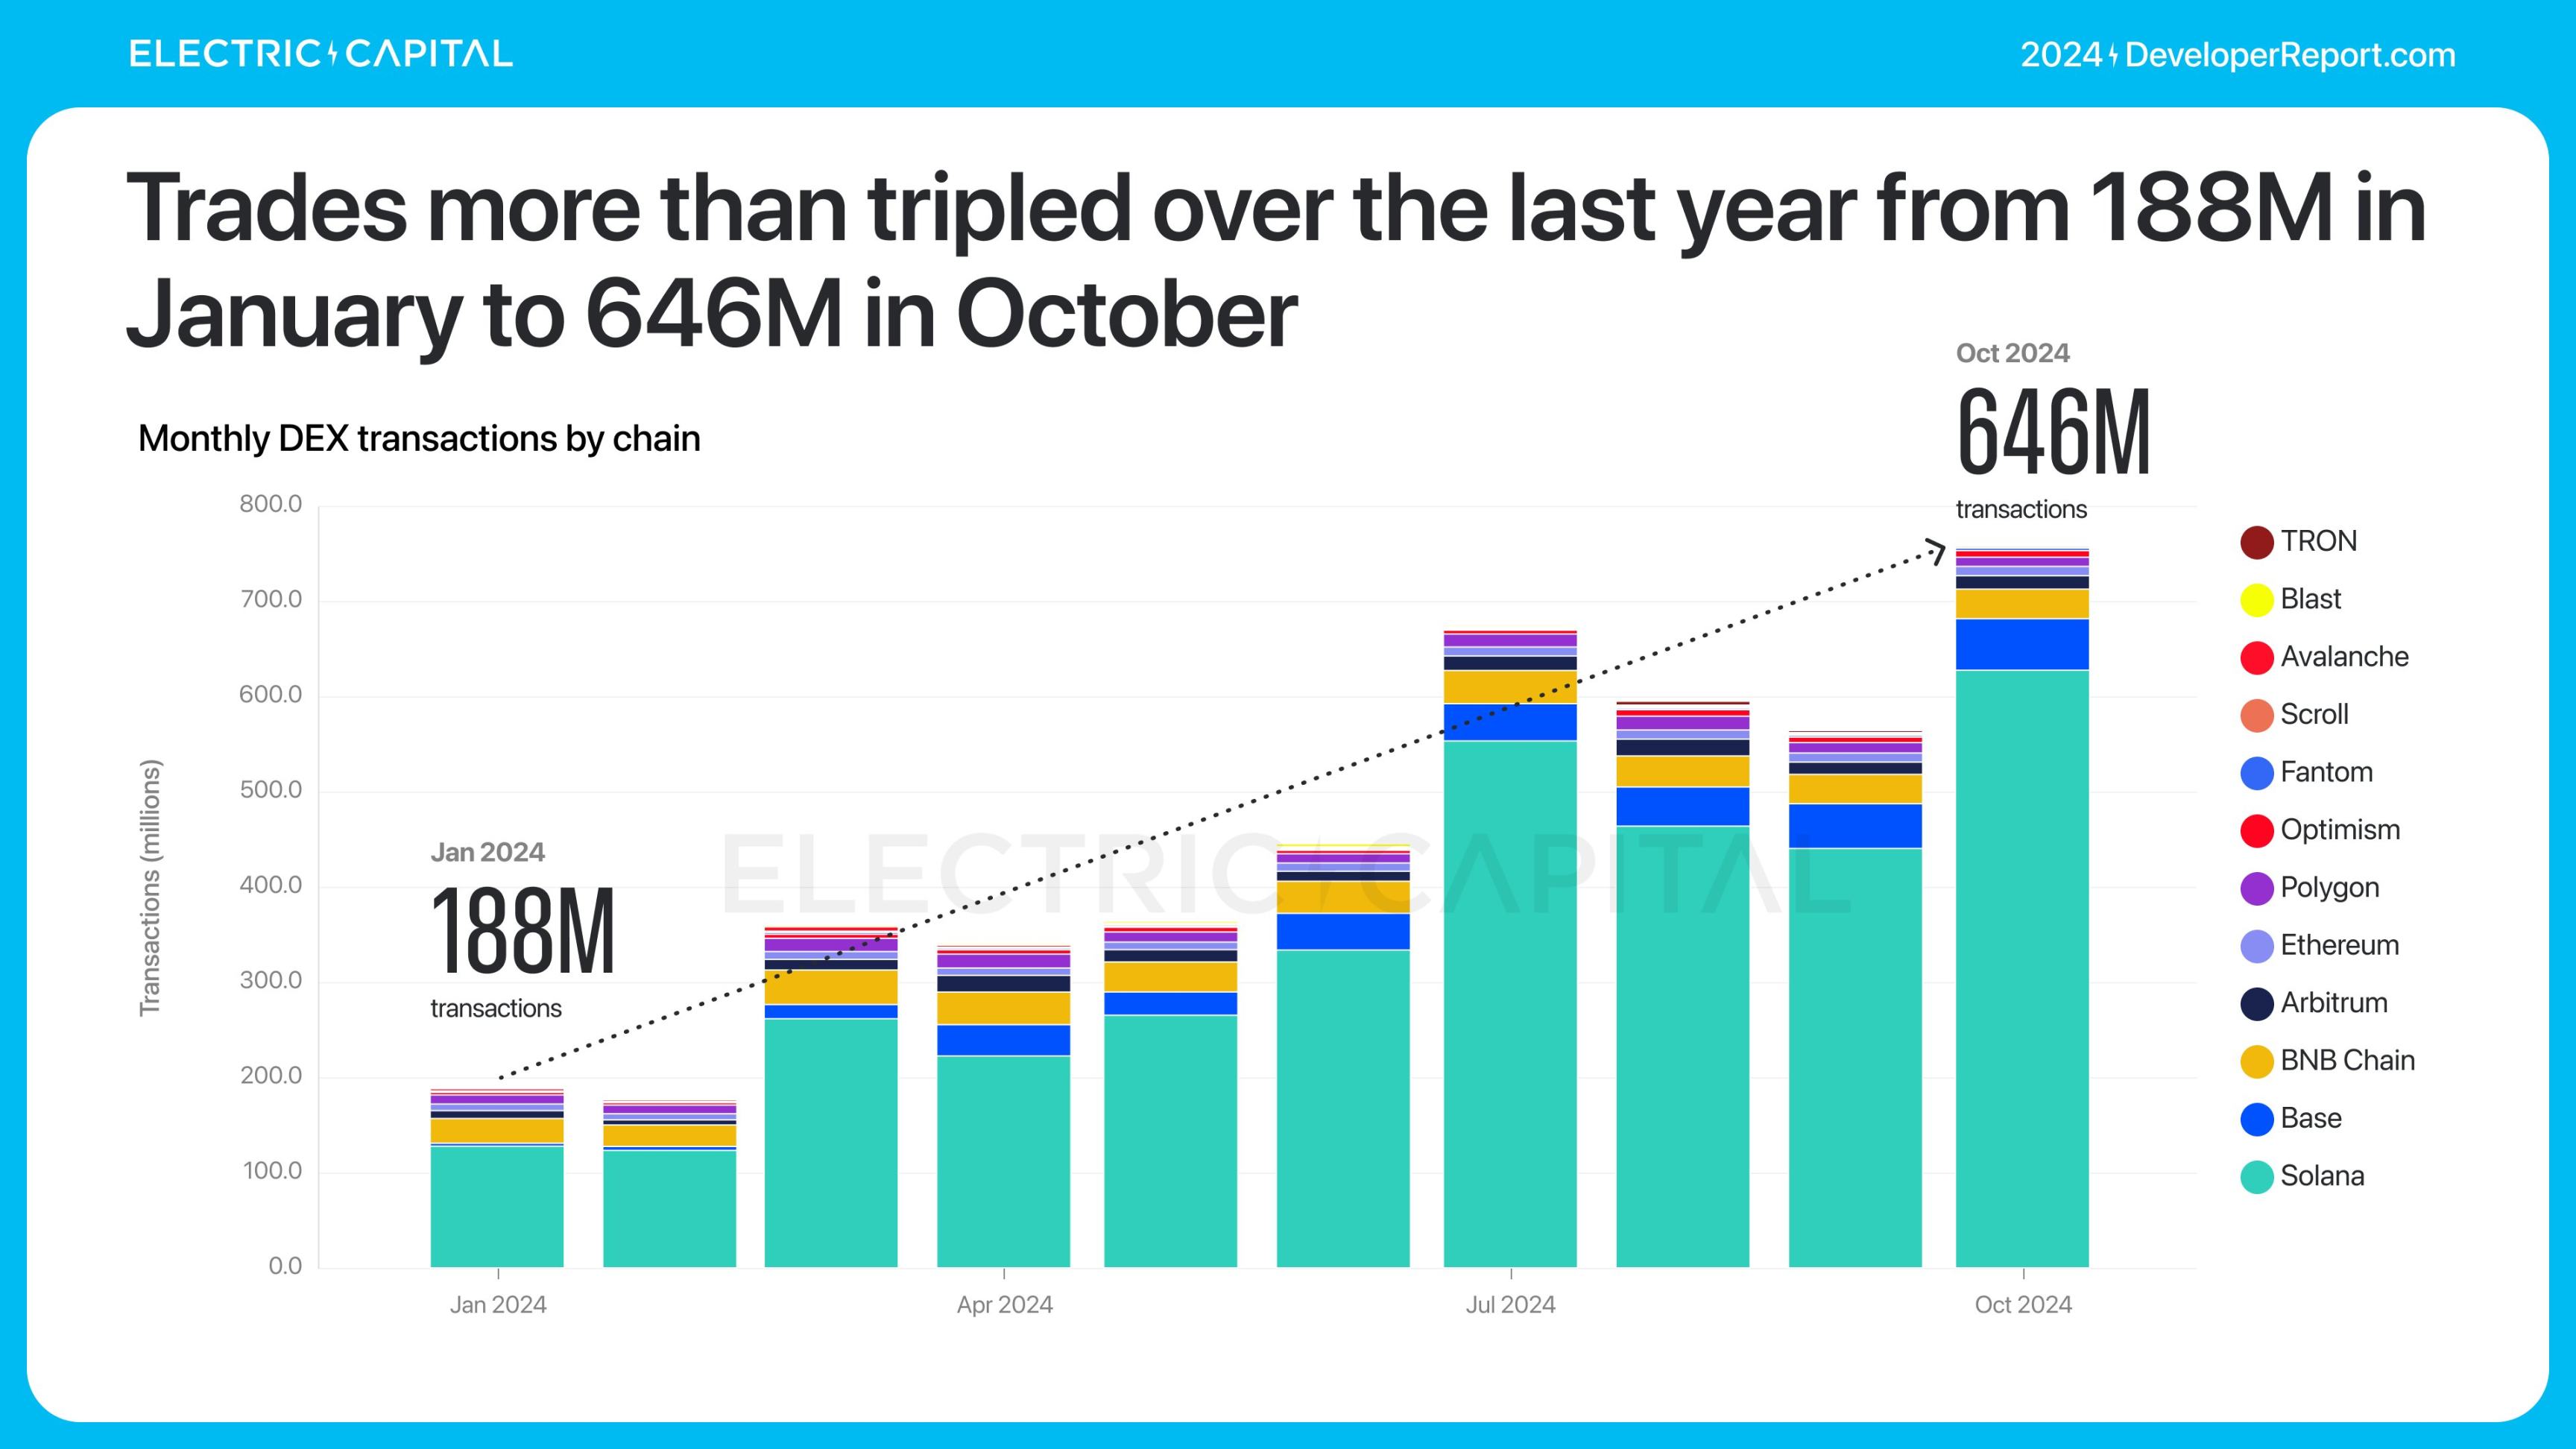
Solana dominated the low-fee DEX application scenario. In 2024, its trading volume grew more than threefold, with a monthly trading volume of 646 million transactions.
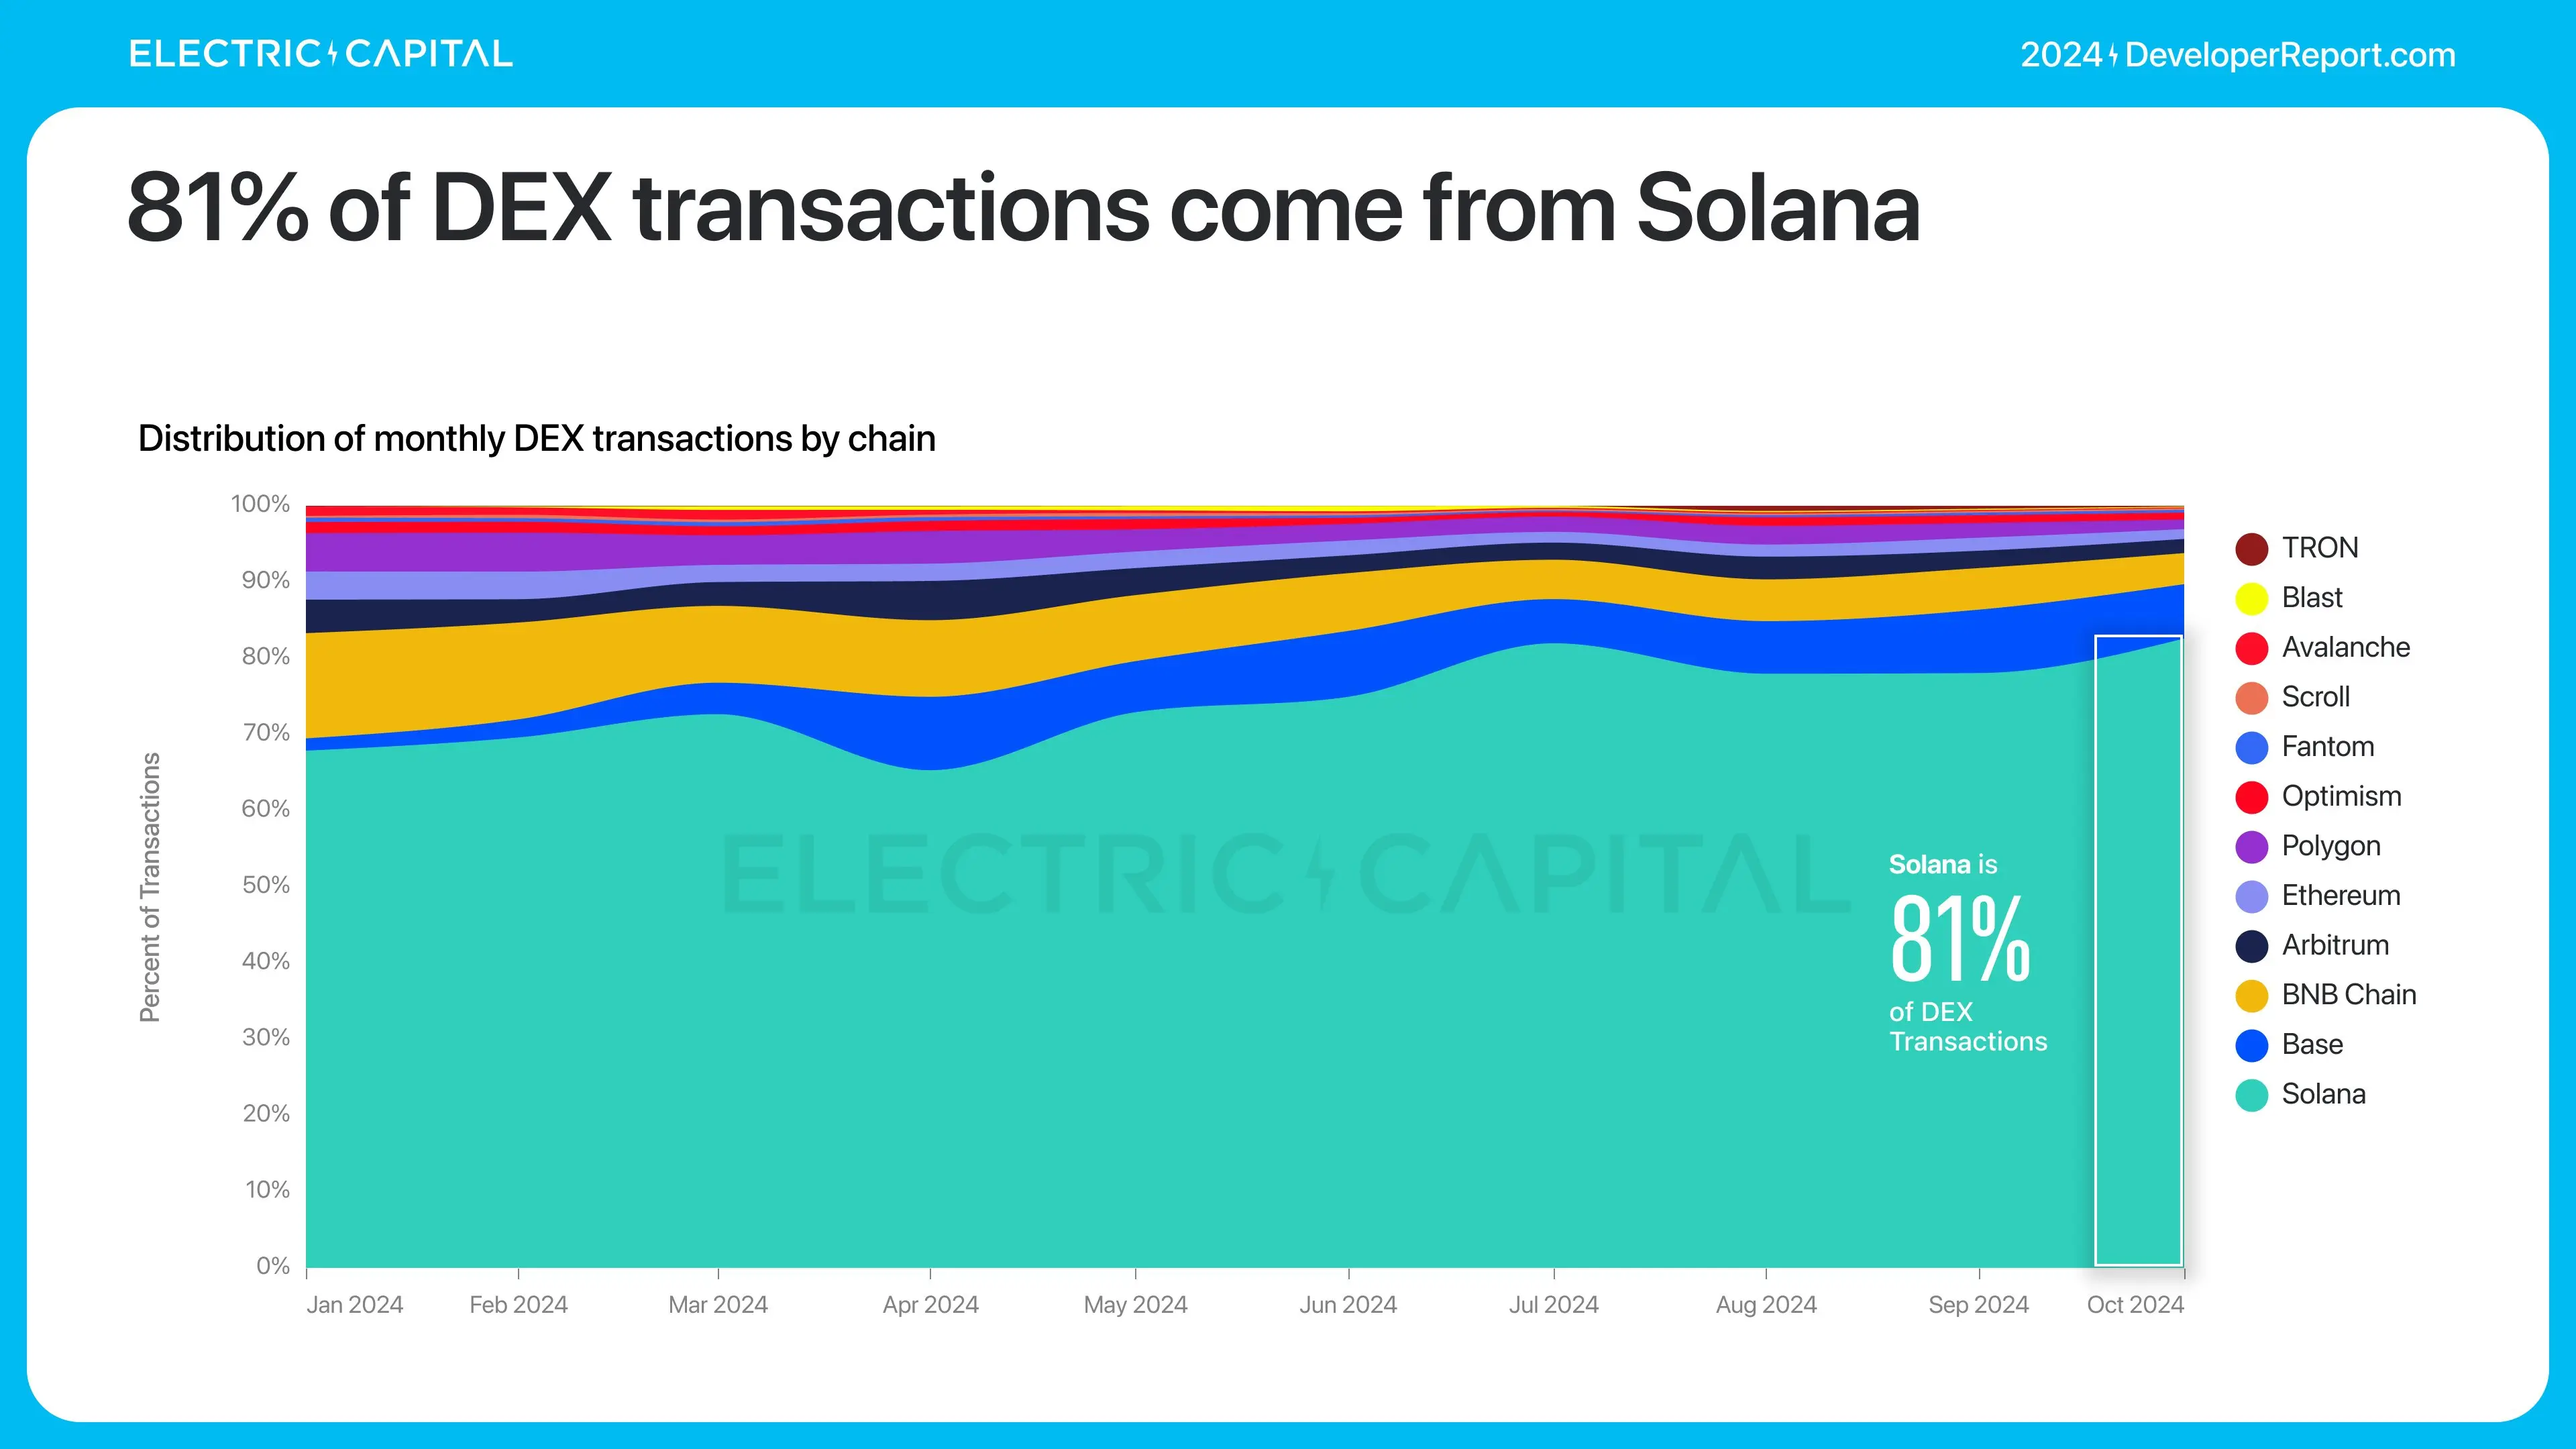
81% of DEX transactions come from Solana.
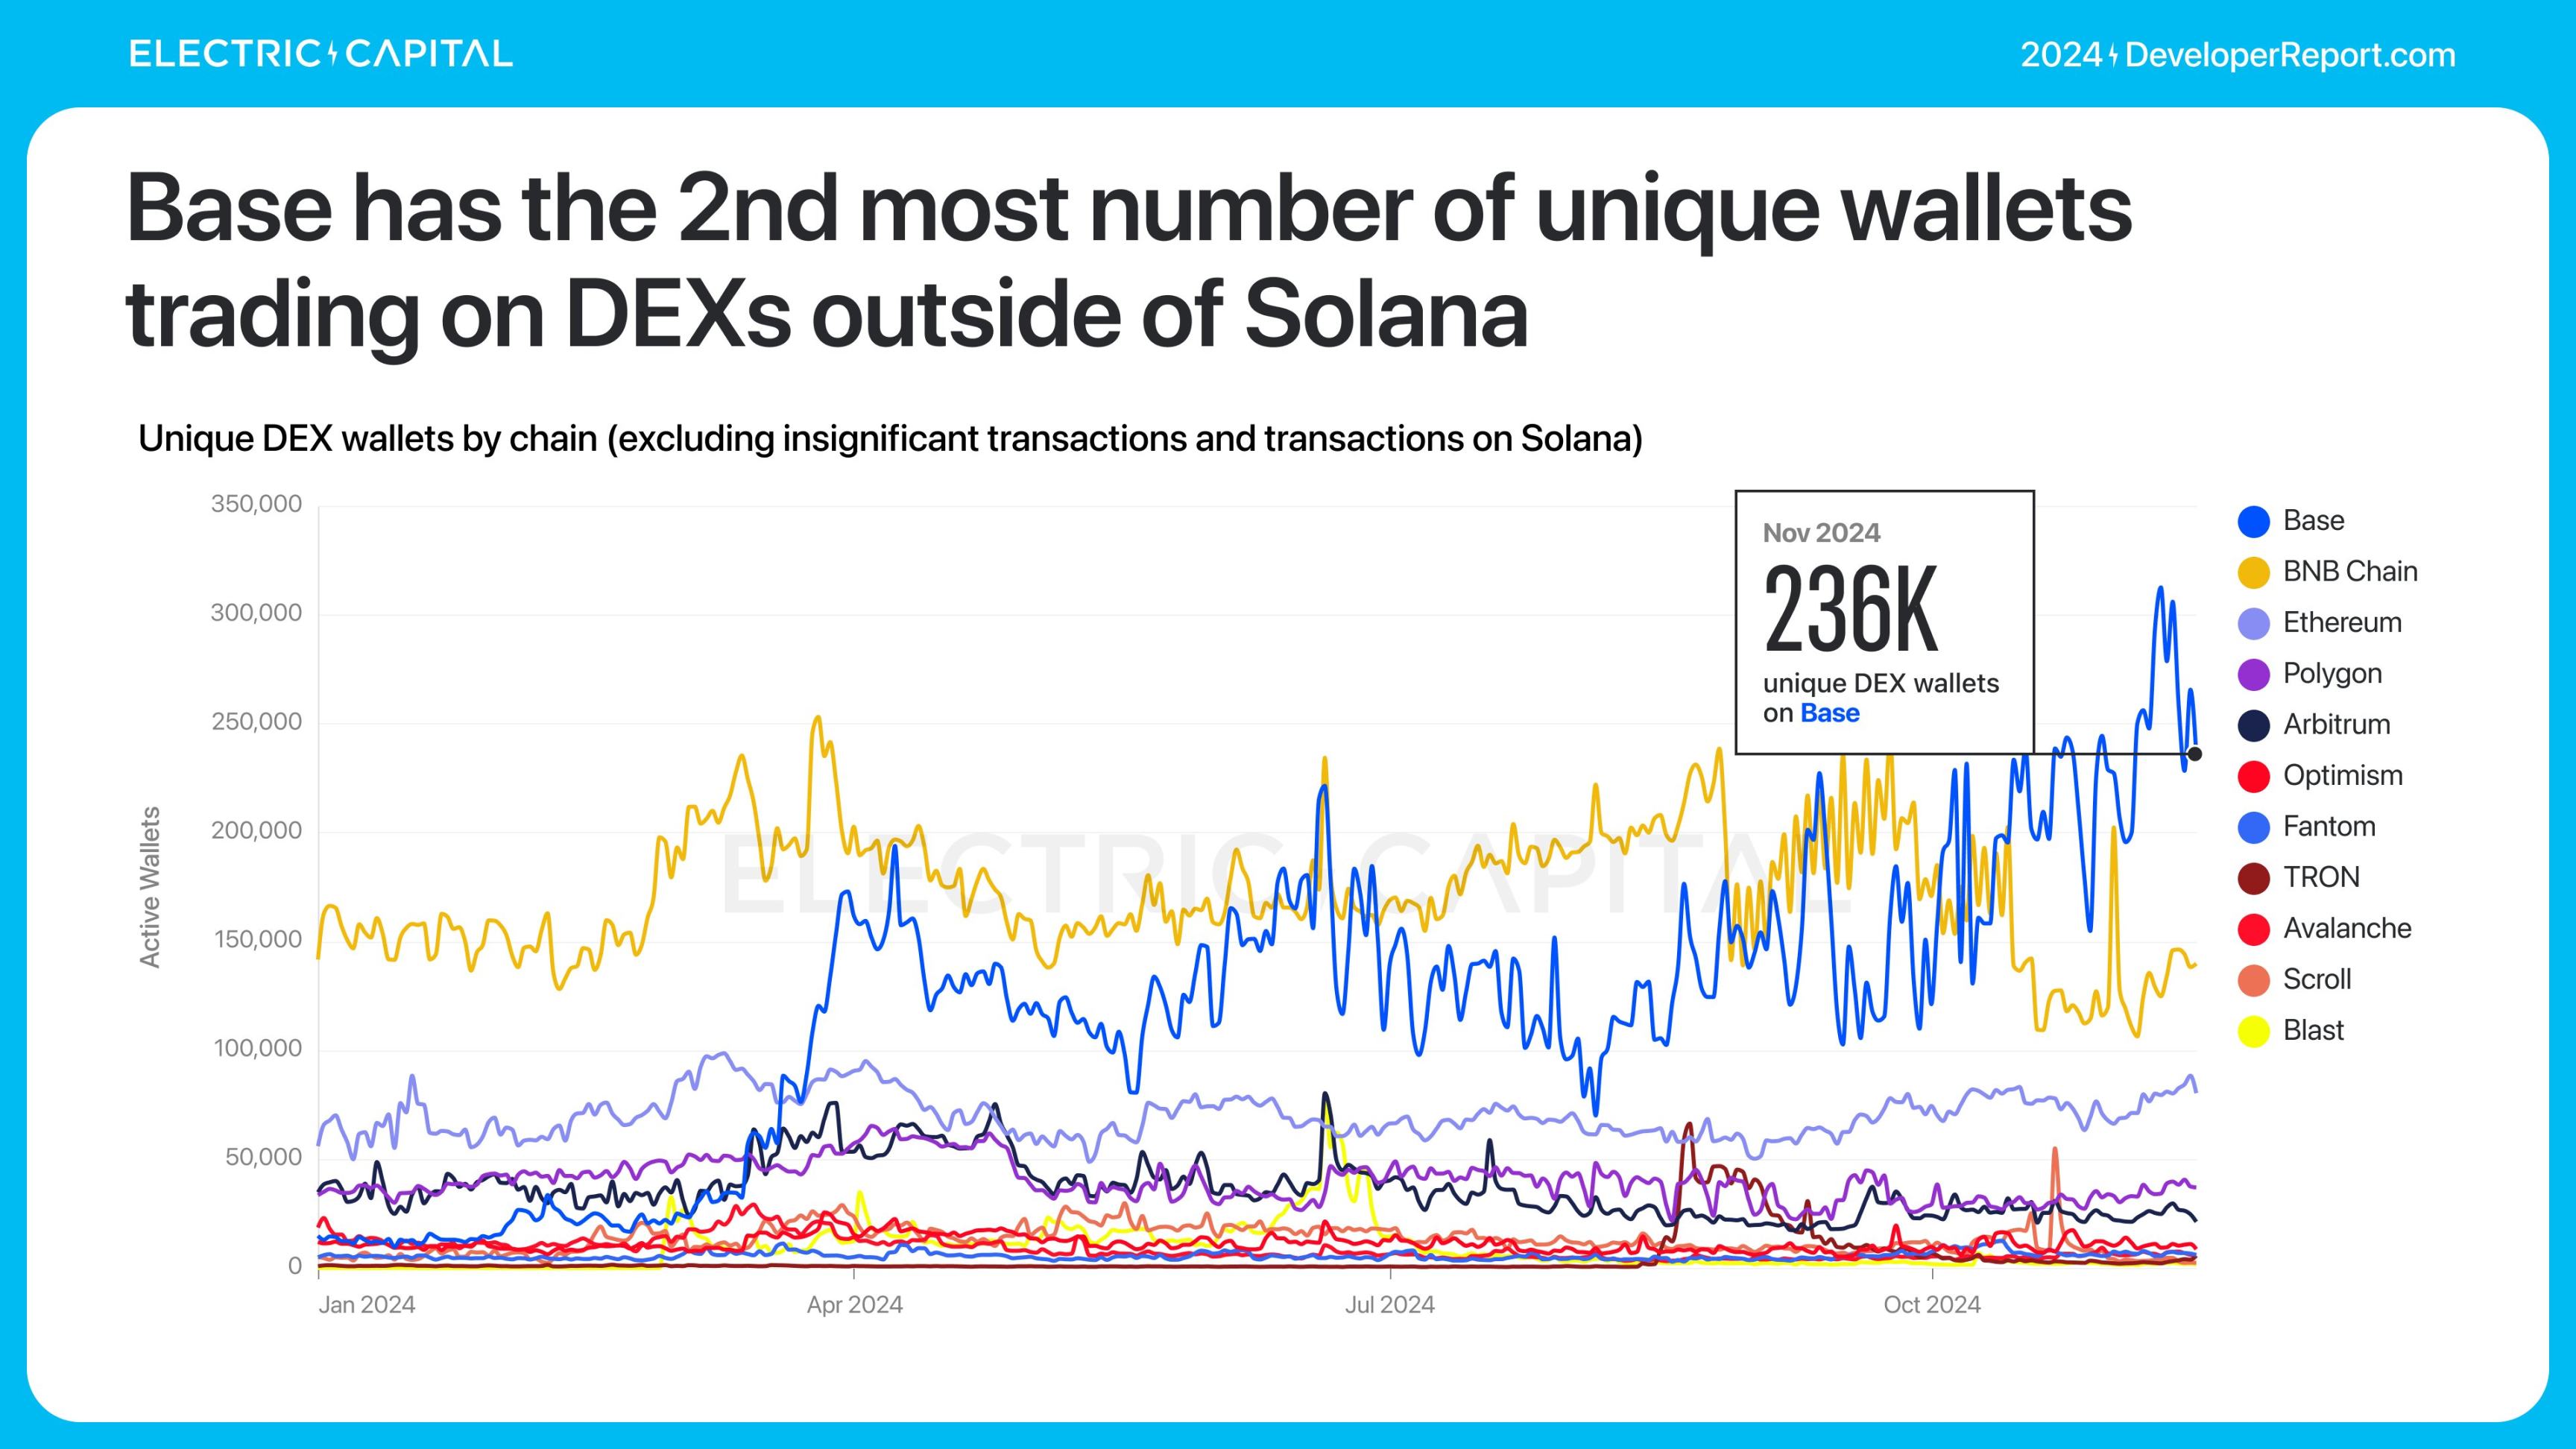
In terms of the number of trading wallets, excluding wallets with only 1 transaction and amounts less than $1, Solana has the most independent trading wallets, 7 times that of the second-largest chain.
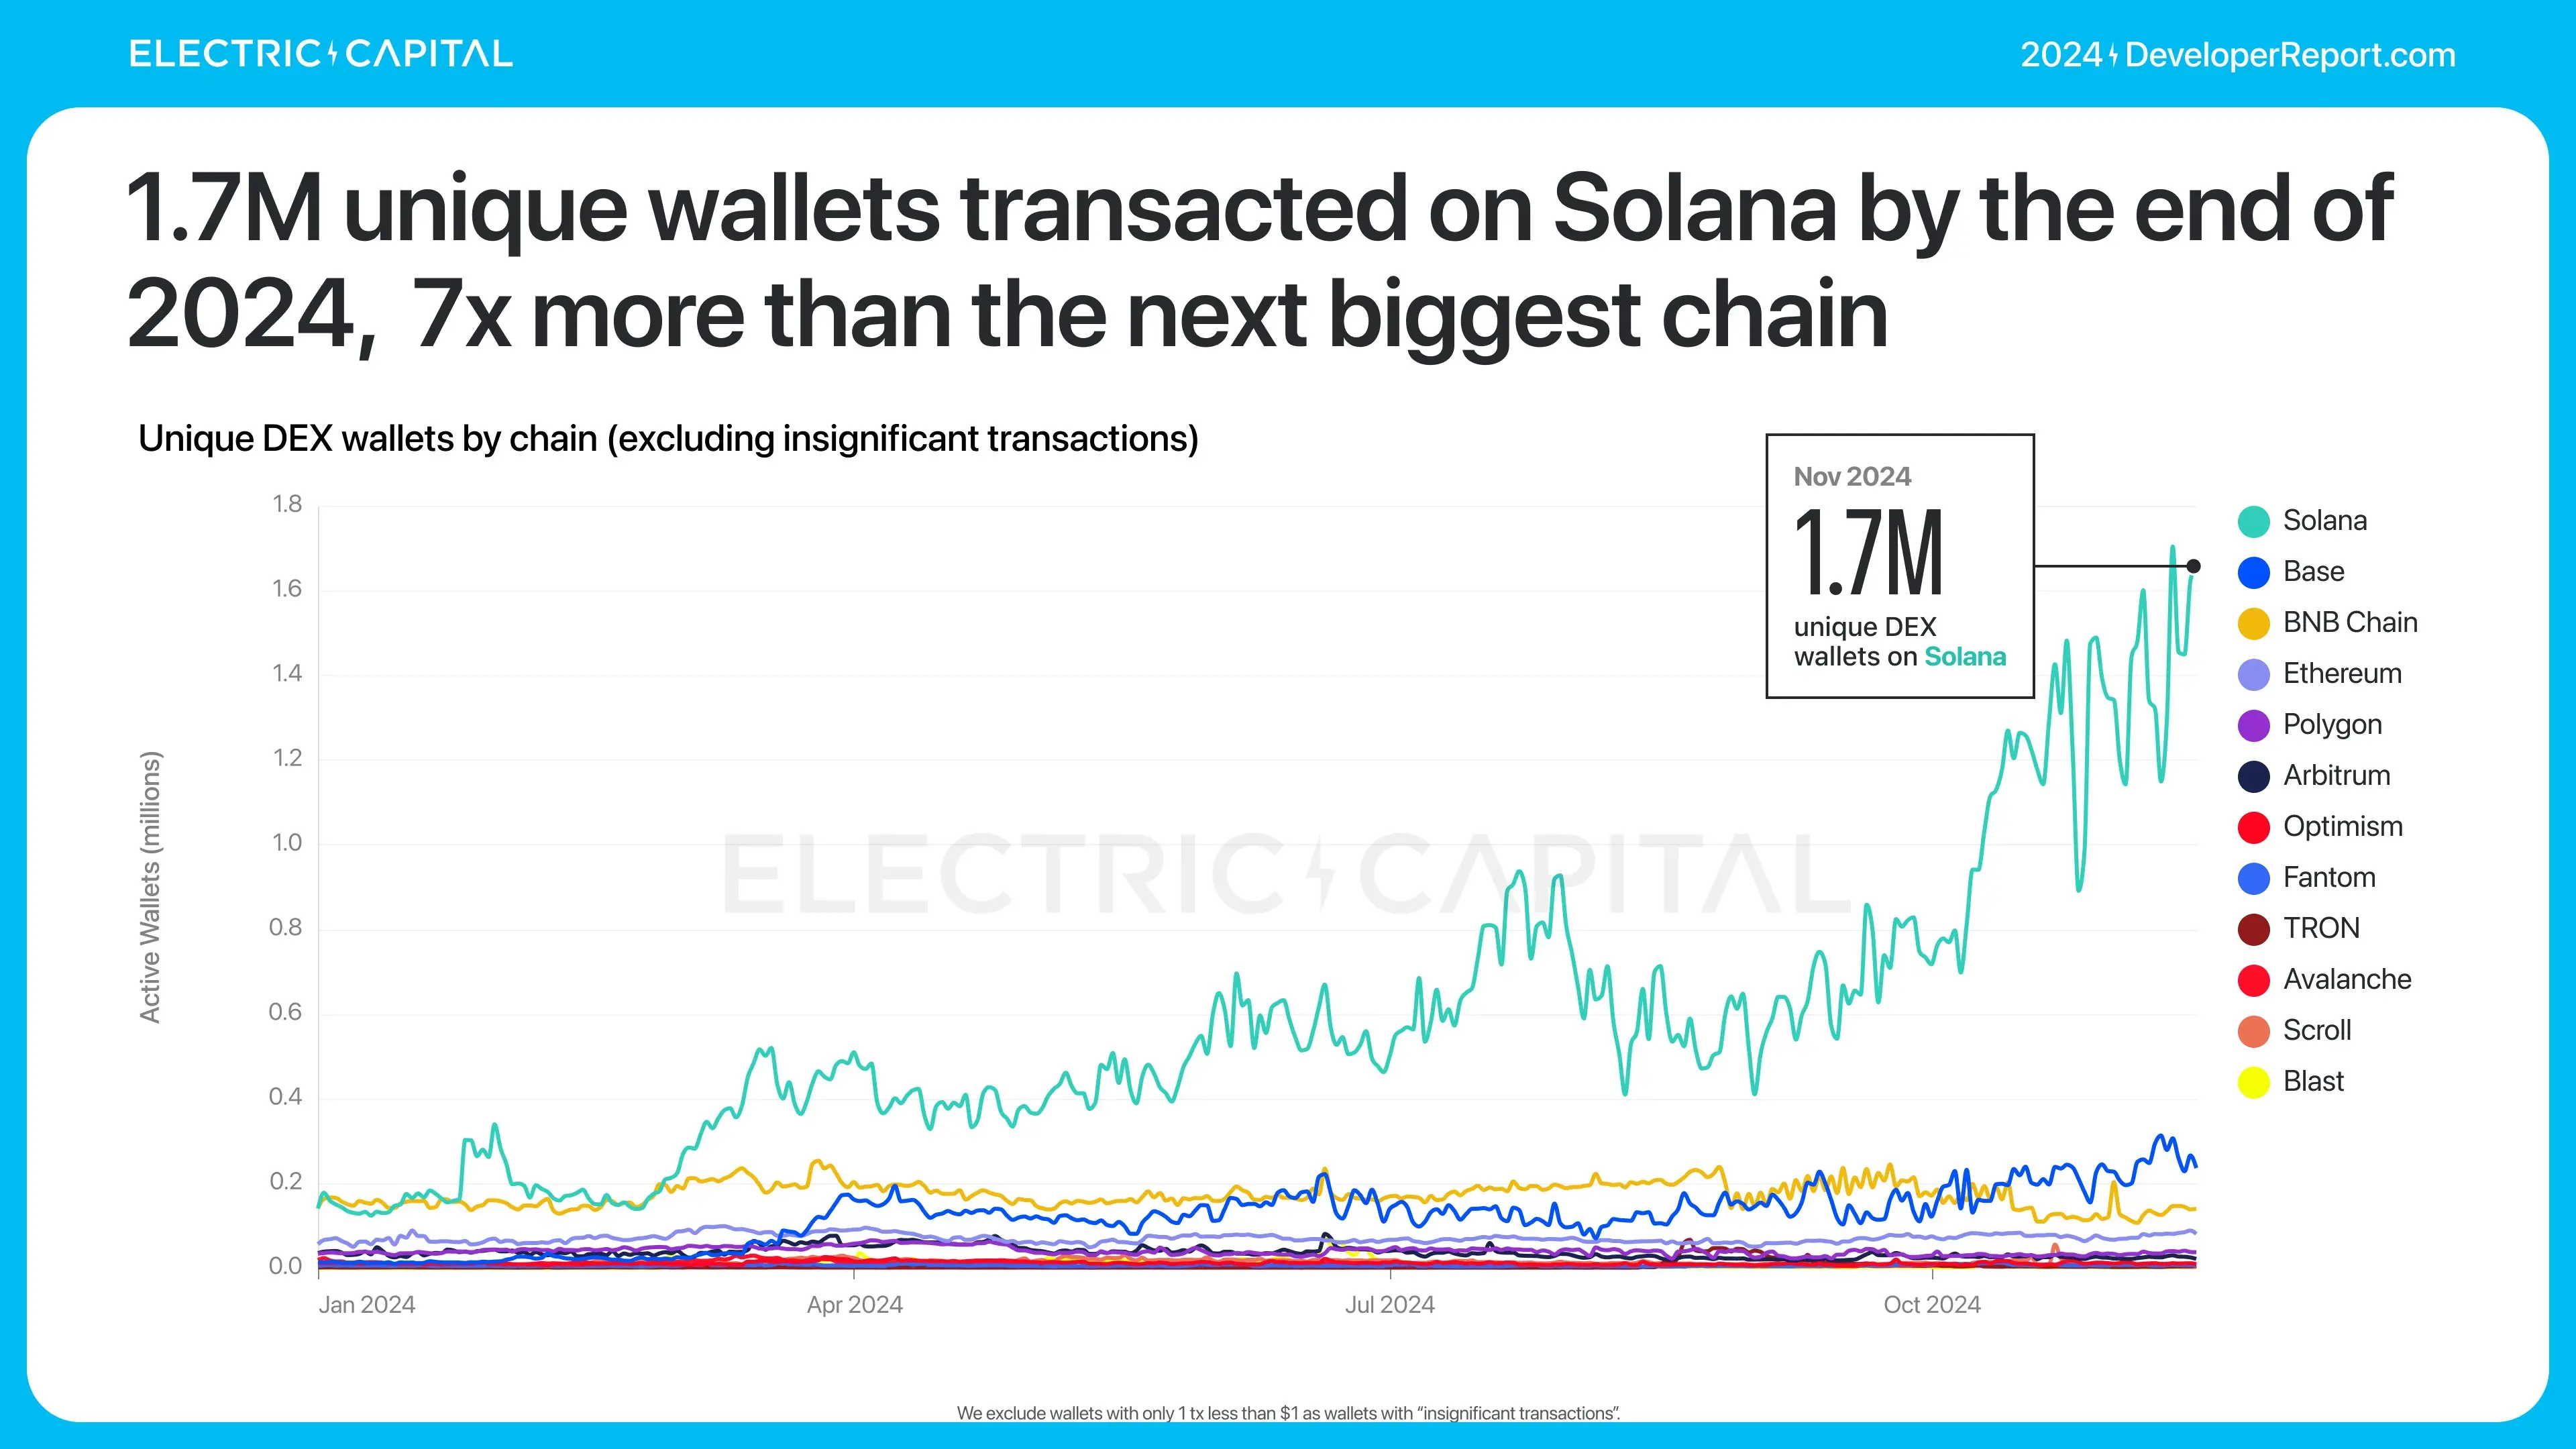
Base has the second most independent trading wallets, excluding Solana.
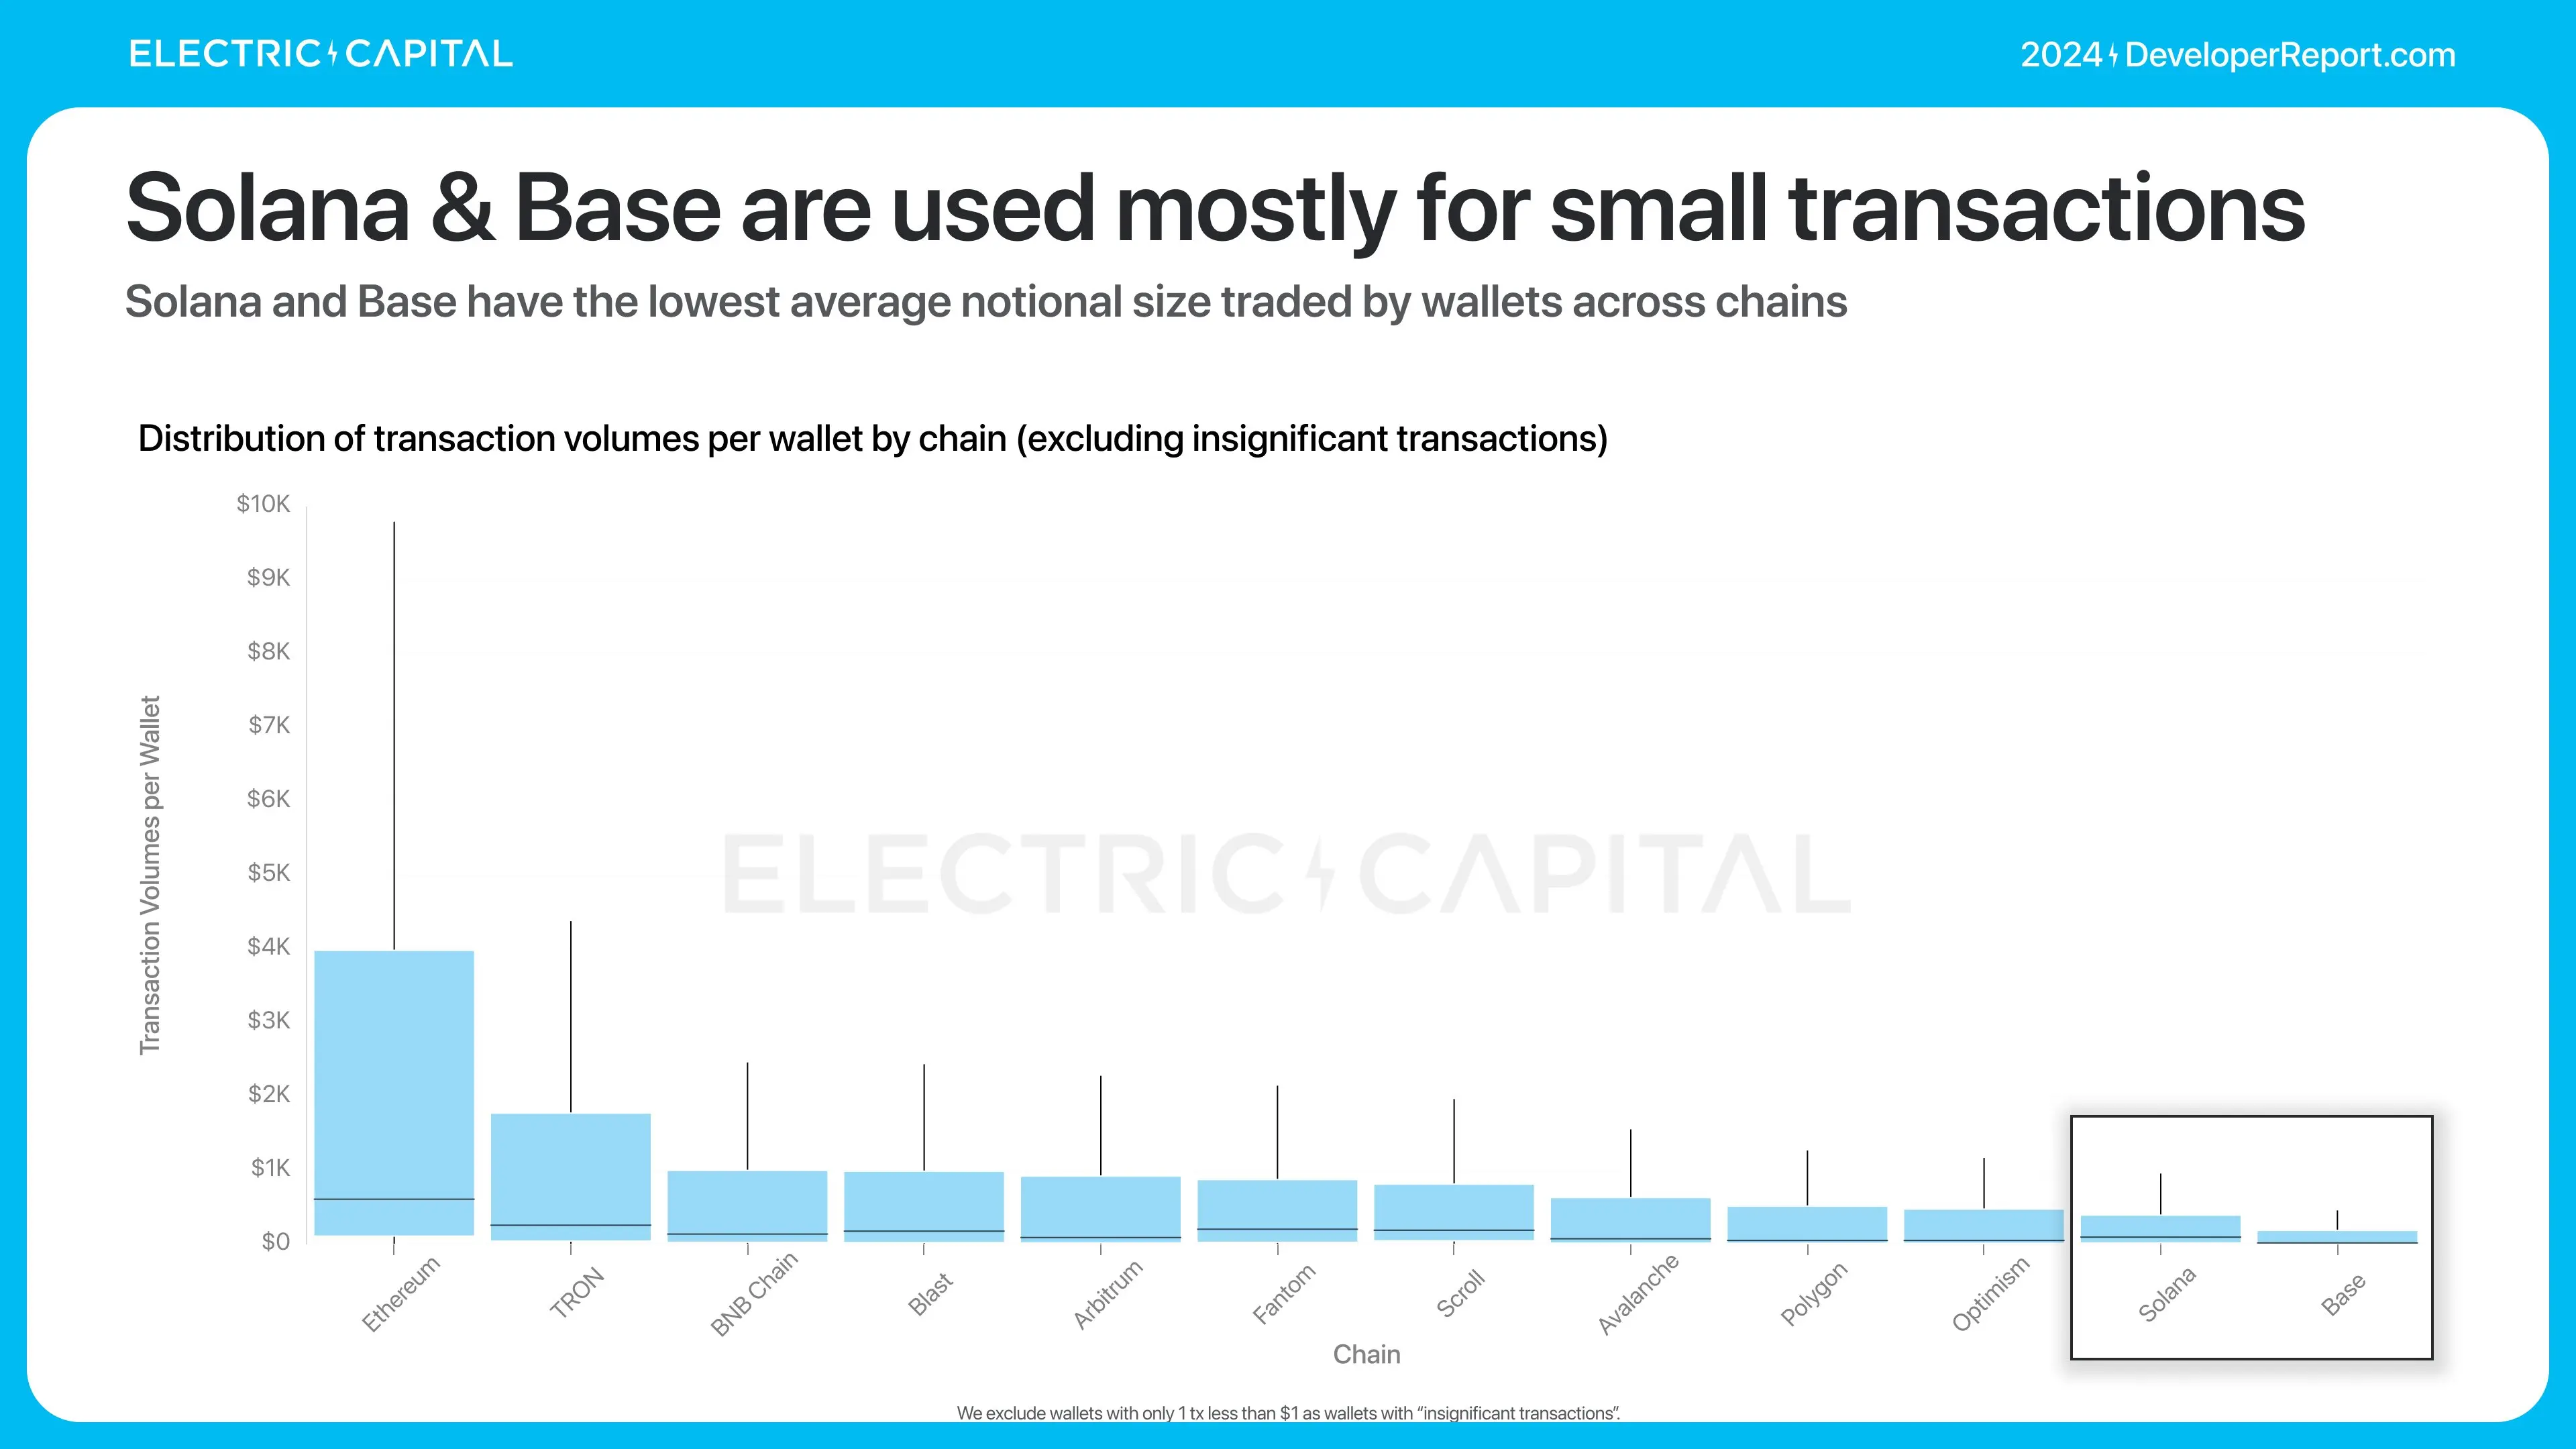
Base and Solana are very popular for small transfers. The average transaction amount for wallets on these chains is the smallest.
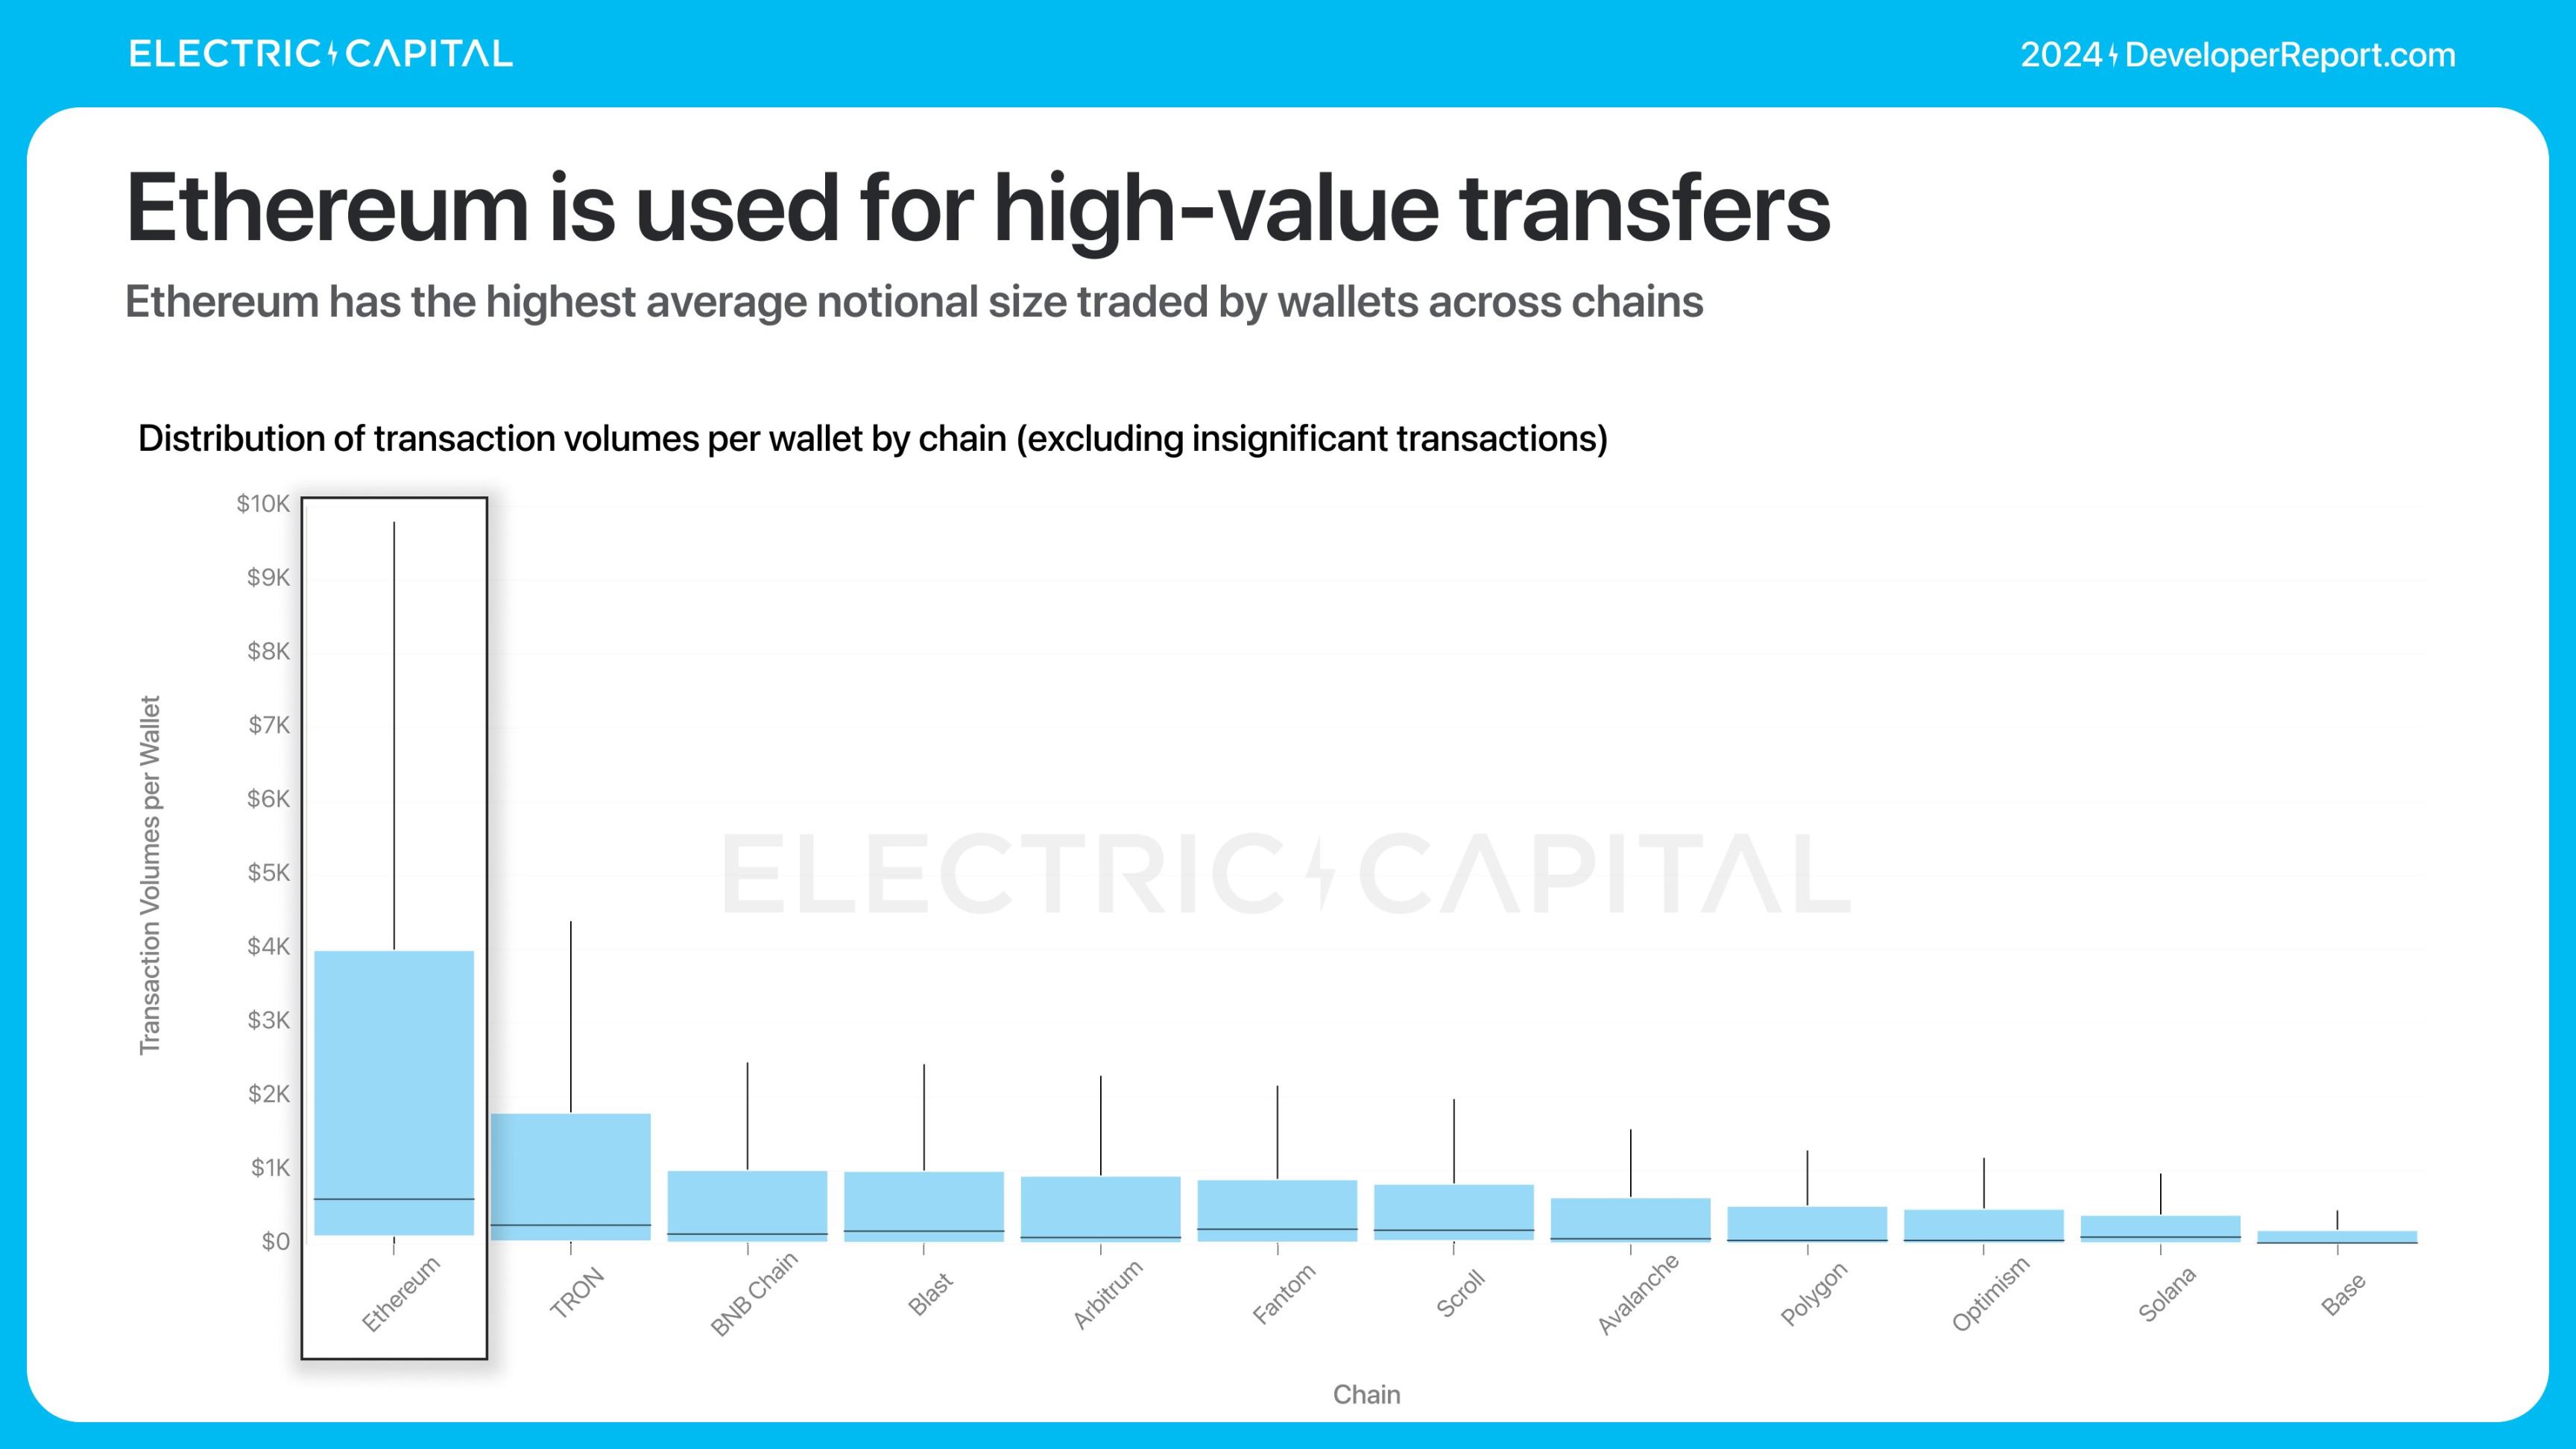
Ethereum, on the other hand, is the most favored for high-value transfers. The average transaction amount for wallets on Ethereum is the largest.
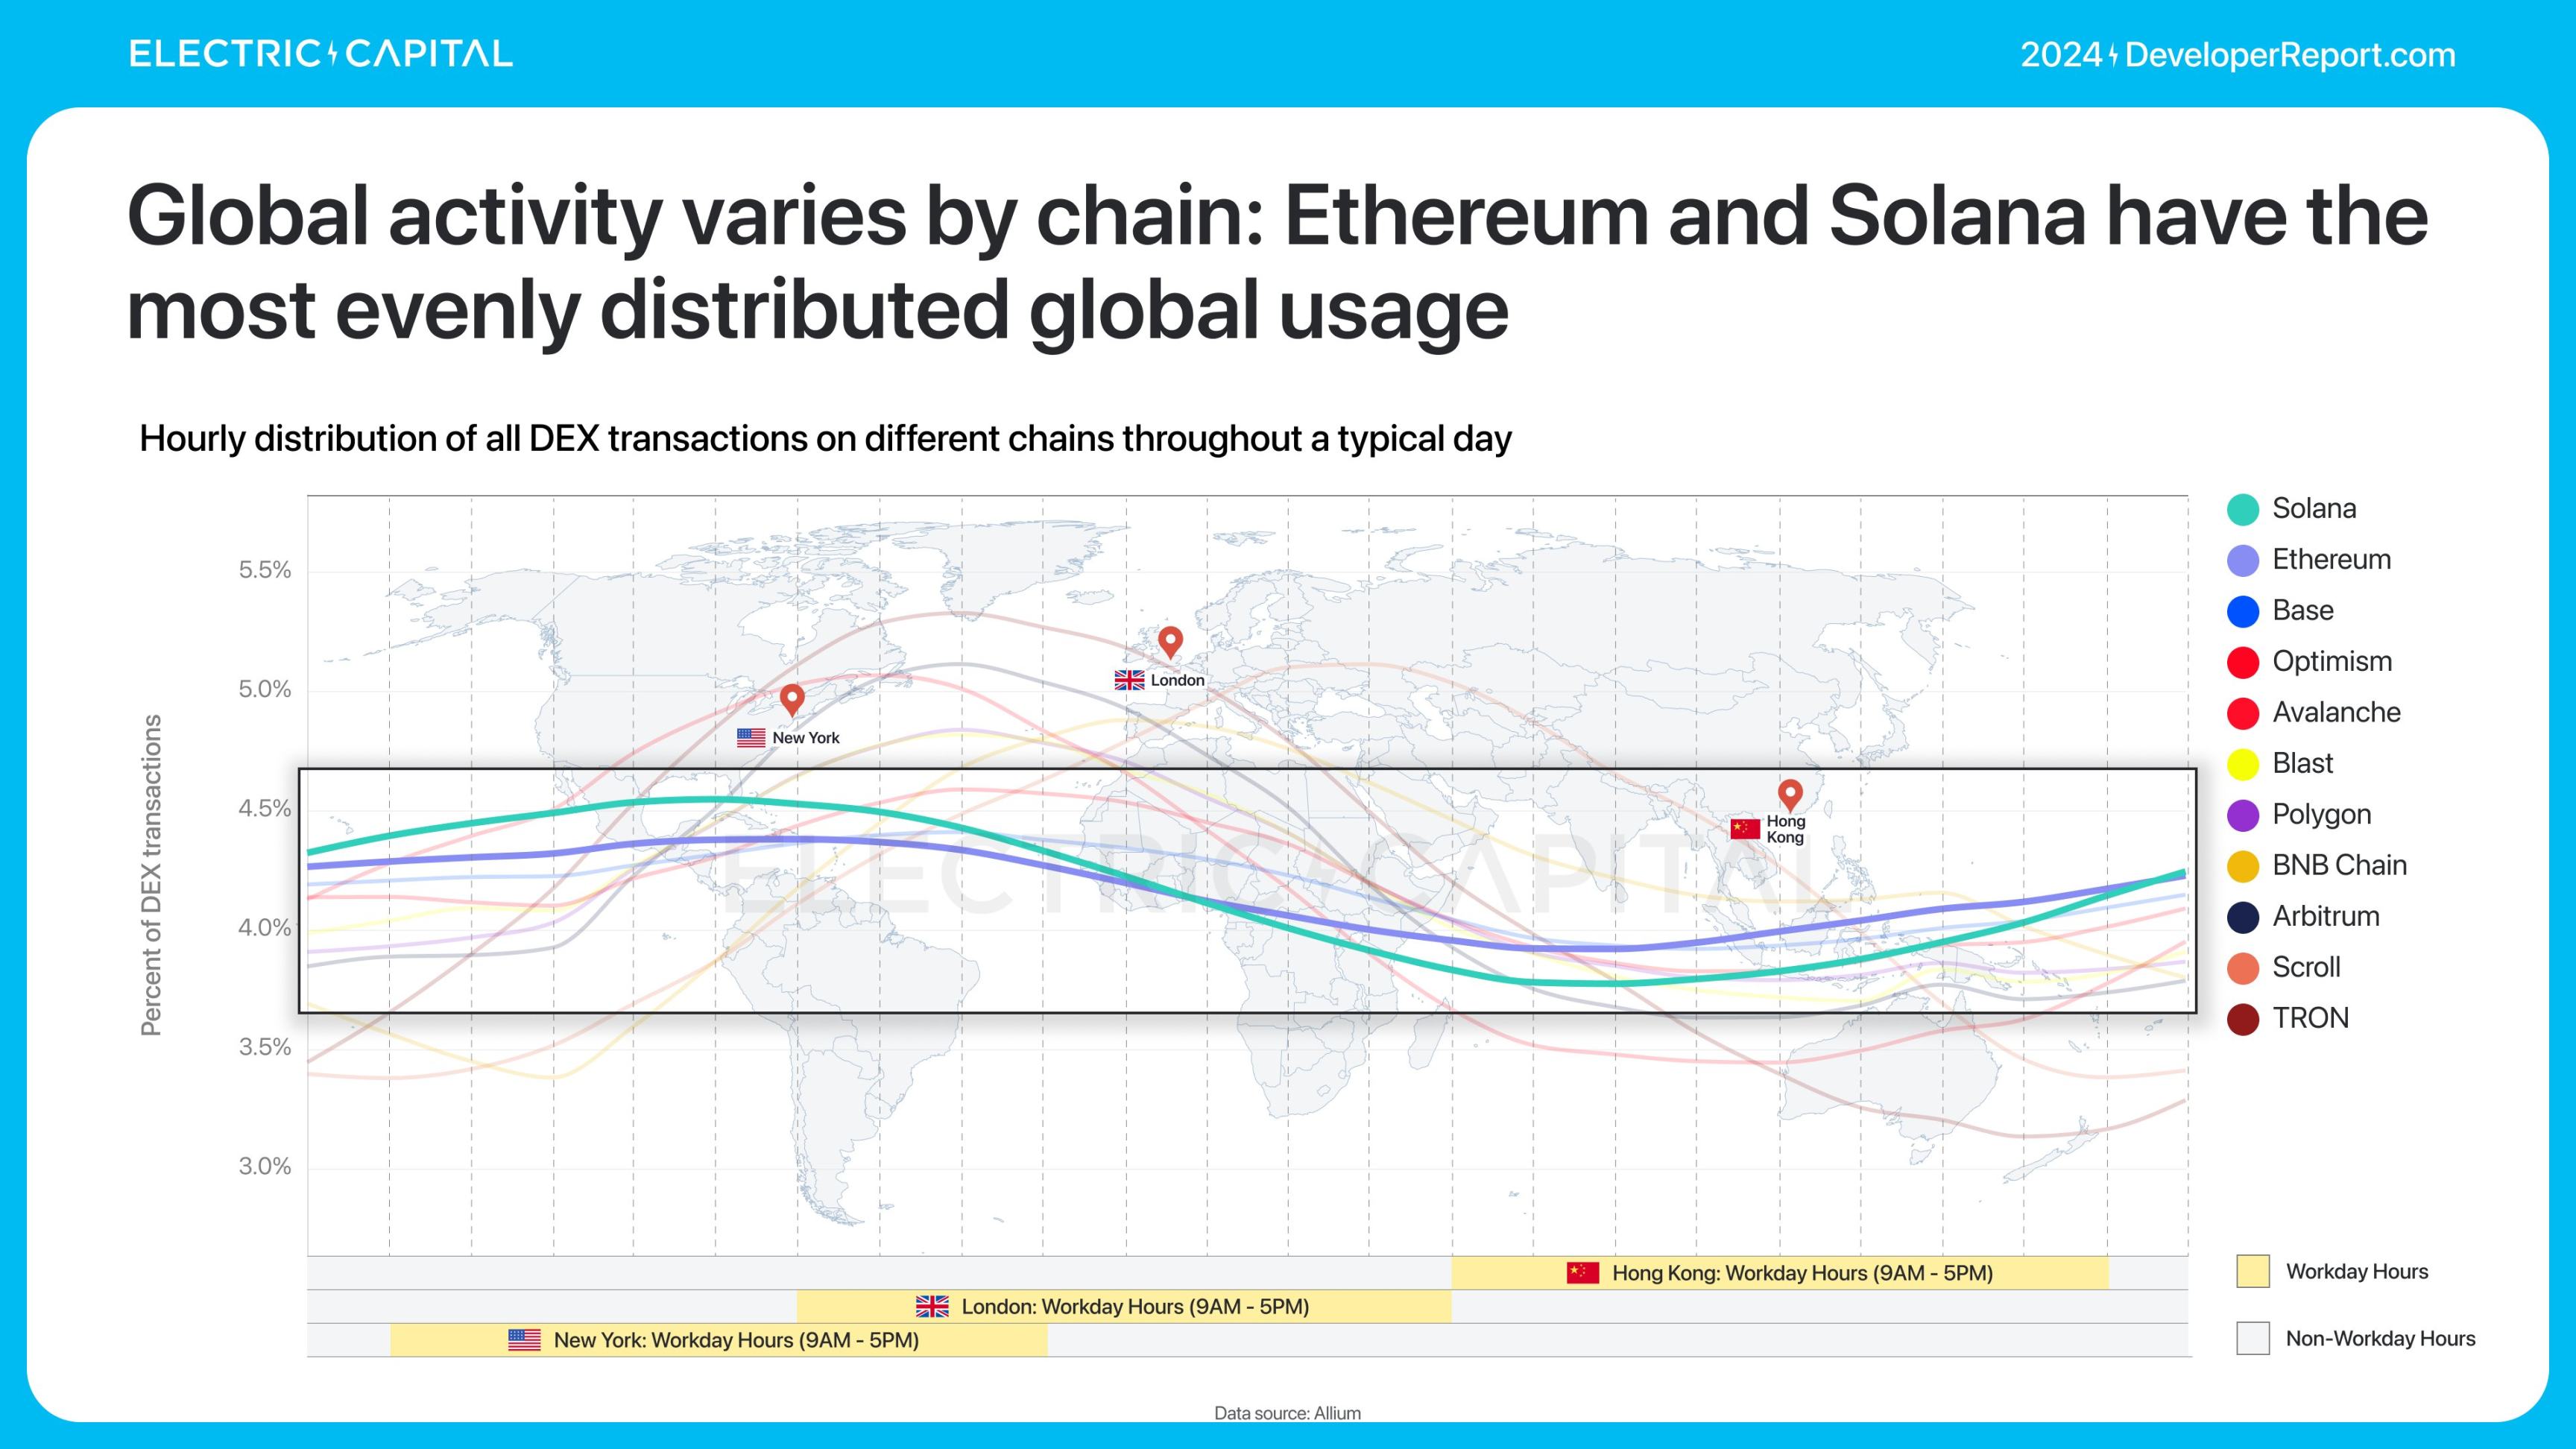
Where are these DEX users? We can understand DeFi usage through DEXs, as financial activities often start or end with DEXs.
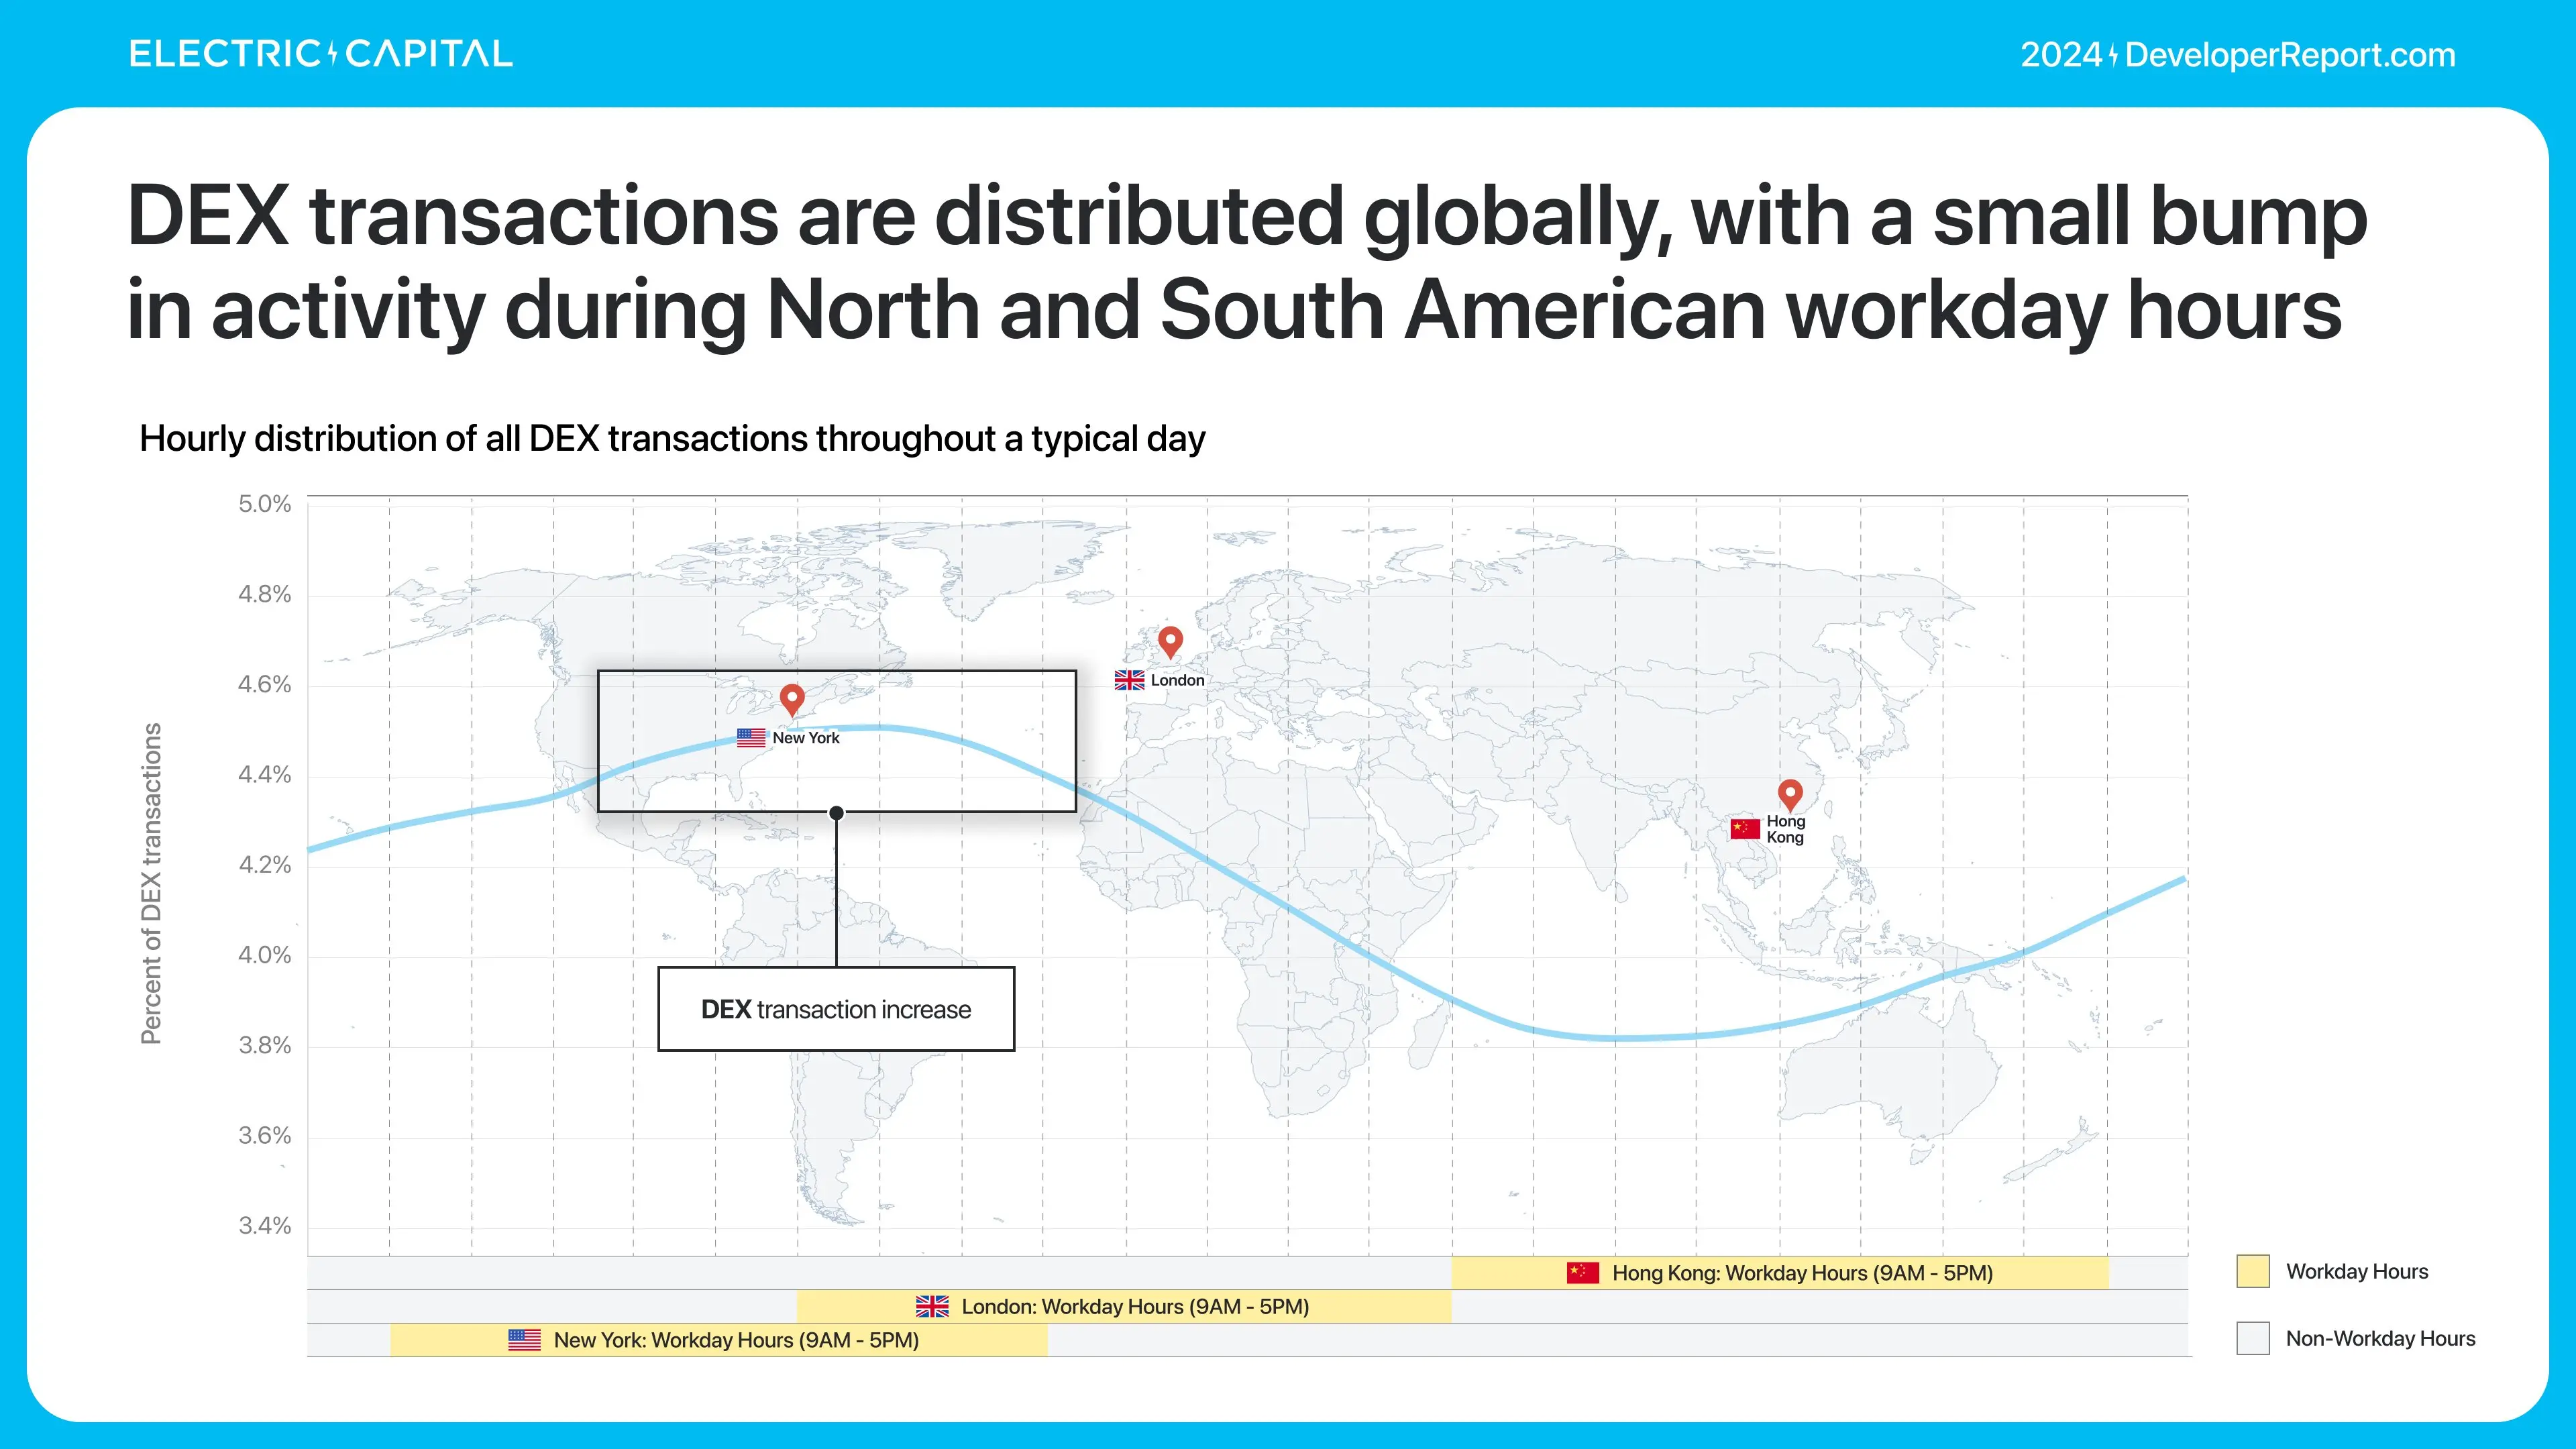
Global activity is distributed differently across chains—the more evenly distributed the activity, the more global the usage. Ethereum and Solana have the most evenly distributed usage.
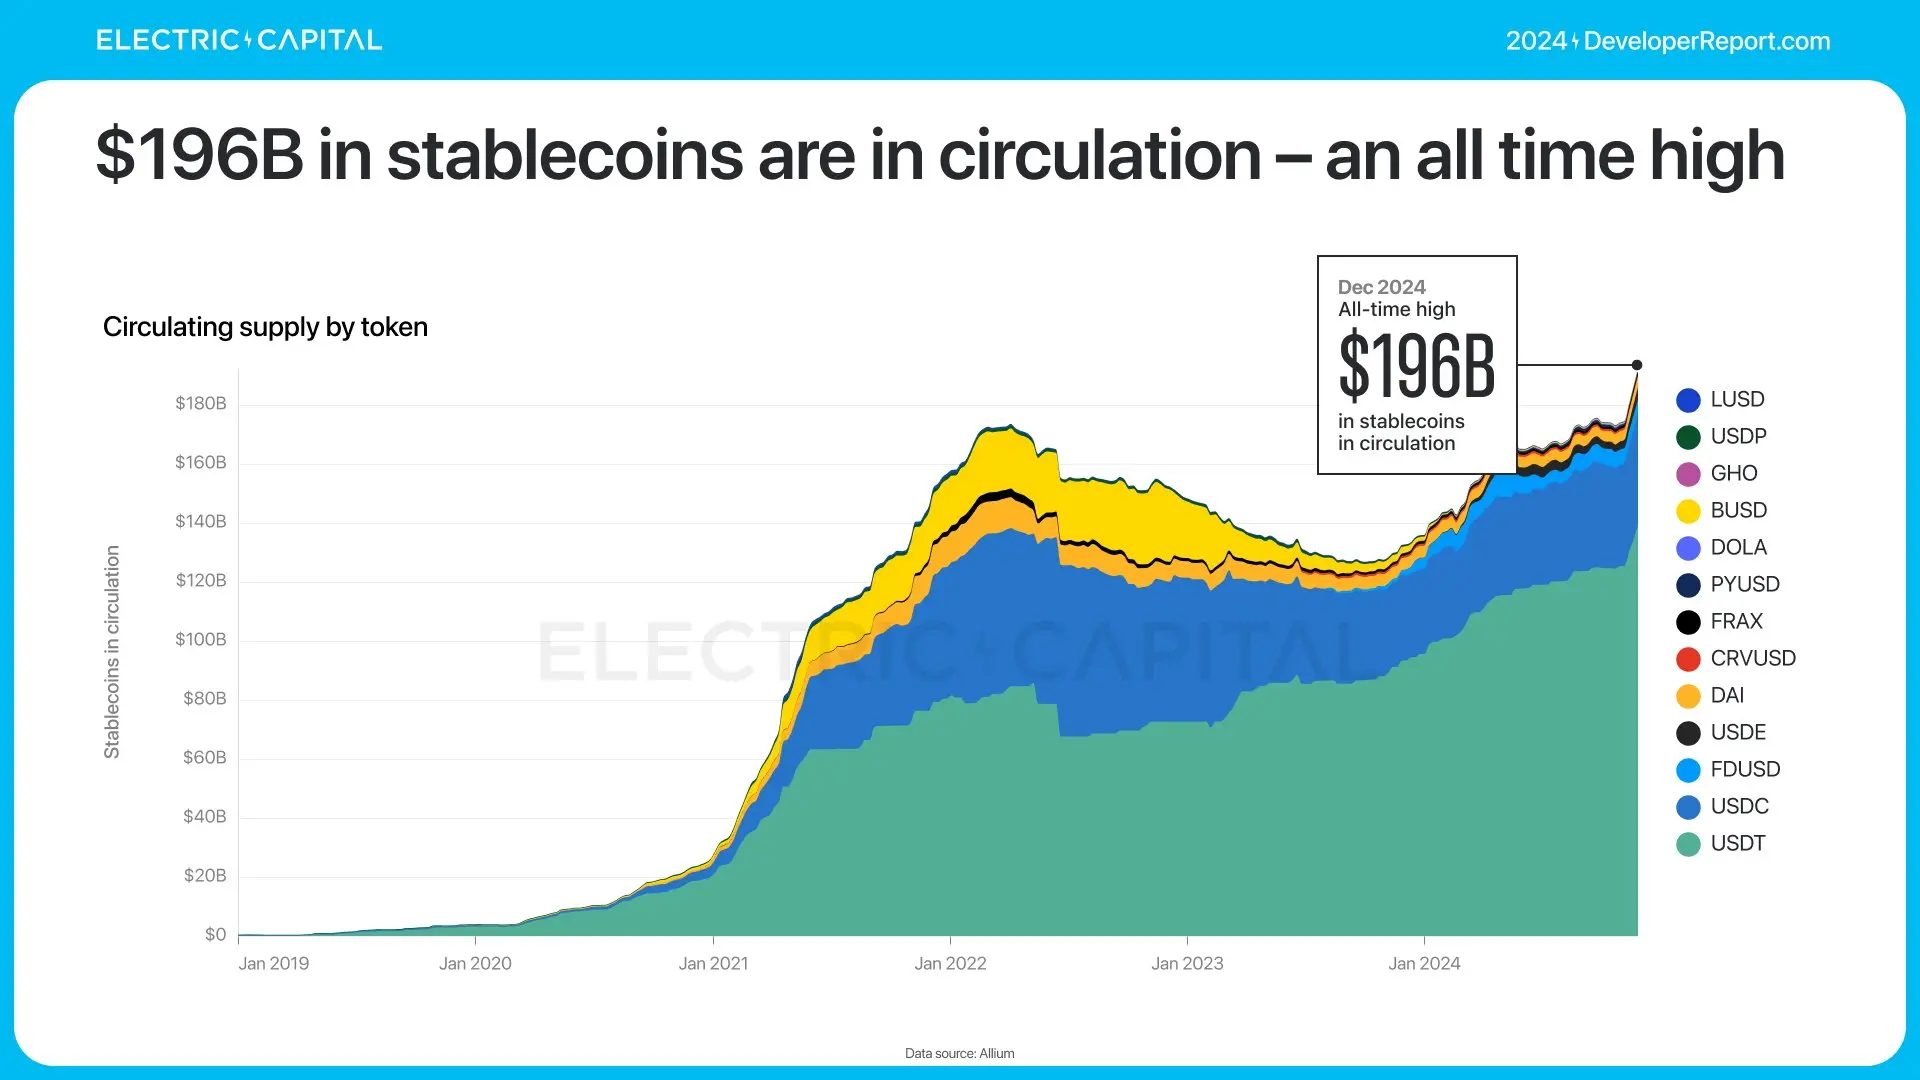
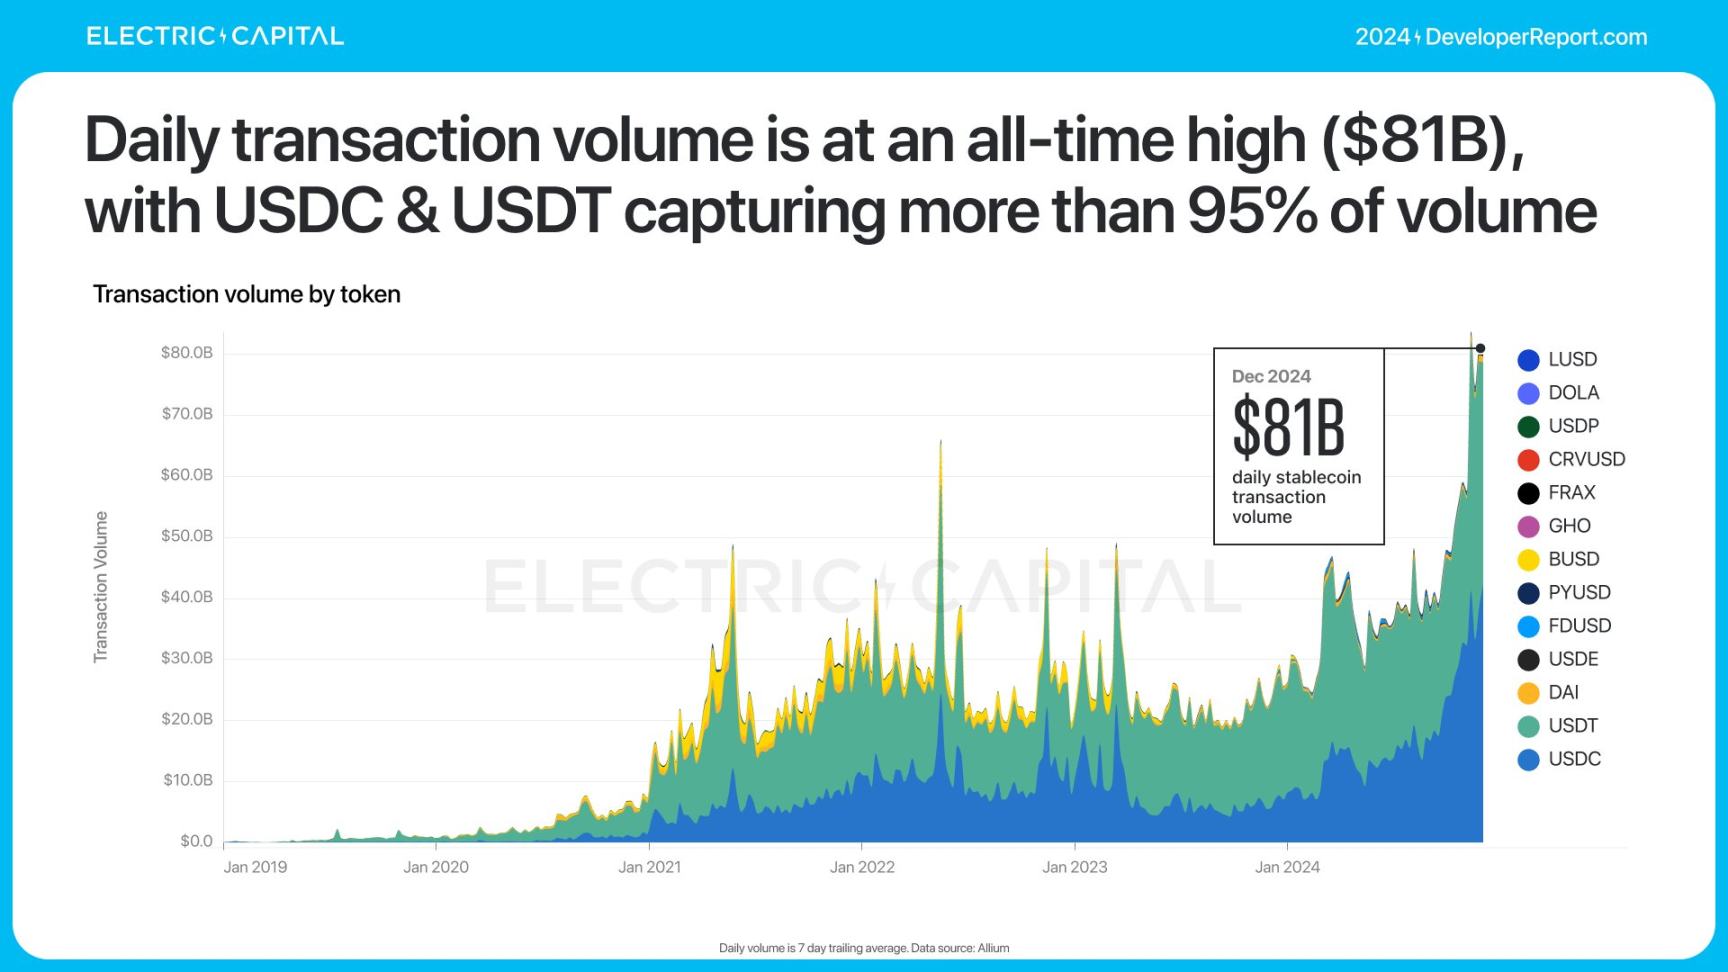
Stablecoins are one of the largest crypto application scenarios globally. How are stablecoins performing? The usage of stablecoins has reached an all-time high: the total circulating stablecoins amount to $196 billion, with a daily trading volume of $81 billion—both of which are historical records for stablecoins.
USDC and USDT account for 95% of the trading volume.
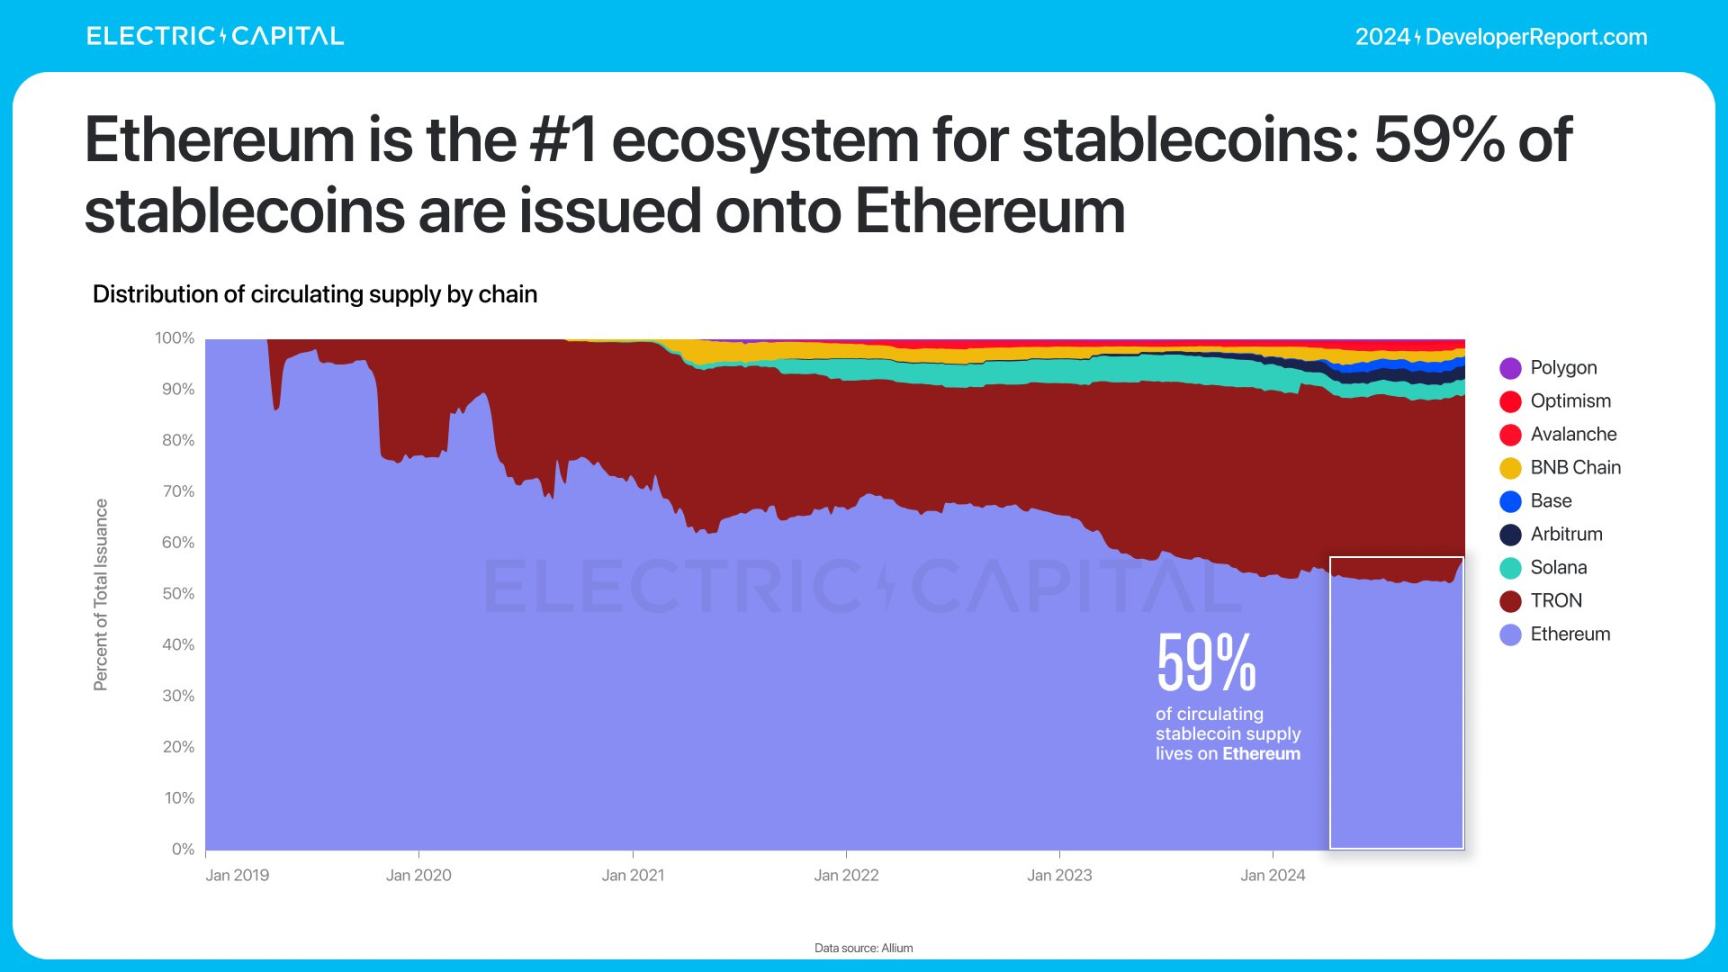
Ethereum is the first ecosystem for stablecoins—59% of stablecoins are issued on Ethereum.
What is the global activity of stablecoins like?
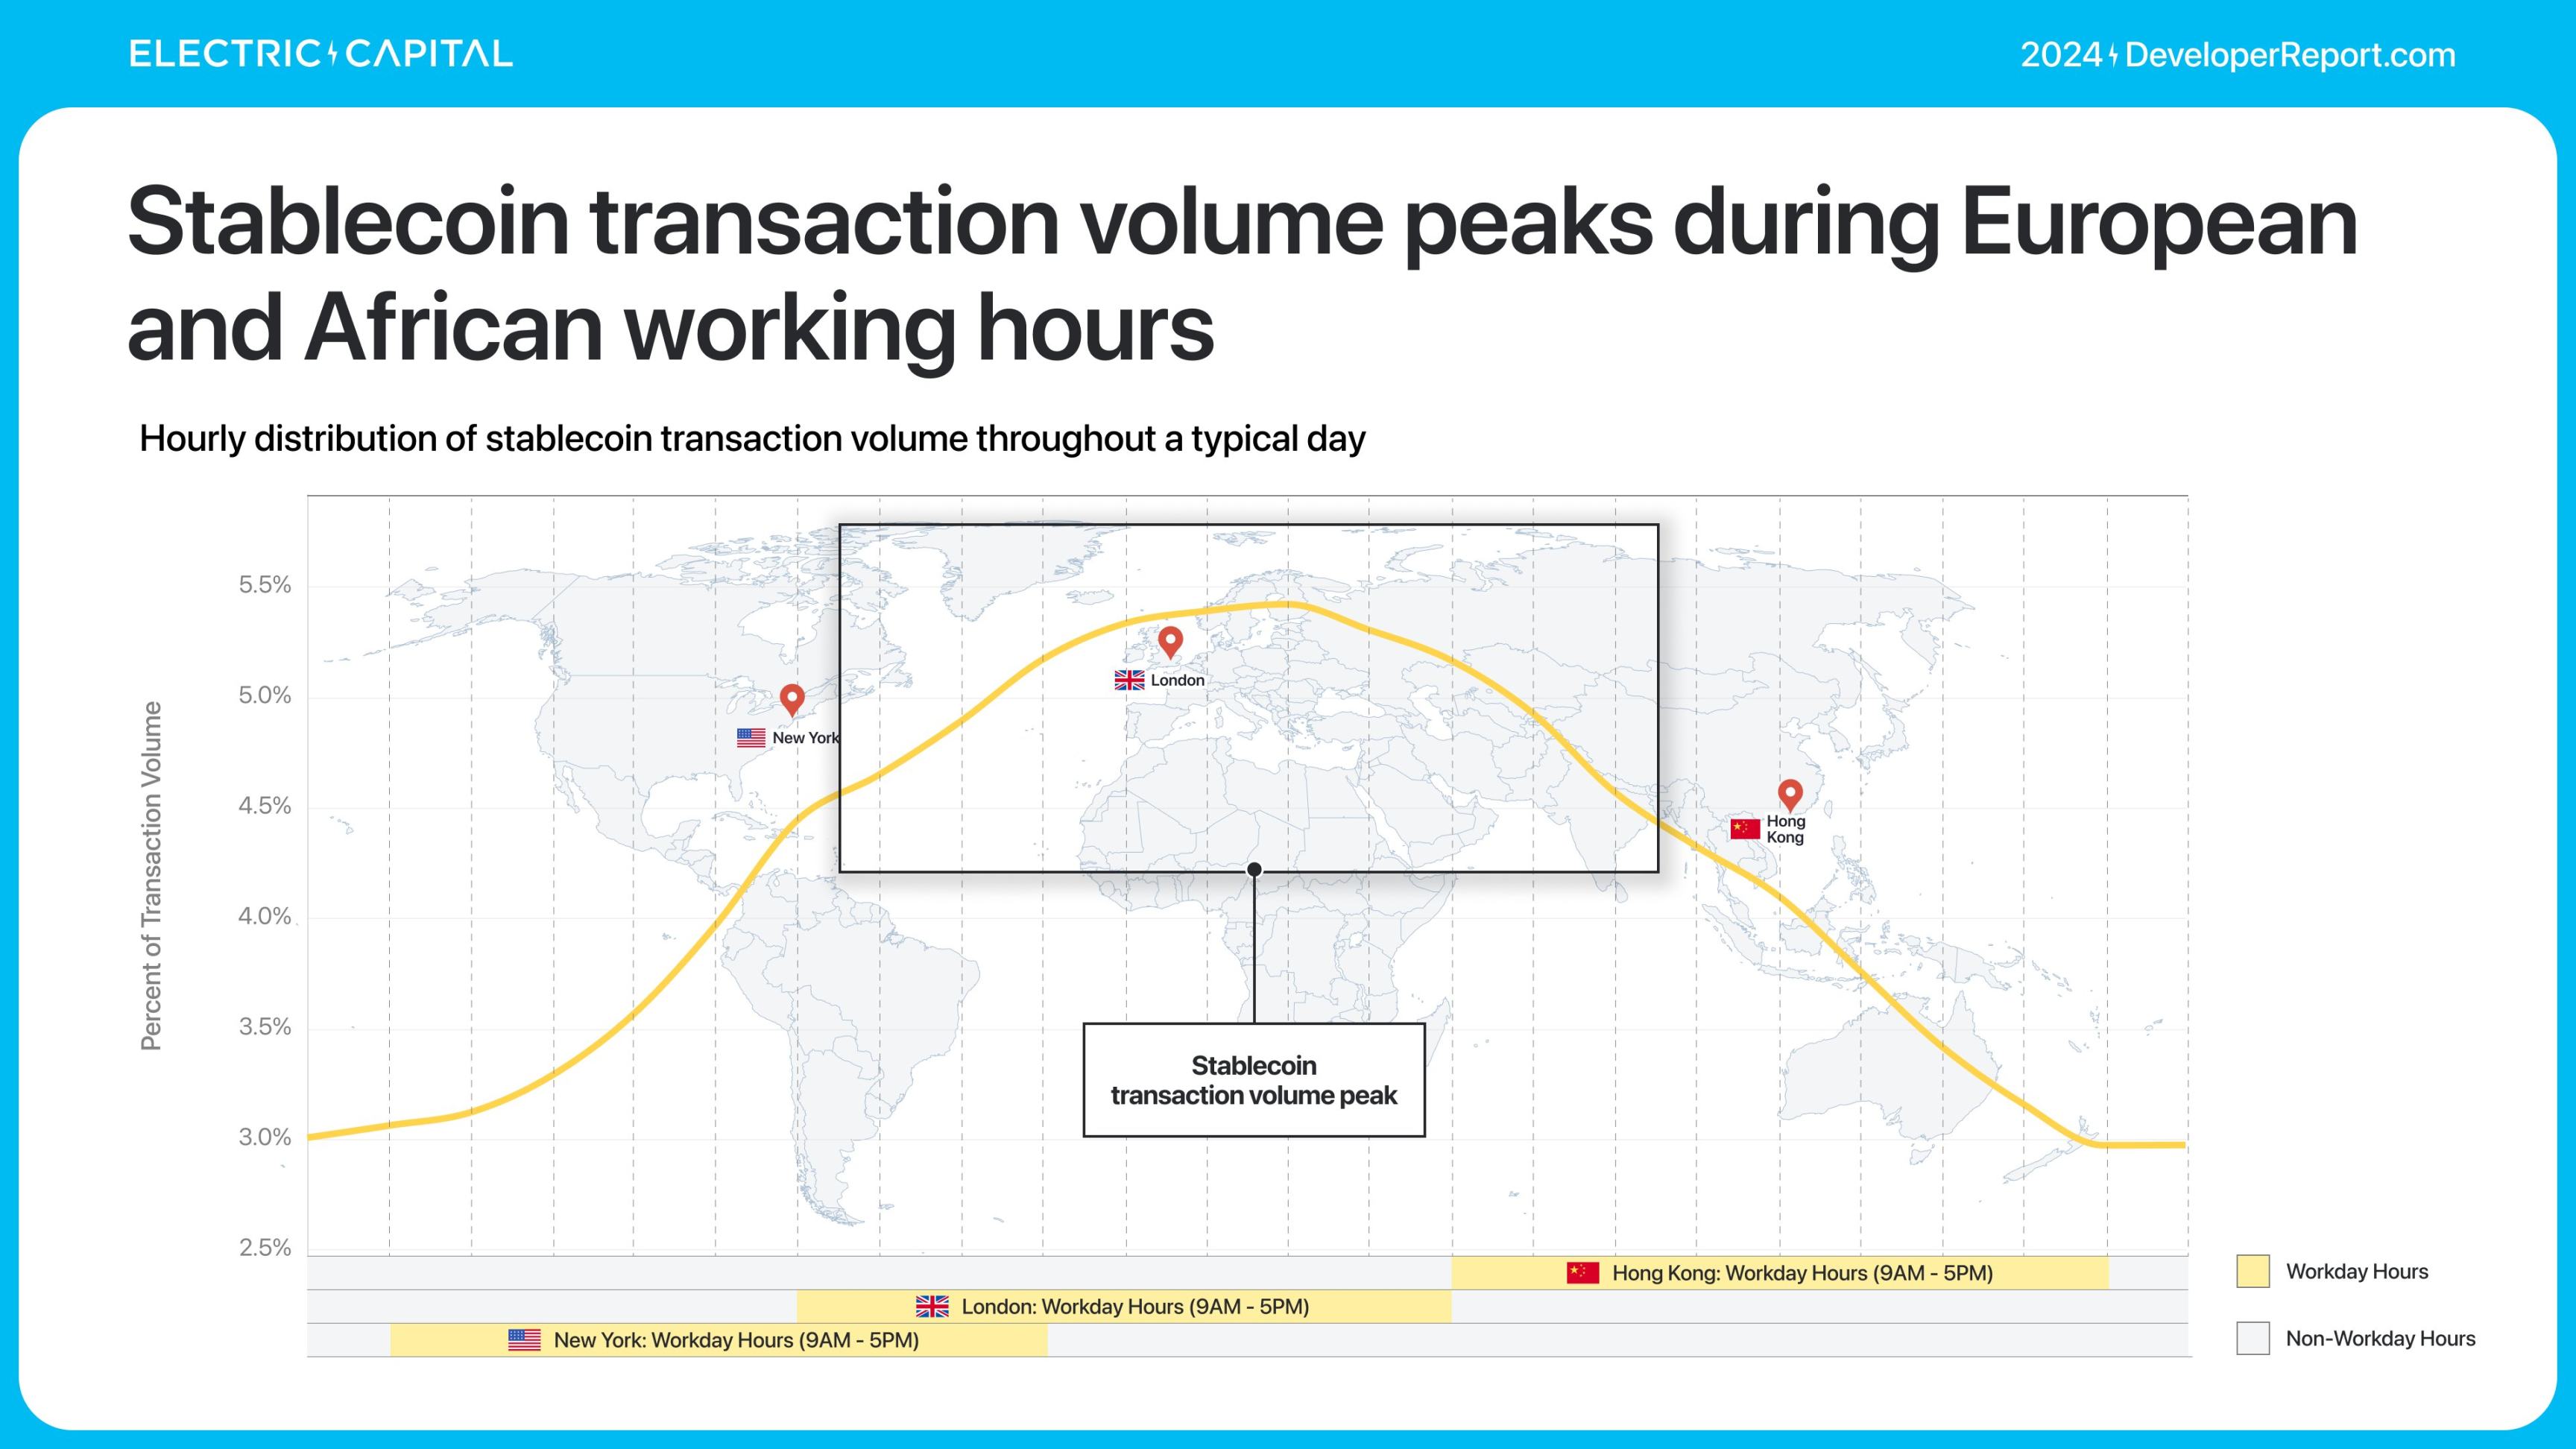
Stablecoins remain active, but trading volume increased by 2-3% during working hours in Asia, Europe, and Africa.
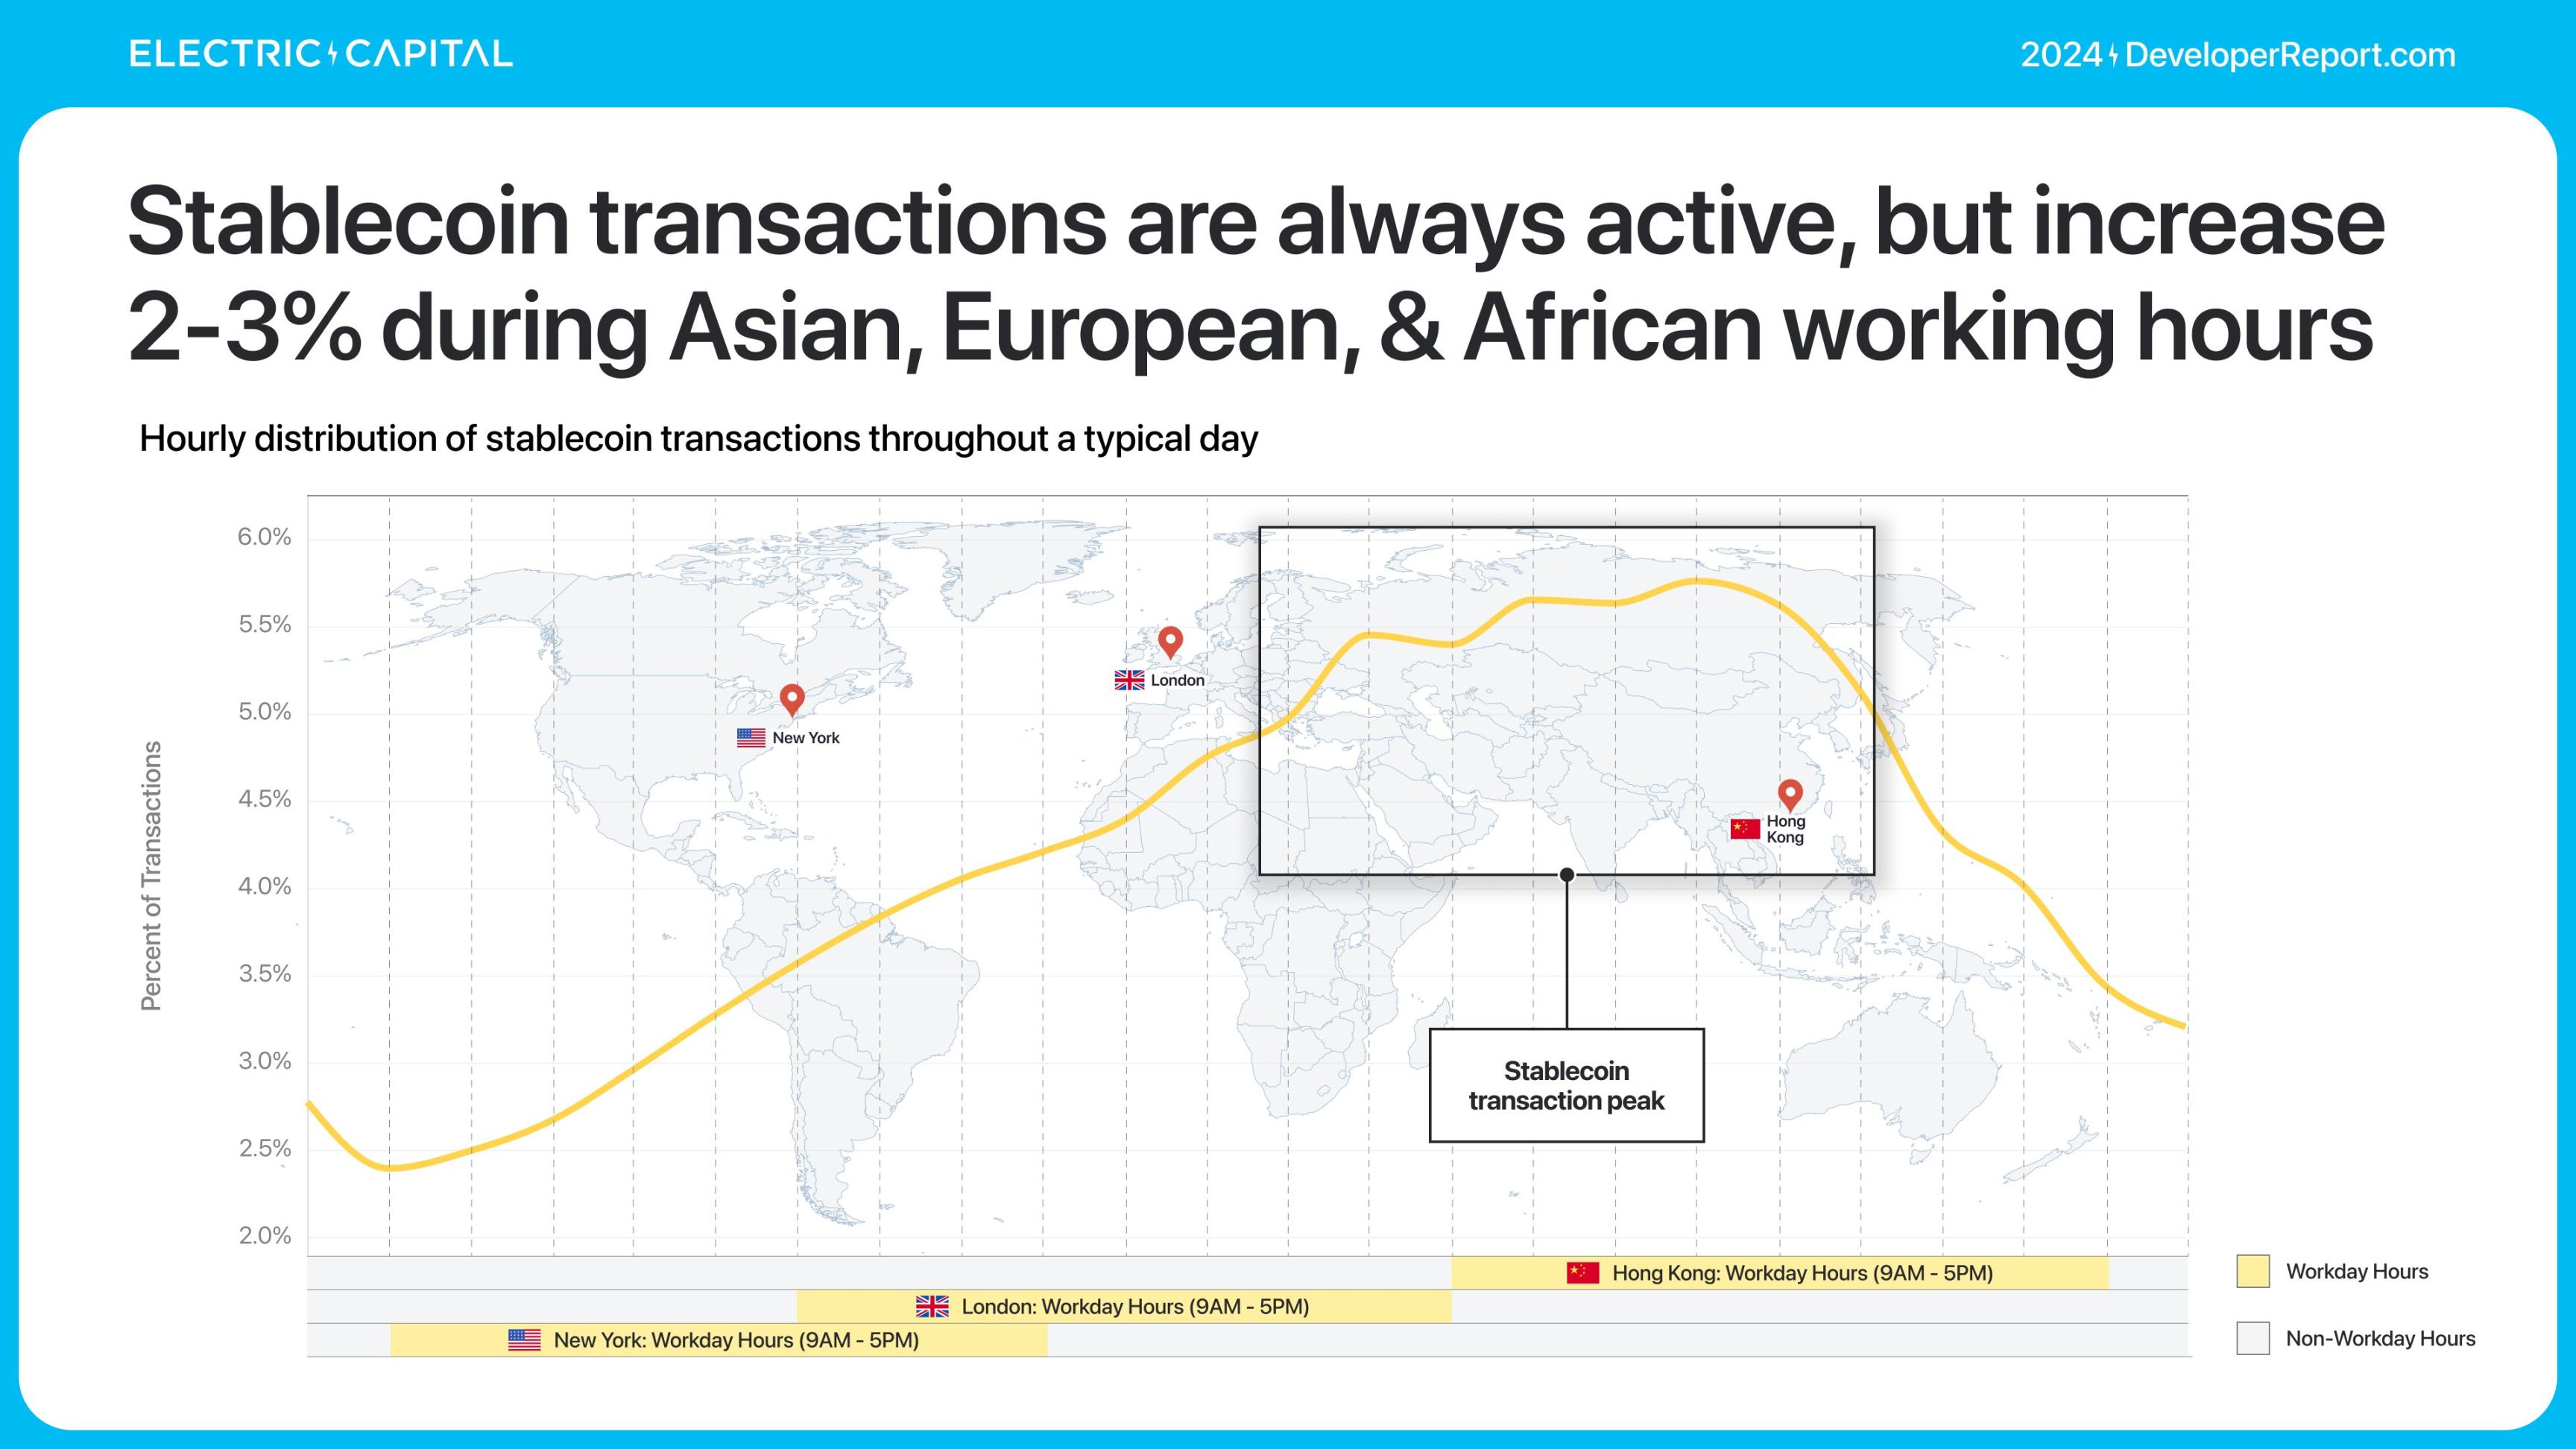
Although stablecoin trading peaks during working hours in the Eastern Hemisphere, the trading volume is more inclined towards the Western Hemisphere.
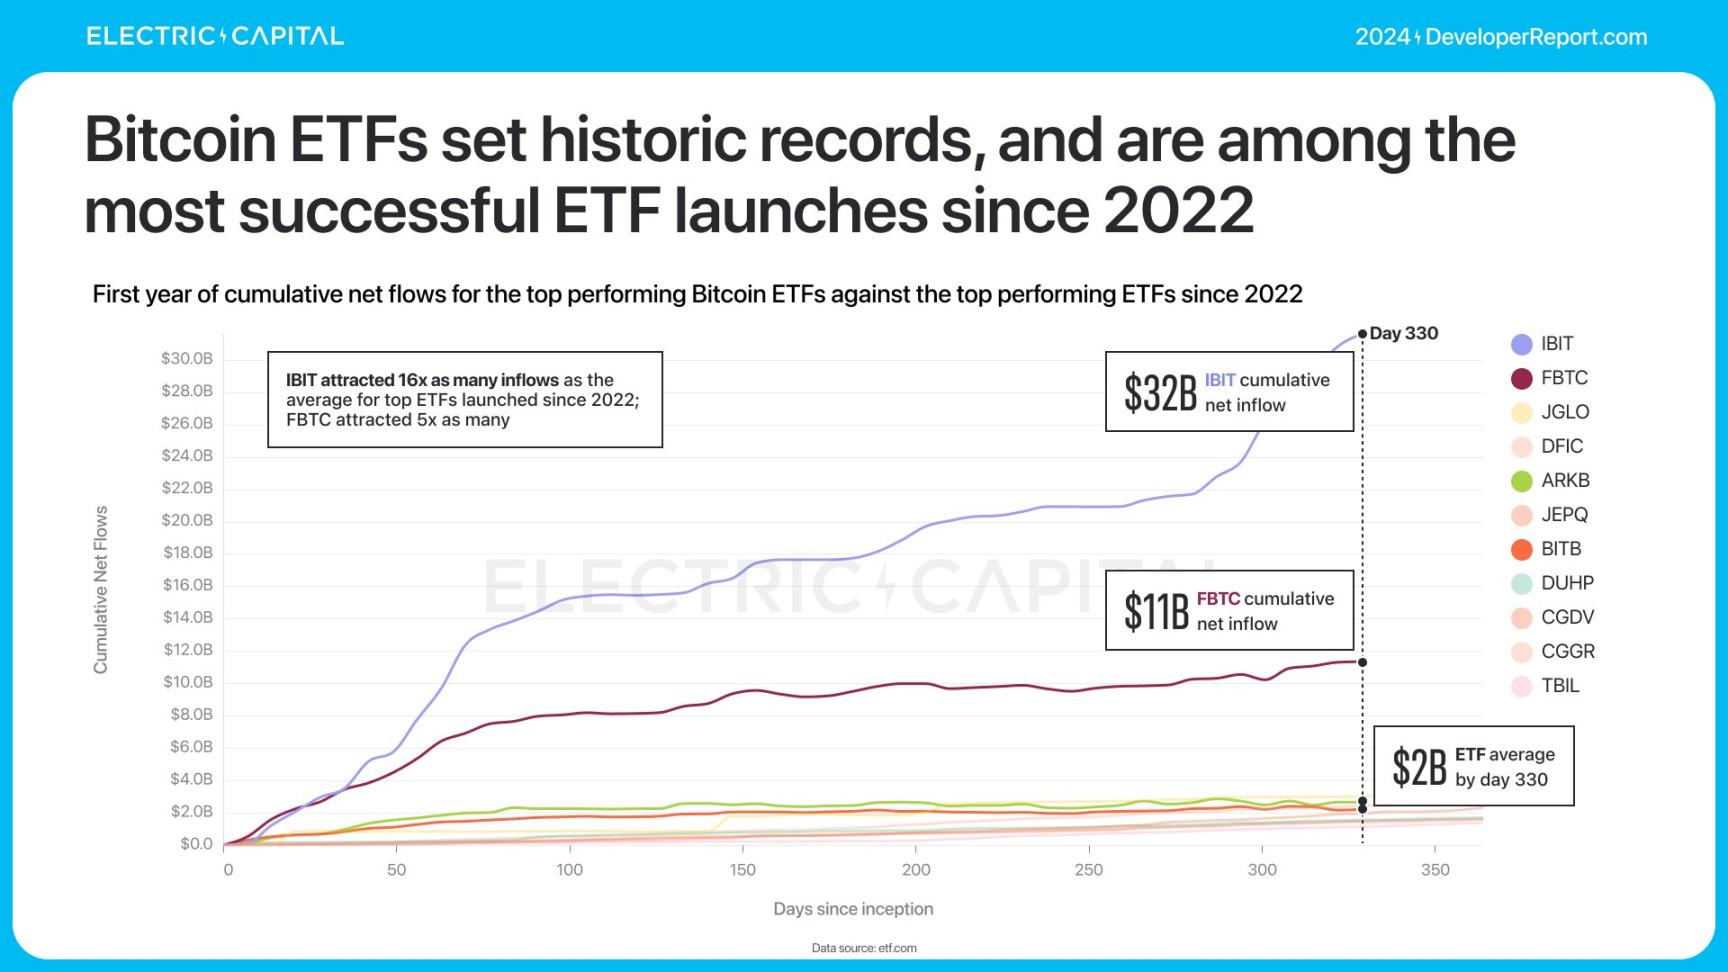
Bitcoin and Ethereum ETFs launched this year, providing a convenient way for off-chain capital to enter on-chain assets. The Bitcoin ETF attracted over $50 billion in net inflows, becoming one of the most successful ETFs in history.
Most of the trading volume for the Bitcoin ETF comes from retail investors.
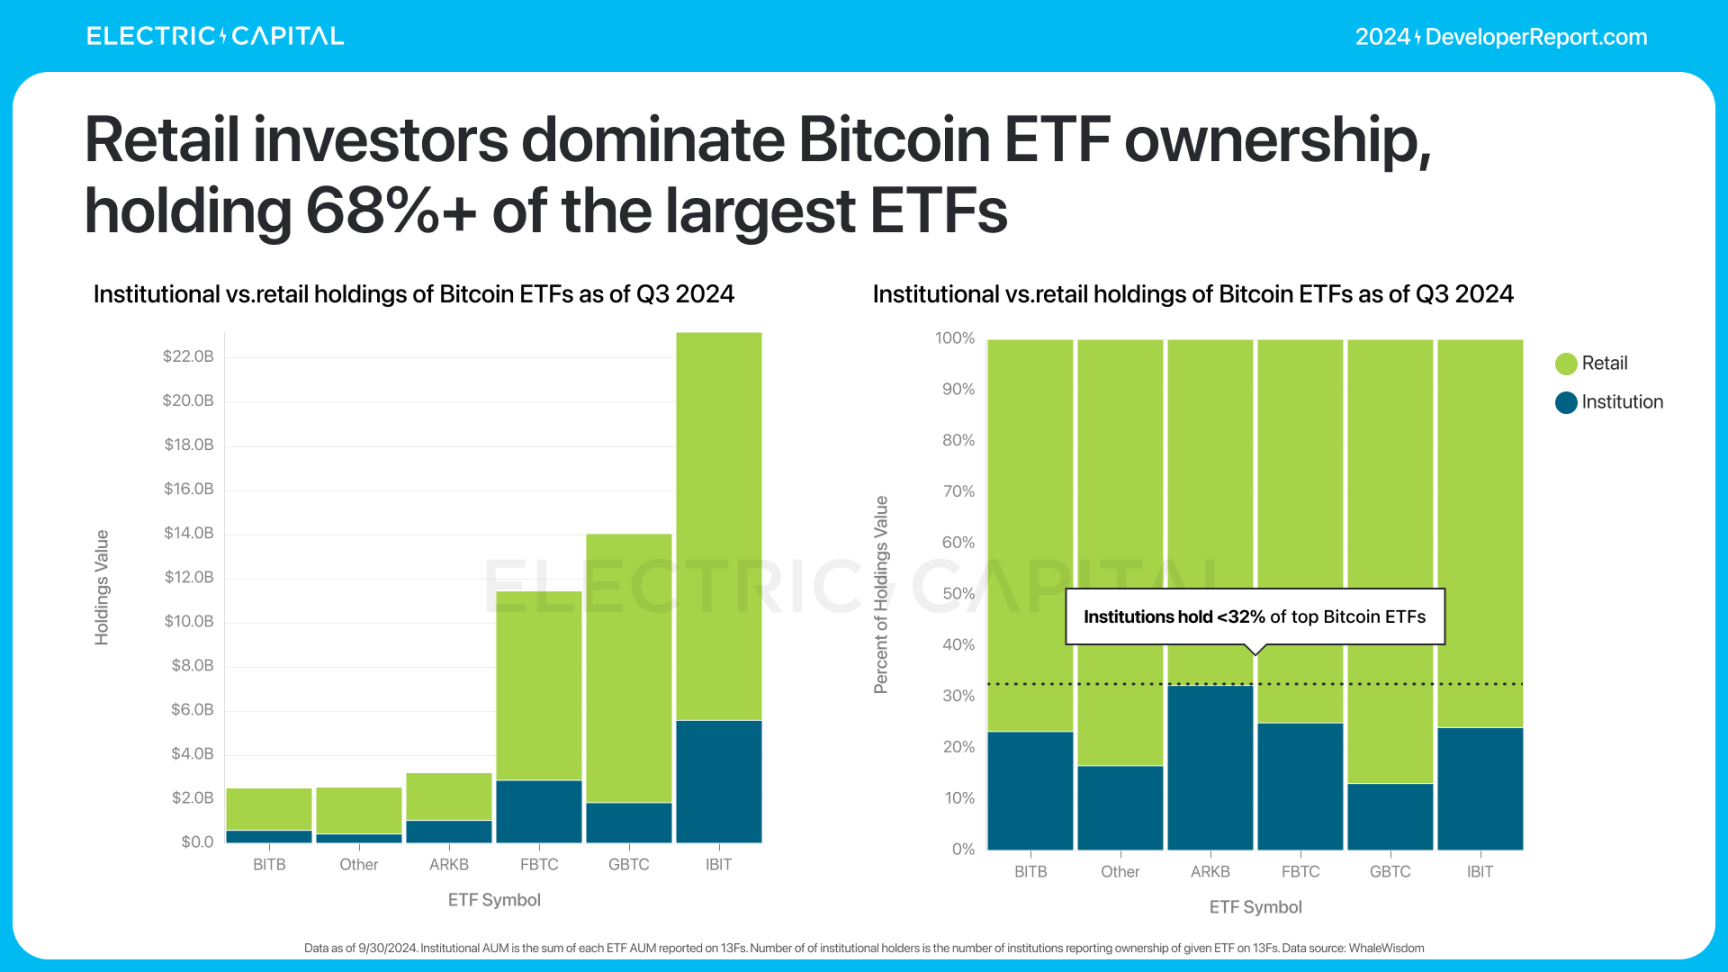
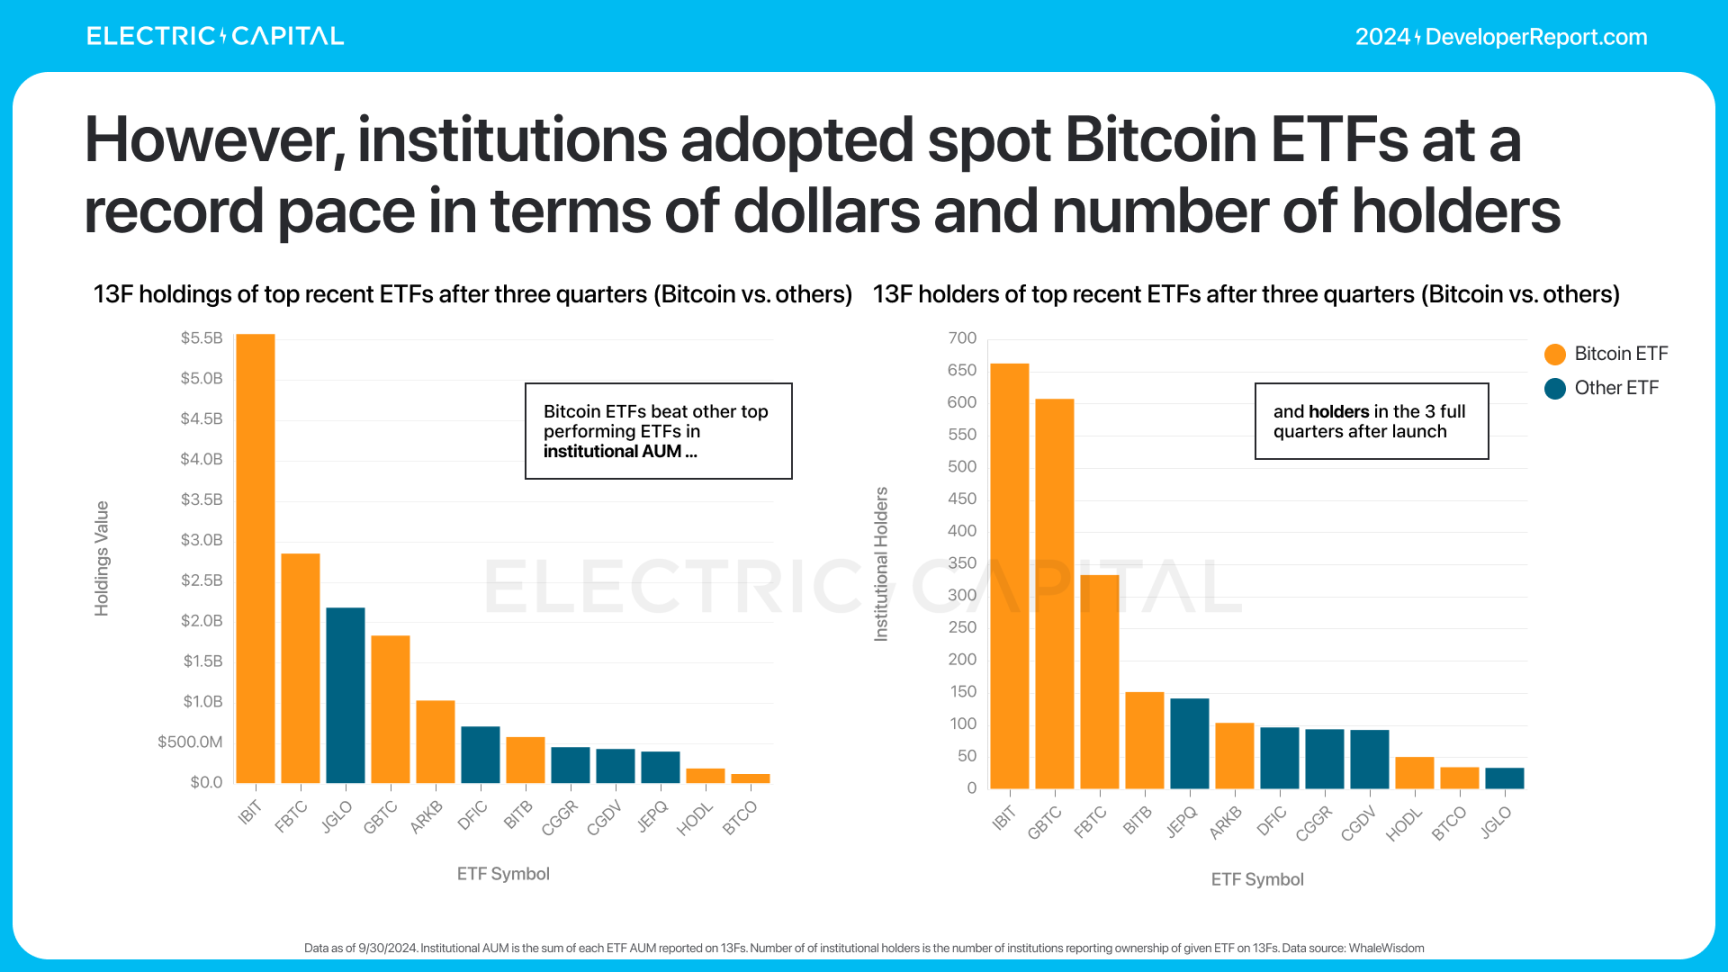
Although the Bitcoin ETF is still in its early stages, institutional investors are purchasing spot Bitcoin ETFs at a record pace.
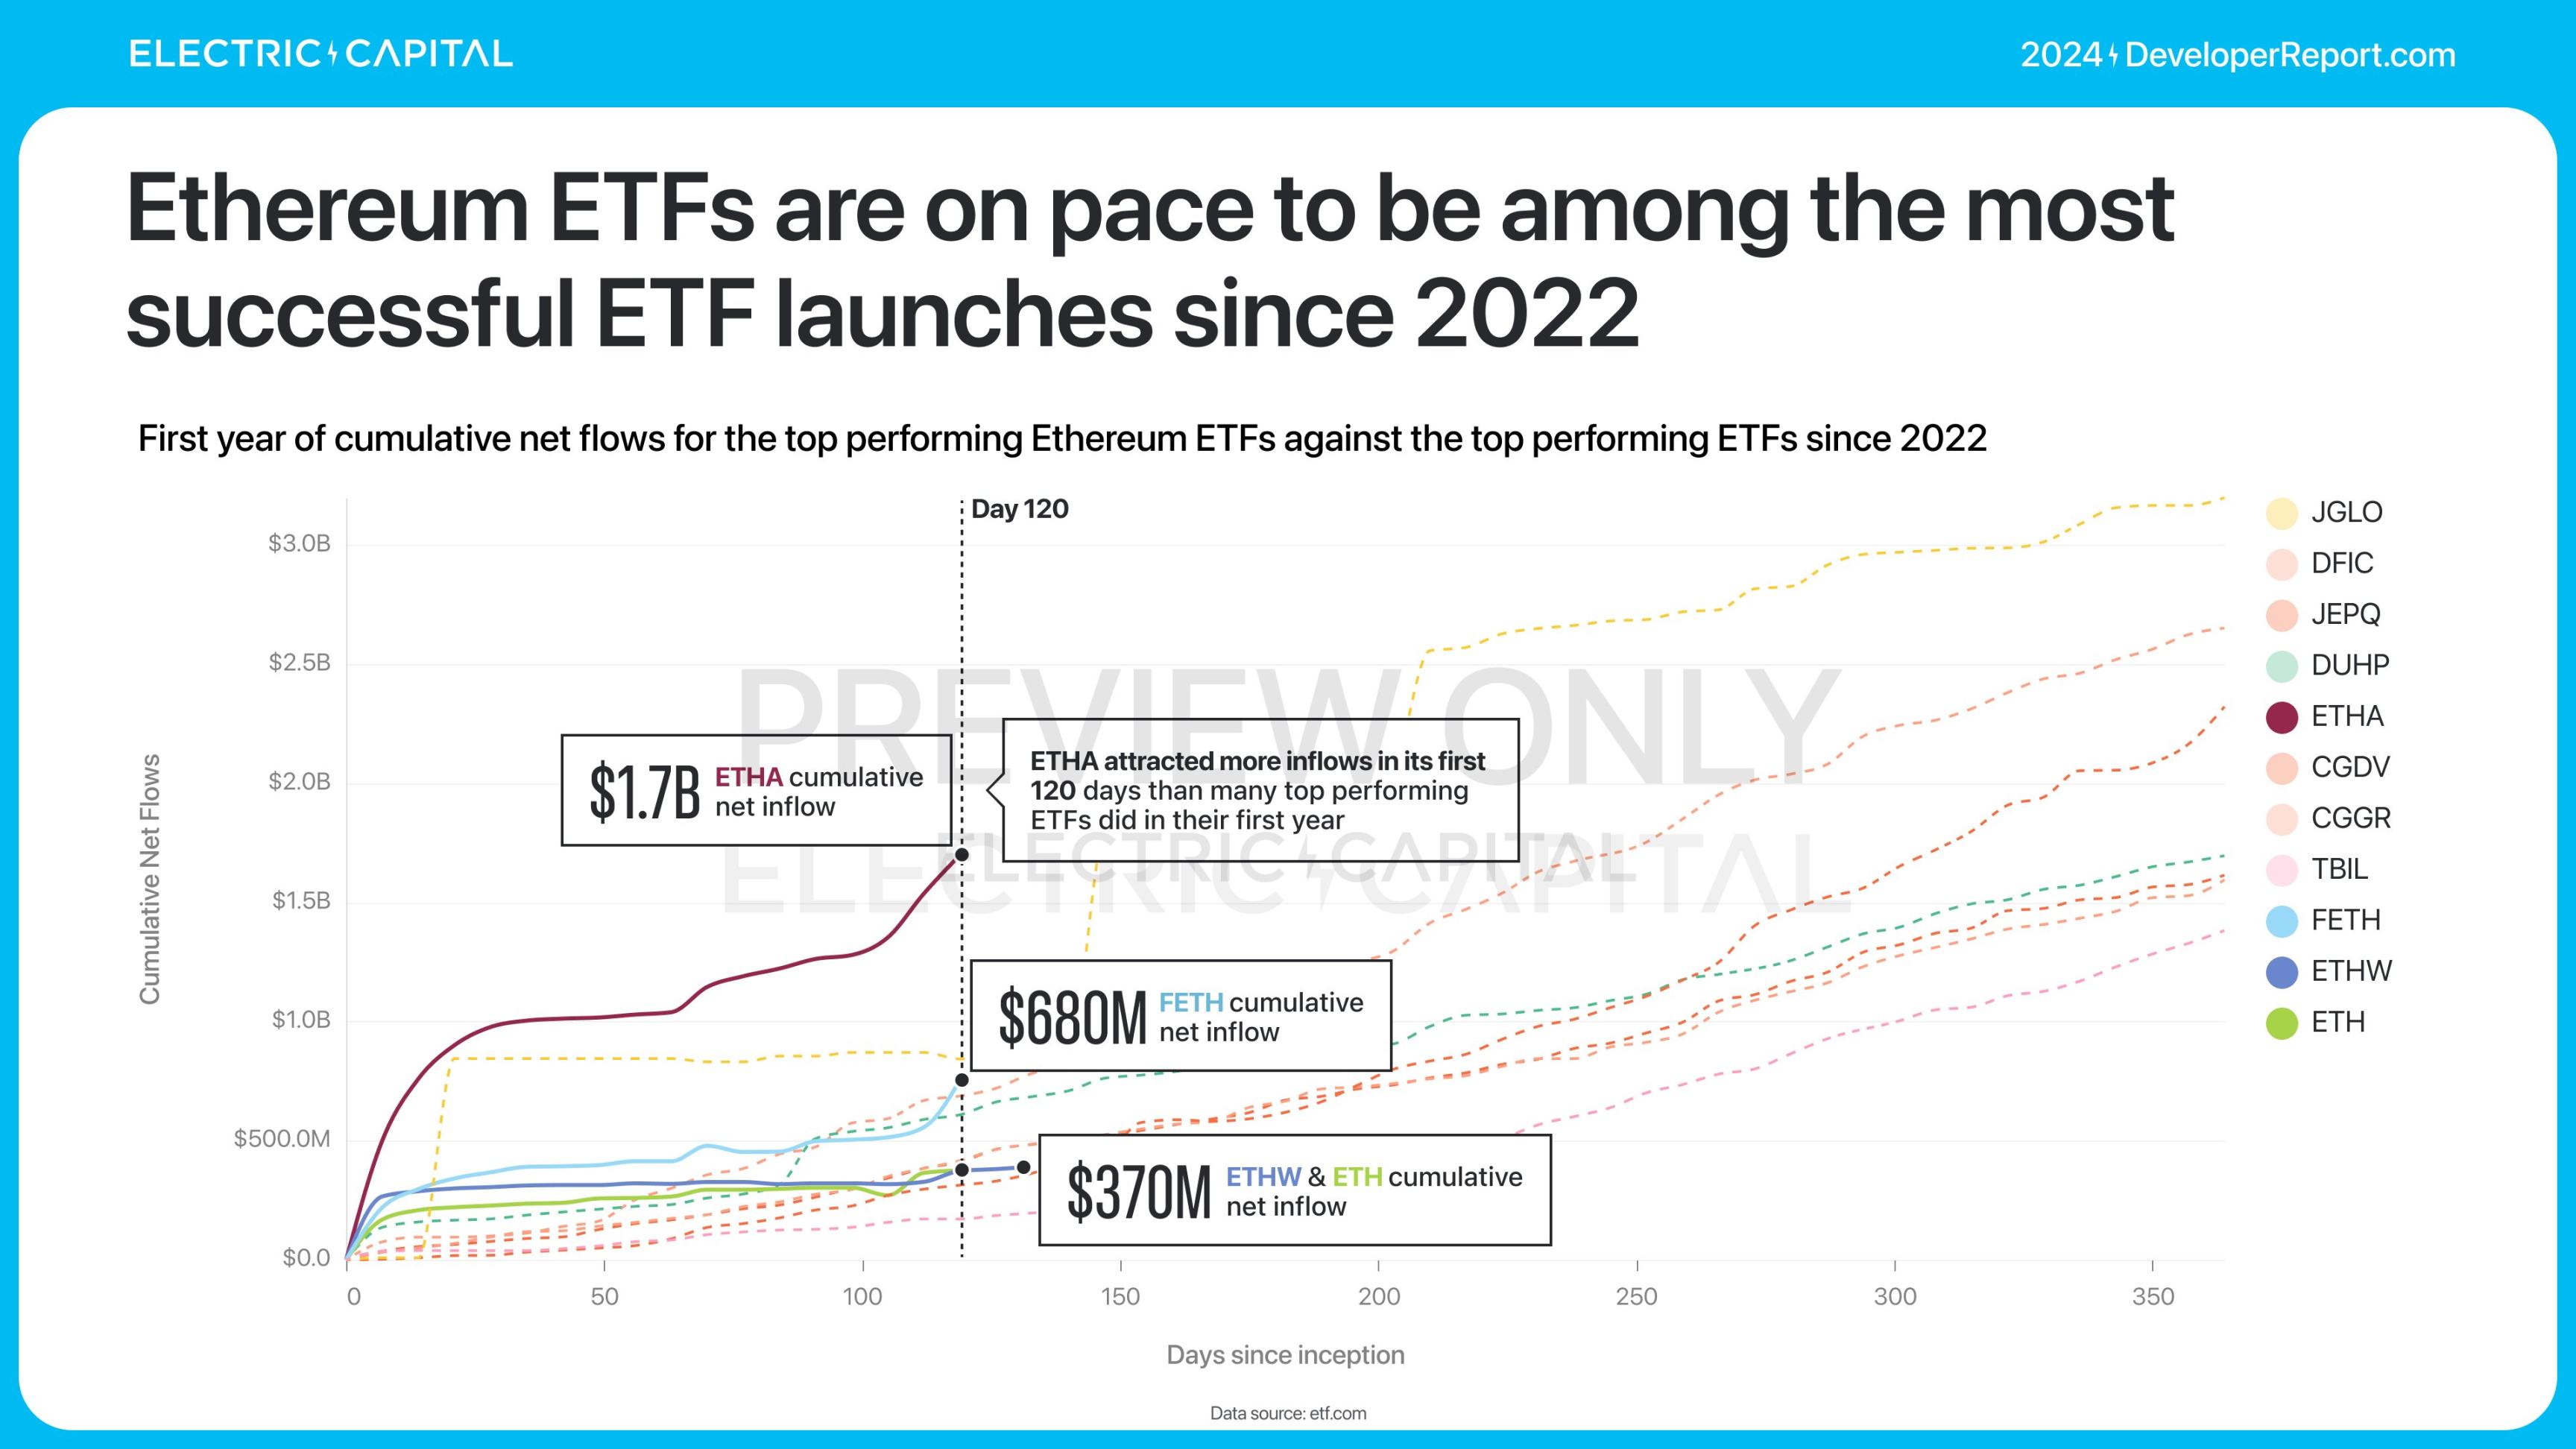
The Ethereum ETF launched in July of this year. Currently, the assets under management (AUM) of the Ethereum ETF stand at $13 billion, attracting $3.5 billion in net inflows. This performance is comparable to the most successful ETF launch since 2022 (excluding Bitcoin ETFs) and is primarily driven by retail investors.
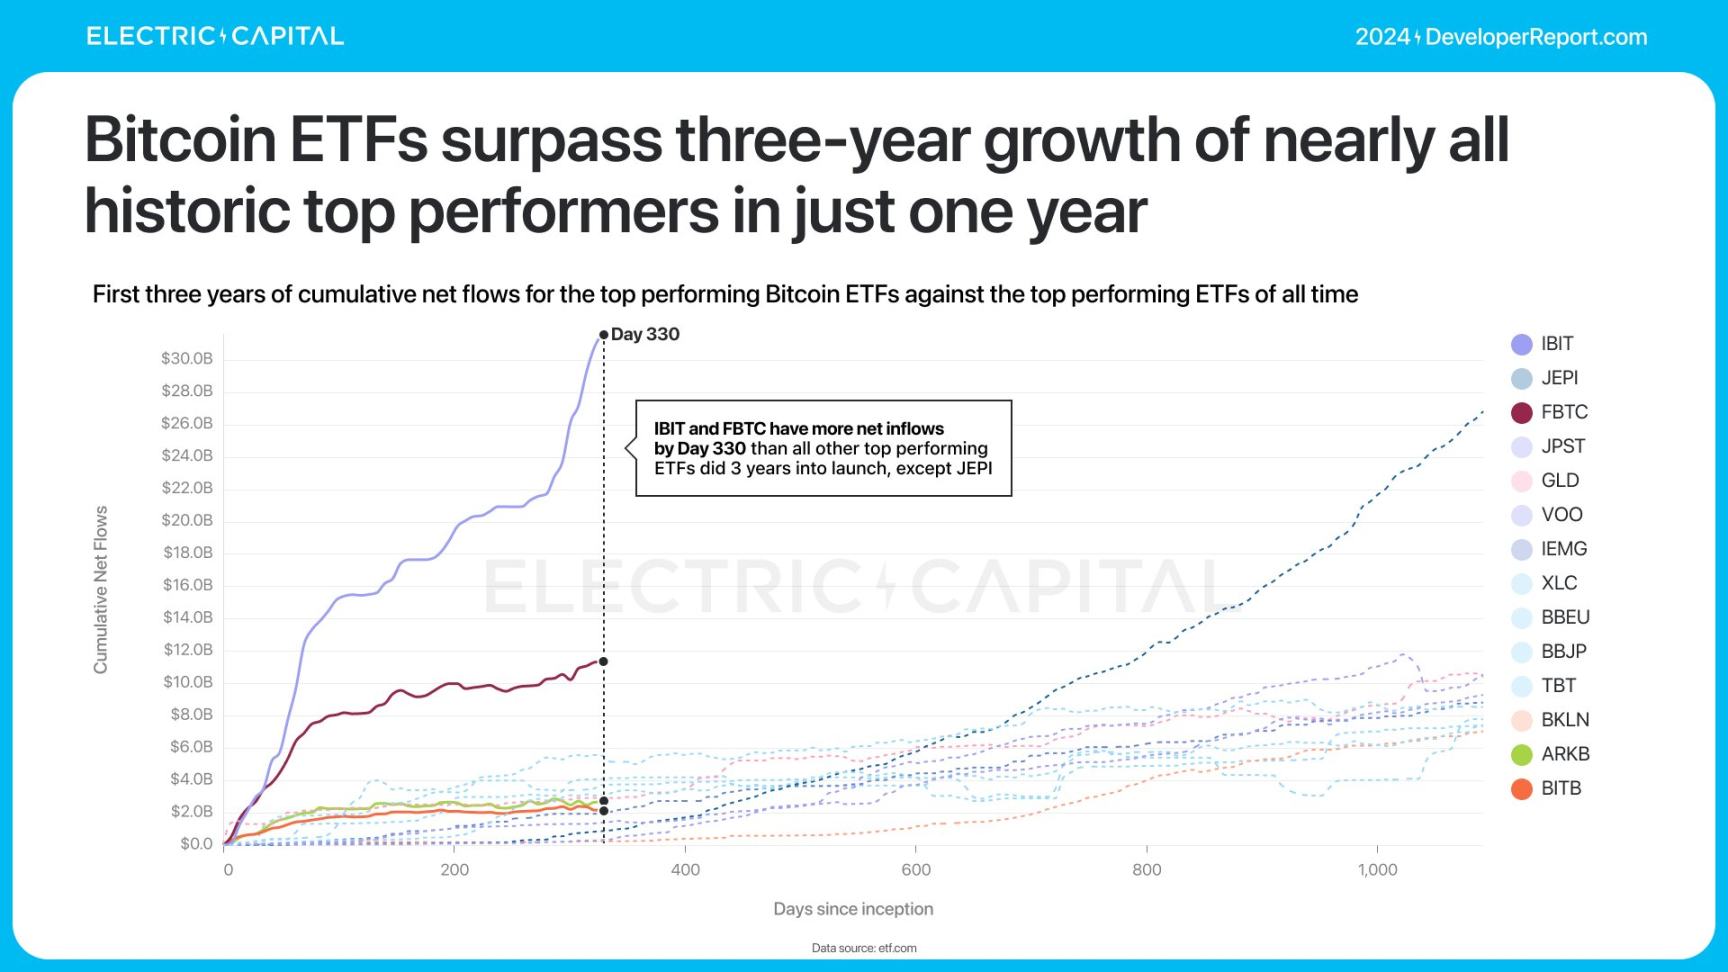
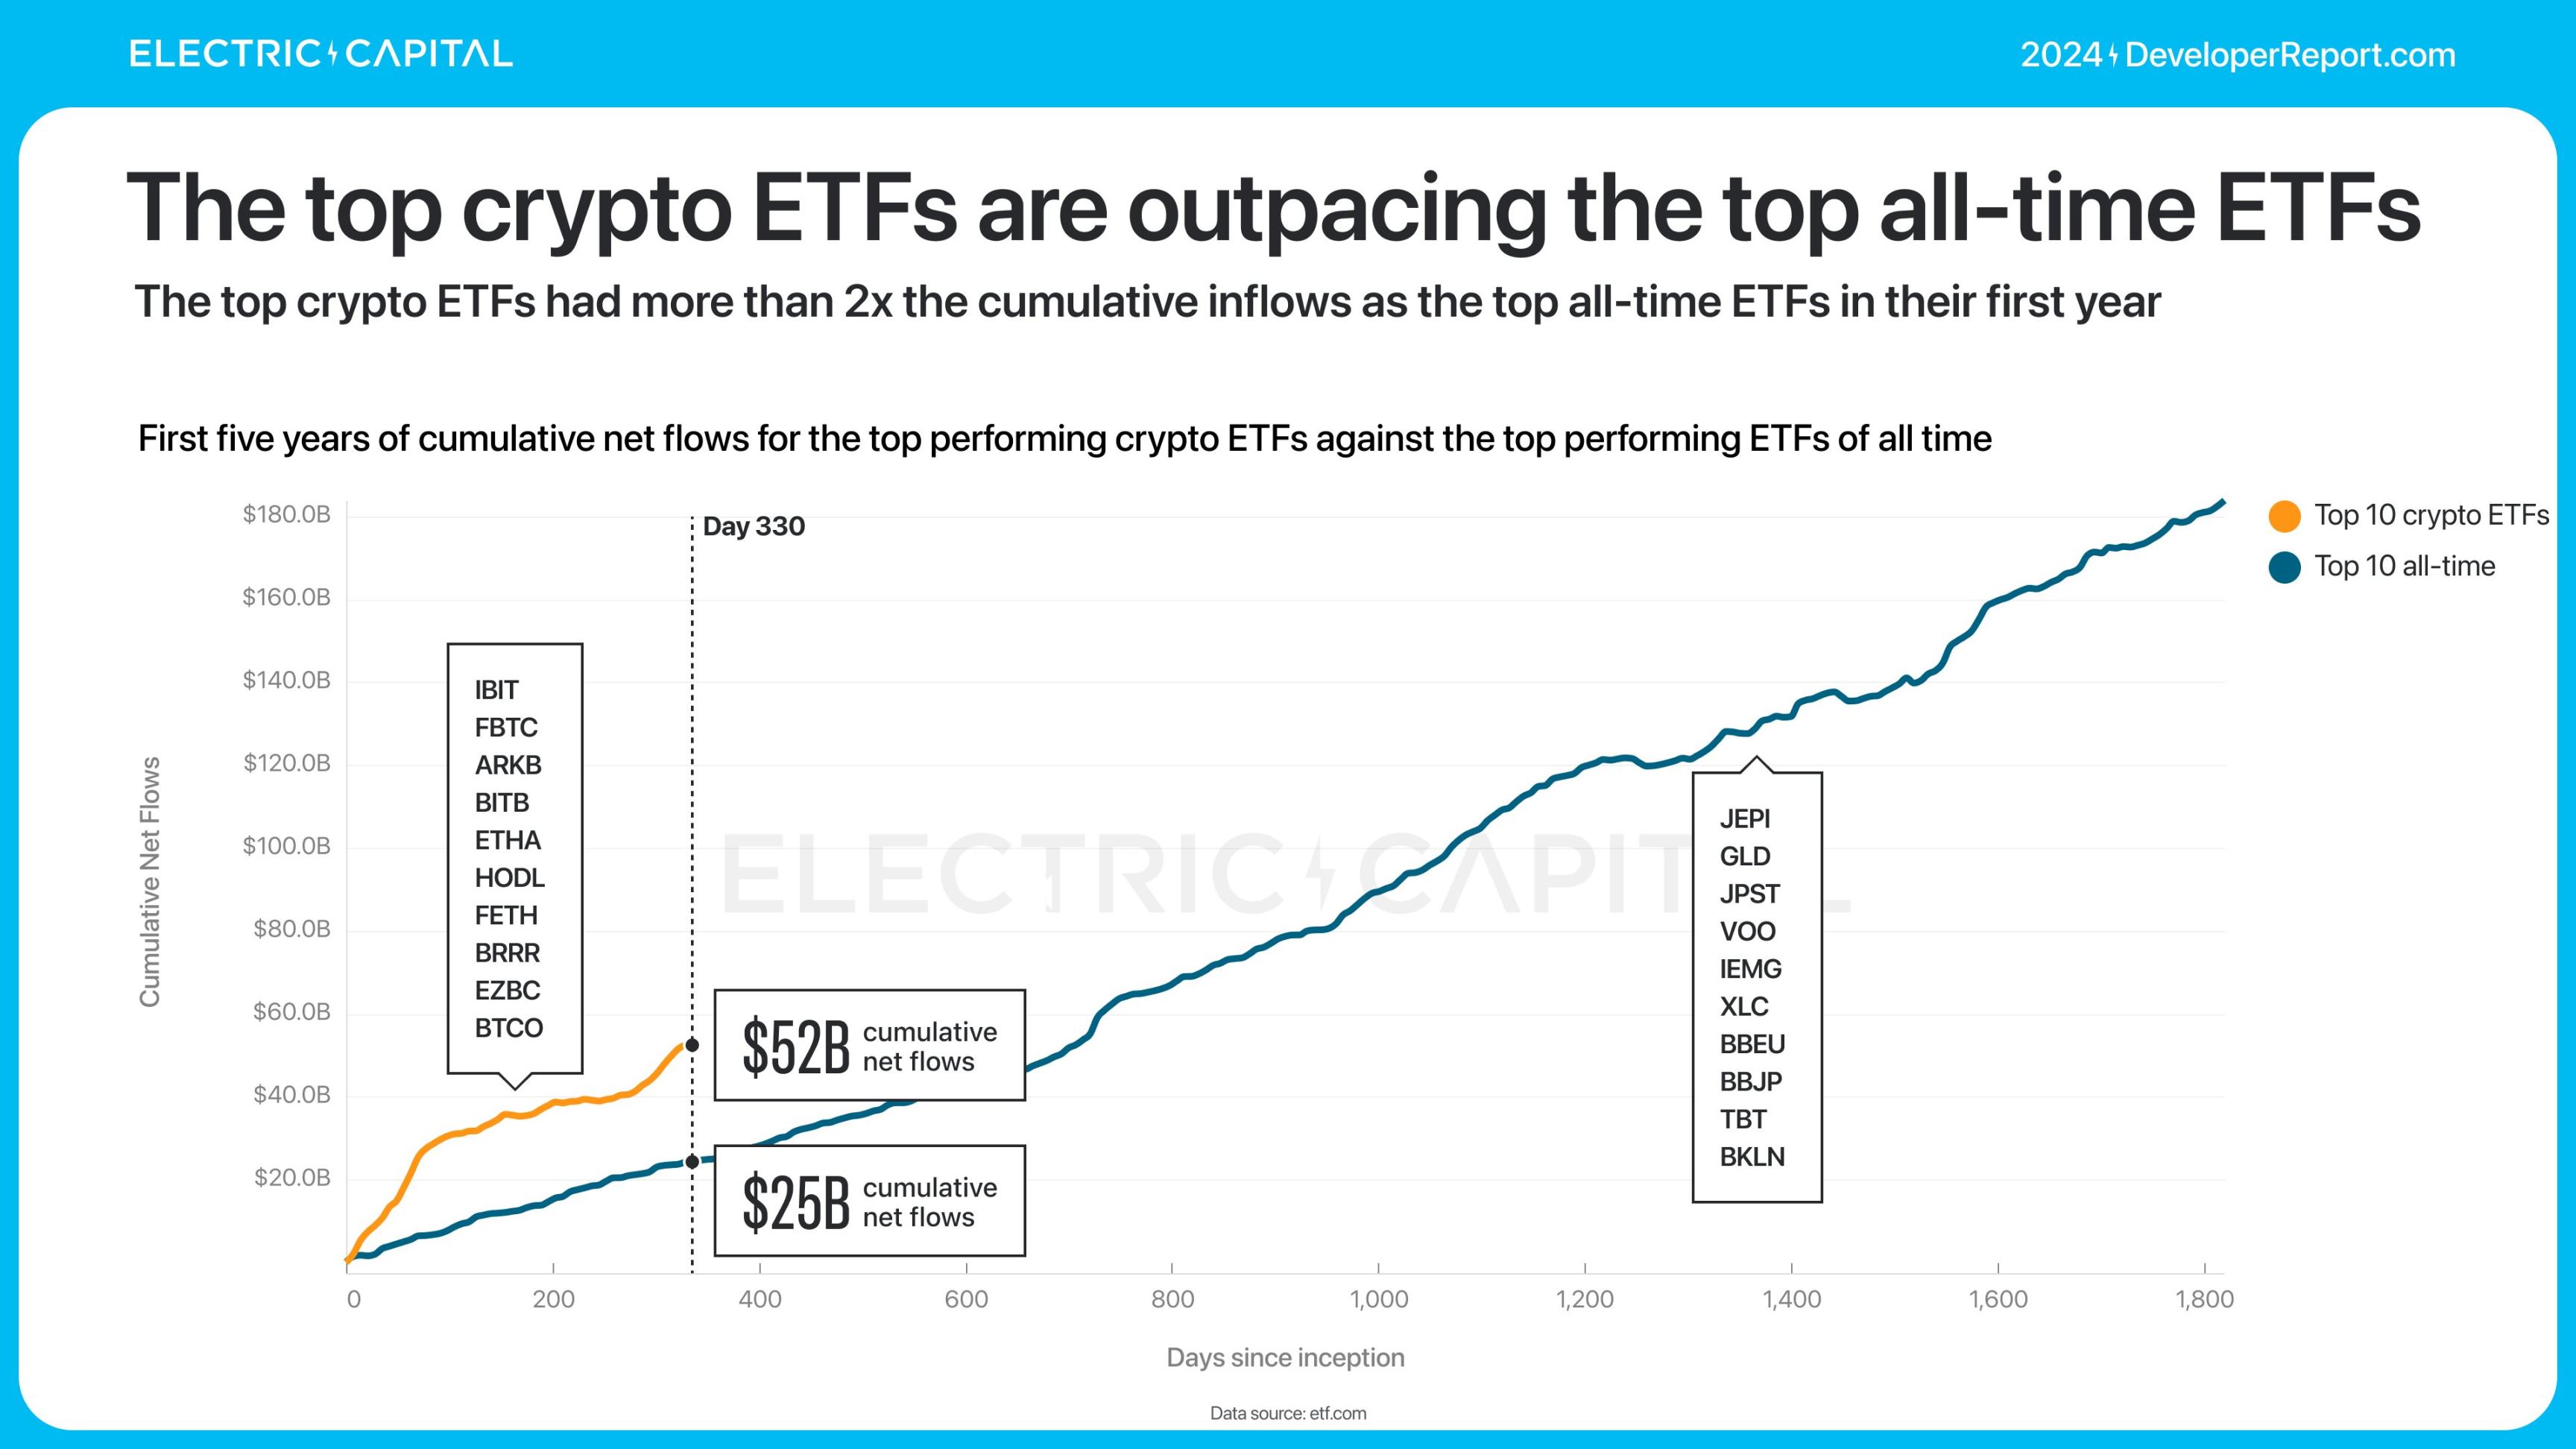
Bitcoin and Ethereum ETFs have set historical records. In their first year, the cumulative inflows have already surpassed those of the most successful ETFs in history by more than double.
免责声明:本文章仅代表作者个人观点,不代表本平台的立场和观点。本文章仅供信息分享,不构成对任何人的任何投资建议。用户与作者之间的任何争议,与本平台无关。如网页中刊载的文章或图片涉及侵权,请提供相关的权利证明和身份证明发送邮件到support@aicoin.com,本平台相关工作人员将会进行核查。


