Charts
DataOn-chain
VIP
Market Cap
API
Rankings
CoinOSNew
CoinClaw🦞
Language
  • 简体中文
  • 繁体中文
  • English
Leader in global market data applications, committed to providing valuable information more efficiently.

Features

  • Real-time Data
  • Special Features
  • AI Grid

Services

  • News
  • Open Data(API)
  • Institutional Services

Downloads

  • Desktop
  • Android
  • iOS

Contact Us

  • Chat Room
  • Business Email
  • Official Email
  • Official Verification

Join Community

  • Telegram
  • Twitter
  • Discord

© Copyright 2013-2026. All rights reserved.

简体繁體English
|Legacy

Excessive leverage leads to 570,000 liquidations? 8 data charts to help you understand the market situation.

CN
PANews
Follow
1 year ago
AI summarizes in 5 seconds.

Author: Ltrd

Compiled by: 1912212.eth, Foresight News

This crash is the largest liquidation since 2021. I want to analyze the entire situation from a microstructural perspective.

Excessive leverage led to 570,000 liquidations? 8 data charts to help you understand the market situation

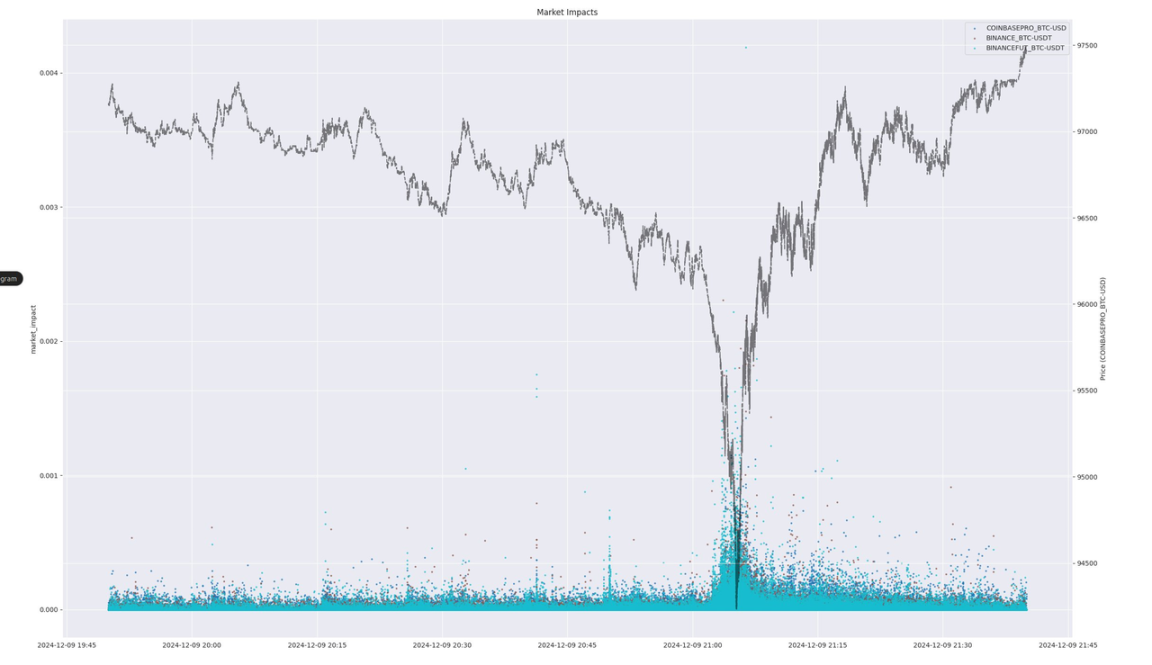
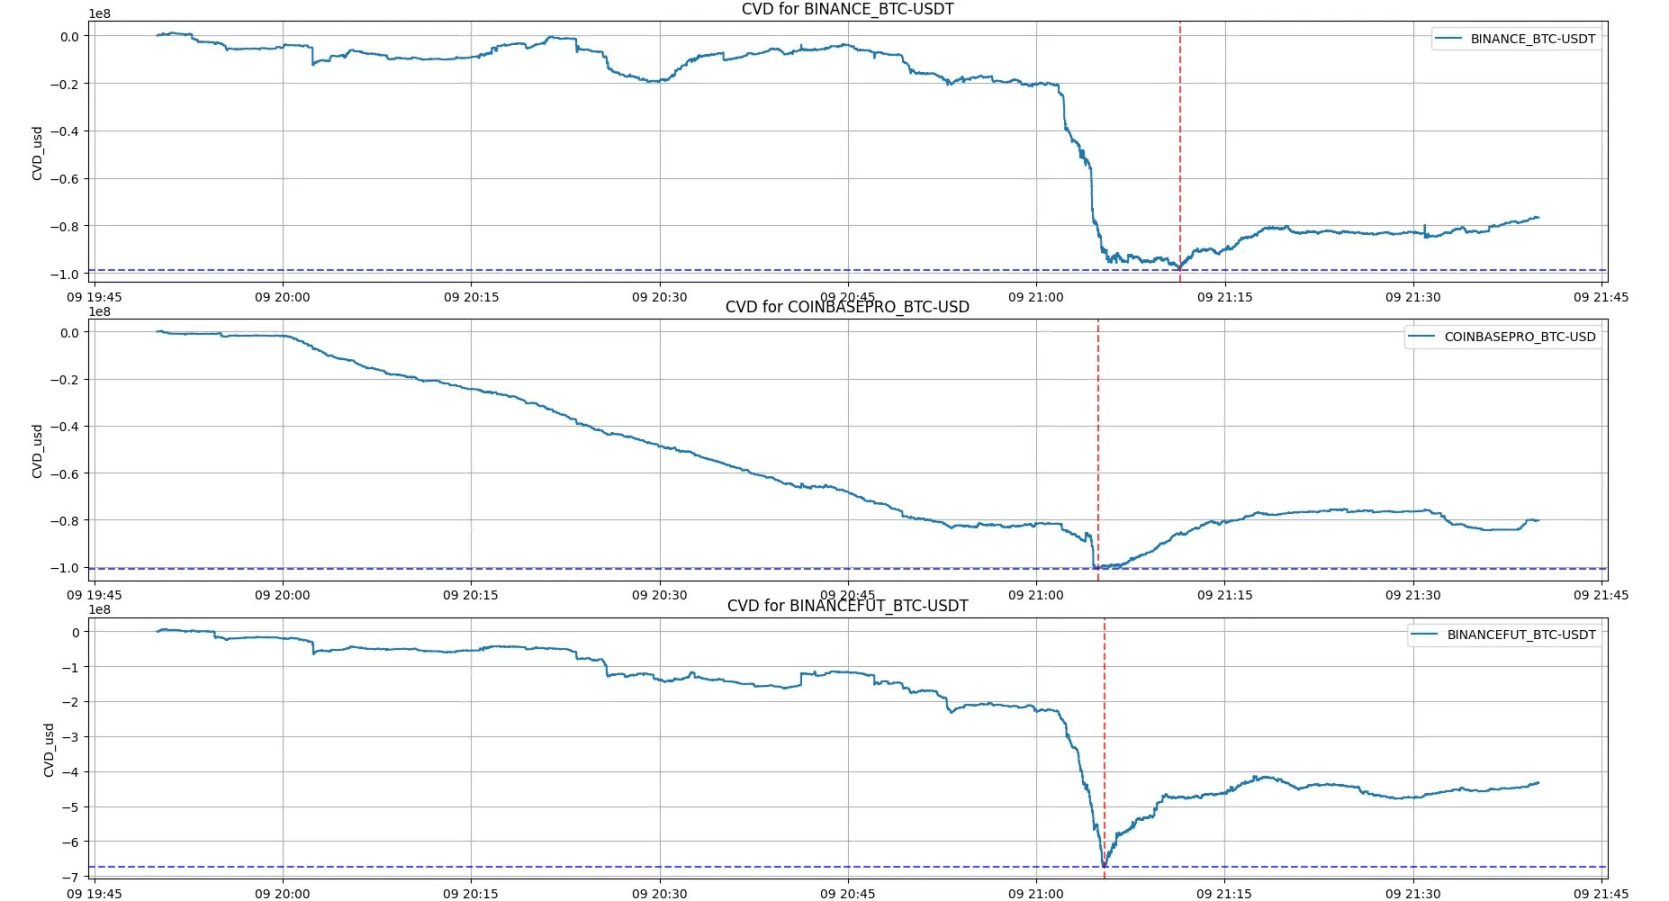
First, we need to identify where the selling pressure is the greatest. We found that traders on Coinbase began to sell heavily nearly an hour before this massive crash occurred.

Excessive leverage led to 570,000 liquidations? 8 data charts to help you understand the market situation

Of course, the largest drop was triggered by a chain of liquidations, but this sustained selling pressure played an important role in pushing prices into the area where leverage was forcibly liquidated. So how do we determine if the market is overheated? It's simple—by looking at the funding rates and the increase in open interest. These two factors are the driving forces in the current market, indicating that people are using excessive leverage.

After the crash, ETH saw strong buying interest. The relative strength in recent days is also quite evident—could someone be buying?

Excessive leverage led to 570,000 liquidations? 8 data charts to help you understand the market situation

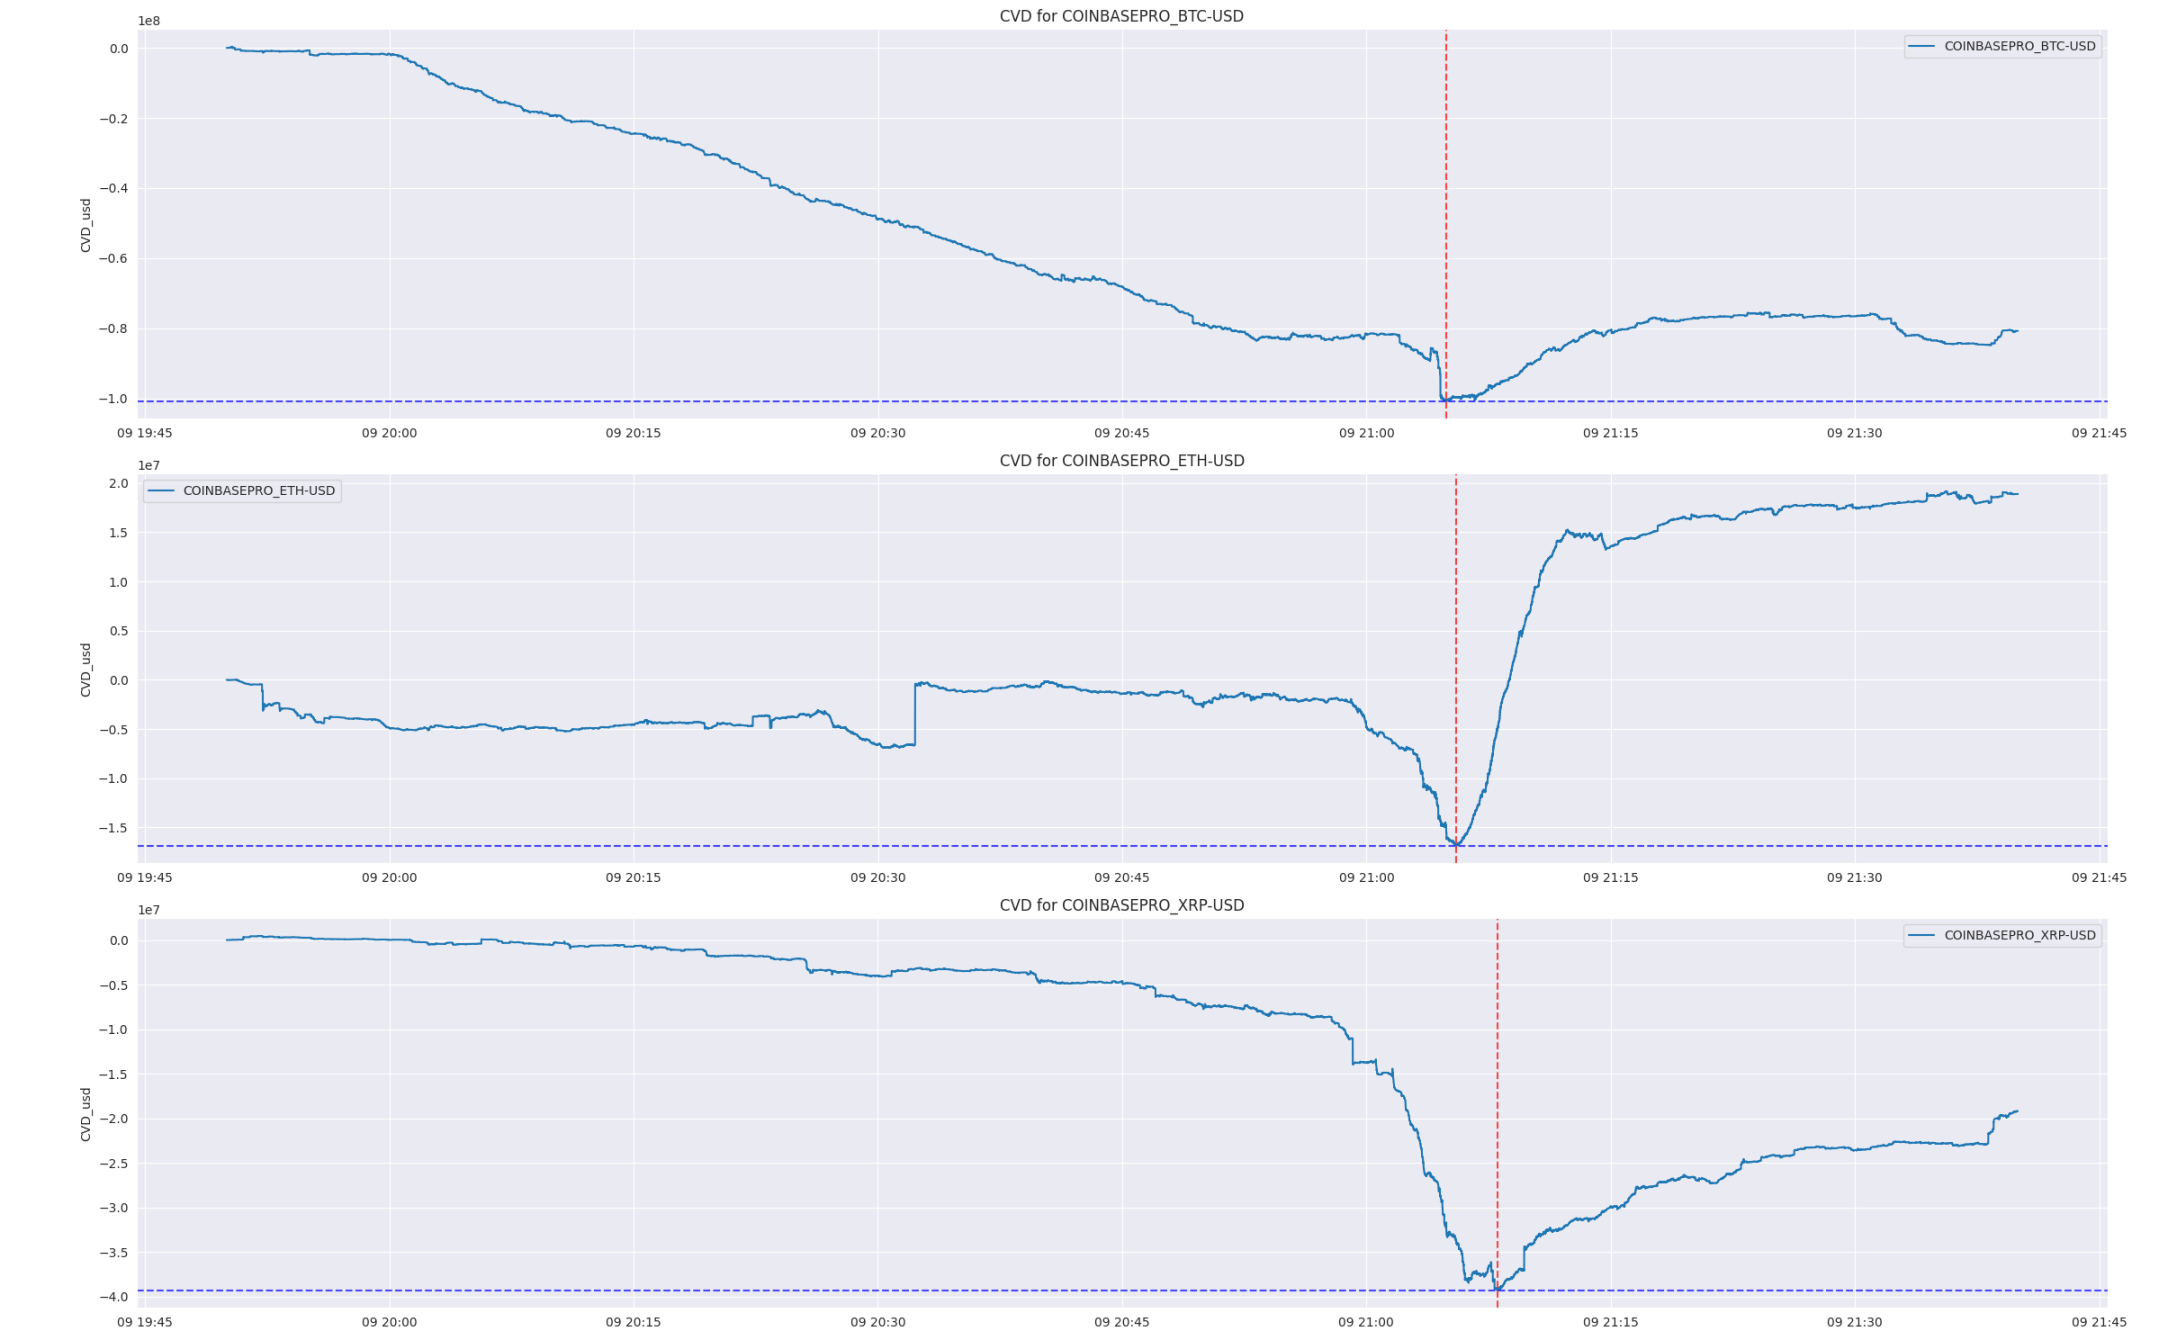
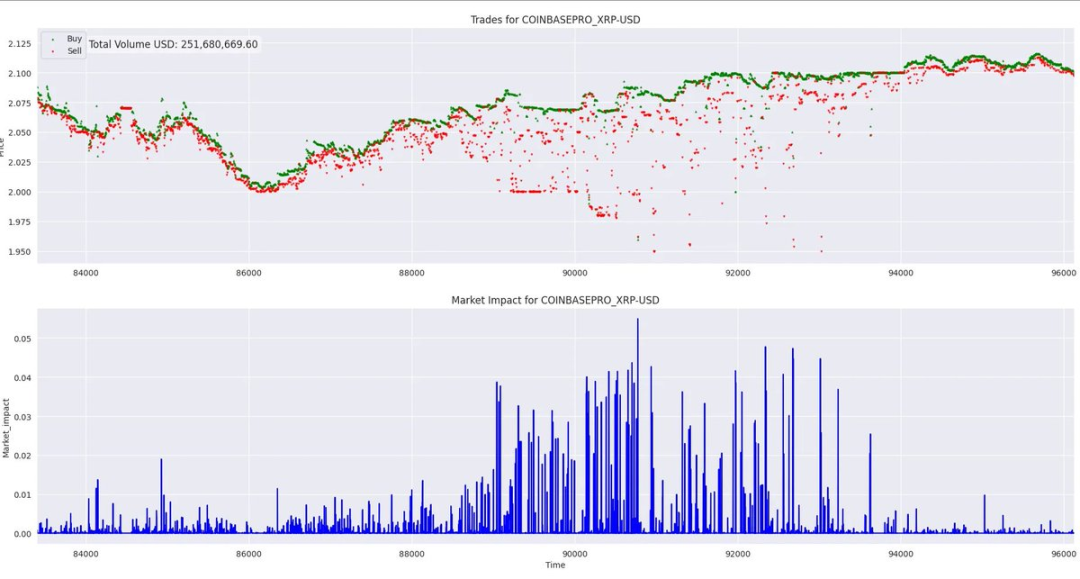
I personally enjoy analyzing market impact. If I could only focus on one feature in the market, it would definitely be market impact. Here, you will see some shocking things—XRP's market impact on Coinbase is quite significant.

Excessive leverage led to 570,000 liquidations? 8 data charts to help you understand the market situation

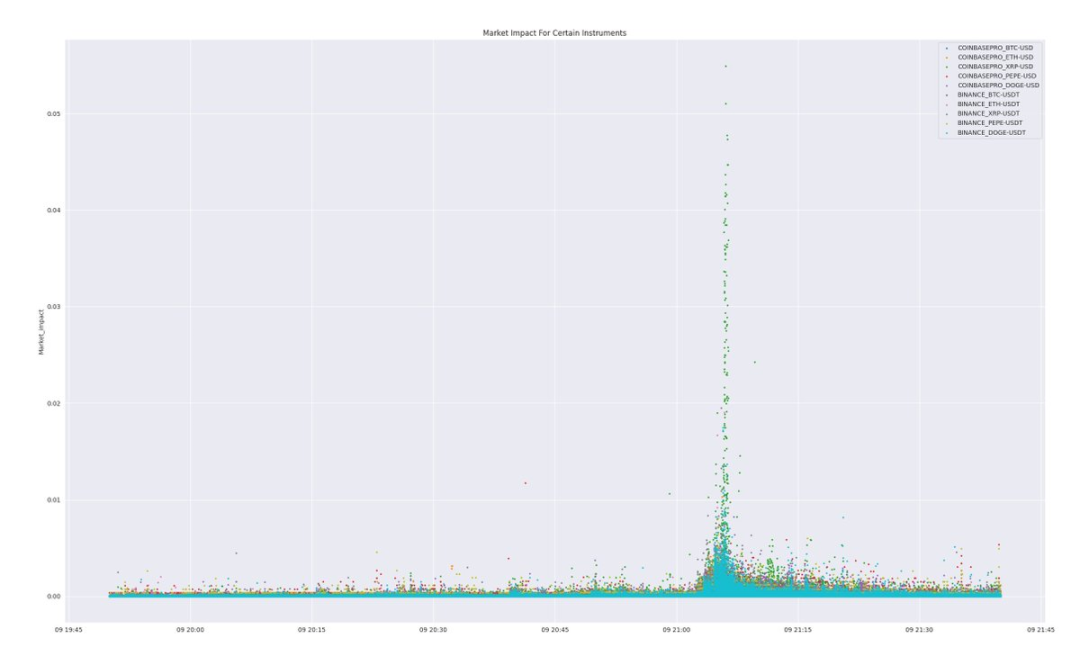
In a relatively mature large market, we witnessed a series of large sell orders, causing the market to drop over 5%. We are still unclear about what exactly happened, but this is clearly unusual.

Excessive leverage led to 570,000 liquidations? 8 data charts to help you understand the market situation

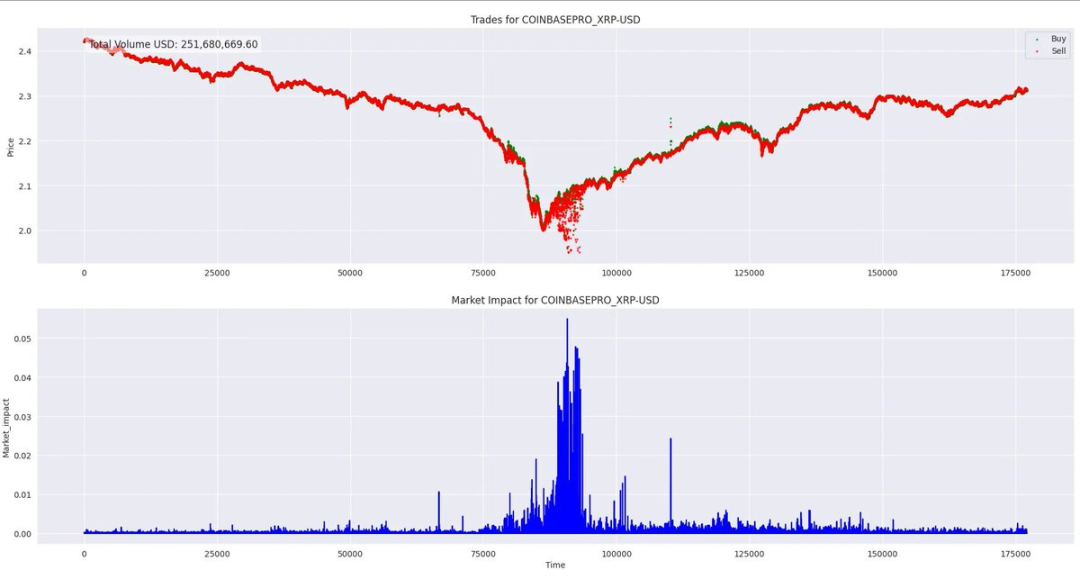
You can see that these sell orders are not normal. In the coming days, this situation may be worth monitoring. Perhaps a large player was forced to sell.

Excessive leverage led to 570,000 liquidations? 8 data charts to help you understand the market situation

When similar situations occur, it is usually a chain reaction of forced liquidation sell orders. Market makers absorb this selling pressure and hedge, causing signals to spread across major exchanges. For perpetual contract exchanges, this means stop-losses and liquidations are triggered, and the final impact becomes more pronounced, especially when this happens within minutes.

Coins like XRP, even with a market cap comparable to the largest companies in the U.S., can surge by hundreds of percentage points. Relative to its market cap, XRP's liquidity in the market remains poor.

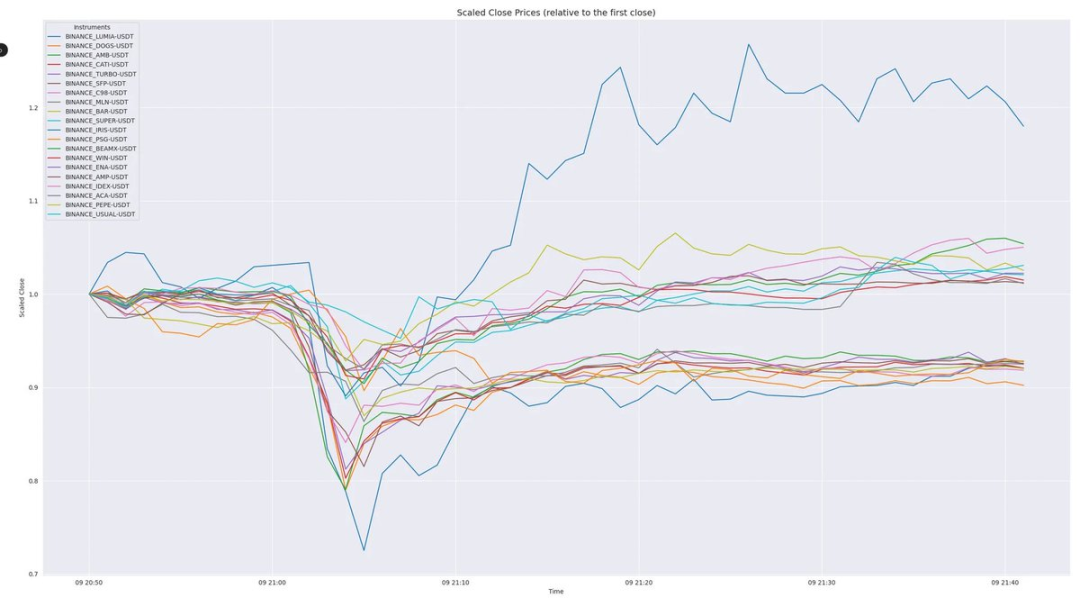
In a hot market, the next common phenomenon is a rapid price reversal from the lowest point. At this time, there will be a large number of liquidations, liquidity constraints, and many profitable players looking to buy the dip.

Excessive leverage led to 570,000 liquidations? 8 data charts to help you understand the market situation

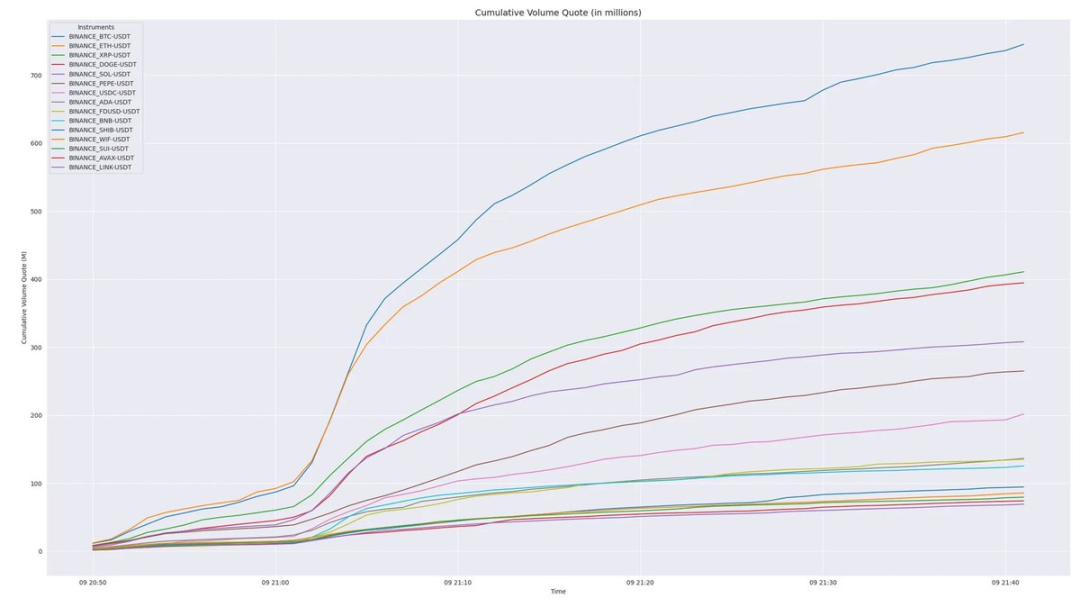
The volume chart shows the cumulative trading volume during the crash. Surprisingly, both USDC and FDUSD had significant trading volumes, but ADA's trading volume was particularly large.

Excessive leverage led to 570,000 liquidations? 8 data charts to help you understand the market situation

免责声明:本文章仅代表作者个人观点,不代表本平台的立场和观点。本文章仅供信息分享,不构成对任何人的任何投资建议。用户与作者之间的任何争议,与本平台无关。如网页中刊载的文章或图片涉及侵权,请提供相关的权利证明和身份证明发送邮件到support@aicoin.com,本平台相关工作人员将会进行核查。

|
|
APP
Windows
Mac
Share To

X

Telegram

Facebook

Reddit

CopyLink

|
|
APP
Windows
Mac
Share To

X

Telegram

Facebook

Reddit

CopyLink

Selected Articles by PANews

13 minutes ago
CertiK: Wasabi Protocol has been attacked, currently losing about 2.9 million dollars.
16 minutes ago
Upbit will delist the DRIFT token on June 1.
16 minutes ago
A certain giant whale started selling after receiving over 556,800 HYPE and increased its short position to 32 million dollars.
View More

Table of Contents

|
|
APP
Windows
Mac
Share To

X

Telegram

Facebook

Reddit

CopyLink

Related Articles

avatar
avatarTechub News
6 minutes ago
What direction will South Korea's cryptocurrency tax policy take?
avatar
avatarForesight News
9 minutes ago
Anthropic is reaching out to investors to raise funds with a valuation of 900 billion dollars, surpassing OpenAI.
avatar
avatarPANews
13 minutes ago
CertiK: Wasabi Protocol has been attacked, currently losing about 2.9 million dollars.
avatar
avatar链捕手
13 minutes ago
Dialogue "Sister Wood" Cathie Wood: The next bull market is about to arrive.
avatar
avatarPANews
16 minutes ago
Upbit will delist the DRIFT token on June 1.
APP
Windows
Mac

X

Telegram

Facebook

Reddit

CopyLink