This week will see several important global interest rate decisions, attracting significant market attention.
Author: Ostium
Translation: Deep Tide TechFlow

This article represents personal opinions only and is intended for entertainment and informational reference, not investment advice. For investment advice, please consult a qualified professional.
In the 15th issue of Ostium Research's market outlook, we analyzed the market dynamics for the upcoming week with @cointradernik, focusing on the price trends, market positions, and potential event risks for Bitcoin, Ethereum, gold, copper, and the US dollar index.
Important Economic Schedule This Week
This week will see several important global interest rate decisions, attracting significant market attention:
Tuesday: Reserve Bank of Australia (RBA) interest rate decision (expected 4.35%, previous 4.35%)
Wednesday: US Consumer Price Index (CPI) year-on-year (November) (expected 2.7%, previous 2.6%)
Wednesday: Bank of Canada (BOC) interest rate decision (expected 3.25%, previous 3.75%)
Thursday: Swiss National Bank (SNB) interest rate decision (expected 0.75%, previous 1%)
Thursday: European Central Bank (ECB) interest rate decision (expected 3%, previous 3.25%)
Thursday: US Producer Price Index (PPI) year-on-year (November) (expected 2.5%, previous 2.4%)
Bitcoin
Current Price: $99,460
Weekly Analysis
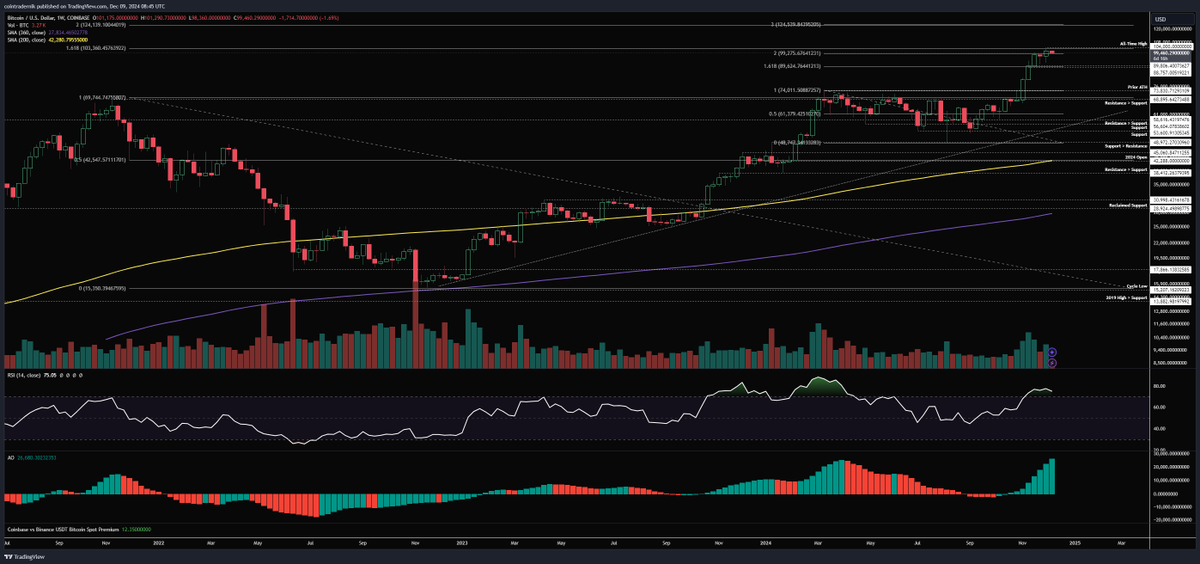
Last week, Bitcoin historically closed above $100,000 for the first time, surpassing the previous two weekly highs above $99,000. Although trading volume has slightly decreased, price momentum remains strong, and the weekly structure remains bullish. Bitcoin has currently stabilized above a key resistance range, and if the price continues to gain market acceptance, it is expected to rise further.
However, it is important to note that Bitcoin's price trend this year is highly correlated with an "11-week lagged M2SL/DXY liquidity correlation." This correlation has almost precisely predicted Bitcoin's price fluctuations in 2024. If this correlation continues, Bitcoin may begin a multi-week price correction this week, with a bottom potentially forming by late January to early February next year.
However, it is also possible that this correlation could be broken. If Bitcoin's weekly structure and momentum dominate, the price may enter a new round of increases, targeting ~$125,000, which is the next major resistance area.
Key Observations:
If the weekly closing price is above last week's high of $104,000, it may indicate that the correlation has been broken, and Bitcoin is expected to rise to $125,000 by the end of the year.
If the price fails to hold above $104,000 this week and instead falls below $99,000, it may indicate that the correlation continues to play a role, and Bitcoin may further decline before January, potentially dropping below $89,000.
In summary, this is a very critical week for Bitcoin's price movement, warranting close attention.
Daily Analysis:
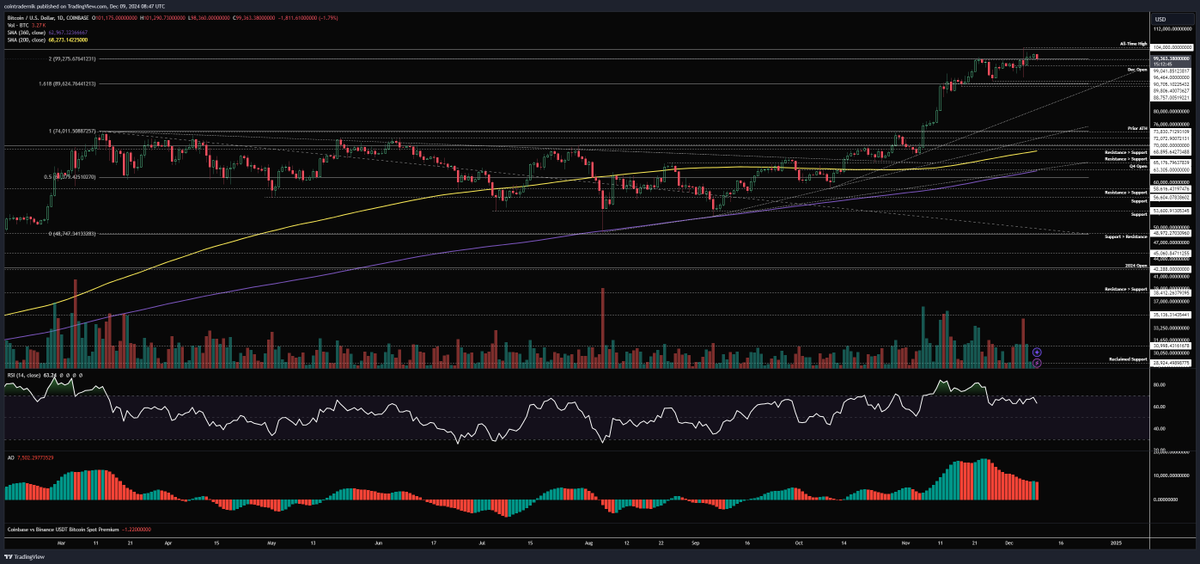
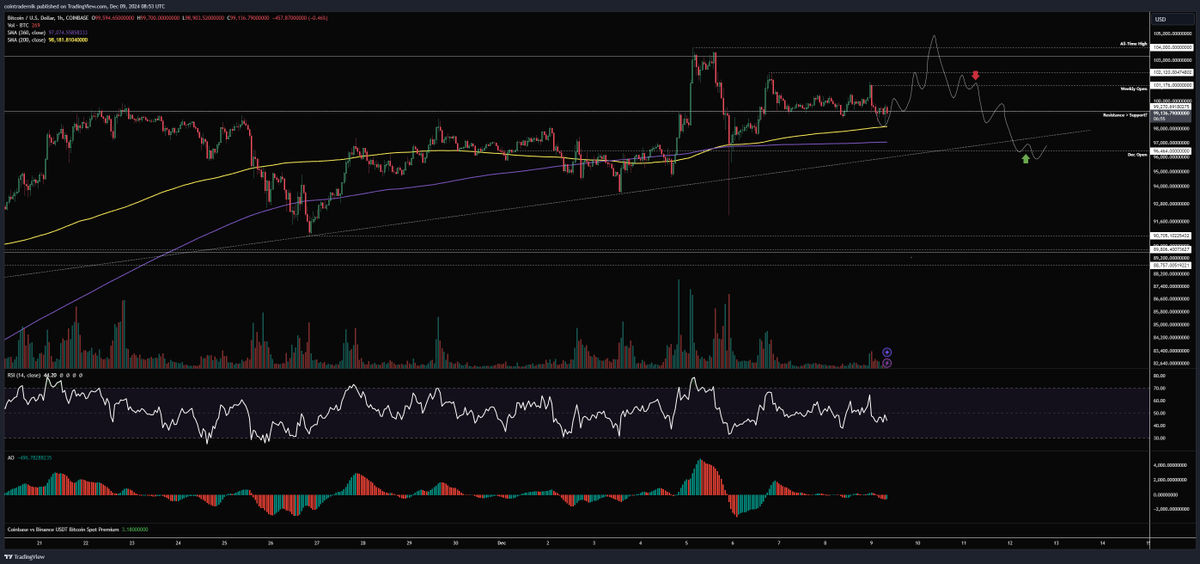
On the daily chart, Bitcoin's momentum has begun to weaken. Since August, a series of higher lows formed by the RSI (Relative Strength Index) may see a pullback. If the RSI falls below 50 and stabilizes below this level this week, it may signal that Bitcoin is entering a correction phase. However, current momentum has not completely dissipated, and the daily structure remains bullish. Any pullback early this week is expected to test last week's high again, and the market's reaction to this will determine the next movement. If the daily closing price breaks above $104,000 and turns it into support, Bitcoin is expected to rise to $125,000; but if the price fails to hold this level and falls below $99,000, or even below the December opening price of $96,500, it may indicate that market momentum has exhausted.
Bullish Strategy: If the price continues to slowly pull back early this week, and the weekly opening price and weekly high (formed early this week) are not touched, consider building a long position near the December opening price. Once the price stabilizes above $99,300 and turns it into support, further accumulation can be made, targeting a new high of $104,000 later this week. This movement will more likely indicate that Bitcoin's correlation has been broken.

Bearish Strategy: If the price breaks above the weekend high to $104,000 but is then rejected and falls below this week's opening price of $101,200, it may trigger a long squeeze, leading to further price declines. Later this week, it may test trendline support, while also indicating that the correlation is still ongoing and a larger-scale correction is beginning.
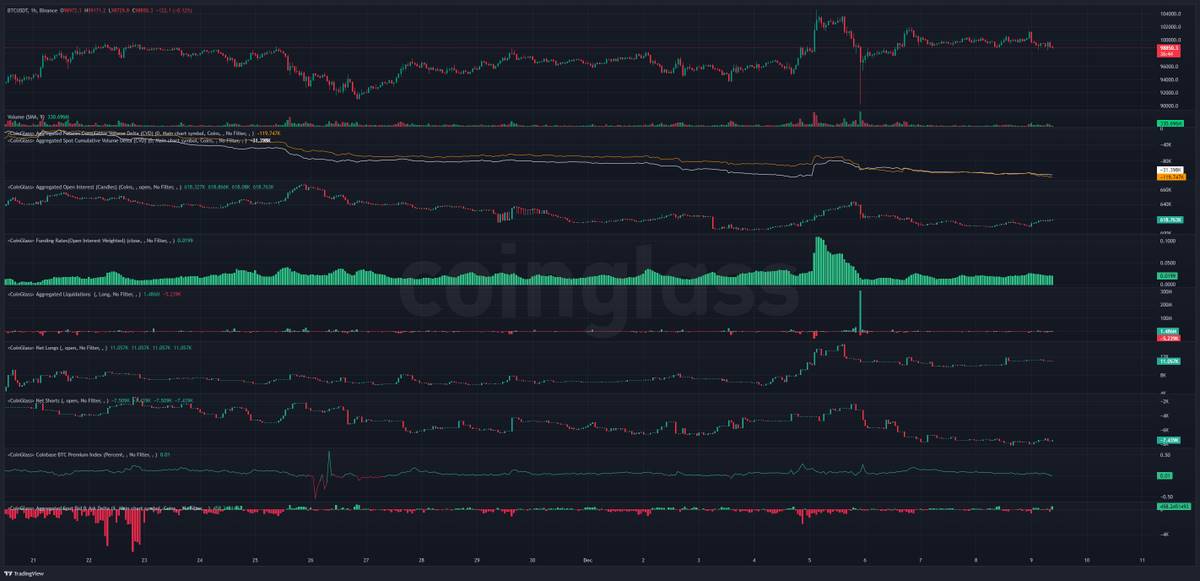
Current market positions show that last week's flash crash has cleared the over-leveraged derivatives market, providing stronger support for Bitcoin's price to break above $104,000. Changes in the three-month annualized basis and liquidation levels further validate this.
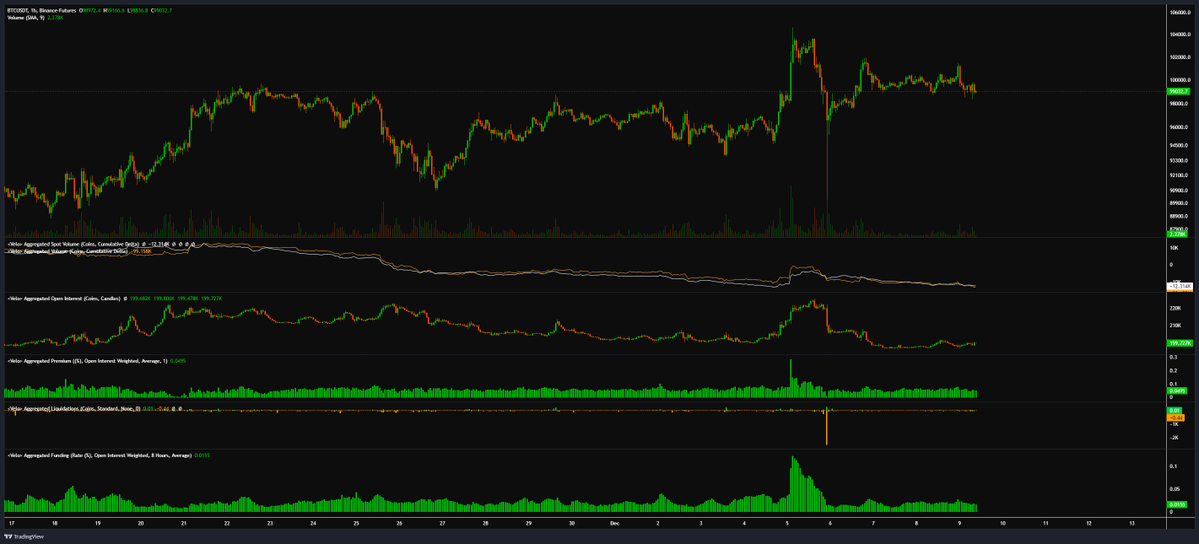
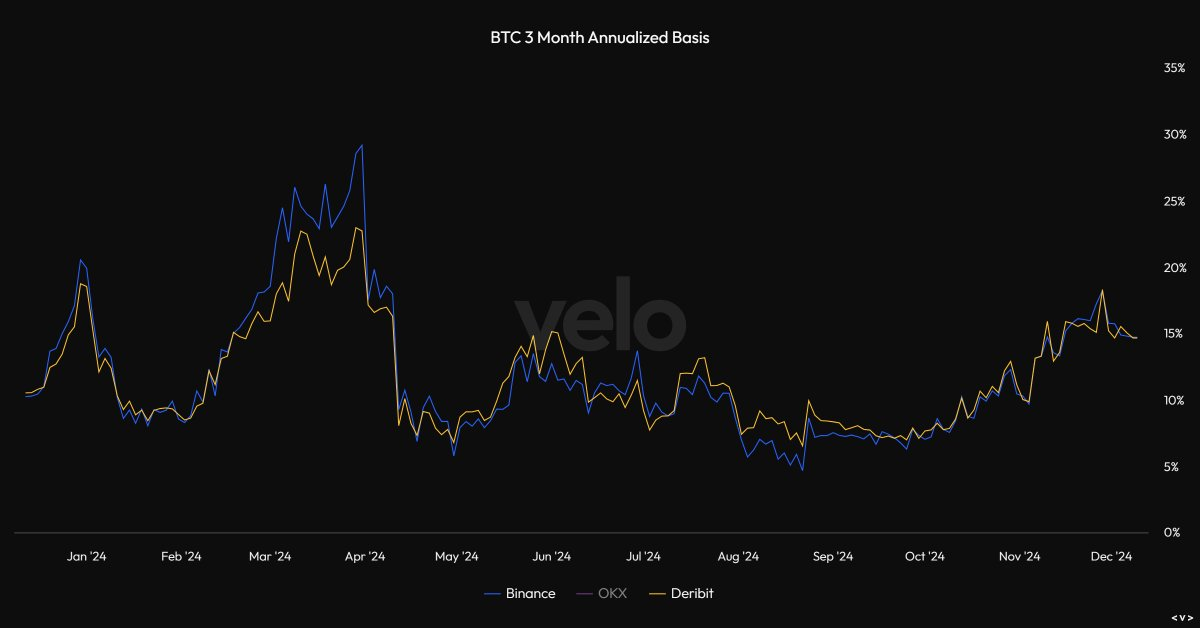
This can be further validated from the three-month annualized basis:
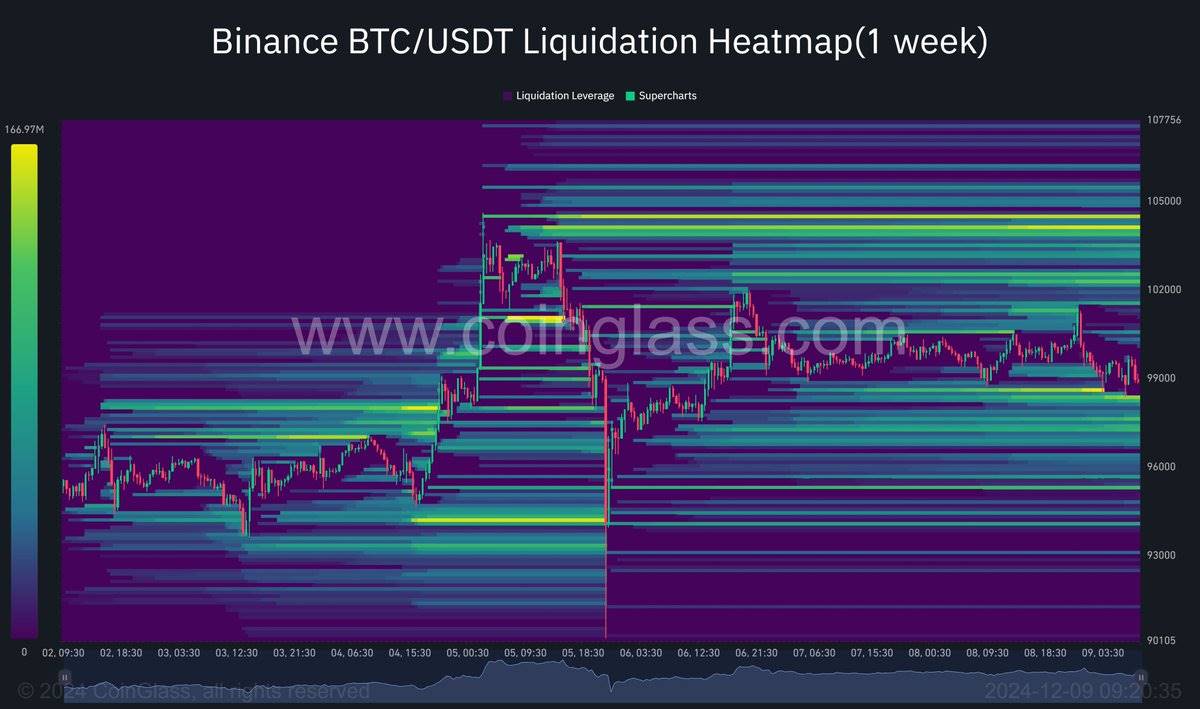
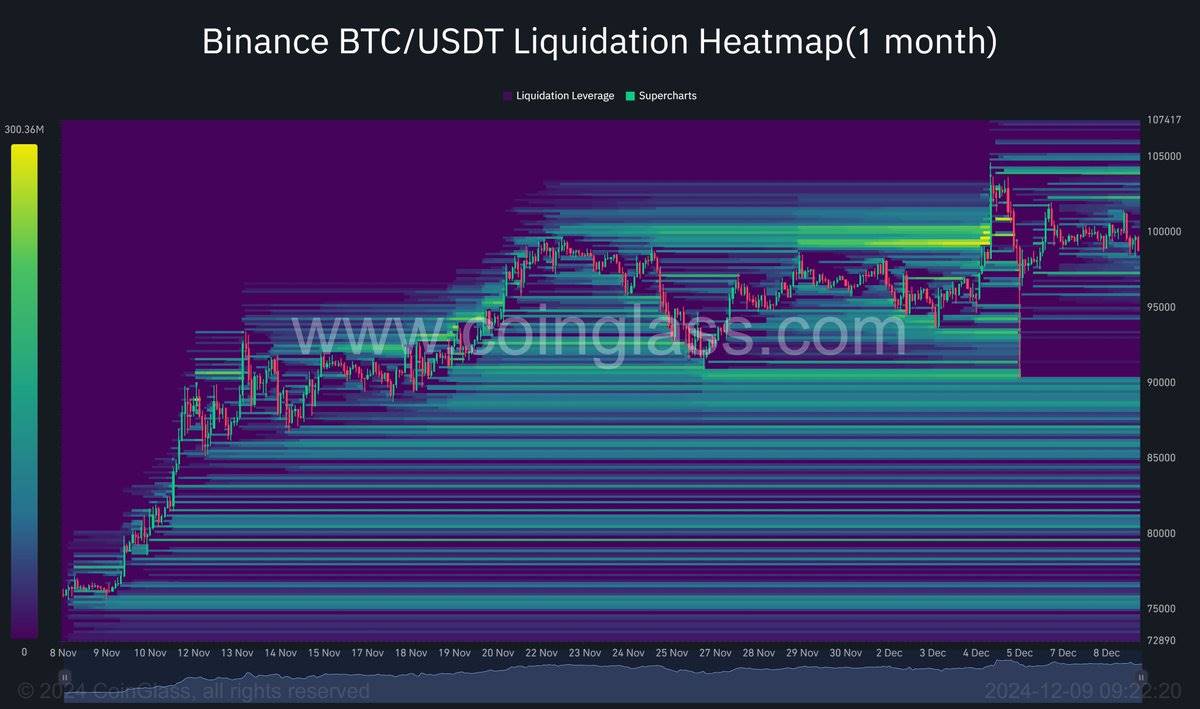
Additionally, the expected liquidation levels for 1 week and 1 month are shown below.
Ethereum
Current Price: $3863
Weekly Analysis
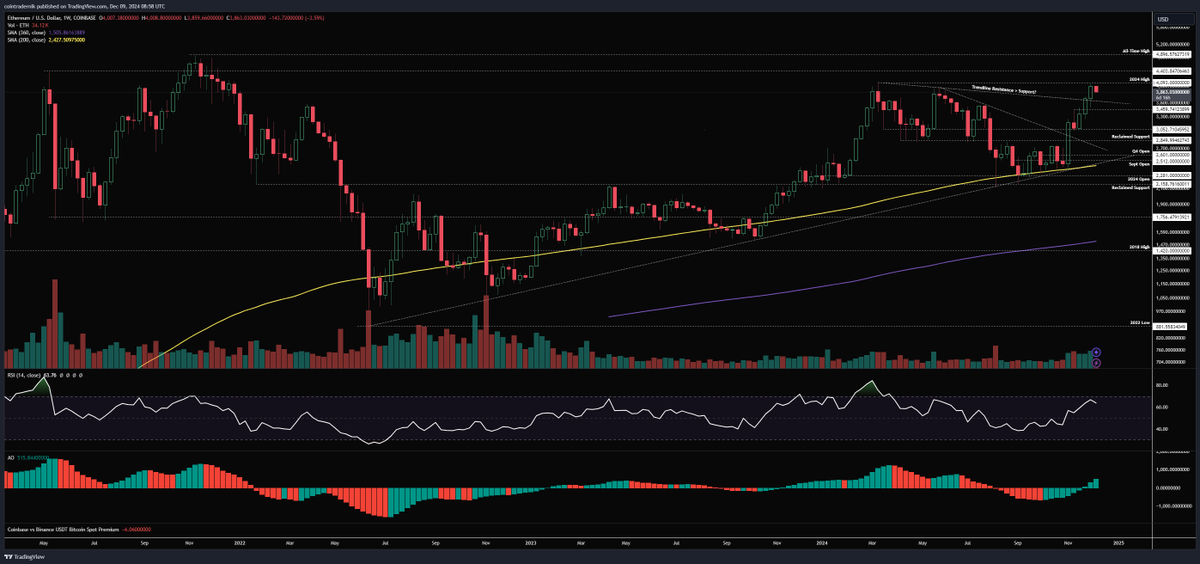
Ethereum's price firmly broke through the last trendline resistance last week and found support above it, subsequently rising to a new annual high of $4093, ultimately closing around $4000, accompanied by an increase in volume and momentum. If the price retests this trendline this week, it is expected to use it as support and push the price to test $4093 again. Once the weekly closing price breaks above this level, the price is expected to rise further to $4400, or even challenge the historical high of $4900. From the current structure and momentum, Ethereum maintains a strong bullish trend, and even if Bitcoin pulls back, I believe Ethereum will continue to strengthen before the end of the year. Only if the weekly closing price falls below $3450 will the bullish outlook need to be reassessed.
Daily Analysis

The daily chart shows that Ethereum's trendline support since mid-November remains solid. If the price continues to hold above this trendline this week, a low is expected to form early this week, followed by a daily closing price breaking above the 2024 high of $4093 and turning it into support, pushing the price further up into 2025. If the price falls below the trendline, it may retreat to the December opening price of $3700, turning it into new support before continuing to rise.
ETH/BTC Analysis
Weekly Analysis
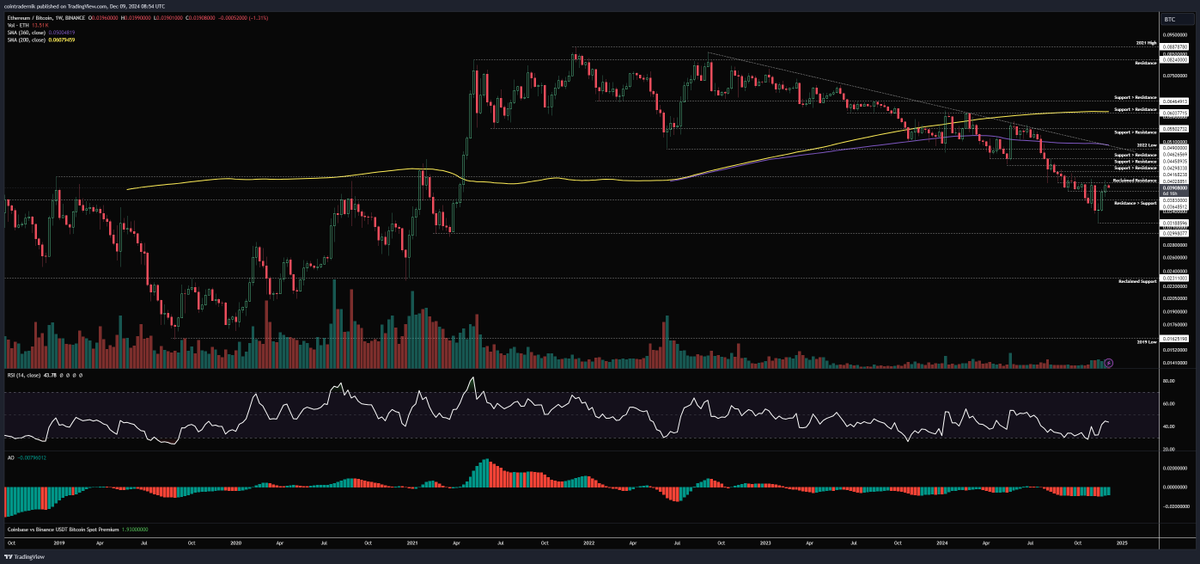
ETH/BTC continues the rebound momentum from the previous week on the weekly chart, with the price rising to the resistance level around 0.0403 and closing at 0.0396. This week, it is expected to break through 0.0403 and test 0.0417, which will be a decisive resistance. If the price breaks above and stabilizes above 0.0417, it may trigger a larger reversal, targeting the long-term trendline resistance and the 2022 low of 0.049. If the price deviates from this resistance range and falls below 0.0383, it may indicate a failed bottoming process. The weekly structure will also turn bullish with acceptance above 0.0417.
Daily Analysis:
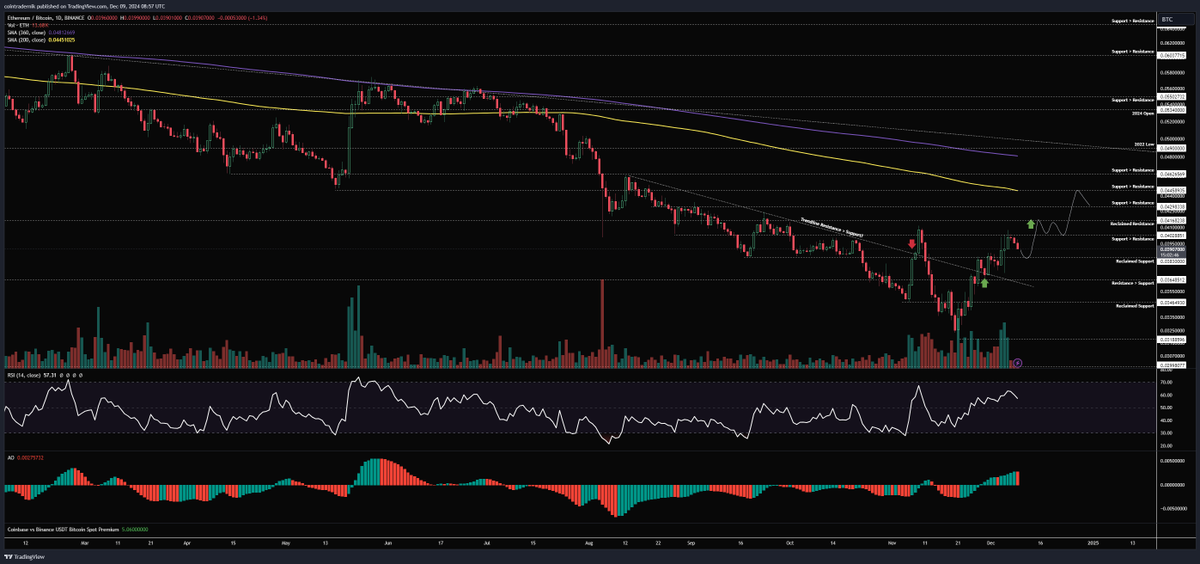
From the daily chart, we previously expected that after the price broke through the local trendline resistance, there would be no false breakout again. It now appears that this expectation is correct. The trendline has transformed from resistance to support, pushing the price further up. Next, we expect 0.0383 to become a new support level, with the price likely to break through and stabilize at 0.0403 this week, followed by a test of 0.0417. Near this critical point, the price may need to undergo a period of consolidation to confirm the validity of the market's breakout at this level. Once a successful breakout above 0.0417 occurs, the next target will be 0.0445, where the 200-day moving average (200dMA) is located, which may become a key resistance level for subsequent increases.
Gold
Current Price: $2650
Weekly Analysis
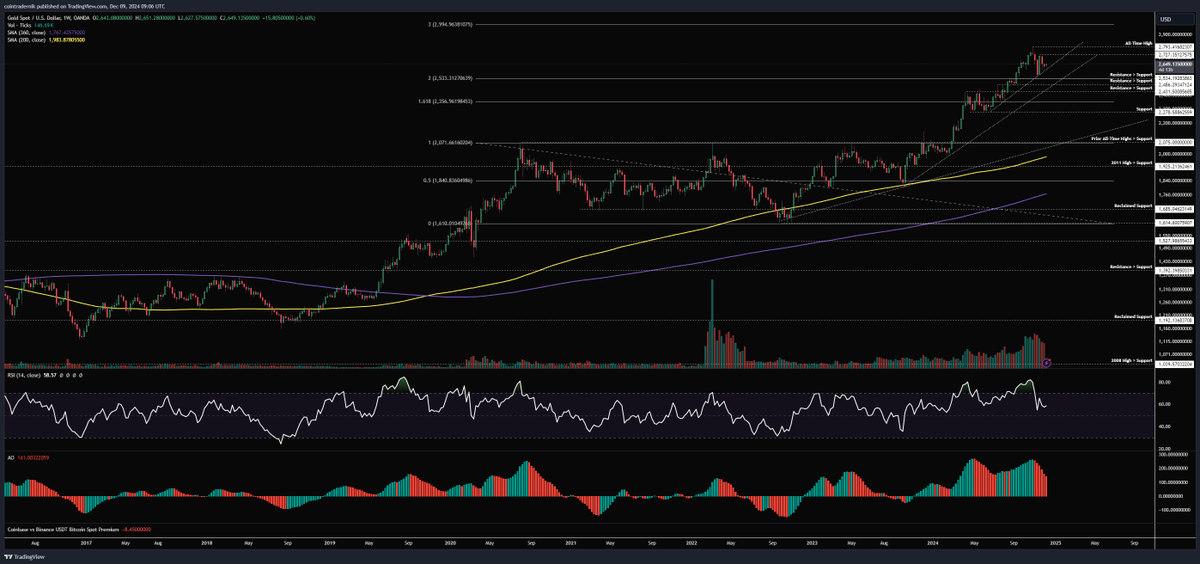
From the weekly chart of gold, the price has been operating above the trendline support, consolidating below $2727 for the past few weeks, and last week formed a higher low above the trendline. The current market is approaching a key decision point. If the weekly closing price falls below the trendline support, it may trigger a deeper correction, with targets at $2535 and $2430; conversely, if the weekly closing price breaks above $2727, it may signal the beginning of the next upward trend, targeting $3000. The market is currently in a wait-and-see state, needing to wait for the price to confirm its direction further. If the weekly closing price falls below $2535, it may shift to a bearish structure and confirm the formation of a mid-term top.
Daily Analysis
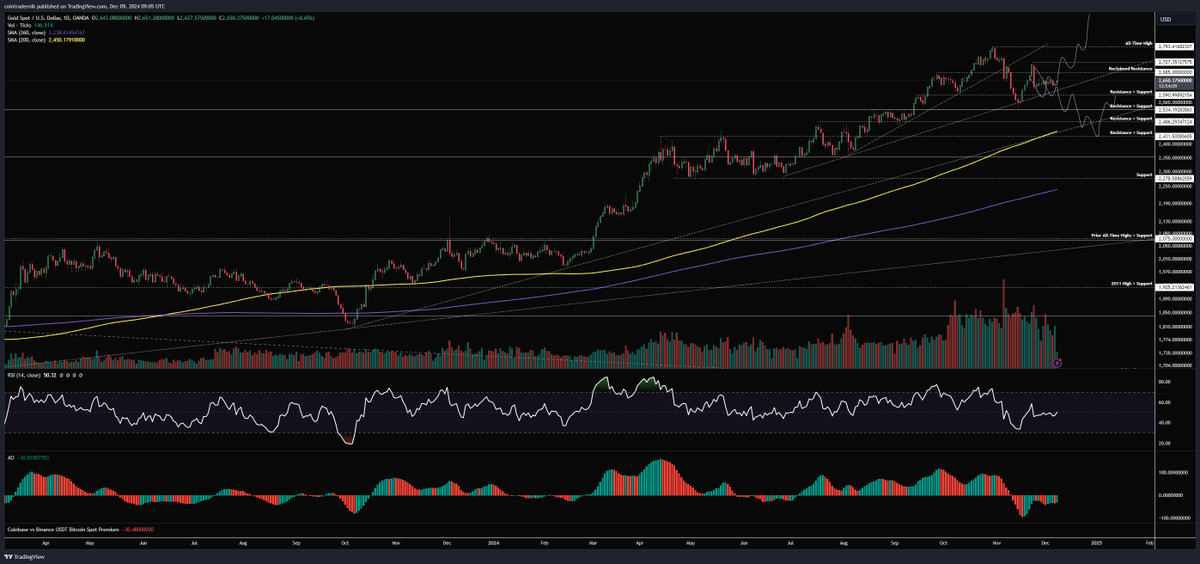
The daily chart shows that gold is following the previously marked bullish path. If the price breaks above $2685 and turns $2727 into support, this will confirm the next phase of the upward trend, targeting a breakout above $2800 and moving towards $3000. However, if the price forms a lower high below $2685 this week and falls below the trendline support to below $2590, this will confirm a bearish path, potentially leading to further price corrections, breaking below the November low, and testing the trendline support below at $2450 and the 200-day moving average.
Copper
Current Price: $4.27
Weekly Analysis
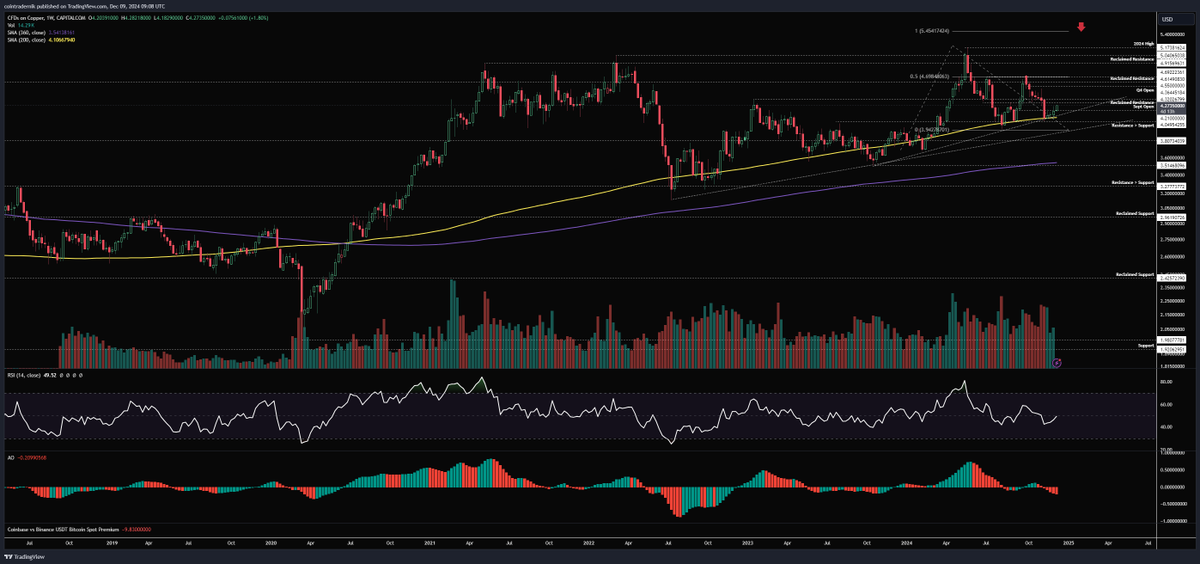
From the weekly chart of copper, the price has finally shown signs of rebounding from the major support area, which may be related to recent news about China's easing fiscal policy. Although specific policies have not yet been clarified, the market's price movements have already reflected expectations of a policy shift in China. If the weekly closing price breaks above $4.36 this week, it will confirm the current mid-term bottom, with a subsequent retest of the $4.70 high and further increases towards the multi-year range top near $5. As long as the price remains above $4, the market structure remains bullish.
Daily Analysis
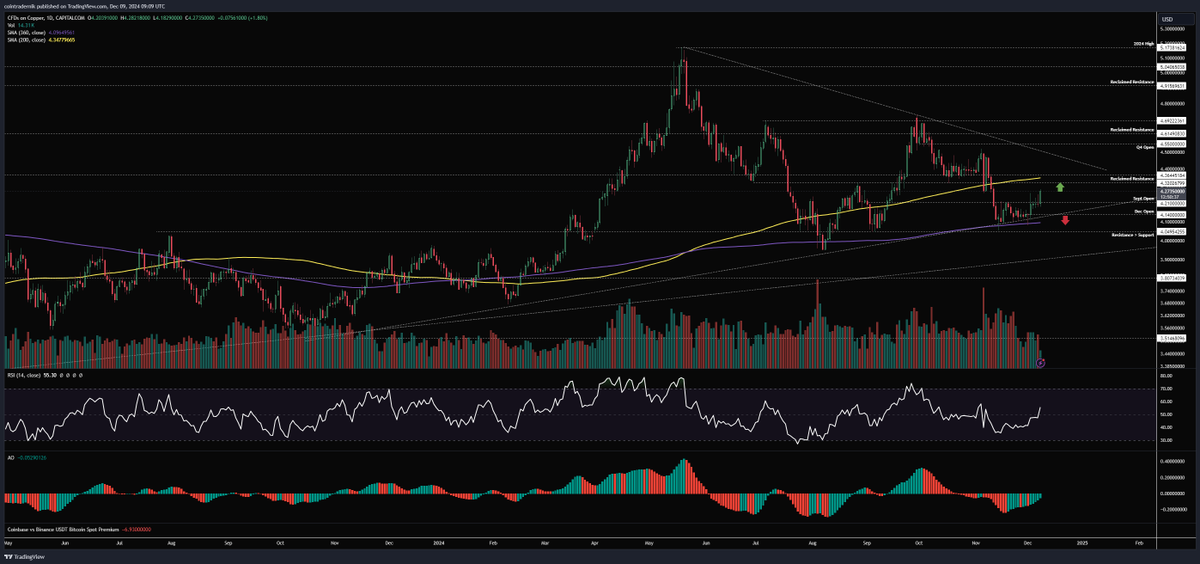
The daily chart shows that copper prices are supported at the 360-day moving average, and momentum indicators also show that prices are recovering. The current price is between this support and the resistance area near the 200-day moving average, while the trendline resistance at the annual high still needs to be broken. If the current trend establishes a bottom, the $4.20 area is expected to become support, and in the coming weeks, the price may break above $4.36, attempting to break through the trendline resistance and retest $4.70 again in early 2025. If the price falls below the 360-day moving average ($4.09), it may indicate that the current bullish outlook has failed.
Dollar Index
Current Price: 105.6
Weekly Analysis
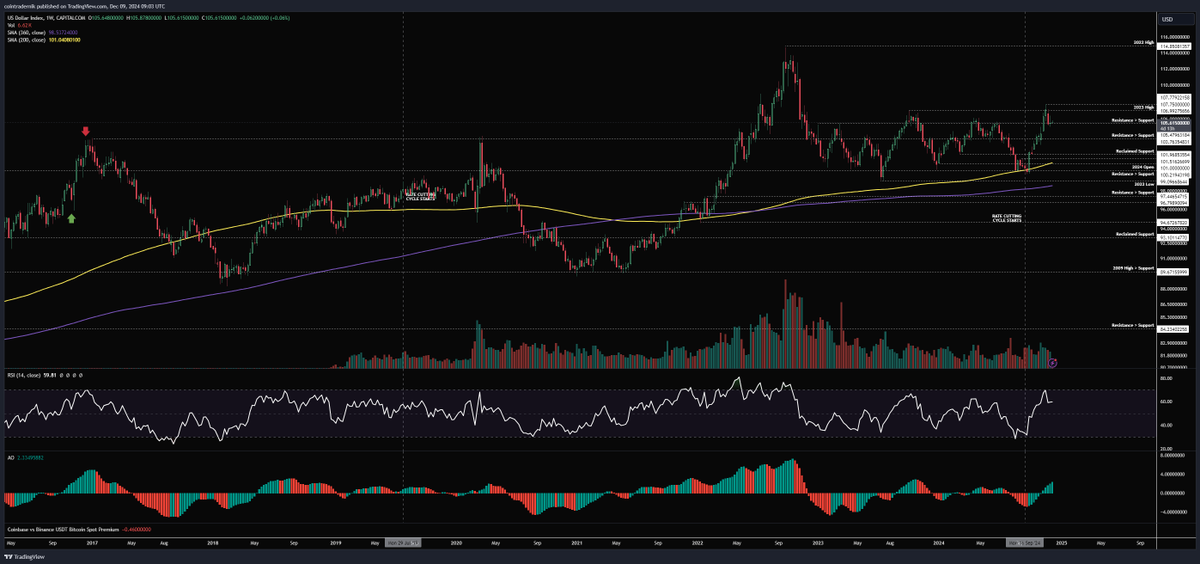
The Dollar Index failed to break through the 2023 high again last week, but closed slightly above 105.5, not yet confirming that the price movement towards 107.8 is a "false breakout." If the price closes below 105.5 this week, it may trigger further corrections, targeting the 200-week moving average and the range bottom, which is expected to be realized in the coming weeks or months. However, if the price holds above 105.5 and rebounds from this level, it may signal the beginning of a larger upward trend, subsequently turning the 2023 high of 107 into support, with price targets pointing above 108. The market is currently approaching this critical turning point.
Daily Analysis
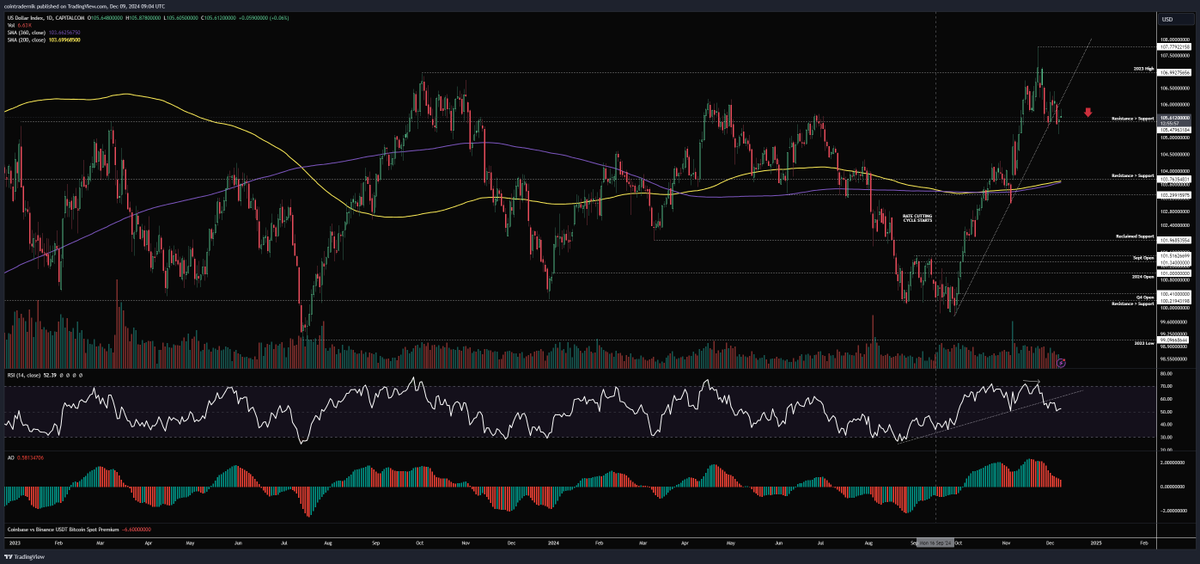
From the daily chart, the weakening momentum of the Dollar Index and the expected pullback of the RSI have been partially realized, but the price still needs further confirmation. If the price forms lower lows and highs below 105.5, this will confirm that the previous upward movement was a false breakout, and the price is expected to retreat to the convergence area of the 200-day and 360-day moving averages (around $103.7), which is the previous resistance turned support area. However, if the price breaks above the trendline and stabilizes above the 2023 high of 107, the Dollar Index will further rise, targeting above 108.
免责声明:本文章仅代表作者个人观点,不代表本平台的立场和观点。本文章仅供信息分享,不构成对任何人的任何投资建议。用户与作者之间的任何争议,与本平台无关。如网页中刊载的文章或图片涉及侵权,请提供相关的权利证明和身份证明发送邮件到support@aicoin.com,本平台相关工作人员将会进行核查。


