Don't overreact to missing good trades.
Author: Minty
Translation: Deep Tide TechFlow
For entertainment purposes only, not financial advice.
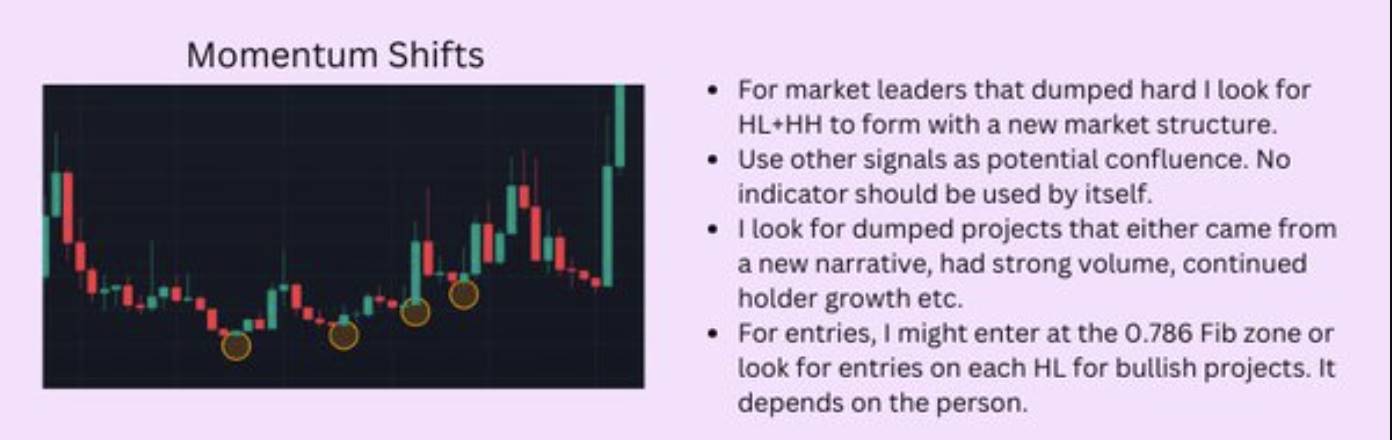
Momentum Shift: Observe changes in market momentum to identify potential trading opportunities.
For market leaders that have experienced severe sell-offs, I look for the formation of higher lows (HL) and higher highs (HH) to establish a new market structure.
Use other signals as potential resonance references; no indicator should be used in isolation.
Look for sell-off projects that exhibit characteristics such as emerging narratives, strong trading volume, and a continuously growing number of holders.
Entry strategies may include entering at the 0.786 Fibonacci zone or looking for bullish entry opportunities at each higher low (HL), depending on personal preference.
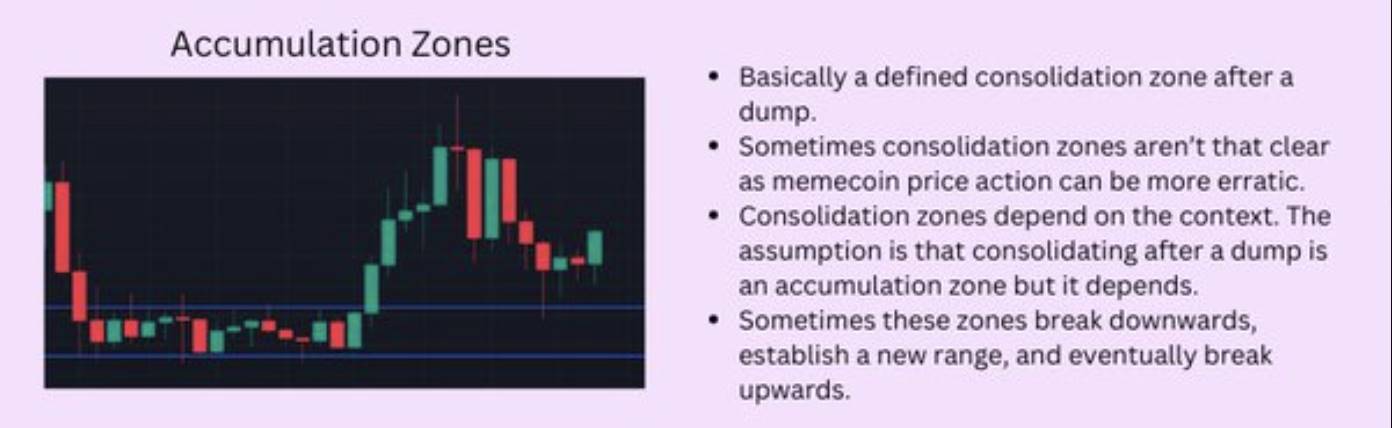
Accumulation Zone: After a market decline, look for areas where prices fluctuate within a certain range, typically seen as an accumulation phase.
A clear consolidation area is usually defined after a sell-off.
Sometimes the consolidation area may not be very obvious, as meme coin price movements can be more volatile.
The definition of the consolidation area depends on the market context. Although consolidation after a sell-off is generally viewed as an accumulation zone, specifics may vary.
Occasionally, these areas may break down first, forming a new trading range, and then break up.
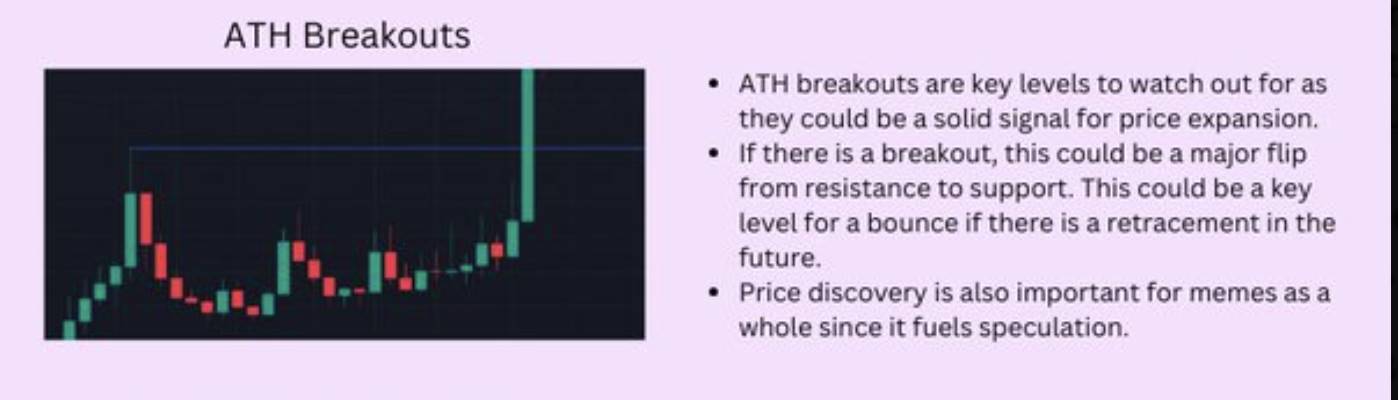
All-Time High Breakouts (ATH Breakouts): When the price breaks above the historical high, it may signal a new upward trend.
Breakouts above historical highs (ATH) are key levels to focus on, as they can be strong signals for price expansion.
If a breakout occurs, it may indicate that resistance levels have turned into support levels, which could become important rebound points during future price retracements.
For meme coins overall, price discovery is crucial as it drives market speculation.
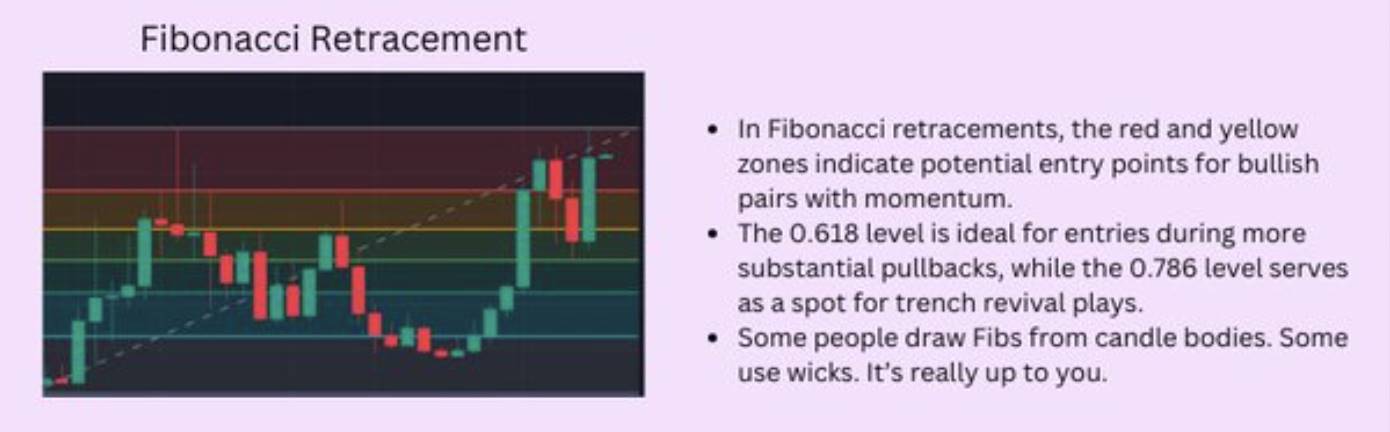
Fibonacci Retracement: Use the Fibonacci sequence to identify potential support and resistance levels.
In Fibonacci retracement, the red and yellow areas are typically seen as potential entry points for bullish pairs with momentum.
The 0.618 level is an ideal entry point during larger pullbacks, while the 0.786 level is suitable for rebound trades after deep pullbacks.
Some people draw Fibonacci from the bodies of candlesticks, while others use the wicks; it completely depends on personal preference.
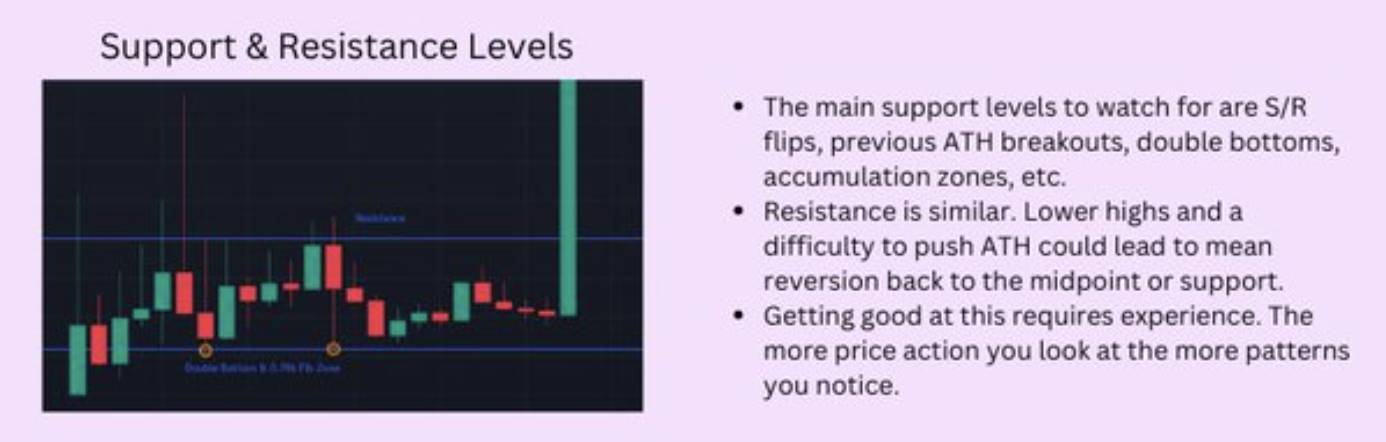
Support and Resistance Levels: Price may encounter resistance or support levels during declines or increases.
Major support levels include support/resistance (S/R) flips, previous ATH breakouts, double bottom patterns, accumulation zones, etc.
On the resistance side, lower highs and difficulty breaking ATH may lead to price returning to the midpoint or mean of support levels.
Mastering these analytical methods requires extensive experience. The more price movements you observe, the more patterns you can identify.
Some Notes
Key patterns are not always accurate. Combining multiple resonance signals can increase the probability of success.
In a bullish market, execution is more likely to yield returns; in a bearish market, more strategic operations are required.
Using Dexscreener's filters can help you track when prices reach target levels.
Especially with new hot projects, do not expect to always get ideal entry points. You may be front-run due to higher gas fees and limit orders.
Don't overreact to missing good trades. Based on experience, forced trading due to fear of missing out (FOMO) often leads to greater losses.
I usually default to looking at daily and weekly charts, at least checking the 4-hour chart, as the shorter the time frame, the more market noise there is.
免责声明:本文章仅代表作者个人观点,不代表本平台的立场和观点。本文章仅供信息分享,不构成对任何人的任何投资建议。用户与作者之间的任何争议,与本平台无关。如网页中刊载的文章或图片涉及侵权,请提供相关的权利证明和身份证明发送邮件到support@aicoin.com,本平台相关工作人员将会进行核查。


