This article will conduct an in-depth analysis of AAVE's on-chain data, with the key points being:
1) On-chain data shows that funds in the US time zone are dominating the increase in AAVE holdings.
2) AAVE's circulating market value is $2.3 billion, with a fully diluted valuation of $2.46 billion. There is a monthly new circulation of 43,000 AAVE tokens.
3) Most of the large AAVE holders are in a profitable state, but the overall profit is not high. From the perspective of gains and losses, most of the large holders are not from the bull market of 2021, and a significant portion of the chips in the middle have already been fully turned over.
4) The addresses of AAVE's increased holdings have a relatively large amount of funds, indicating that they are powerful large fund holders.
1 AAVE Overview
1) The total supply of AAVE is 16 million tokens. According to coinmarketcap data, the current circulating supply of AAVE is 14.93 million tokens, with a circulating market value of $2.3 billion and a fully diluted valuation of $2.46 billion.
2) In terms of chip distribution, AAVE is mainly divided into two parts: 13 million tokens were exchanged from LEND in 2020, and 3 million tokens are used for ecosystem incentives. Of the 3 million, 43,000 new tokens are added to circulation each month. This serves two purposes: one part is used for rewarding AAVE stakers, and the other part is for the founding team's reward.
3) The AAVE genesis wallet still holds 790,000 AAVE tokens, worth $122 million.
2 On-Chain Chip Distribution
2.1 Situation of the Top 10 Holding Addresses:
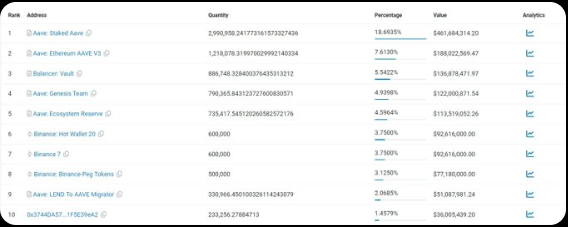
Looking at the on-chain holding addresses, the largest holding address is the AAVE staking address, with 2.99 million tokens staked. Among the top 20 addresses, most are cold wallets of the project and exchanges. Of particular note are the following addresses:
1) Address 9 holds LEND that has not been migrated to AAVE, with 330,000 AAVE tokens still remaining, worth $50 million. Due to the time interval of several years, it is highly probable that the wallet for this portion of chips has forgotten the private key. Essentially, these chips are considered to have been destroyed.
2) The largest institutional holder is blockchain capital, holding 233,000 tokens. Blockchain capital is an investment institution for AAVE, and most of the chips have not been sold and are still held to this day.
2.2 Overall Chip Distribution
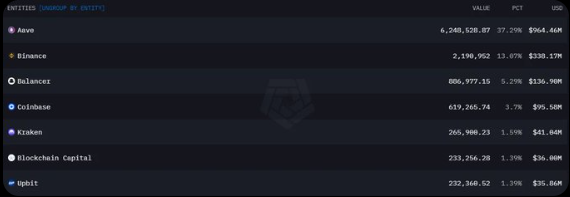
In terms of chip ownership, AAVE is 37.29% in the hands of the project team, but this includes staking chips, which belong to users. Binance holds 2.19 million tokens, accounting for 13.07%. This is followed by Coinbase, Kraken, Upbit, and others. AAVE's main on-chain liquidity is in Balancer, with 880,000 AAVE tokens, amounting to high liquidity of $170 million. The next highest liquidity is in AAVE's Uniswap, with 13 million tokens.
In terms of public chain allocation, most of AAVE's 16 million tokens are on the Ethereum main chain. Other chains with relatively large allocations include BSC with 500,000 tokens and Polygon with 229,000 tokens.
2.3 Staking Situation
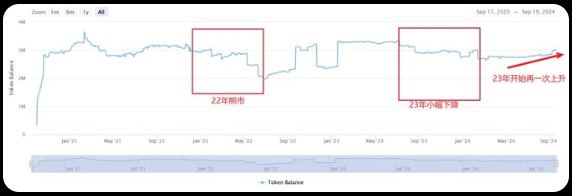
1) Looking at the changes in staking, AAVE has maintained a staking amount of 2-3 million tokens overall. Staking quickly reached 2.8 million in October after staking began in 2020, and then reached a peak of 3.6 million tokens in February 2021.
2) Looking at the changes in staking quantity, AAVE stakers are also affected by the bear market to a certain extent. In the bear market of 2022, there was a significant decrease in AAVE staking, from 3.17 million to 1.97 million, a decrease of 1.2 million tokens. There were also consecutive decreases during the second half of 2023 when the market was not good.
3) After May 2024, AAVE's staking has once again been steadily increasing. It has now recovered to 2.99 million tokens.
3 Exchange Chip Analysis
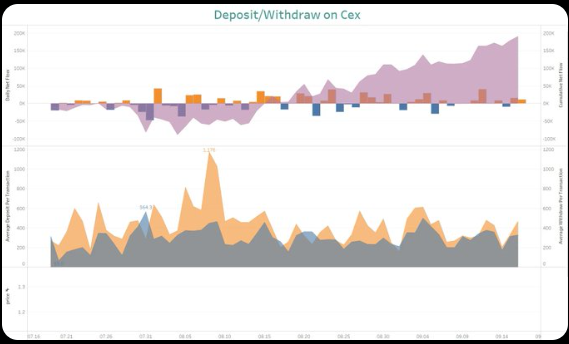
In the above chart, the first image represents the daily deposit/withdrawal situation of exchanges, with yellow representing the net deposit for the day and blue representing the net withdrawal for the day. The shaded area represents the cumulative deposit and withdrawal. The second image represents the average amount of each deposit/withdrawal, used to determine whether the deposit and withdrawal behavior is from large holders or retail investors. Intuitively, higher values indicate behavior from large holders, while lower peak values are mainly from retail investors.
1) Looking at the deposit and withdrawal from exchanges, from -89,000 tokens on August 4th to +190,000 tokens on September 16th, this means that there was a net inflow of approximately 280,000 tokens within a little over a month. However, there is some uncertainty here, as the exchanges included here contain Coinbase, and Coinbase has Prime Custody service. AAVE stored in Custody service by users should not be counted as user deposits to Coinbase. Instead, users giving AAVE to Coinbase for token custody indicates an intention to hold for the long term.
2) Looking at the average amount of each deposit, the amount for single coin deposits is higher than that for withdrawals. The highest value was on August 9th, with an average deposit of 1,176 tokens. This indicates large holder deposits, which aligns with our previous assumption. This is because using Prime Custody service is definitely a behavior of large holders.
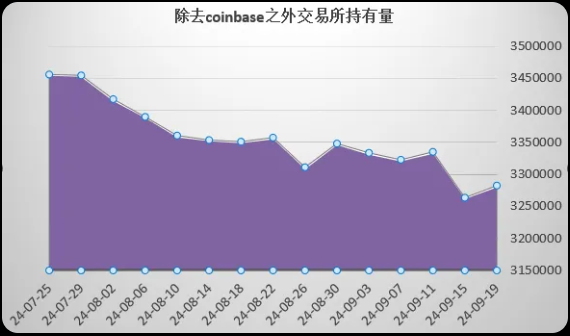
I excluded Coinbase exchange data and analyzed the changes in AAVE holdings for other exchanges. It is evident that from July 25th, there was a clear net outflow of AAVE. It decreased from 3.45 million to 3.28 million, a net outflow of 170,000 tokens.
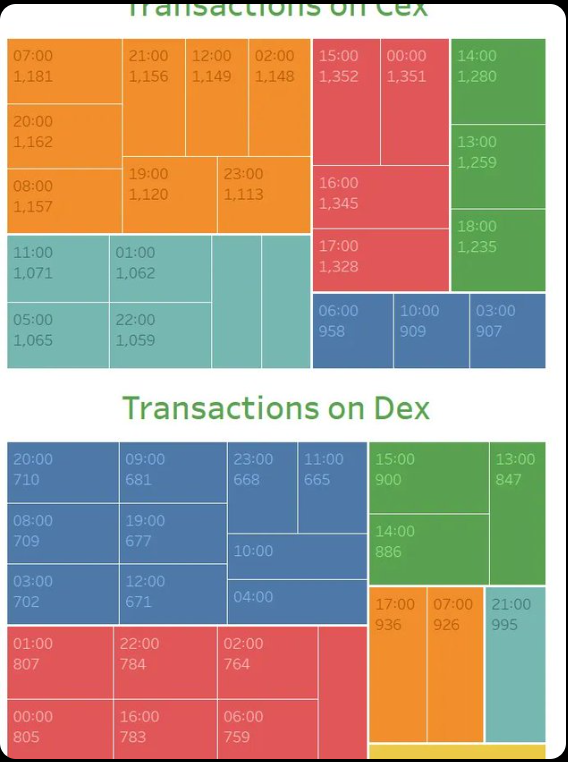
The above chart shows the number of transfers from wallet addresses (contract addresses) on DEX and CEX, which is the cumulative number of transfers in and out. Please note that the time is in UTC.
From CEX, it can be seen that the most active times on CEX are at UTC 15:00, 16:00, and 17:00. Converted to Beijing time, this is 11 PM, 12 AM, and 1 AM, which is the active time for the US. The smallest transfer in and out occurs at 12:00 and 17:00 Beijing time, which is the active time for Asia. This indirectly indicates that AAVE has been mainly active with US funds in the past two months.
From DEX, it can be seen that the most active time on DEX is at UTC 21:00, followed by 17:00 and 07:00. Converted to Beijing time, the most active time is still 8 AM. Of course, it is also evident that the overall transfer in and out on exchanges is higher.
From the transfers on DEX and CEX, it is evident that funds are more active on exchanges, and it is funds from the US time zone.
4 In-Depth Profile of Large Holders
Please note that the large holders mentioned here are the holders of AAVE after excluding addresses such as project parties, DEX, CEX, MEV, DEX intermediary wallets, and CEX intermediary wallets. These large holders may include institutions.
The above summarizes the core information of the large holder addresses.
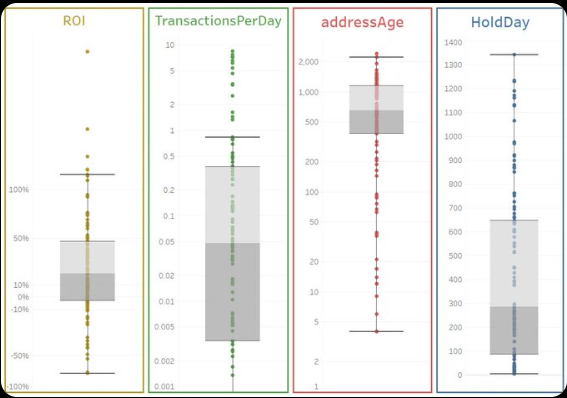
1) ROI: Looking at the ROI, over 75% of large holders are in a profitable state, but the profit is not high. The median profit is 20%, with the maximum profit being 137%. However, 26% of large holders are still in a loss, with the maximum loss being 66%. Considering AAVE's price, the highest point was $668 during the bull market in 2021, and the lowest point was $49. From the profit and loss, it can be inferred that most of the chips have already been fully turned over.
2) HoldDay: The median for address holding duration is 287 days, approximately over 9 months. This indicates that over half of the large holders have purchased AAVE this year. The other half purchased before 2024. Only 25% of large holders have held for over 647 days, which is over 1 year. The longest holding address is 1342 days.
3) TransactionsPerDay (TPD): The median TPD for AAVE's large holders is 0.048, indicating that they rarely engage in frequent trading. This is different from the current on-chain activities of other tokens.
4) AddressAge: The median wallet age is 654 days, with over three-quarters of wallets existing for over 1147 days. This indicates that most wallets are not newly generated and have been in existence for some time.
In summary, the wallets of AAVE's large holders are mostly over 9 months old, with a low daily transfer frequency, indicating that they are not frequent traders. Most are in a profitable state, but the overall profit is not high. From the profit and loss perspective, most large holders are not from the 2021 bull market, and a significant portion of the chips have already been fully turned over.
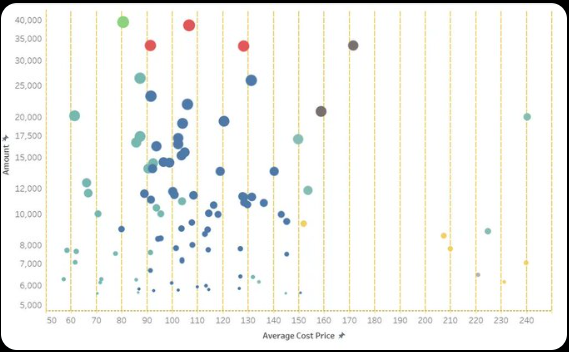
Further research on the cost of large holders. The chart shows the cost and holding relationship of large holders. From the chart, it is evident that:
1) The average holding cost of most large holders is concentrated between $85 and $150, especially around $100. This price range also corresponds to the recent fluctuation range. There are holdings between $85 and $100, with holdings of around 6,000, as well as holdings of 20,000 and 35,000.
2) There is a group with a cost range between $200 and $200. AAVE has been priced below $200 since April 2022, indicating that these large holders have been holding for a long time. The overall chips in this group are relatively small, with the largest holder holding around 20,000, and most holding below 10,000.
3) There is also a group with a cost below $70, which has already doubled in value at the current price, but the overall proportion is relatively small.
5 Analysis of Recent 60-Day Increase in Large Holders
Note: Increase in large holders refers to the newly purchased large holders, which may overlap with the large holders. For example, if an address is both a top 100 personal large holder and an increase in holdings, and this address holds 50,000, and has purchased 2,000 recently, only the 2,000 will be used for analysis here.
5.1 Distribution of Increase in Holdings
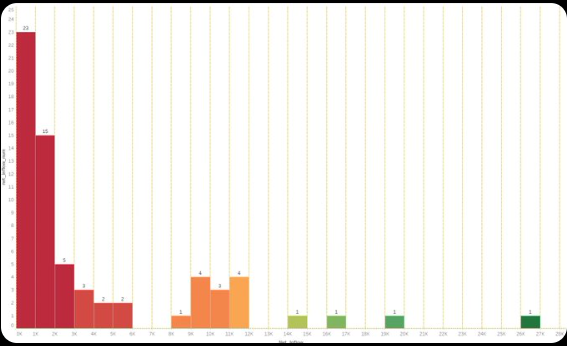
The chart shows the increase in holdings of large holders in the past 60 days. The largest increase is in the 0K-1K range, with approximately 140,000 USD, with a total of 23 addresses. The next highest quantity is in the 1K-2K range, with a total of 15 addresses. There are various distribution of increase addresses between 2K and 12K. However, there are relatively few increases above 14K, with only one of each type.
The largest address increased by around 26K, worth approximately 4 million USD.
5.2 Basic Information of Increase Addresses
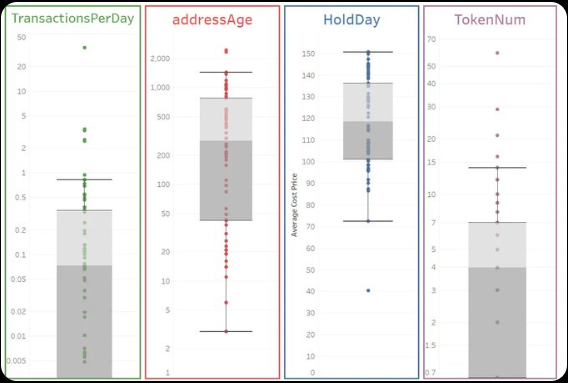
1) Address Holding Duration Analysis: The median for addressAge is 281.5 days, approximately 9 months. This indicates that over half of the recent increase holders have generated addresses in less than a year. Additionally, 25% of the increase holders' age is after 42 days. Compared to the large holder addresses (median of 654 days), this indicates that recent increase holders are new buyers.
2) TransactionsPerDay (TPD) Analysis: The median TPD is 0.0731 times per day, approximately 2 transactions per month. This indicates that AAVE's large holders have a low trading frequency and are more inclined to long-term holding, unlike current high-frequency short-term traders.
3) TokenNum: The number of tokens held by addresses can measure the investment style of the address. A higher number often indicates a diversified address, while a lower number indicates a preference for concentrated investments. The median number of tokens held by AAVE increase holders is 4, including AAVE itself, indicating that 50% of increase holders hold fewer than 3 other tokens. 25% of addresses hold only AAVE.
5.3 Total Assets of Increase Holders
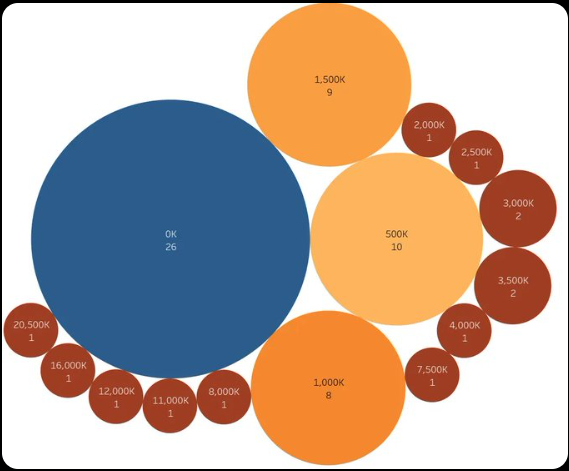
The distribution of addresses based on total assets, which can measure the financial strength of the address and to some extent, the potential strength of these increase holders for future purchases. From the data, there are 26 addresses with assets between 0 and 500K, 10 with assets between 500K and 1M, 8 with assets between 1M and 1.5M, and 9 with assets between 1.5M and 2M. This indicates that AAVE's increase holders are addresses with relatively large funds. The largest address holds 20.5M in assets.
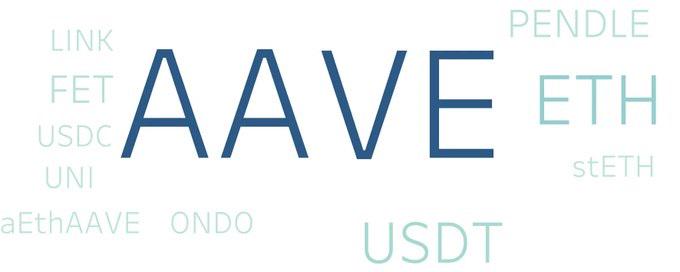
5.4 Holding Map of Increase Holders
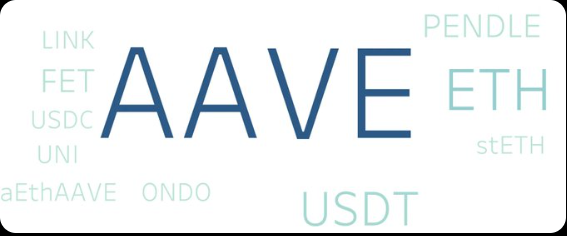
This chart clearly shows that the largest holding of AAVE increase holders is AAVE itself, which is a natural result. The second and third positions are ETH and USDT. Other holdings include ONDO, USDC, UNI, FET, LINK, PENDLE, ETH, stETH, aETHAAVE, and USDT. From the map, it can be seen that increase holders prefer traditional projects rather than the latest hot topics and narratives.
免责声明:本文章仅代表作者个人观点,不代表本平台的立场和观点。本文章仅供信息分享,不构成对任何人的任何投资建议。用户与作者之间的任何争议,与本平台无关。如网页中刊载的文章或图片涉及侵权,请提供相关的权利证明和身份证明发送邮件到support@aicoin.com,本平台相关工作人员将会进行核查。


