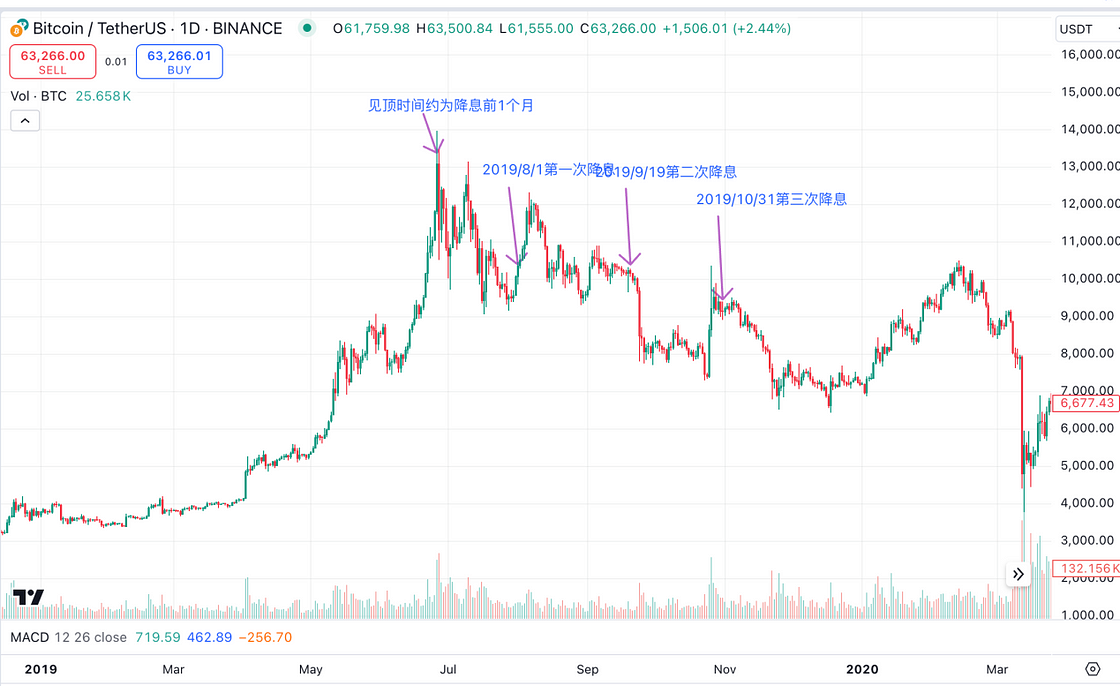
In the interest rate reduction cycle of 2019, BTC briefly rose in price after the first rate cut, and then overall entered a downward channel. The overall retracement from the top lasted 175 days, with a pullback of about 50%.

I. A Loose Monetary Policy Cycle Resumes After Four Years
At 2:00 am Beijing time on September 19, the Federal Reserve announced a 50 basis point rate cut, reducing the target range of the federal funds rate from 5.25%–5.50% to 4.75%–5.0%, officially starting a new round of rate cuts. The 50bp rate cut this time met the expectations of CME interest rate futures but exceeded the predictions of many Wall Street investment banks. Historically, a 50bp rate cut has only occurred in times of economic or market emergencies, such as the tech bubble in January 2001, the financial crisis in September 2007, and the COVID-19 pandemic in March 2020. As a 50bp rate cut would raise greater concerns about economic "recession," Powell emphasized in his speech that he did not see any signs of a recession and, as always, used this method to hedge market concerns about a recession.
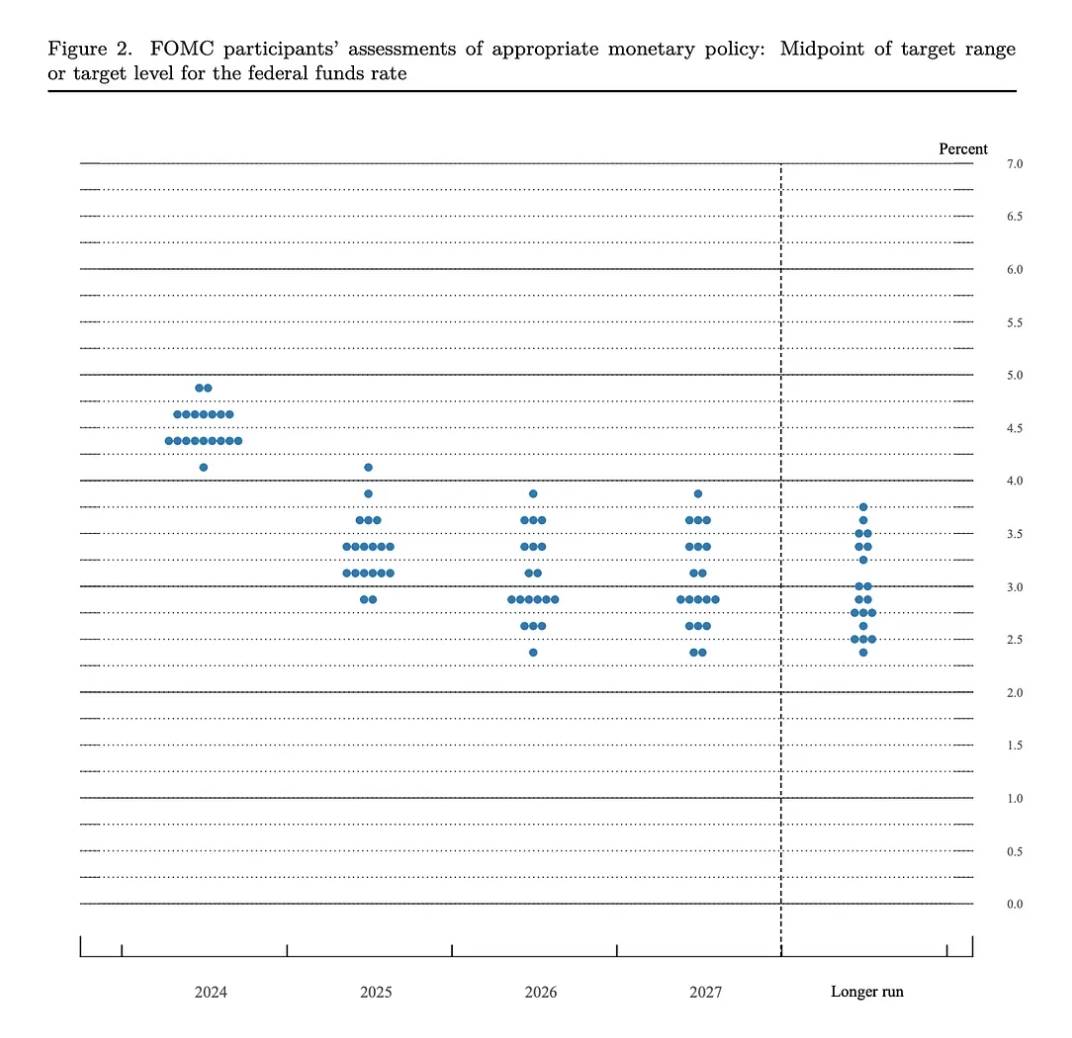
At the same time, the Federal Reserve provided a more hawkish dot plot, expecting two more rate cuts totaling 50bp by the end of the year, 4 cuts totaling 100bp in 2025, and 2 cuts totaling 50bp in 2026, with an overall reduction of 250bp and an endpoint interest rate of 2.75–3%. The dot plot indicates a slower rate of reduction than the CME interest rate futures trading, which is expected to reach the 2.75–3% level in September 2025. Powell also emphasized that this round of 50bp rate cuts cannot be used as a new benchmark for linear extrapolation. There is no fixed interest rate path, and the pace can be accelerated, slowed down, or even paused, depending on the situation at each meeting, which to some extent explains the surge in U.S. bond yields after the market closed.
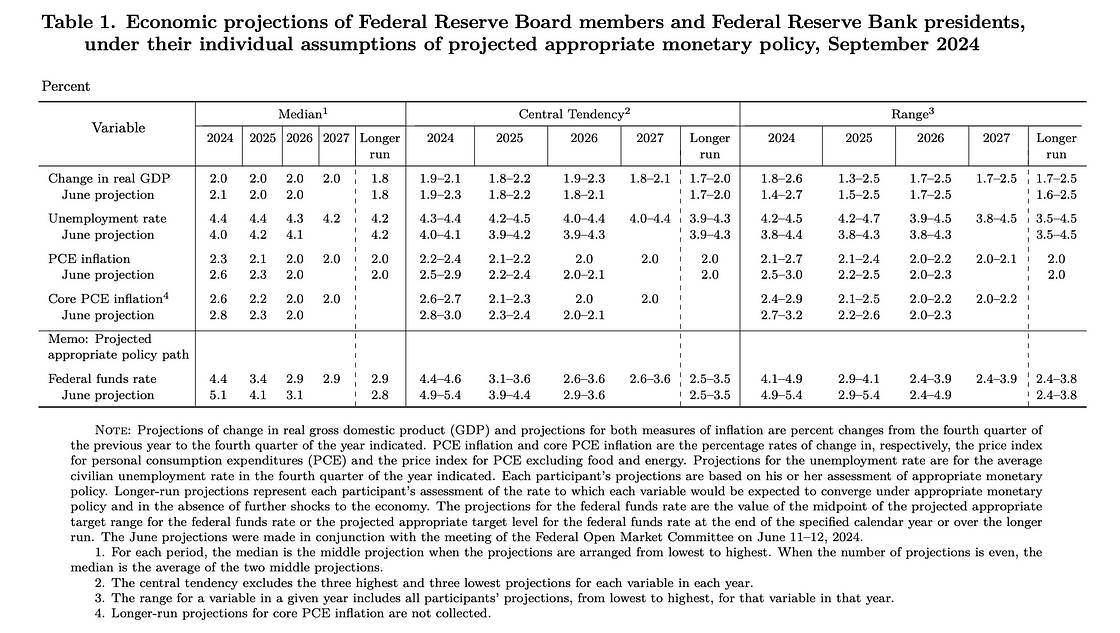
In terms of economic forecasts, the Federal Reserve lowered its GDP growth forecast for this year from 2.1% to 2.0%, significantly raised the unemployment rate forecast from 4.0% to 4.4%, and lowered the PCE inflation forecast from 2.6 to 2.3%. The Fed's data and statements both show increased confidence in curbing inflation and a greater focus on employment. Overall, with a significant initial rate cut and a more hawkish rate cut pace, the Federal Reserve has once again played with expectations management.
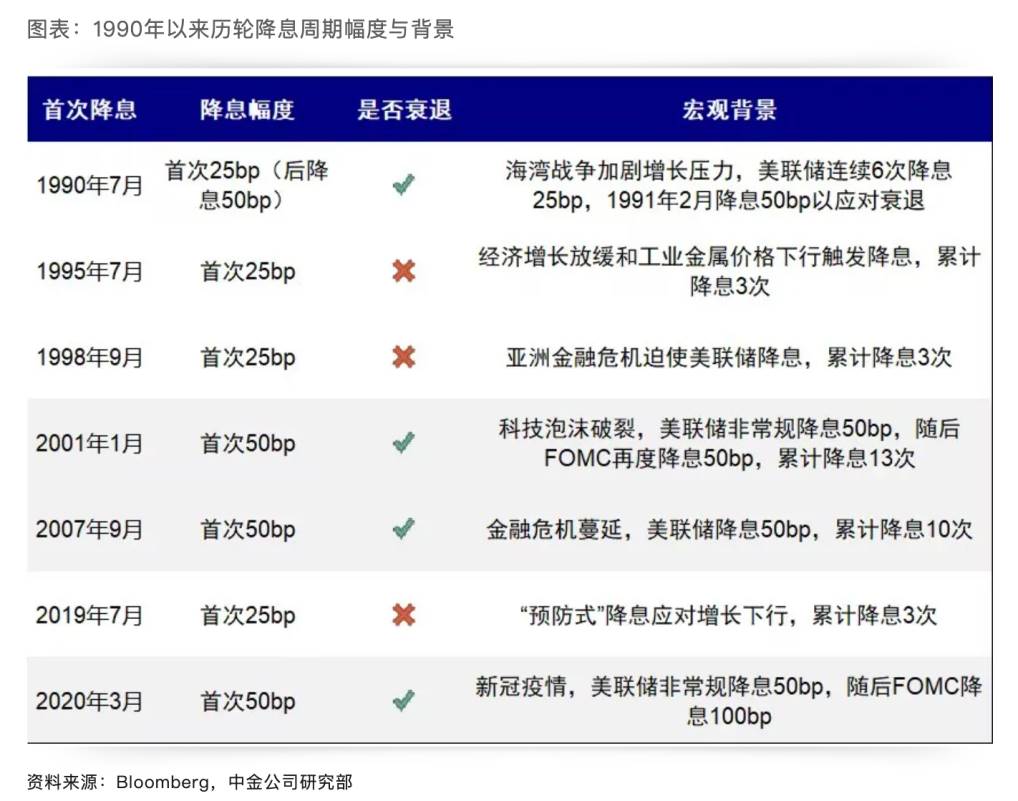
II. Interest Rate Reduction Cycles Since the 1990s
June 1989 to September 1992 (Recessionary Rate Cuts)
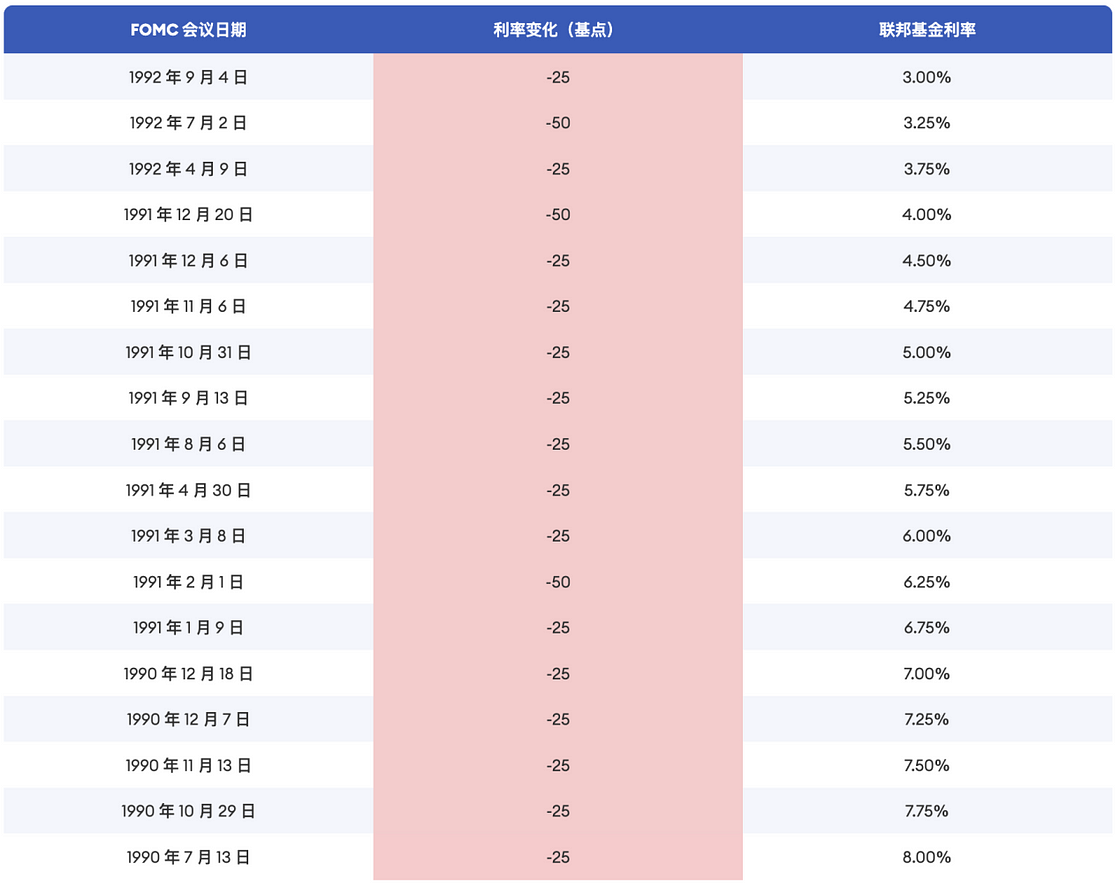
At the end of the 1980s, U.S. interest rates rose rapidly, leading to a situation where short-term deposit rates at depository institutions were higher than long-term fixed loan rates, and U.S. bond yields inverted. The U.S. financial industry experienced a "depository crisis," with a large number of banks and savings institutions going bankrupt. Combined with the external impact of the Gulf War, the U.S. economy fell into a recession from August 1990 to March 1991, as defined by the National Bureau of Economic Research (NBER), lasting 8 months. The Federal Reserve began a rate cut cycle in June 1989, with a cumulative reduction of 681.25BP over more than three years, lowering the upper limit of the policy rate from 9.8125% to 3%.
July 1995 to January 1996 (Preventive Rate Cuts)
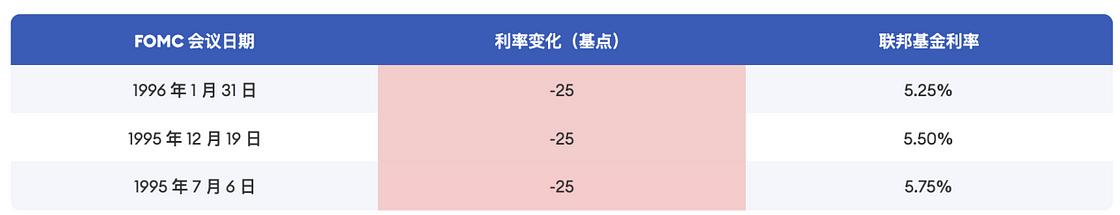
In 1995, U.S. economic growth slowed, and employment was sluggish. The Federal Reserve believed that although the economy had not yet entered a recession, the decline in some economic indicators suggested the risk of future economic downturns, leading to a decision to cut rates to stimulate the economy as a preventive measure. This rate cut began in July 1995, lasted for 7 months, with a cumulative reduction of 75BP, lowering the upper limit of the policy rate from 6% to 5.25%. Subsequently, the U.S. economy achieved a "soft landing," with weak employment and manufacturing PMI indicators rebounding before the rate cut. This rate cycle is also considered a typical case of a "soft landing." On the other hand, the Fed's operations successfully prevented inflation from "taking off," with the PCE inflation rate hardly exceeding 2.3% during the rate cut process, maintaining relative stability.
September to November 1998 (Preventive Rate Cuts)
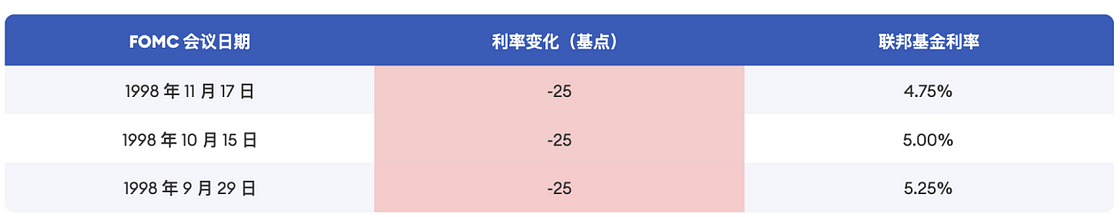
In the second half of 1997, the "Asian financial crisis" broke out, causing a recession in the Asian economy, which weakened external demand and affected U.S. commodity trade. While the overall U.S. economy remained stable, the turmoil in the external environment and the weakness in commodity trade pressured the U.S. manufacturing sector, leading to a stock market correction. In August 1997, the S&P 500 index experienced a nearly two-month correction, with the deepest decline approaching 20%, and the giant hedge fund Long-Term Capital Management (LTCM) was on the brink of bankruptcy. To prevent the crisis from further affecting the U.S. economy, the Federal Reserve began rate cuts in September 1998, with three rate cuts by November, totaling 75BP, and lowering the upper limit of the policy rate from 5.5% to 4.75%.
January 2001 to June 2003 (Recessionary Rate Cuts)
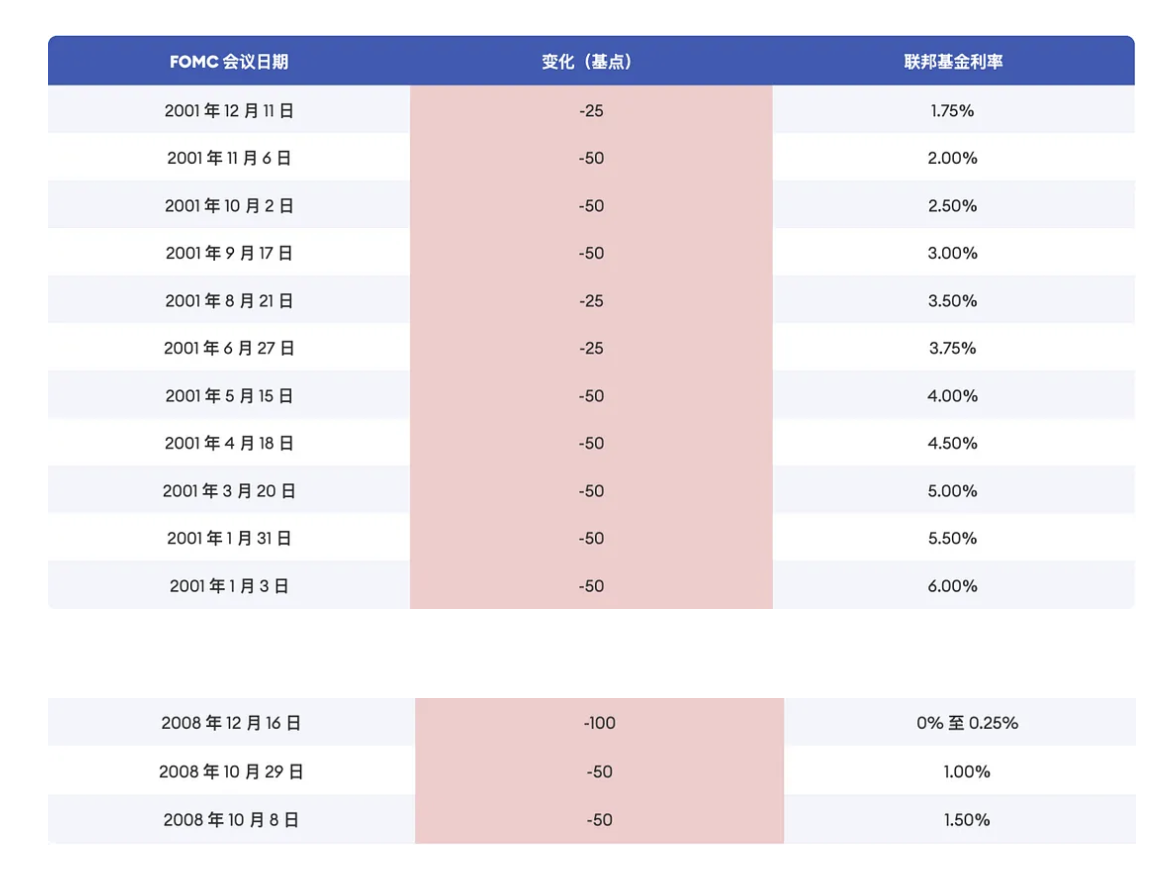
At the end of the 1990s, the rapid development and popularization of internet technology led to excessive speculation and irrational prosperity, with a frenzy of funds flowing into internet investments. From October 1999 to March 2000, the Nasdaq index rose by 88% in five months. From June 1999 to May 2000, the Federal Reserve raised interest rates six times, totaling 275BP, to counteract the overheated economy. In March 2000, after the Nasdaq index peaked, it quickly declined, the internet bubble gradually burst, and a large number of internet companies went bankrupt, leading to an economic recession. On January 3, 2001, the Federal Reserve announced a 50BP rate cut, followed by a total of 13 rate cuts, totaling 550BP, and lowering the upper limit of the policy rate from 6.5% to 1.0%.
September 2007 to December 2008 (Recessionary Rate Cuts)
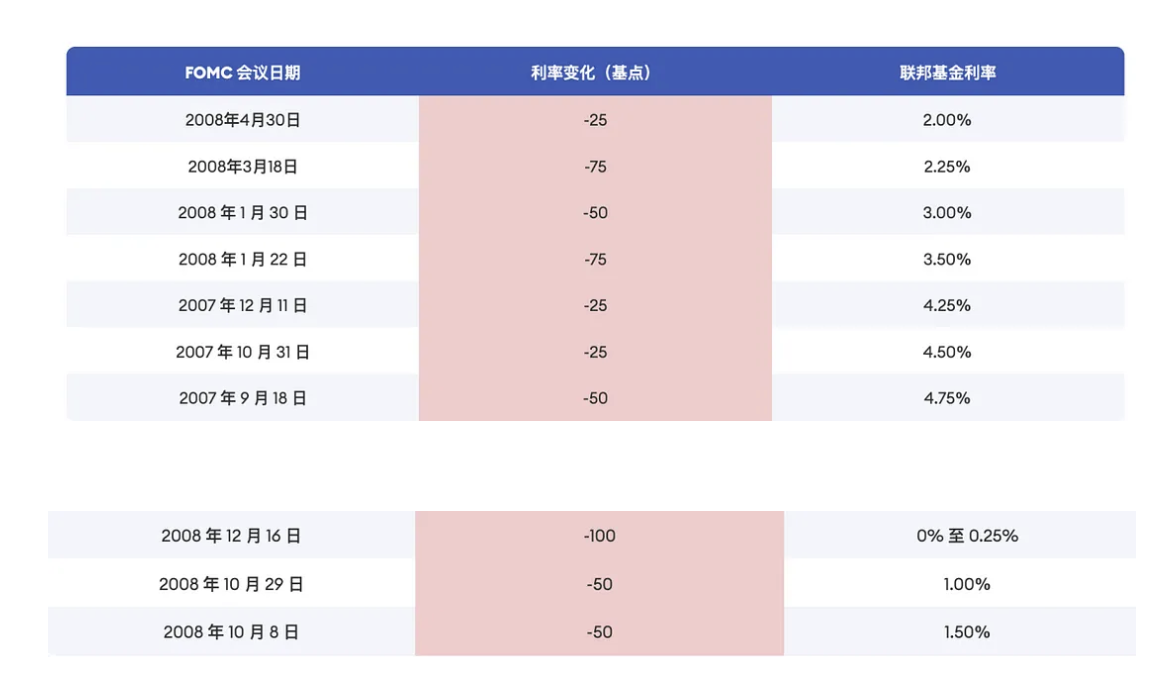
In 2007, the U.S. subprime mortgage crisis broke out and further spread to debt and equity markets, leading to a sudden change in the U.S. economic situation. On September 18, the Federal Reserve cut the federal funds target rate by 50BP to 4.75%, and then continued to cut rates 10 times, reducing the rate by 550BP to 0.25% by the end of 2008. The rate cuts were still insufficient to address the severe economic situation, so the Federal Reserve introduced quantitative easing (QE) for the first time, using unconventional monetary policy tools such as large-scale purchases of U.S. Treasury bonds and mortgage-backed securities to lower long-term interest rates, stimulate the economy, and inject liquidity into the market.
August to October 2019 (Preventive Rate Cuts)
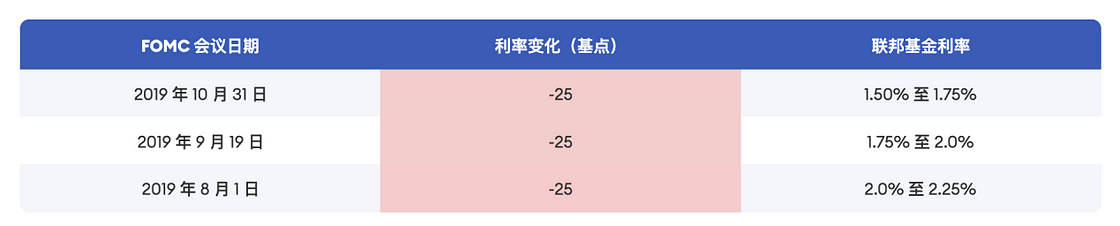
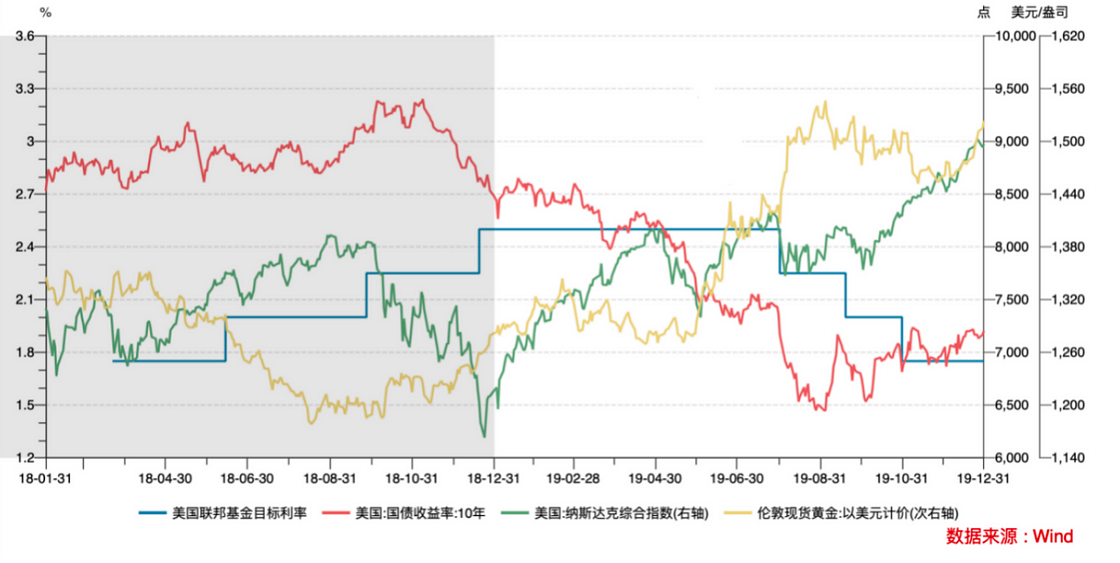
In 2019, the overall U.S. economy and job market were stable, but due to factors such as geopolitical conflicts and U.S.-China trade frictions, U.S. external demand weakened, while domestic demand also showed signs of slowing down, with inflation rates below 2%. In the first half of 2019, the PCE inflation rate remained at 1.4–1.6%, and the core PCE inflation rate dropped from 1.9% at the beginning of the year to 1.6% in March–May.
On July 31, 2019, the Federal Reserve announced a 25 basis point rate cut to 2.25%, stating that the U.S. economy was growing moderately, the job market was stable, but overall and core inflation rates were below 2%. The rate cut was aimed at preventing economic slowdown, especially considering the tense trade situation and global growth slowdown. Until the outbreak of the global pandemic in 2020, the overall U.S. economy was stable, with indicators such as manufacturing PMI and core PCE showing signs of improvement. From August to October 2019, the Federal Reserve made three consecutive rate cuts, totaling 75 basis points, lowering the upper limit of the policy rate from 2.5% to 1.75%.
March 2020 (Recessionary Rate Cuts)
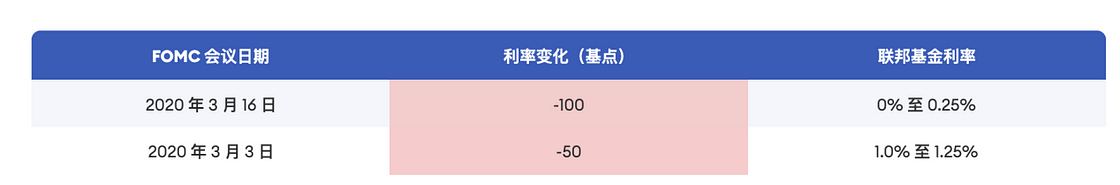
In March 2020, the Federal Open Market Committee held two emergency meetings and made significant rate cuts, bringing the federal funds target rate range back to 0 to 0.25%.
III. Asset Prices During Rate Cuts
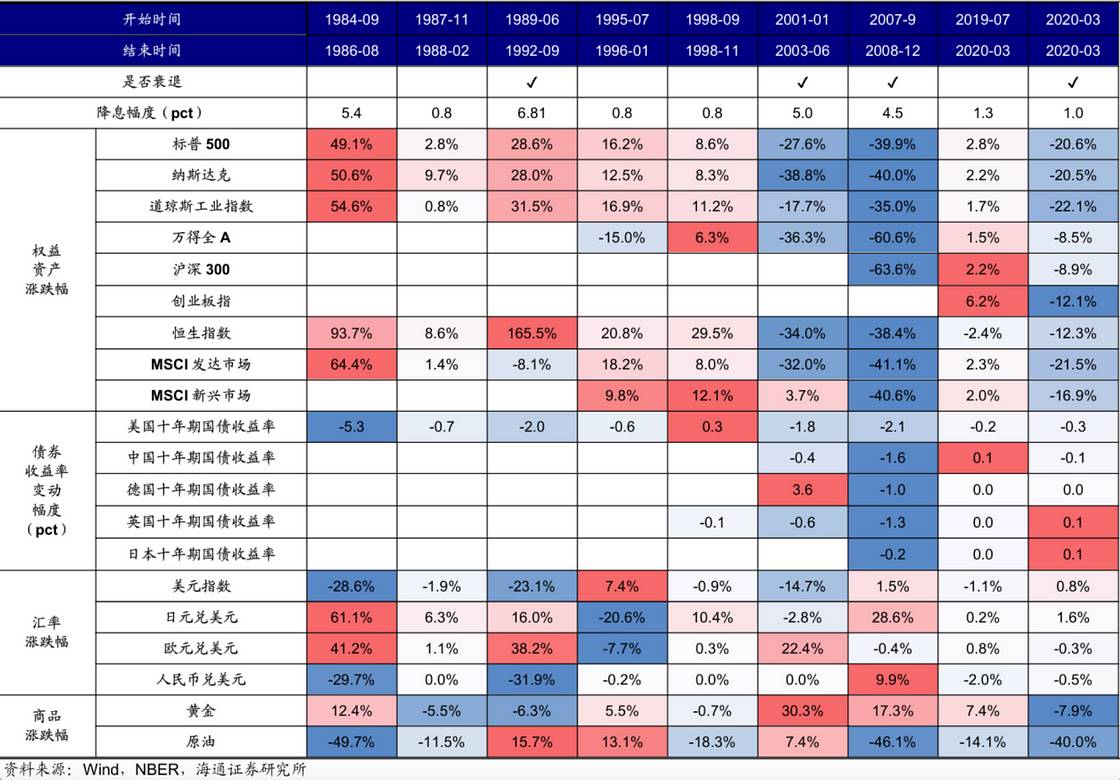
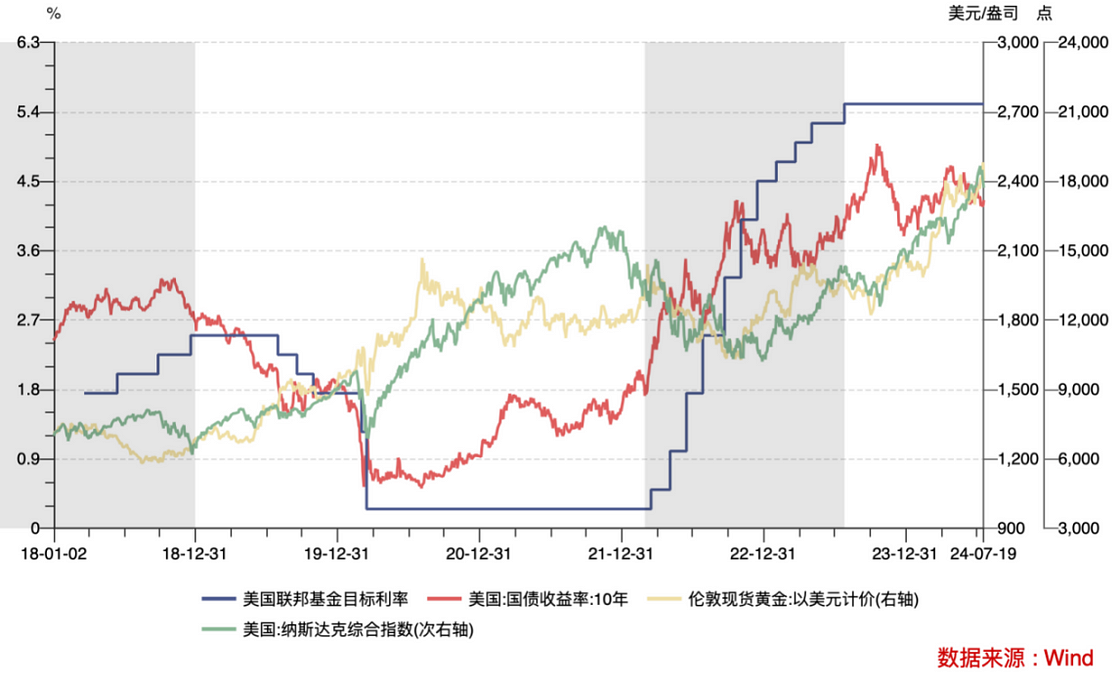
The changes in asset prices after rate cuts are closely related to the macroeconomic environment at the time. It is believed that the current U.S. economic data does not support the conclusion of a recession. Under the premise of a soft landing for the U.S. economy, more attention should be paid to preventive rate cuts, especially regarding the asset price trends during the rate cuts in the 19-20 year period.
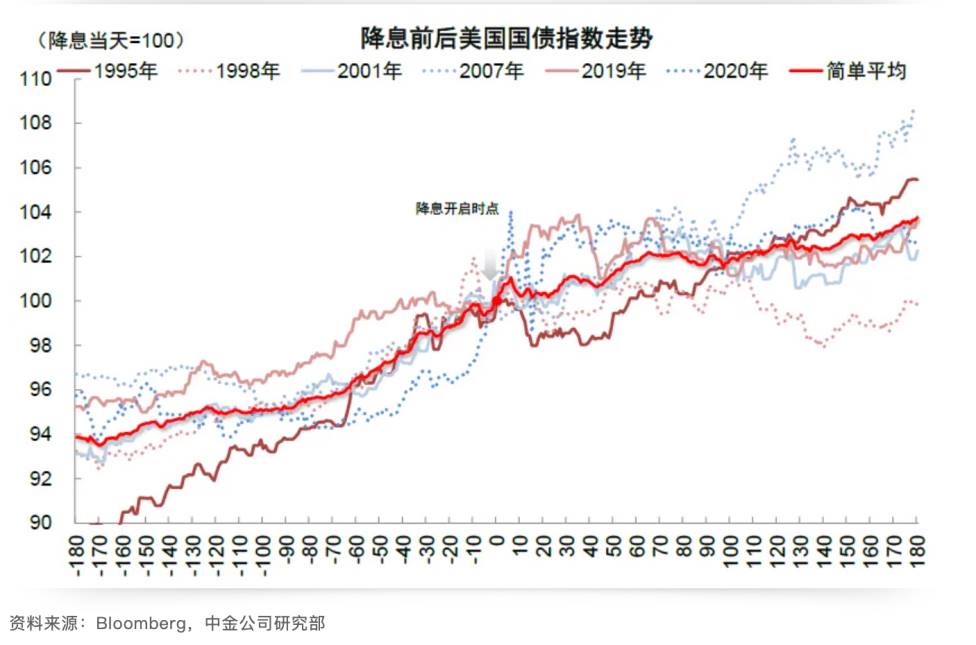
U.S. Treasury Bonds
Overall, U.S. Treasury bonds were on an upward trend before and after the rate cuts, with a more certain and larger increase before the rate cuts. The average upward frequency in the 1, 3, and 6 months before the rate cuts was 100%, while it decreased after the rate cuts. The average upward amplitude in the 1, 3, and 6 months before the rate cuts was 13.7%, 22%, and 20.2%, compared to 12.2%, 7.1%, and 4.6% after the rate cuts. This behavior indicates the market's behavior of pricing in the rate cuts in advance. The volatility increased around one month before and after the rate cuts. In the later stage of the rate cuts, the interest rate trends showed differentiation due to different economic recovery situations.
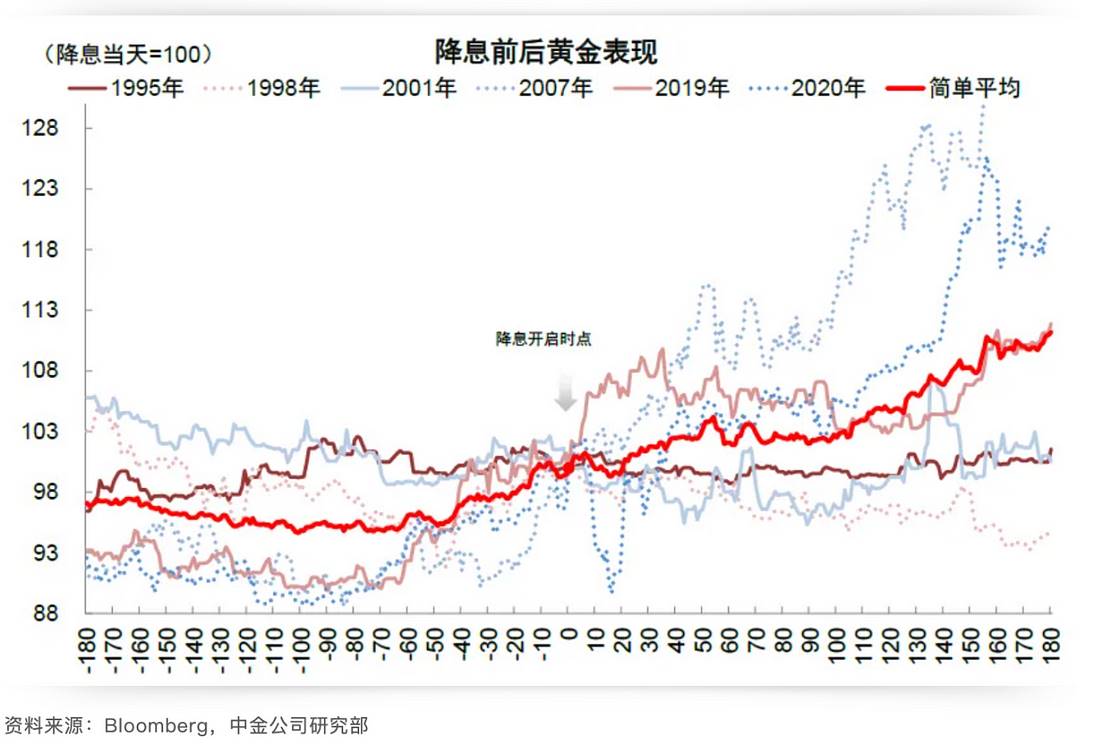
Gold
Similar to U.S. Treasury bonds, the probability and magnitude of gold's increase before rate cuts were greater. Benefiting from safe-haven demand in critical situations, the relationship between gold trends and a "soft landing" is relatively unclear. From a trading perspective, the best time to trade gold as the denominator asset is before the rate cuts, as the expectations are fully priced in and the rate cuts are limited. After the rate cuts, more attention can be given to the assets on the numerator side that benefit from the boost of the rate cuts.
The rise of gold ETFs since the 21st century has significantly increased gold investment demand, attracting a large number of retail and institutional investors. The continuous inflow of funds has provided strong momentum for the rise in gold prices. Excluding the impact of gold ETFs, the only meaningful rate cut cycle to refer to is in 2019. In the short term, during the rate cuts from August to October 2019, gold rose significantly after the first rate cut, followed by a two-month period of oscillation and pullback. In the longer term, gold continued to show an upward trend after the rate cuts.
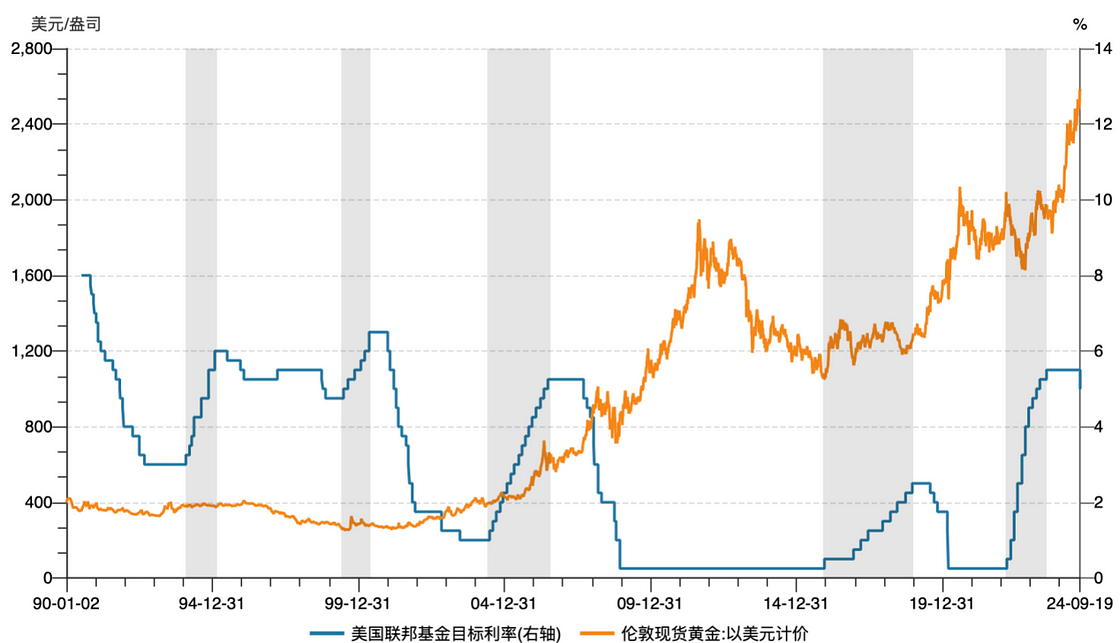
Federal Reserve Rate Cycle and Gold Prices
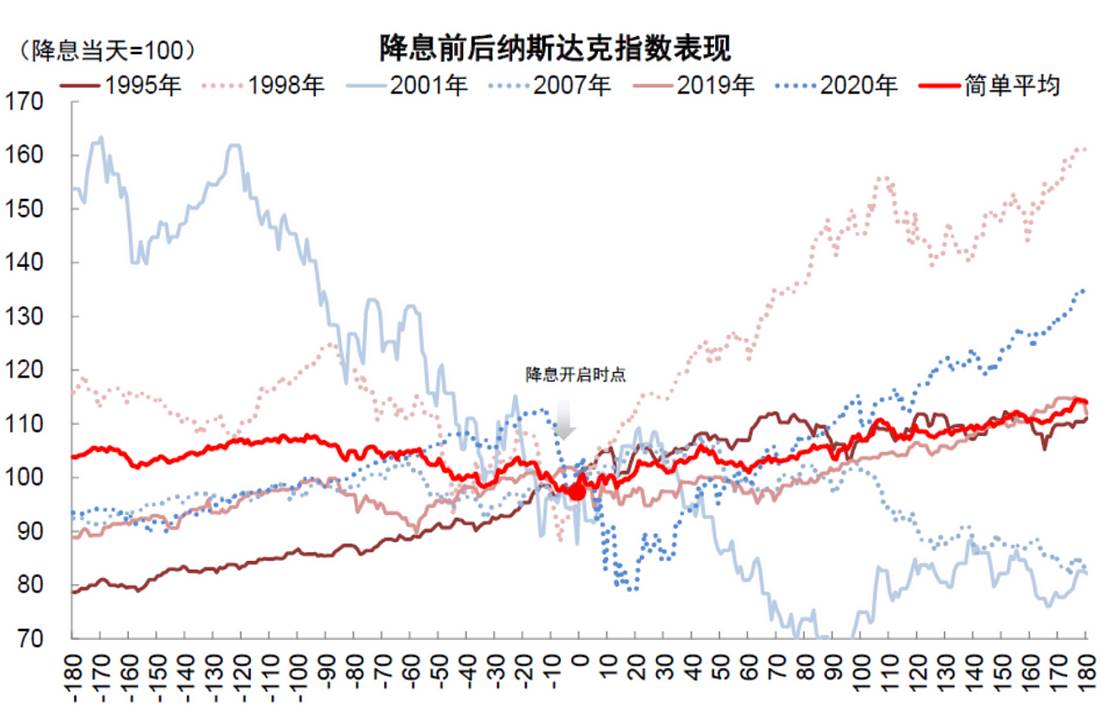
Nasdaq
The performance of the Nasdaq during recessionary rate cuts depends on the recovery of the fundamentals. Overall, the Nasdaq mostly showed a downward trend during recessionary rate cut cycles, except for a 28% increase in the extended rate cut cycle in 1989. In the rate cut cycles of 2001, 2007, and 2020, the Nasdaq fell by 38.8%, 40%, and 20.5% respectively. After the first preventive rate cut by the Federal Reserve, the short-term performance varied in different years, but the long-term trend was upward, indicating that preventive rate cuts often have a positive effect on the economy, reversing signs of weakness and driving the stock market up. Therefore, the key to judging the trend of the Nasdaq index lies in understanding the possibility of a recession. In the 2019 rate cuts, the Nasdaq experienced a pullback after the first and second rate cuts, showing an overall oscillating trend in the three months of rate cuts, and then began a major upward trend around the time of the third rate cut.
BTC
During the rate cut cycle in 2019, BTC briefly rose in price after the first rate cut, and then overall entered a downward trend. The overall retracement from the top lasted 175 days, with a pullback of about 50% (excluding the subsequent impact of the pandemic). The difference from the previous rate cut cycle is that due to the fluctuating rate cut expectations, the pullback for BTC came earlier this year. Since reaching its peak in March 2020, BTC has been oscillating and pulling back for a total of 189 days, with a maximum retracement of about 33%. Based on historical experience, there is a possibility of short-term oscillation or pullback after a long-term bullish market, but the intensity and duration of the pullback are expected to be smaller and shorter compared to 2019.
免责声明:本文章仅代表作者个人观点,不代表本平台的立场和观点。本文章仅供信息分享,不构成对任何人的任何投资建议。用户与作者之间的任何争议,与本平台无关。如网页中刊载的文章或图片涉及侵权,请提供相关的权利证明和身份证明发送邮件到support@aicoin.com,本平台相关工作人员将会进行核查。


