Most tokens experience significant price increases within 24 hours of listing, usually followed by a pullback starting on the second day.
Author: Simplicity Group
Translation: Deep Tide TechFlow

Recently, Binance's listing of Meme on different spot and contract products has been controversial.
Listing on key CEX is the biggest expectation for many holders to wait for a rise.
However, listing is not always a guaranteed way to make money through qualitative analysis. The specific decisions of when to enter and exit, and which types of tokens to hold, often determine the final profit.
Therefore, you may want to know the answers to the following questions:
Does listing on Binance mean there will definitely be a wealth effect? Do other CEXs not have a wealth effect? When does the wealth effect start to diminish after listing?
You should have a good idea about these questions.
Last week, research institution Simplicity Group (@SimplicityWeb3) used data to analyze the performance of over 30 tokens listed on Binance, OKX, Bybit, Kucoin, Coinbase, Gate, and MEXC, seven common CEXs, one week after listing.
Deep Tide TechFlow has summarized the essence of this 60-page report and presents the key analysis to everyone.

Key Findings
Price Trends
Most tokens experience significant price increases within 24 hours of listing;
A pullback usually begins on the second day;
Tokens on exchanges that experience smaller increases tend to be more stable at higher levels;
Tokens on exchanges that experience large increases often see significant pullbacks afterwards;
Differences Between Exchanges
The price trends of tokens on some exchanges are remarkably similar, while others show greater variation;
The specific reasons for this phenomenon are still uncertain;
Importance of Listing Time for Exchanges
If an exchange lists a token a few hours or days later than other exchanges, the price performance on that exchange tends to be worse;
Outliers
There is a significant difference in the number of outliers among different exchanges;
This indicates that the internal due diligence process of exchanges is crucial to the overall performance of their listed tokens;
Key Recommendations
The reputation of an exchange should not be directly linked to its potential price performance;
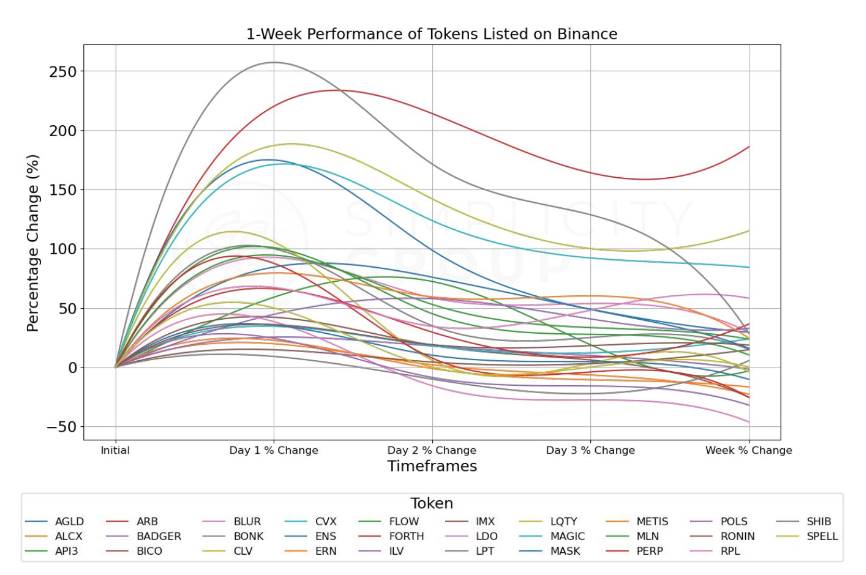
Binance
First Day of Listing Performance
The vast majority of tokens experienced significant gains on the first day of listing;
The average increase was about 66%, with some tokens even exceeding 200%;
This phenomenon may be due to the high attention and investment enthusiasm when new tokens are listed;
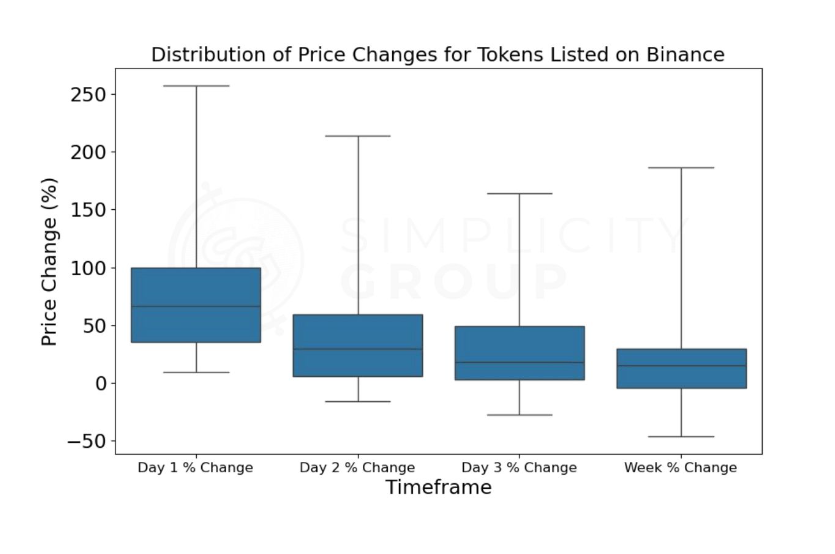
Second Day Market
The rate of price increases began to slow down, and some tokens experienced pullbacks;
The range of price fluctuations expanded, ranging from -15% to +214%;
This may reflect some investors taking profits, while new investors also enter the market;
Trends from the Third Day to One Week
Price fluctuations gradually trended towards stability;
The price change range on the third day was between -27% and +164%;
By the end of the week, most tokens still maintained positive growth, with a median increase of about 15%;
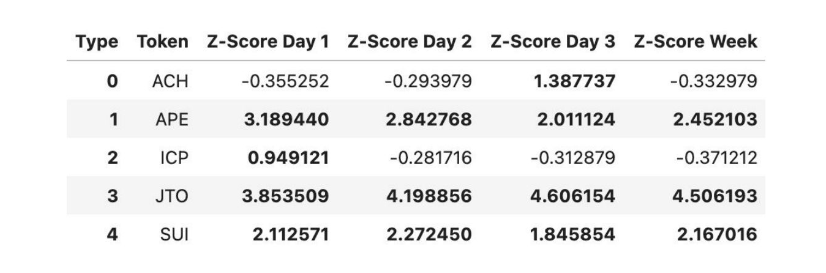
Tokens with Exceptional Performance
A few tokens such as BONK, APE, ICP, JTO, and SUI showed exceptionally large price fluctuations;
The performance of these tokens deviated significantly from the average level and may require separate analysis of the reasons behind it;
Price Change Distribution
The most drastic price changes occurred on the first day, with a median increase of 66.15%;
In the following days, the magnitude and range of price changes gradually decreased;
This indicates that the market's valuation of new tokens gradually tends towards rationality;
Overall Trend Observation
Tokens listed on Binance generally exhibit a "rise first, then stabilize" trend;
The high initial increase in token prices often cannot be sustained, but most tokens still maintain positive growth after one week;
Prices gradually stabilize after experiencing initial drastic fluctuations;
Investor Insights
There may be short-term profit opportunities in the initial listing, but they come with high risks;
Token prices may experience significant fluctuations in the first week after listing, so investors need to be prepared;
For long-term investors, it may be necessary to wait for price stability before making decisions;
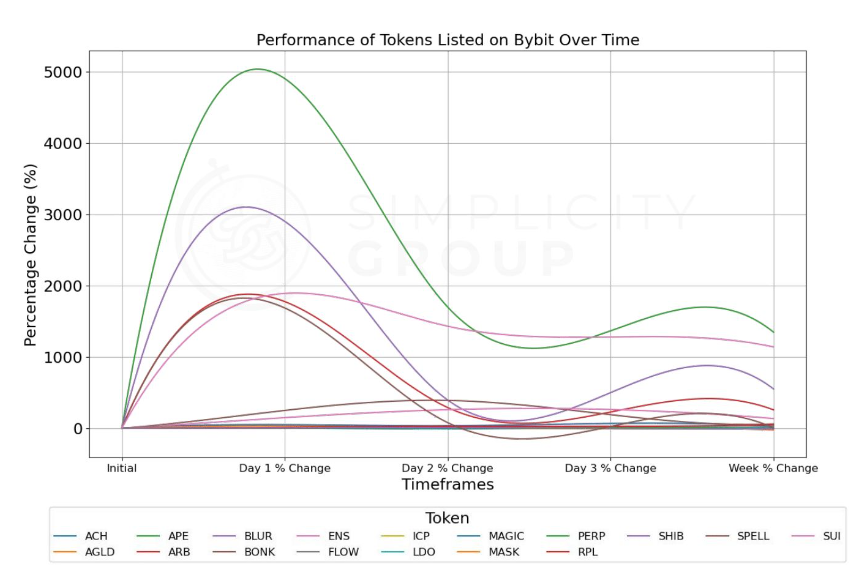
Bybit
First Day of Listing Performance
The average increase was as high as 806.34%, but this number was significantly influenced by a few tokens with outstanding performance;
The median increase was 45.71%, which better represents the typical performance of tokens;
25% of tokens saw increases exceeding 1685.71%, demonstrating the remarkable performance of some tokens;
The highest increase reached 4900%, while the lowest was 0.94%, showing significant differences in performance;
Second Day Market
The rate of price increases significantly slowed down, with the average increase dropping to 273.04%;
The median increase dropped to 27.37%, indicating that most tokens could not maintain the high increase from the first day;
The range of price changes expanded, with the lowest at -9.51% and the highest still reaching 1698%;
Volatility remained high but decreased compared to the first day;
Trends from the Third Day to One Week
The average increase further dropped to 234.88% on the third day, with a median of 25%;
After one week, the average increase was 207.56%, with the median dropping to 16.96%;
Price fluctuations gradually trended towards stability but remained relatively high;
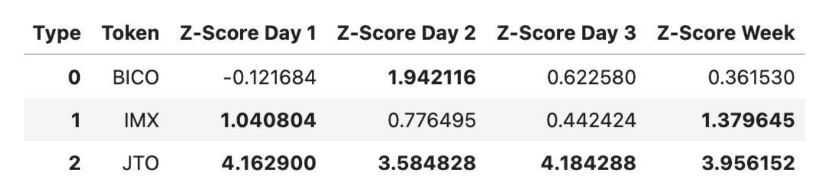
Tokens with Exceptional Performance
JTO stood out, maintaining exceptionally high Z-scores throughout the observation period;
IMX also performed well, especially on the first day and after one week;
BICO saw a significant peak on the second day, but then fell back;
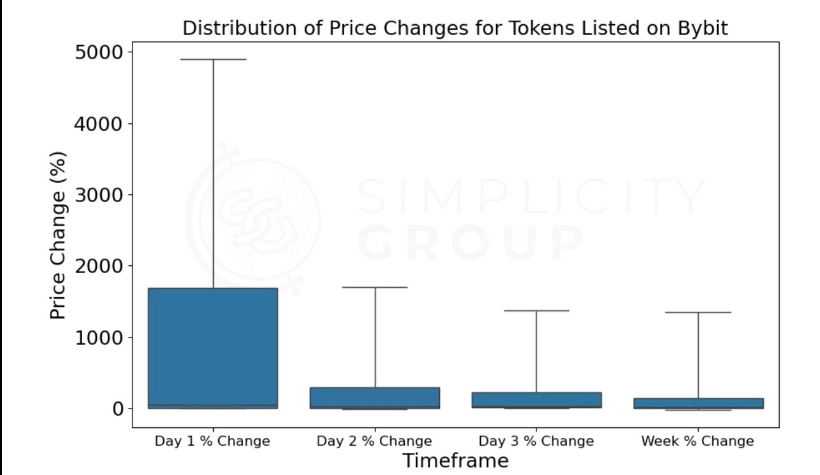
Price Change Distribution
The most drastic price changes occurred on the first day, with the majority of tokens (the middle 50%) seeing increases between 4.6% and 1685.7%;
In the following days, the magnitude and range of price changes gradually decreased;
By the end of the week, 75% of tokens still maintained positive growth, showing an overall positive trend;
Overall Trend Observation
Tokens listed on Bybit generally exhibit a "high rise, then decline" trend but still maintain at relatively high levels;
The high initial increase in token prices is difficult to sustain, but most tokens still maintain positive growth after one week;
Price volatility decreases over time but remains higher than the regular market;
Investor Insights
First Day of Listing
There may be significant short-term profit opportunities on the first day of listing, but the corresponding risks are also high;
Investors need to be cautious of significant price fluctuations in the short term;
For long-term investors, it may be necessary to wait for price stability before making decisions;
Data Limitations
The analysis is based on a limited sample of 17 tokens, which may not fully represent all tokens listed on Bybit;
The exceptional performance of some tokens (such as JTO and IMX) significantly influences the overall data and requires careful interpretation of the average values;
Missing data for some tokens may affect the comprehensiveness of the analysis;
OKX
First Day of Listing Performance
The average increase was 59.33%;
The median increase was 39.13%, representing the typical performance of tokens;
25% of tokens saw increases exceeding 74.06%;
The highest increase reached 292%, while the lowest was 0%, showing significant performance differences;
Second Day Market
The rate of price increases slowed down, with the average increase dropping to 36.94%;
The median increase dropped to 26.85%, indicating that most tokens could not maintain the high increase from the first day;
The range of price changes expanded, with the lowest at -17.20% and the highest at 212%;
Volatility still exists but decreased compared to the first day;
Trends from the Third Day to One Week
The average increase further dropped to 32.98% on the third day, with a median of 25.91%;
After one week, the average increase was 32.52%, with the median dropping to 20.95%;
Price fluctuations gradually trended towards stability, maintaining relatively stable positive growth;
Tokens with Exceptional Performance
IMX stood out, maintaining exceptionally high Z-scores throughout the observation period;
BICO saw a significant peak on the second day, but then fell back;
BLUR also showed high volatility but remained within statistically normal ranges;
Overall Trend Observation
Tokens listed on OKX generally exhibit a relatively stable growth trend;
Although the initial increase in token prices is not as extreme as Bybit, it is still considerable;
Price volatility decreases over time, showing good stability;
Investor Insights
There are profit opportunities on the first day of listing with relatively low risk;
Investors need to pay attention to significant price fluctuations in the short term, but the overall volatility is lower than Bybit;
For long-term investors, tokens listed on OKX may provide more stable growth opportunities;
Data Limitations
IMX's performance is particularly outstanding, with an initial increase of over 100,000%;
Tokens such as IMX, AGLD, APE, BICO, BLUR, SUI, ENS, and SHIB were removed due to exceptional performance, which may affect the analysis of extreme cases;
Kucoin
1. First Day of Listing Performance
The average increase was 100.27%, with a median increase of 57.76%, representing the typical performance of tokens;
25% of tokens saw increases exceeding 135.95%;
The highest increase reached 425%, while the lowest was 0%, showing significant performance differences;
2. Second Day Market
The rate of price increases slowed down, with the average increase dropping to 82.54%;
The median increase dropped to 44.58%, indicating that most tokens could not maintain the high increase from the first day;
The range of price changes expanded, with the lowest at -2.47% and the highest at 435.14%;
Volatility still exists but decreased compared to the first day;
3. Trends from the Third Day to One Week
The average increase further dropped to 67.59% on the third day, with a median of 40.68%;
After one week, the average increase was 61.96%, with the median dropping to 48.49%;
Price fluctuations gradually trended towards stability, but remained relatively high;
4. Tokens with Exceptional Performance
MASK showed exceptional performance on the first day, with a Z-score of 5.47;
JTO showed outstanding performance after the second day, with a Z-score consistently above 5;
These outliers significantly influenced the overall data distribution;
5. Price Change Distribution
The most drastic price changes occurred on the first day, with 25% to 75% of tokens seeing increases between 39.98% and 135.95%;
In the following days, the magnitude of price changes gradually decreased;
By the end of the week, 75% of tokens still maintained increases of over 83.50%;
6. Overall Trend Observation
Tokens listed on KuCoin generally exhibit a "high rise, high walk" trend;
Although the initial increase in token prices is difficult to sustain, most tokens still maintain considerable positive growth after one week;
Price volatility decreases over time but remains at relatively high levels;
7. Investor Insights
There are significant short-term profit opportunities on the first day of listing, with an average increase of over 100%;
Investors need to be cautious of significant price fluctuations in the short term, especially the possible pullback on the second day;
After one week, prices still maintain relatively high levels, potentially providing good holding returns for long-term investors;
8. Data Limitations
The analysis involves 26 tokens, and the exceptional performance of some tokens (such as MASK and JTO) significantly influences the overall data, requiring careful interpretation of the average values;
Analysis after removing some outliers may underestimate the probability of extreme cases occurring;
Coinbase
First Day of Listing Performance
The average increase was 24.41%; the median increase was 3.90%, showing that most tokens had relatively moderate increases;
25% of tokens saw increases exceeding 16.68%;
The highest increase reached 268.36%, while the lowest was 0%, showing significant performance differences;
Second Day Market
The rate of price increases slightly improved, with the average increase rising to 26.21%;
The median increase rose to 5.96%, indicating overall improvement in performance;
The range of price changes expanded, with the lowest at -31.51% and the highest at 209.16%;
Volatility is still high but more dispersed than the first day;
Trends from the Third Day to One Week
The average increase dropped to 10.87% on the third day, with a median of -0.15%;
After one week, the average decrease was 1.87%, with a median decrease of 4.36%;
Price fluctuations gradually trended towards stability but showed an overall downward trend;
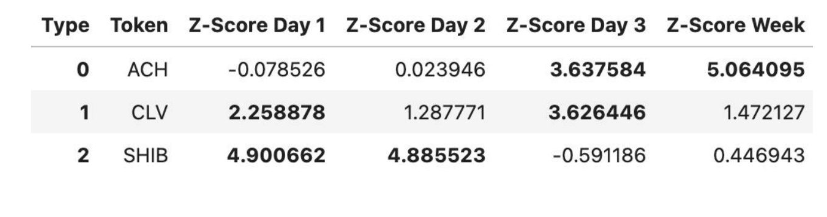
Tokens with Exceptional Performance
ACH showed outstanding performance on the third day and after one week, with Z-scores of 3.64 and 5.06, respectively (a higher Z-score indicates abnormal price compared to other tokens);
CLV showed outstanding performance on the first and third days, with Z-scores of 2.26 and 3.63, respectively;
SHIB exhibited exceptional performance on the first two days, with Z-scores close to 5;
Price Change Distribution
The most drastic price changes occurred on the first day, with 25% to 75% of tokens seeing increases between 1.28% and 16.68%;
The range of price changes expanded on the second day, with 25% to 75% of tokens seeing increases between -0.52% and 17.98%;
By the end of the week, 75% of tokens saw decreases of no more than 6.20%;
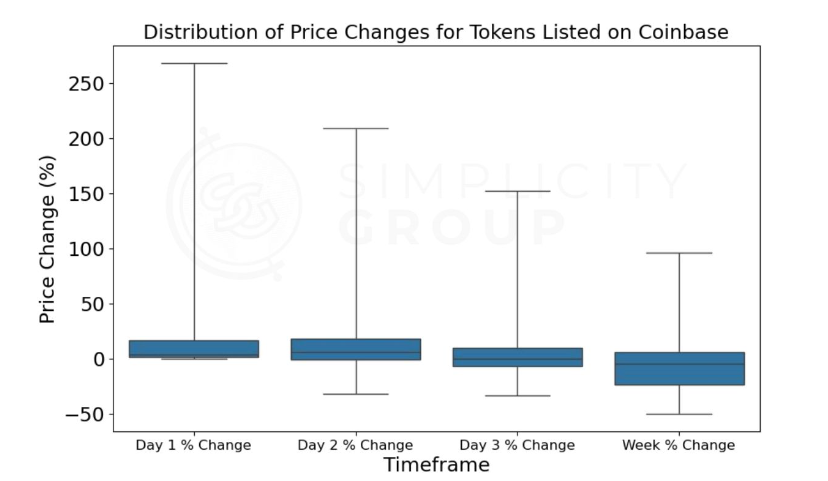
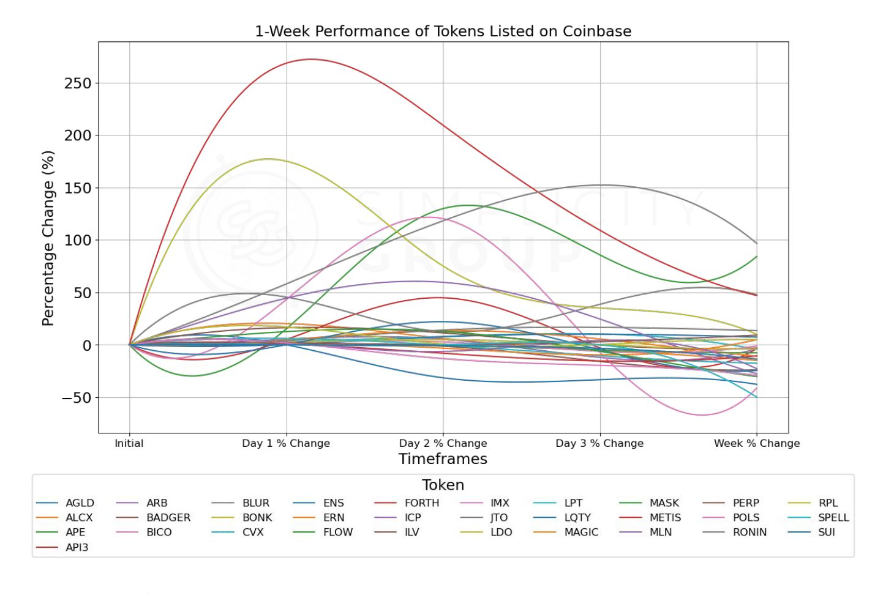
Overall Trend Observation
Tokens listed on Coinbase exhibited a "rise and fall" trend after listing;
The initial price increases were relatively moderate, possibly related to Coinbase's delayed listing strategy;
Price volatility decreased over time but the overall trend turned downward;
Investor Insights
There are profit opportunities on the first and second days of listing, but the increases are relatively moderate compared to other exchanges;
Investors need to be cautious of significant price fluctuations in the short term, especially the potential decline after the third day;
For long-term investors, prices after one week generally approached or were lower than the listing price, requiring careful evaluation;
Specifics of Coinbase
Coinbase employs a delayed listing strategy, possibly to minimize volatility and comply with regulatory requirements;
This strategy may result in initial token prices on Coinbase being higher than on other exchanges, affecting short-term performance;
The case of the APE token shows that Coinbase's delayed listing may lead to significant differences in price performance compared to other exchanges;
Data Limitations
The analysis is based on a sample of 31 tokens, with some exceptional performing tokens (such as ACH, CLV, and SHIB) significantly influencing the overall data, requiring careful interpretation;
Coinbase's delayed listing strategy may result in incomparable data;
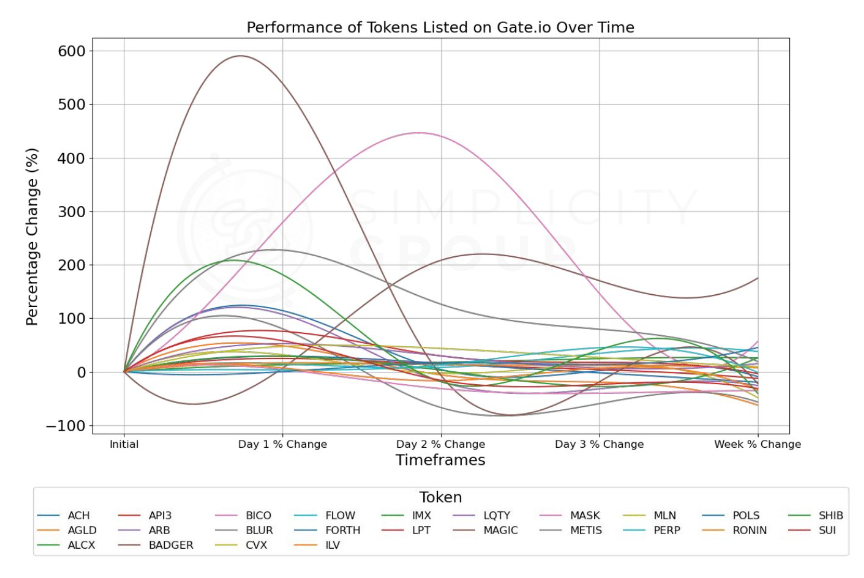
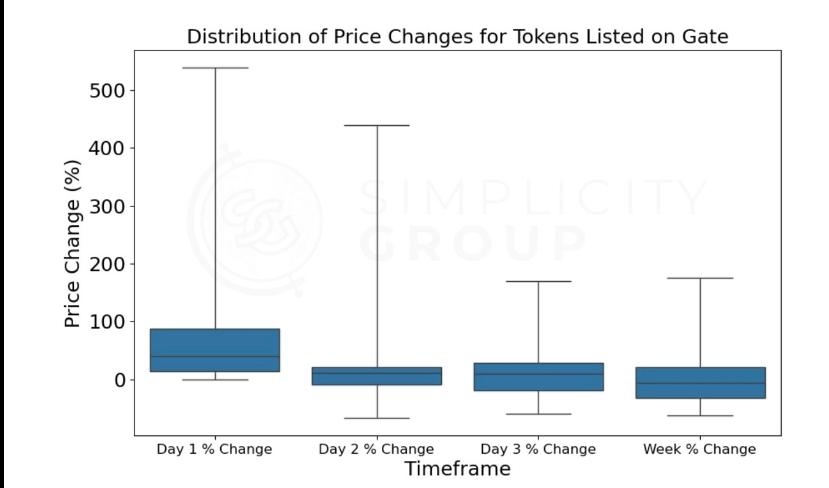
Gate.io
First Day of Listing Performance
The average increase was 82.88%; the median increase was 39.46%, showing significant increases for most tokens;
75% of tokens saw increases exceeding 14.19%;
The highest increase reached 538.89%, while the lowest was 0%, showing significant performance differences;
Second Day Market
The rate of price increases slightly declined, with the average increase dropping to 33.18%;
The median increase dropped to 10.35%, indicating an overall decline in performance;
The range of price changes expanded, with the lowest at -67.00% and the highest at 440.00%;
Volatility remained high but decreased compared to the first day;
Trends from the Third Day to One Week
The average increase dropped to 17.44% on the third day, with a median of 9.50%;
After one week, the average increase was 0.54%, with a median decrease of 6.35%;
Price fluctuations gradually trended towards stability but showed an overall downward trend;
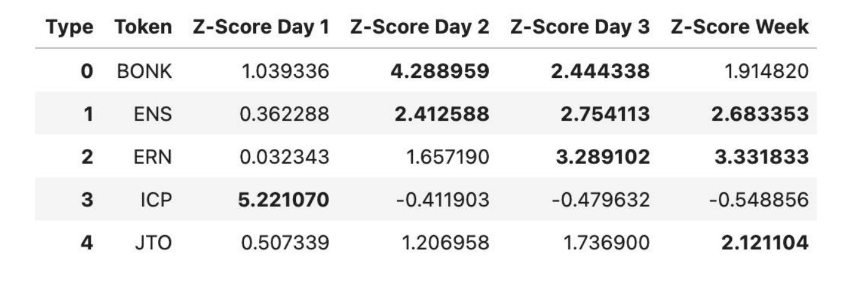
Tokens with Exceptional Performance
ICP exhibited exceptional performance on the first day, with a Z-score of 5.22;
BONK showed outstanding performance on the second day, with a Z-score of 4.29;
ERN exhibited exceptional performance on the third day and after one week, with Z-scores of 3.29 and 3.33, respectively;
Price Change Distribution
The most drastic price changes occurred on the first day, with 25% to 75% of tokens seeing increases between 14.19% and 87.06%;
The range of price changes narrowed on the second day, with 25% to 75% of tokens seeing increases between -9.01% and 20.65%;
By the end of the week, 75% of tokens saw decreases of no more than 20.62%;
Overall Trend Observation
Tokens listed on Gate.io exhibited a trend of strong initial increases followed by declines;
The initial price increases were very strong, but quickly declined thereafter;
Price volatility decreased over time but the overall trend turned downward;
Investor Insights
There are significant short-term profit opportunities on the first day of listing, with an average increase of over 80%;
Investors need to be cautious of significant price fluctuations in the short term, especially the significant pullback that may occur on the second day;
For long-term investors, prices after one week generally approached or were lower than the listing price, requiring careful evaluation;
Specifics of Gate.io
Tokens listed on Gate.io initially exhibited strong performance but also faced significant downside risks;
About 29.4% of tokens were classified as outliers, indicating significant differences in token performance on Gate.io;
After removing outliers, the performance of the remaining tokens was closer to the "average" level, but may underestimate the probability of extreme cases occurring;
Data Limitations
The original sample included 34 tokens, but the analysis mainly focused on 24 tokens after removing outliers;
The presence of a large number of outliers may result in the analysis not fully reflecting the true situation;
Consideration needs to be given to the possibility of Gate.io having a special listing strategy or market characteristics that affect token performance;
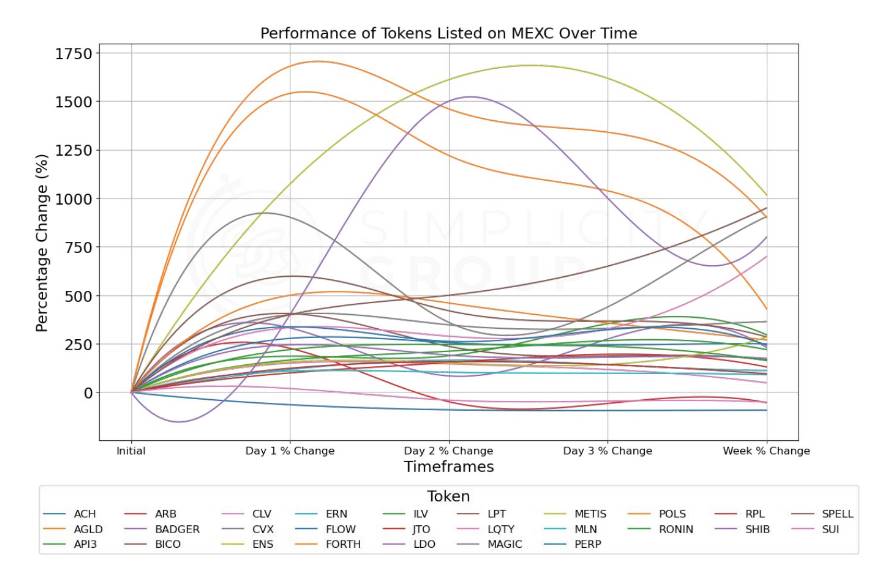
MEXC
First Day of Listing Performance
The average increase was 405.09%; the median increase was 277.90%, showing significant increases for most tokens;
75% of tokens saw increases exceeding 153.32%;
The highest increase reached 1680.0%, while the lowest decrease was 64.0%, showing significant performance differences;
Second Day Market
The rate of price increases slightly declined, with the average increase dropping to 390.49%;
The median increase dropped to 236.67%, but remained high;
The range of price changes expanded, with the lowest at -90.0% and the highest at 1610.8%;
Volatility remained high but decreased slightly compared to the first day;
Trends from the Third Day to One Week
The average increase dropped to 376.98% on the third day, with a median of 266.63%;
After one week, the average increase was 330.83%, with the median dropping to 242.50%;
Price fluctuations gradually trended towards stability but remained at high levels;
Tokens with Exceptional Performance
BLUR exhibited exceptional performance on the first day, with a Z-score of 3.35;
BONK showed outstanding performance on the third day, with a Z-score of 3.84;
IMX exhibited exceptional performance after one week, with a Z-score of 4.44;
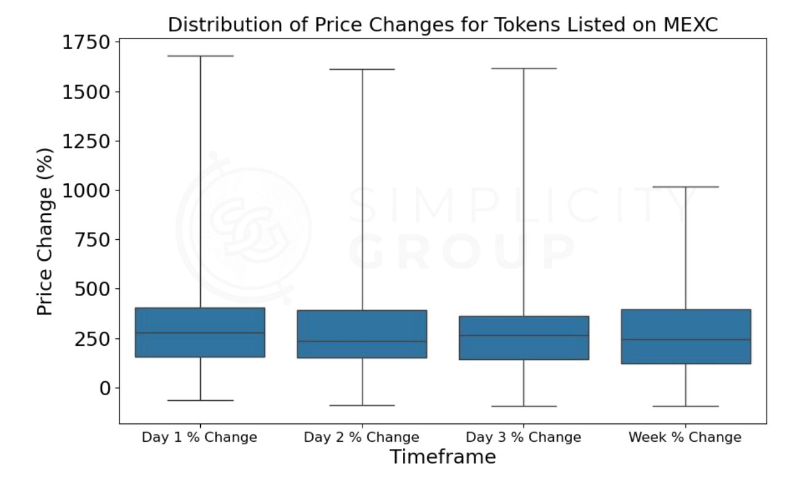
Price Change Distribution
The most drastic price changes occurred on the first day, with 25% to 75% of tokens seeing increases between 153.32% and 402.98%;
The range of price changes narrowed slightly on the second day, with 25% to 75% of tokens seeing increases between 152.28% and 390.00%;
By the end of the week, 75% of tokens saw increases of no less than 121.33%;
Overall Trend Observation
Tokens listed on MEXC exhibited a trend of sustained strong upward performance after listing;
The initial price increases were extremely strong, followed by a slight decline but still maintaining high levels;
Price volatility decreased over time but remained significantly upward;
Investor Insights
There are significant short-term profit opportunities on the first day of listing, with an average increase of over 400%;
Investors need to be cautious of significant price fluctuations in the short term, but the overall trend is strong;
For long-term investors, prices after one week generally remained higher than the listing price, indicating sustained market interest;
Specifics of MEXC
Tokens listed on MEXC initially exhibited extremely strong performance, and this strong performance lasted for a relatively long time;
Even after one week, most tokens still maintained significant increases, indicating that MEXC may have a unique market environment or user base;
Compared to other exchanges, tokens listed on MEXC exhibited more sustained upward momentum;
Data Limitations
The analysis is based on a sample of 27 tokens, and some tokens (such as SHIB) may have outliers due to data processing issues, requiring careful interpretation;
The extremely high increases and duration may reflect the special market environment of MEXC, which may not necessarily apply to other exchanges;
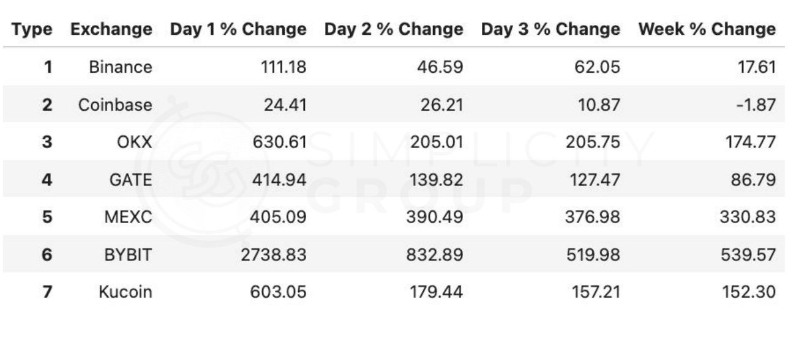
Comparison of Various Exchanges
Overall Performance Ranking (Average Increase after One Week)
ByBit (539.57%)
MEXC (330.83%)
Kucoin (152.30%)
OKX (174.77%)
GATE (86.79%)
Binance (17.61%)
Coinbase (-1.87%)
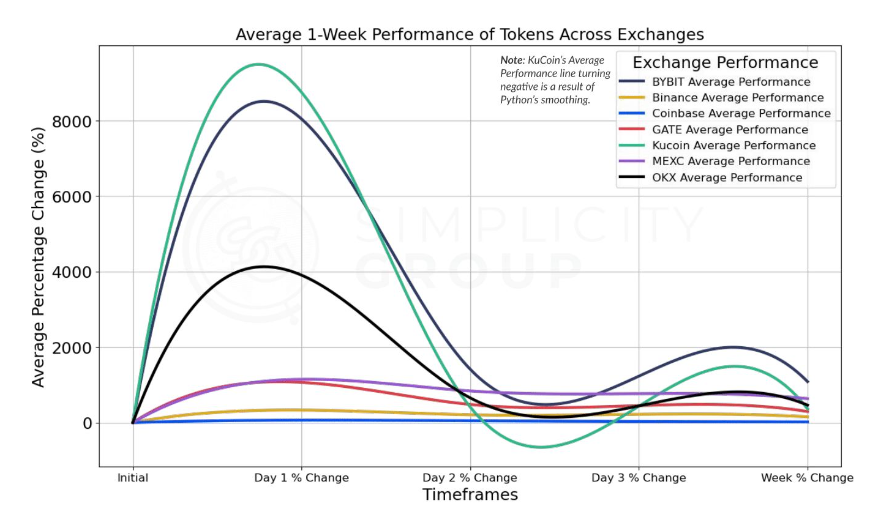
First Day Performance
ByBit showed the most outstanding performance, with an average increase of up to 2738.83%;
OKX and Kucoin followed closely with 630.61% and 603.05% respectively;
GATE and MEXC also exhibited strong performance, with 414.94% and 405.09% respectively;
Binance and Coinbase showed relatively conservative performance, with 111.18% and 24.41% respectively;
Price Fluctuation Trends
ByBit: Extremely high initial increase, followed by a rapid decline, but still maintained at high levels;
OKX and Kucoin: Significant initial increase, followed by a large decline;
MEXC: High initial increase, followed by a relatively slow decline, maintaining at high levels;
GATE: Showed a moderate but sustained upward trend;
Binance and Coinbase: Relatively small fluctuations, with a stable trend;
Sustainability
MEXC exhibited the best sustainability, maintaining high increases from the first day to one week later;
Although ByBit had the highest initial increase, the decline was also the most drastic;
OKX and Kucoin showed strong initial performance but struggled to maintain high increases;
GATE demonstrated stable moderate-level performance;
Binance and Coinbase had relatively low fluctuations, but limited overall increases;
Risk and Volatility
ByBit showed the highest risk and volatility;
OKX, Kucoin, and MEXC also exhibited high volatility;
GATE had a moderate level of volatility;
Binance and Coinbase had the lowest volatility, with relatively lower risk;
Special Observations
Even after removing outliers, the performance differences among various exchanges remained significant;
The extreme performance of ByBit may reflect its special listing strategy or user base;
MEXC showed outstanding sustainability;
Binance and Coinbase may focus more on the initial listing of mainstream tokens, hence their relatively conservative performance;
Investor Insights
Short-term speculators may be attracted by the high initial increases on ByBit, OKX, and Kucoin;
Mid-term investors may favor MEXC for its good sustainability;
Risk-averse investors may choose Binance or Coinbase;
GATE may be suitable for investors seeking a balance between risk and return;
Note: All data in this article represents the views of the original report author and does not represent the views of TechFlow.
Read the original English version of the report here: Click here
免责声明:本文章仅代表作者个人观点,不代表本平台的立场和观点。本文章仅供信息分享,不构成对任何人的任何投资建议。用户与作者之间的任何争议,与本平台无关。如网页中刊载的文章或图片涉及侵权,请提供相关的权利证明和身份证明发送邮件到support@aicoin.com,本平台相关工作人员将会进行核查。


