Author: Biteye, Core Contributor: Viee
The Bitcoin cycle theory, especially its association with the Bitcoin halving event, has long been regarded as an important tool for predicting the price trend of Bitcoin. Historically, Bitcoin halving has often led to price increases, but the current market performance and the factors behind it suggest that the effectiveness of this theory may be weakening.
This article will review the four Bitcoin cycles from 2011 to 2024 and delve into the market changes in the current cycle.
01. The Basis of the Bitcoin Cycle Theory
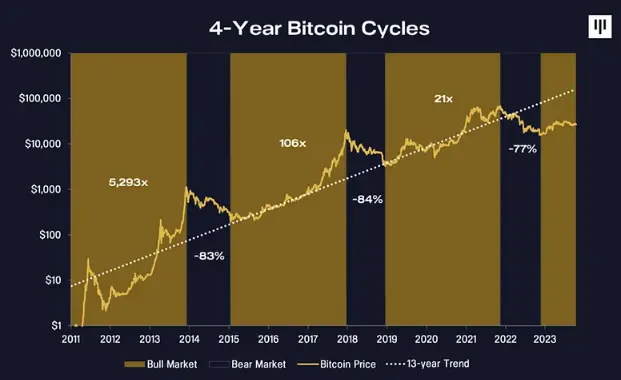
The mining reward for Bitcoin decreases by half every 210,000 blocks, approximately every four years. This mechanism aims to control the supply of Bitcoin, thereby increasing its scarcity. Historically, halving events have been accompanied by significant increases in the price of Bitcoin, forming cycles. For example:
- 2012 Halving: Bitcoin's price surged from about $12 to over $1000 by the end of 2013.
- 2016 Halving: Shortly after the halving, the price of Bitcoin rose to nearly $3000 and reached a historical high of nearly $20,000 by the end of 2017.
- 2020 Halving: Following the halving in May 2020, the price of Bitcoin quickly rose to a new historical high in 2021.
After the halving events in 2012, 2016, and 2020, the price of Bitcoin experienced significant increases, forming clear bull market cycles. These historical data have led to widespread recognition and trust in the Bitcoin cycle theory.
The current cycle completed its fourth Bitcoin halving on April 20, 2024, but the post-halving performance has not met expectations.
02. Price Data After Halving
If we align the historical dates of Bitcoin halving on the same axis and compare the subsequent prices with the price on the halving day, we can see that the performance of the current cycle is the worst.
Despite breaking new cyclical historical highs before the April halving event, the current cycle's performance remains relatively lackluster.
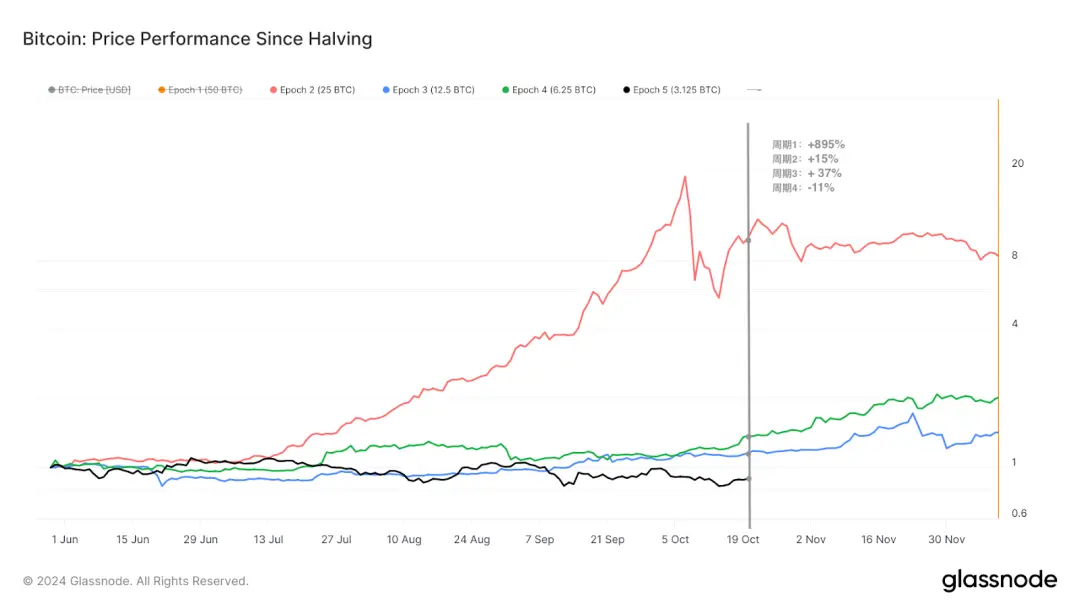
Source: Glassnode
Here are the price changes around 144 days after each halving (compared to the price on the halving day):
- Cycle 1: +895%
- Cycle 2: +15%
- Cycle 3: +37%
- Cycle 4: -11%
The current cycle has shown weaker price reactions after halving compared to previous cycles, indicating poor price performance for Bitcoin. What are the differences between this cycle and previous ones?
03. Bitcoin Trending Towards Stability
The Bitcoin cycle from 2023 to 2024 shares some similarities with previous cycles but also exhibits significant differences.
After the collapse of FTX at the end of 2022, the market experienced about 18 months of stable price increases. With the approval of the Bitcoin ETF, new funds continued to pour in, and after reaching a high of $73,000, the market entered a three-month period of range oscillation.
During this period, from May to July, the price of Bitcoin experienced the deepest cyclical correction, with a pullback of over 26%. Although this decline was significant, it was shallower compared to previous cycles, and the volatility also decreased, reflecting a relatively stable market structure for Bitcoin as a financial asset compared to before.
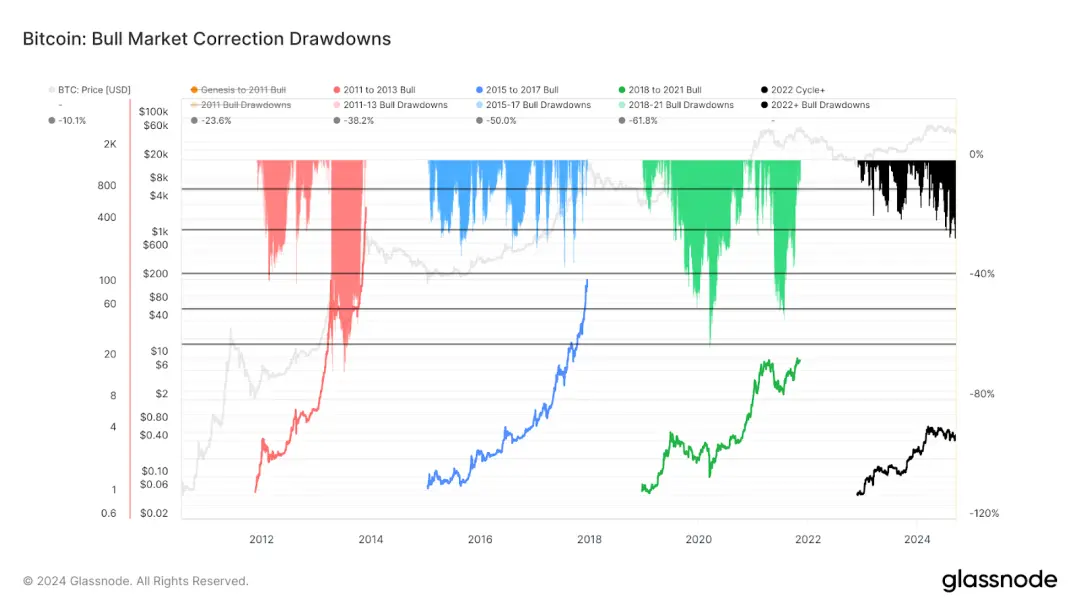
Source: Glassnode
Let's take a look at another technical indicator, the MVRV Z-score, which also reveals differences in the performance of the Bitcoin market in different cycles.
First, the MVRV-Z score is a relative indicator, calculated as (market capitalization - realized capitalization) / standard deviation (market capitalization). When this indicator is too high, it indicates that the market value of Bitcoin is overestimated relative to its true value, which may not be favorable for the price. Conversely, if the indicator is low, it means that the market value of Bitcoin is undervalued.
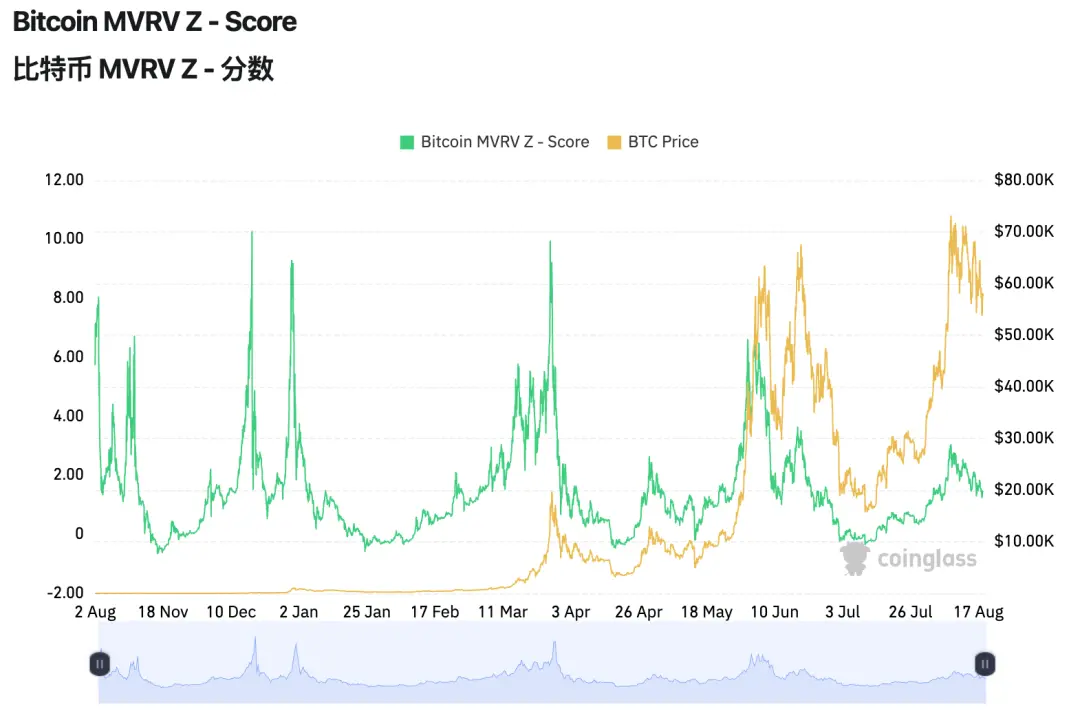
Source: Coinglass
From the data from 2010 to 2024 in the above chart, we can see that compared to previous cycles, the MVRV-Z score (green line) fluctuates, peaks, and returns relatively mildly, unlike in the early stages.
Bitcoin is beginning to trend towards a stable, gradual upward trajectory, rather than the dramatic price surges seen in the past, making this progressive growth pattern more attractive in the long term.
04. Reasons for Decreased Volatility
We can use a data indicator to intuitively explain why Bitcoin's volatility has decreased and trended towards stability.
The Bitcoin 5+ Years HODL Wave indicator shows the percentage of Bitcoin that has not moved on-chain for at least 5 years, sometimes referred to as the supply of Bitcoin last active 5 years ago. To some extent, this reflects the behavior of long-term participants in the market.
Of course, it is also possible that some of these Bitcoins have been lost, meaning that users can no longer access the private keys to wallets containing Bitcoin, but this proportion is relatively small.
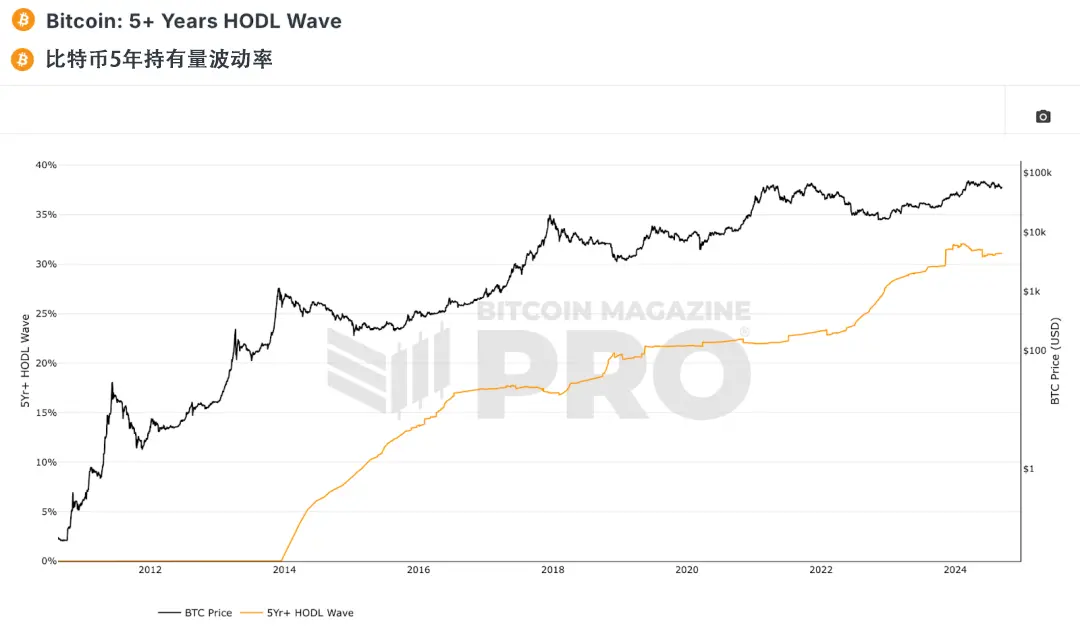
From the chart, it can be seen that currently, over 30% of Bitcoin has not changed hands in the past five years, and this proportion may continue to rise.
This phenomenon has led to a reduction in the circulating supply of Bitcoin in the market, and its impact has exceeded the decrease in supply brought about by the halving event.
This means that the trend of long-term holding of Bitcoin is significantly increasing, enabling the market to better withstand short-term fluctuations. It may also weaken the cyclical volatility of Bitcoin, which is one of the reasons for the decreased volatility of Bitcoin.
Other factors can also be attributed to the increasing number of investors choosing to hold Bitcoin for the long term, reducing the circulating supply and dampening price volatility.
Furthermore, changes in the supply and demand relationship for Bitcoin, continuous inflows of funds providing support for the price, global economic uncertainty, policy changes, and market sentiment are all factors that can affect the price of Bitcoin.
In this scenario, the price of Bitcoin may become more correlated with the trends in traditional financial markets, thereby reducing its independent volatility.
These reasons combined have led to the relatively mild volatility of Bitcoin's price in the current cycle.
05. Conclusion
Compared to historical cycles, the current cycle has shown smaller price pullbacks, a relatively robust market structure, and decreased volatility in the price of Bitcoin.
Therefore, when trading Bitcoin, relying solely on the analysis of market cycles is not enough. On one hand, historical data cannot predict future trends. On the other hand, the cryptocurrency market will gradually move towards market standardization, leading to enhanced liquidity and larger-scale applications, which is a natural result of financial development.
免责声明:本文章仅代表作者个人观点,不代表本平台的立场和观点。本文章仅供信息分享,不构成对任何人的任何投资建议。用户与作者之间的任何争议,与本平台无关。如网页中刊载的文章或图片涉及侵权,请提供相关的权利证明和身份证明发送邮件到support@aicoin.com,本平台相关工作人员将会进行核查。


