This article will sort out and interpret the recent market crash.
The 85% plunge in the cryptocurrency market on Monday caught most people off guard. Compared to the recent events in the market and the US government's selling of coins, this plunge was more sudden, without any obvious warning signals from the news. The market sentiment became extremely panicked, and the fear and greed index dropped to the freezing point of 17. Fortunately, after the opening of the US stock market on Monday night, the trend remained stable, and the expected downward circuit breaker did not occur. The daily chart of BTC steadily closed above $54,000 and slowly recovered throughout Tuesday, stabilizing around $56,000. As more events and clues become clearer, we can better review the entire downturn event. This article will also sort out and interpret the recent market crash.
Introduction
Before this event, the market had already entered a special state. With the 100% certainty of the US interest rate cut in September, the interest rate cut expectation is no longer the main influencing factor in the market, and the cryptocurrency industry has been in a situation of falling with the US stock market since March of this year.
In the short term, the US stock market is trading earnings expectations. Recently, MicroStrategy, a company related to cryptocurrency, released its latest financial report, with earnings lower than market expectations; Coinbase's second-quarter net profit decreased by 97%, and revenue fell by 11% compared to the previous quarter. In addition, the delay in the release of Nvidia's new chips, Buffett's reduction of Apple holdings, also affected several companies such as Meta, Google, and Microsoft, causing a significant pullback in tech stocks… Since 2016, the US stock market has seen a return rate of 9 times, and many investors have chosen to take profits. Meanwhile, the risk market is still being influenced by many factors: global economic recession, geopolitical wars, the Japanese central bank's interest rate hike, and the US presidential election.
I. Bloodbath of Risk Assets and the Cryptocurrency Market
The US stock market suffered a huge blow due to the non-farm payroll data released last Friday, which was lower than expected, and triggered the Sahm Rule (proposed by Claudia Sahm, an economist at the Federal Reserve: if the three-month moving average unemployment rate rises 0.5 percentage points from its low point last year, it may already be in an economic recession. Since 1970, the accuracy of this indicator has been 100%), causing concerns about an economic recession. The US stock market received a huge impact, evaporating $2.9 trillion in market value at one point.
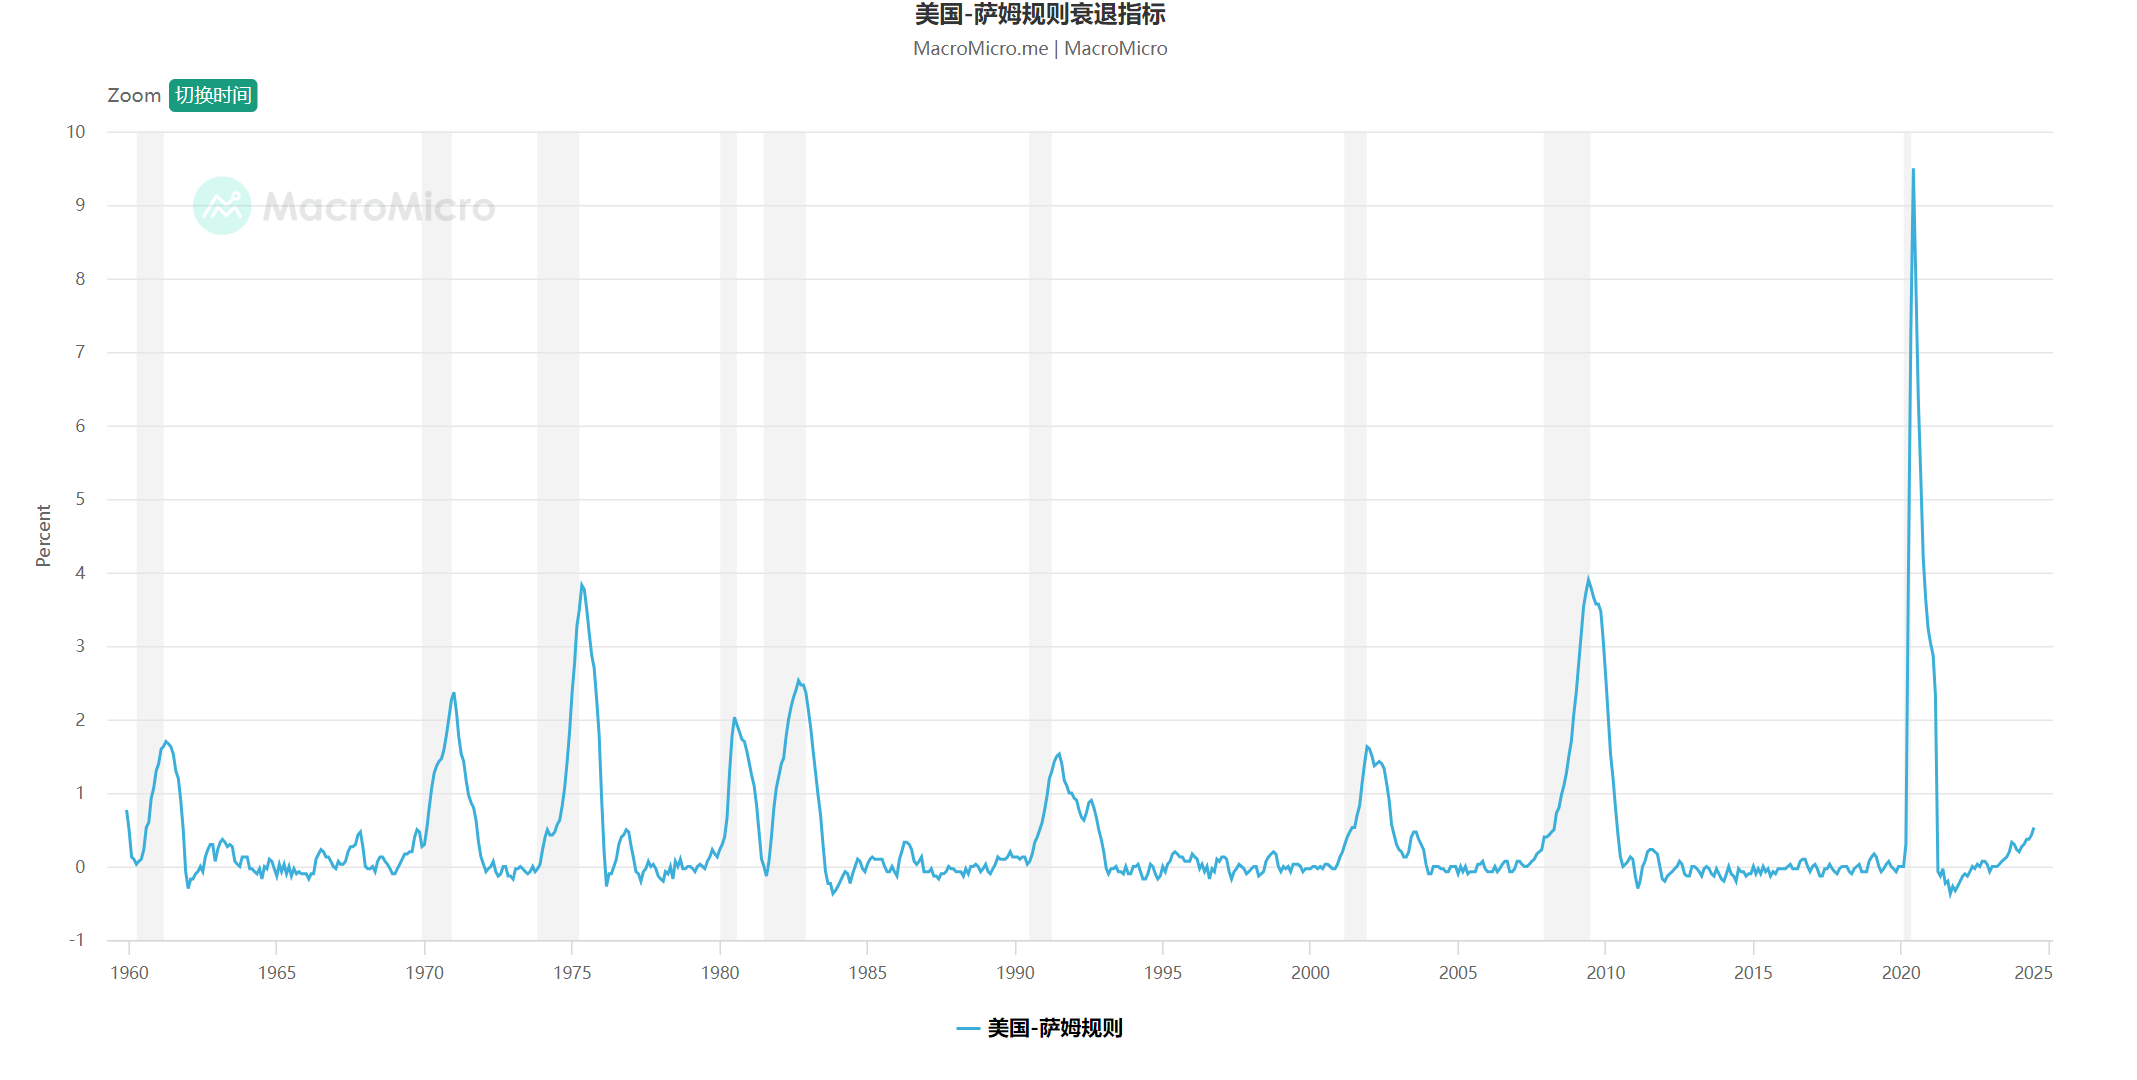
Sahm index data source: MacroMicro
Before the opening on Monday, the US stock market circuit breaker occurred, but due to the time difference, the global stock markets had not yet opened, so the plunge was delayed until Monday.
Attention was also focused on the yen carry trade. Starting from last Wednesday, the US released small non-farm payroll and initial jobless claims data, reflecting the poor macroeconomic situation. In addition, the sudden interest rate hike by the Bank of Japan further deepened the expectation of the depreciation of the US dollar and the appreciation of the yen. Traders were busy unwinding the carry trade of buying other countries' currencies with low-cost yen for high-yield investments, which means selling US stocks or other high-yield assets to increase yen positions, leading to the global sell-off of risk assets.
Performance of Risk Assets
On August 5th, global stock markets experienced a comprehensive decline. The Asian markets were the first to open, with the Japanese and South Korean stocks suffering heavy losses. The Nikkei 225 index in Japan fell more than 20% from its July high, triggering a technical bear market and the futures market circuit breaker. The index fell more than 4000 points in a single day, with a drop of over 12%; the KOSDAQ in South Korea also triggered a circuit breaker after an 8% plunge. The STOXX 600 index in Europe fell by 3%; the FTSE MIB index in Italy fell by over 4%; the DAX index in Germany fell by 3%; the PSI index in Portugal fell by 2.43%; the benchmark stock index in Israel fell by #%; the major stock index in Indonesia fell by 4%; the NSE50 index in the Indian stock market fell by over 3%; the Taiwan stock market plunged by 8%, marking the largest drop since 1967. The global stock markets collapsed like a series of dominoes, causing a stampede.
Performance of Major Cryptocurrency Assets
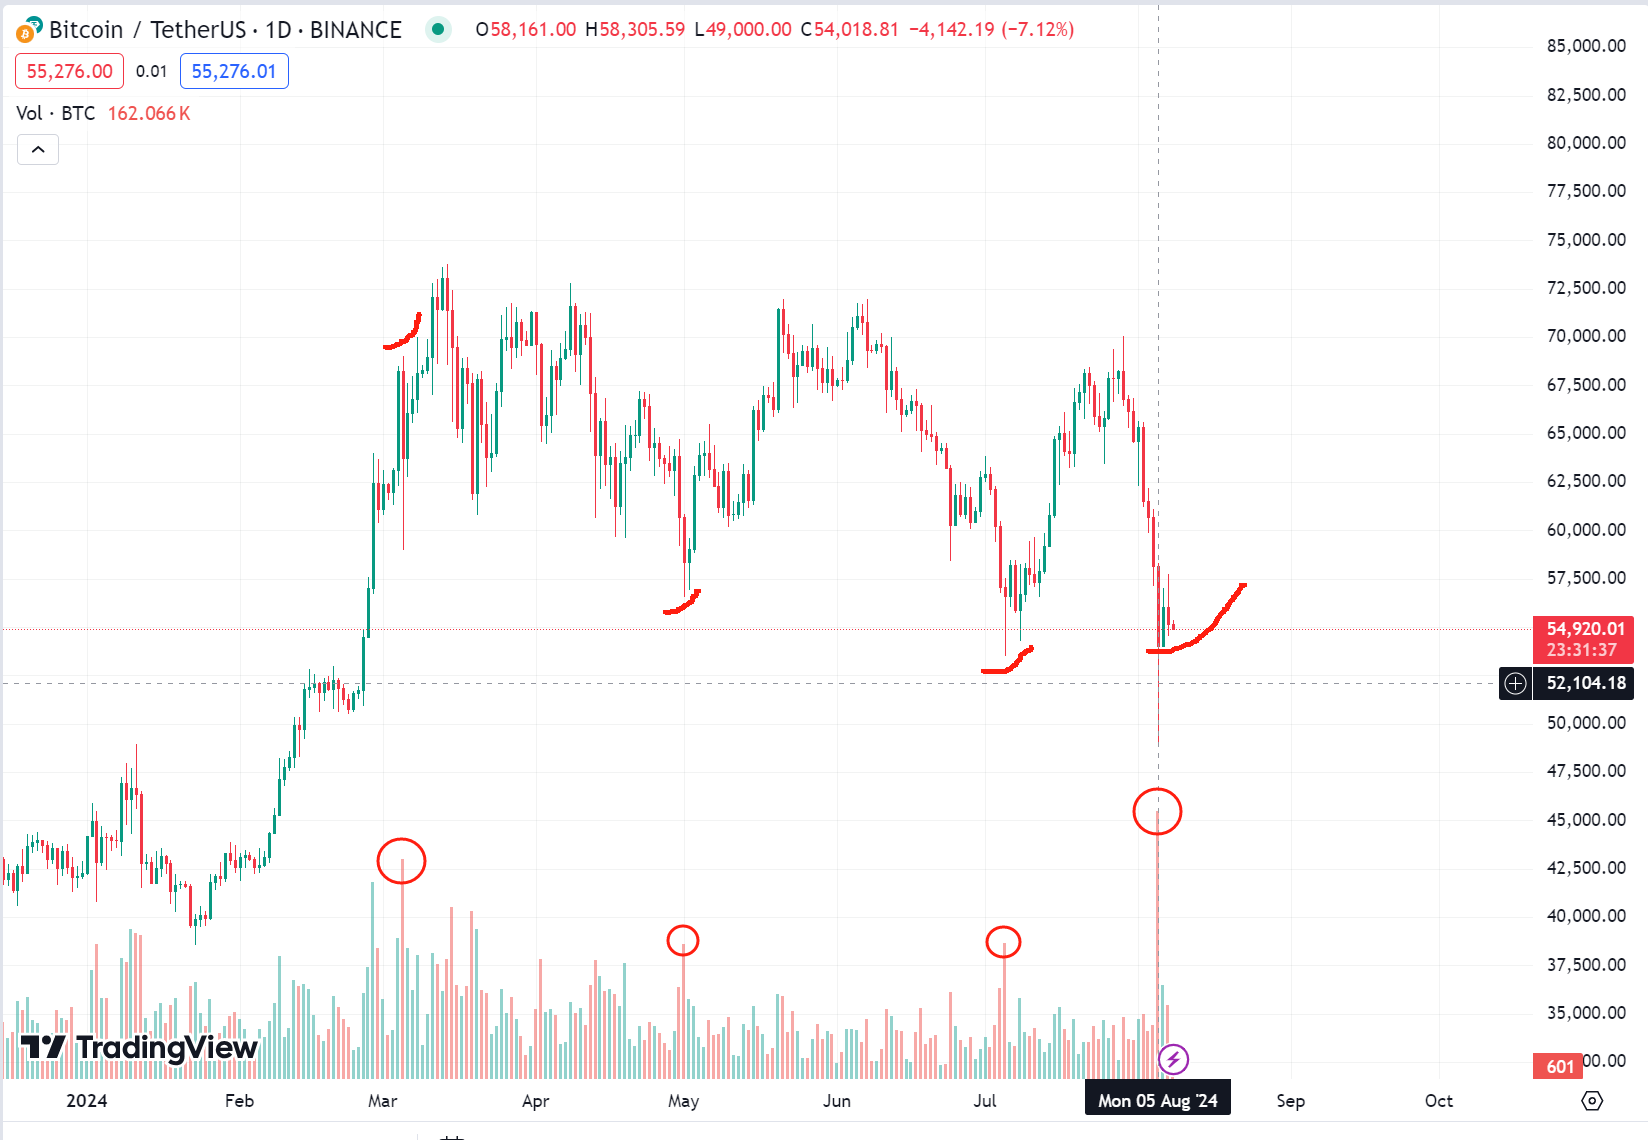
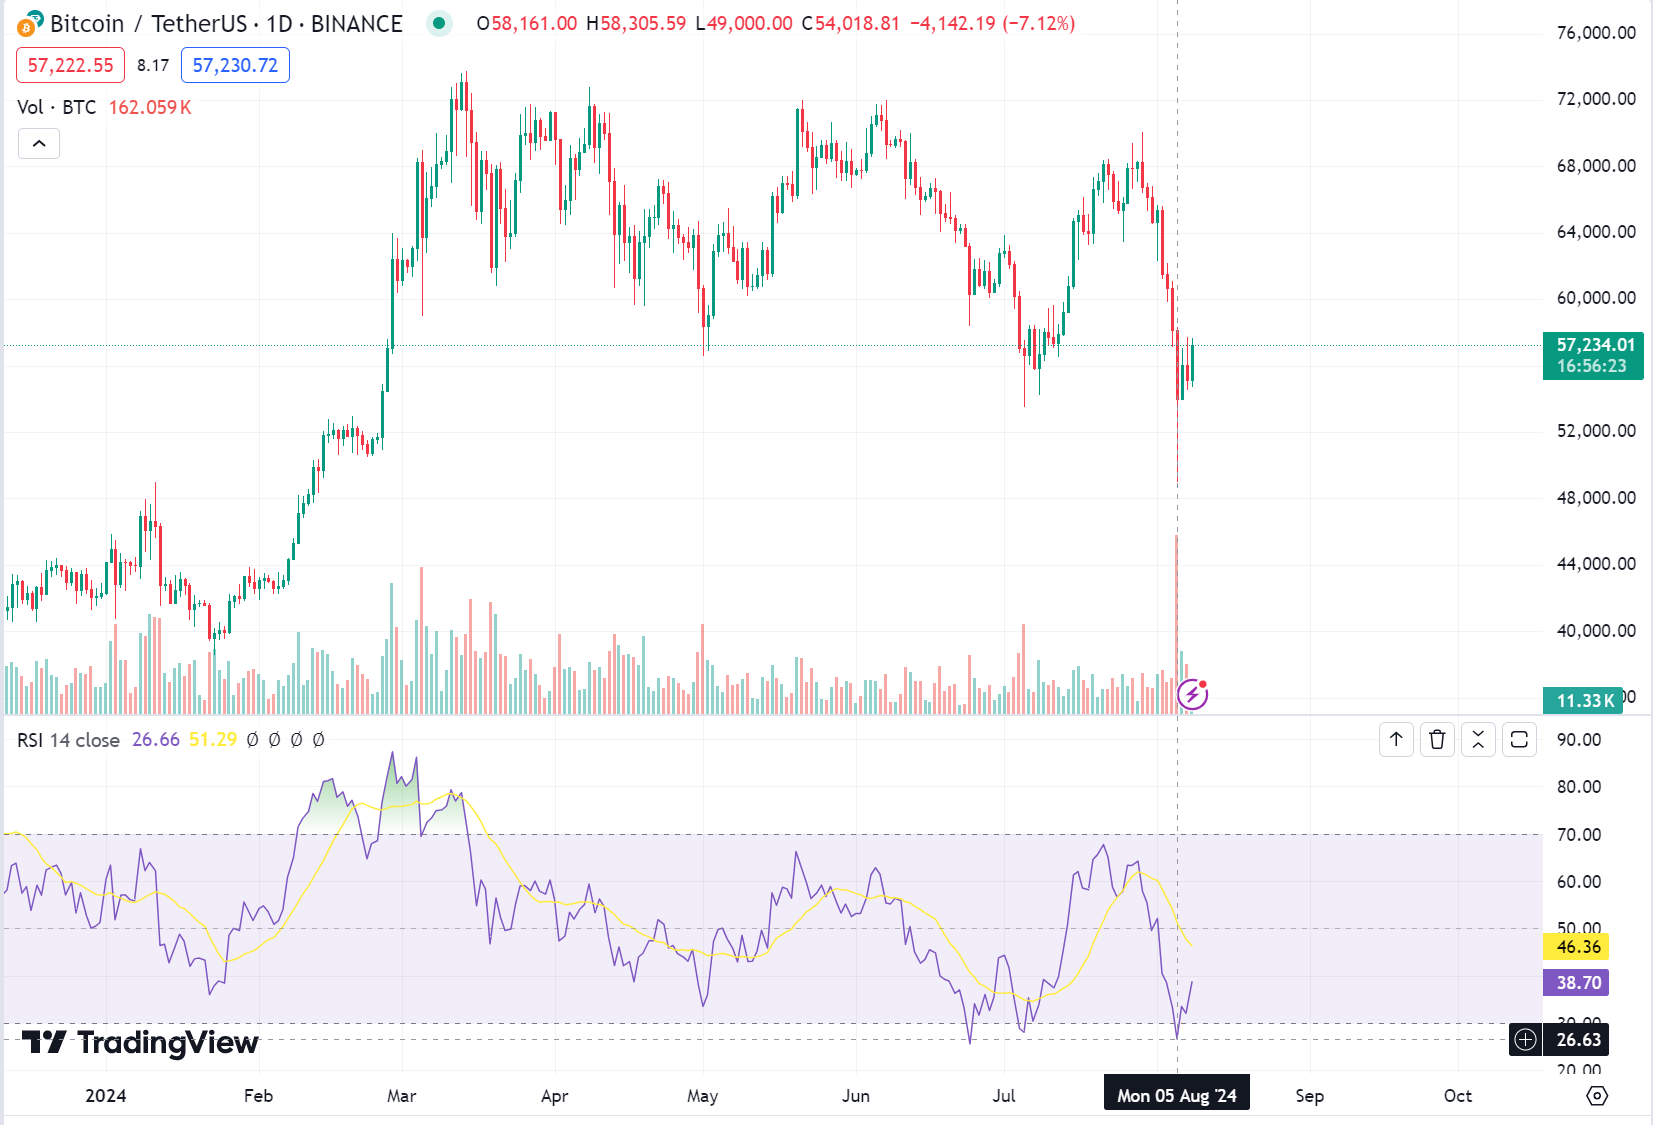
In the plunge on Monday, the cryptocurrency market also suffered heavy losses. The price of BTC fell below $50,000 twice during the day, hitting a low of $48,900, with a maximum decline of over 15%. The weekly Bollinger Bands of BTC fell below the lower band. ETH fared even worse, influenced by the suspected liquidation news from Jump Trading, falling to $2,100 at one point, a drop of over 22%, wiping out all gains from 2024. SOL showed relative resistance to the decline, quickly rebounding after hitting $110 during the day, ultimately closing down by 6%. It's hard to imagine that in just one week, SOL has fallen from a high of $193 to this level, and other cryptocurrencies also plummeted, causing widespread distress in the market. This plunge triggered market panic, and the fear and greed index dropped to 26 on that day, indicating that the market was in a "fear" state.
ETF Inflows and Outflows:
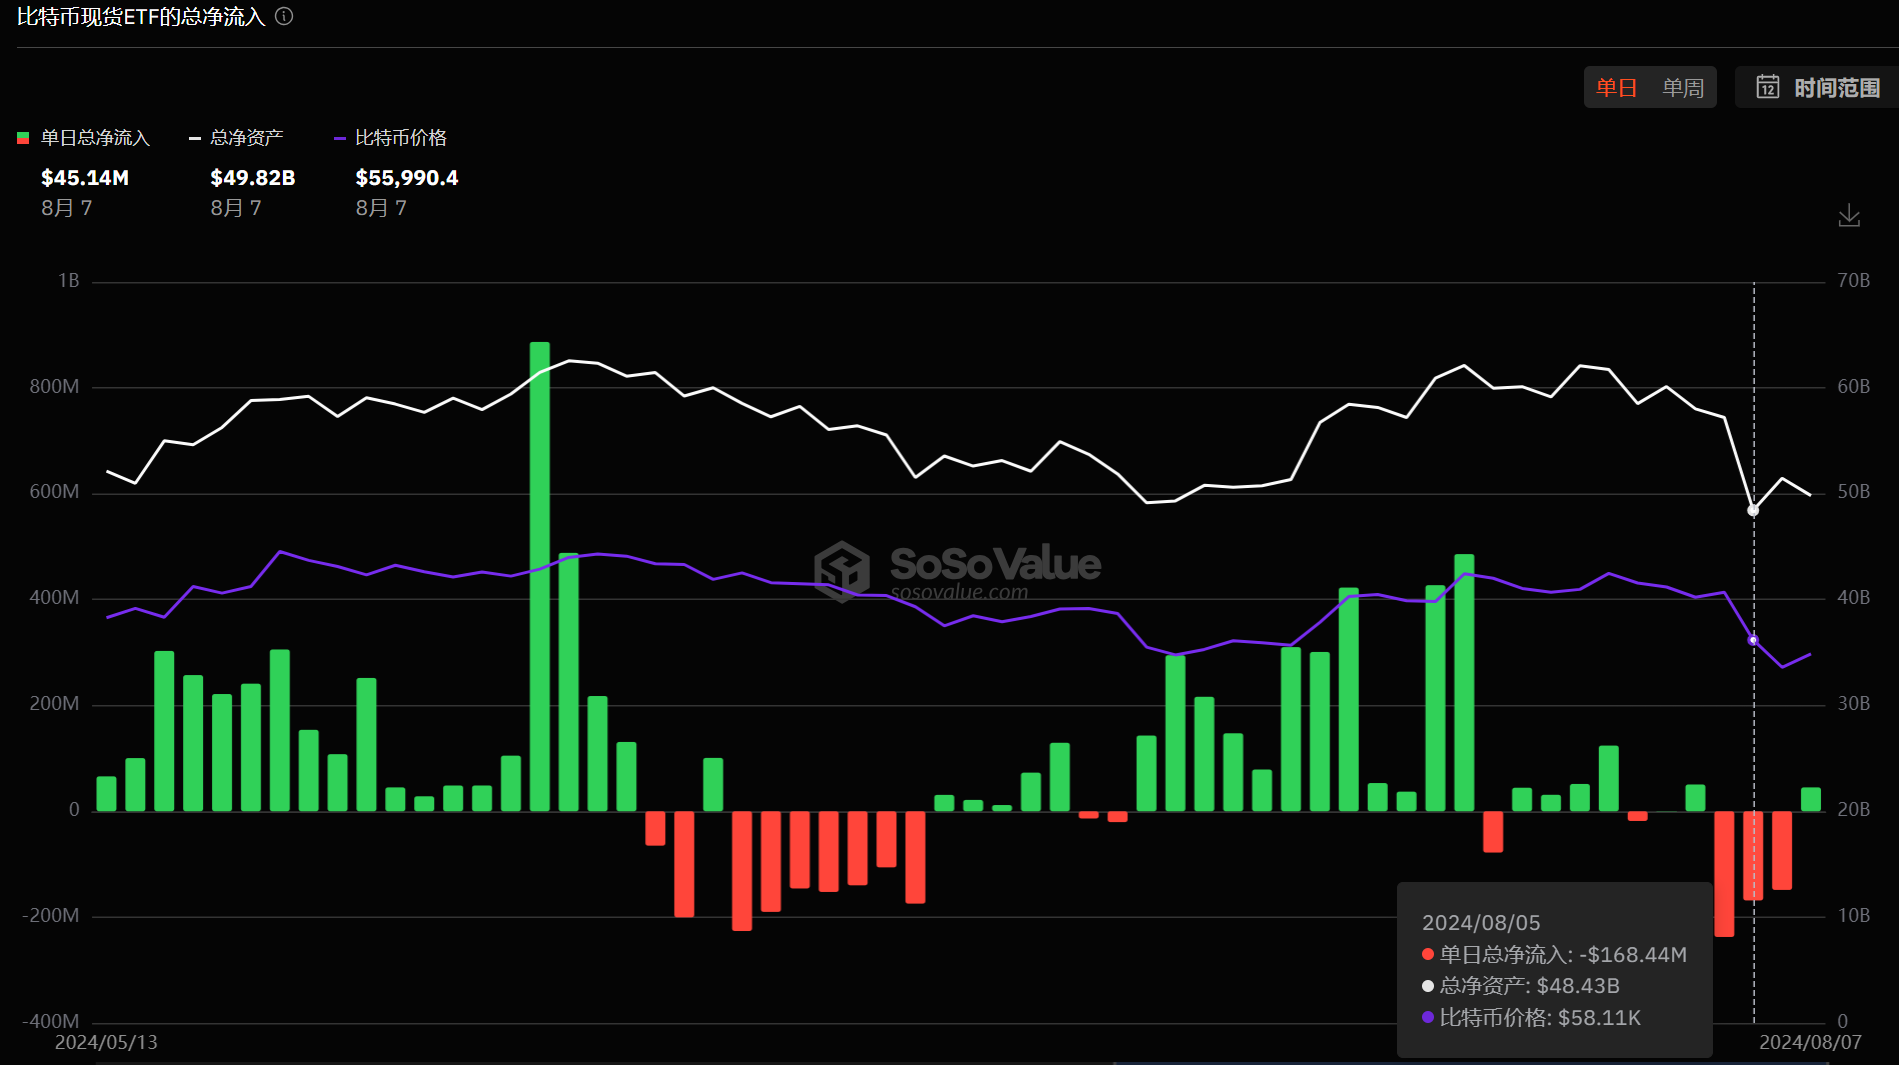
BTC spot ETFs have seen large net outflows for several consecutive days, and the market still needs more time to recover.
On Friday, August 2nd, the total net outflow of Bitcoin spot ETFs was $237 million, with the main outflows coming from $104 million from Fidelity's FBTC and $87 million from Ark Invest's ARKB. Ethereum ETFs saw a net outflow of $54 million, mainly from Grayscale's ETHE, with only a few small trades from other ETFs.
On Monday, August 5th, ten US Bitcoin ETFs saw a total net outflow of $168 million, with $58.04 million outflow from FBTC, $69 million outflow from ARKB, and $69.12 million outflow from GBTC. Nine US Ethereum ETFs saw a total net inflow of $48.8 million, with a net outflow of $46.8 million from Grayscale, and the rest of the ETFs saw net inflows. Blackrock's ETHA saw an inflow of $47.1 million.
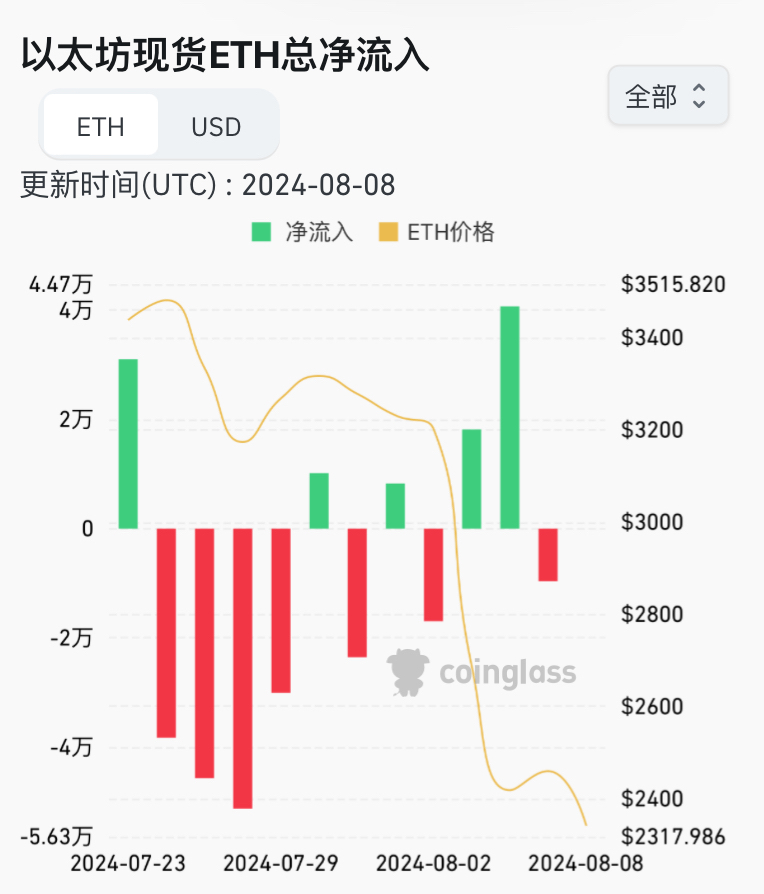
On Tuesday, August 6th, the net inflow of US Bitcoin ETFs remained negative, with a total net outflow of $148 million. Nine US Ethereum ETFs saw a total net inflow of $98.4 million, with a net outflow of $39.7 million from Grayscale's ETHE, and an astonishing inflow of $110 million from Blackrock. ETF inflows have been positive for two consecutive days, indicating that institutions are more interested in Ethereum.
II. What Triggered the Plunge
Let's turn back to the cryptocurrency market. In addition to the factors of the yen interest rate hike and the selling of liquid US stocks and cryptocurrency assets for yen carry trades, the decline in cryptocurrency assets also had a catalyst, which was the suspected sale of all cryptocurrencies by the market maker giant Jump.
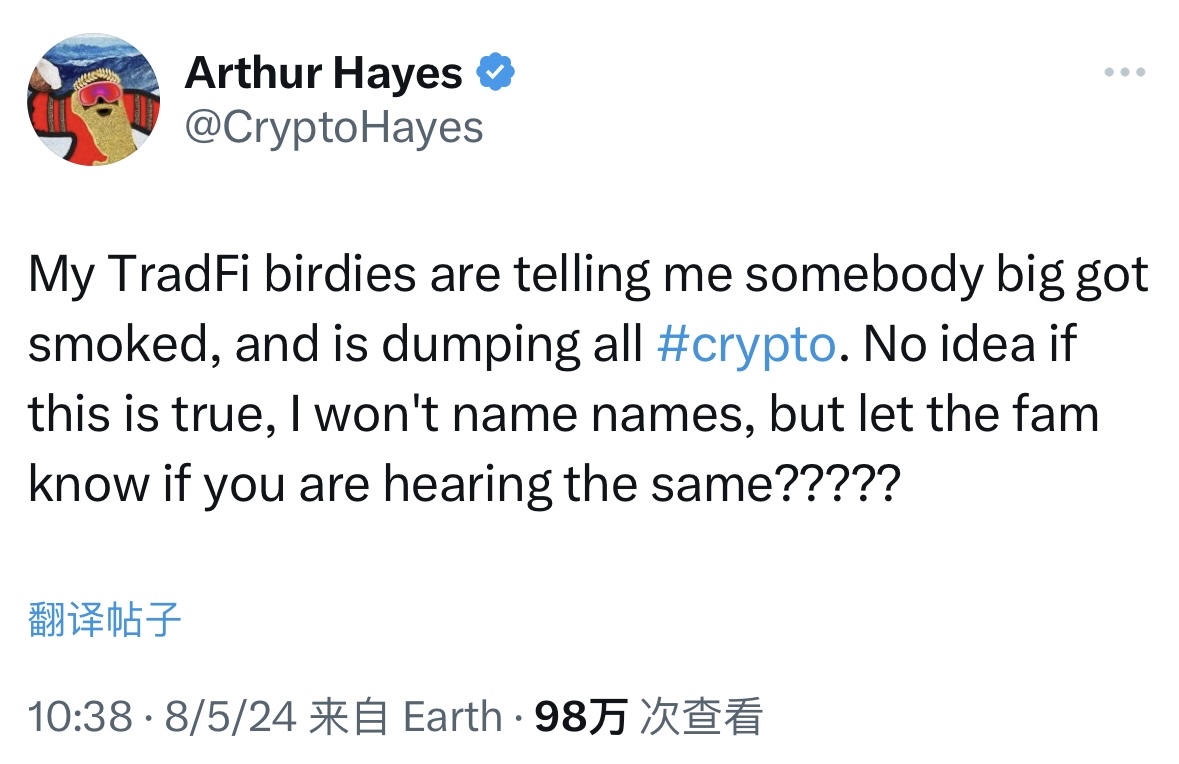
On August 5th, Arthur Hayes, the founder of BitMEX and a well-known KOL, tweeted that he had learned from sources that a certain whale had been severely hit and was selling all cryptocurrencies. "I don't know if this is true, I won't say the name." Currently, most community users speculate that the whale is Jump Trading.
According to Arkham data, Jump Trading's stablecoin position ratio had reached 96% earlier on August 5th, with a total position value of $590 million, of which $569 million was in stablecoins. It is suspected that most of its digital assets have been sold for stablecoins.
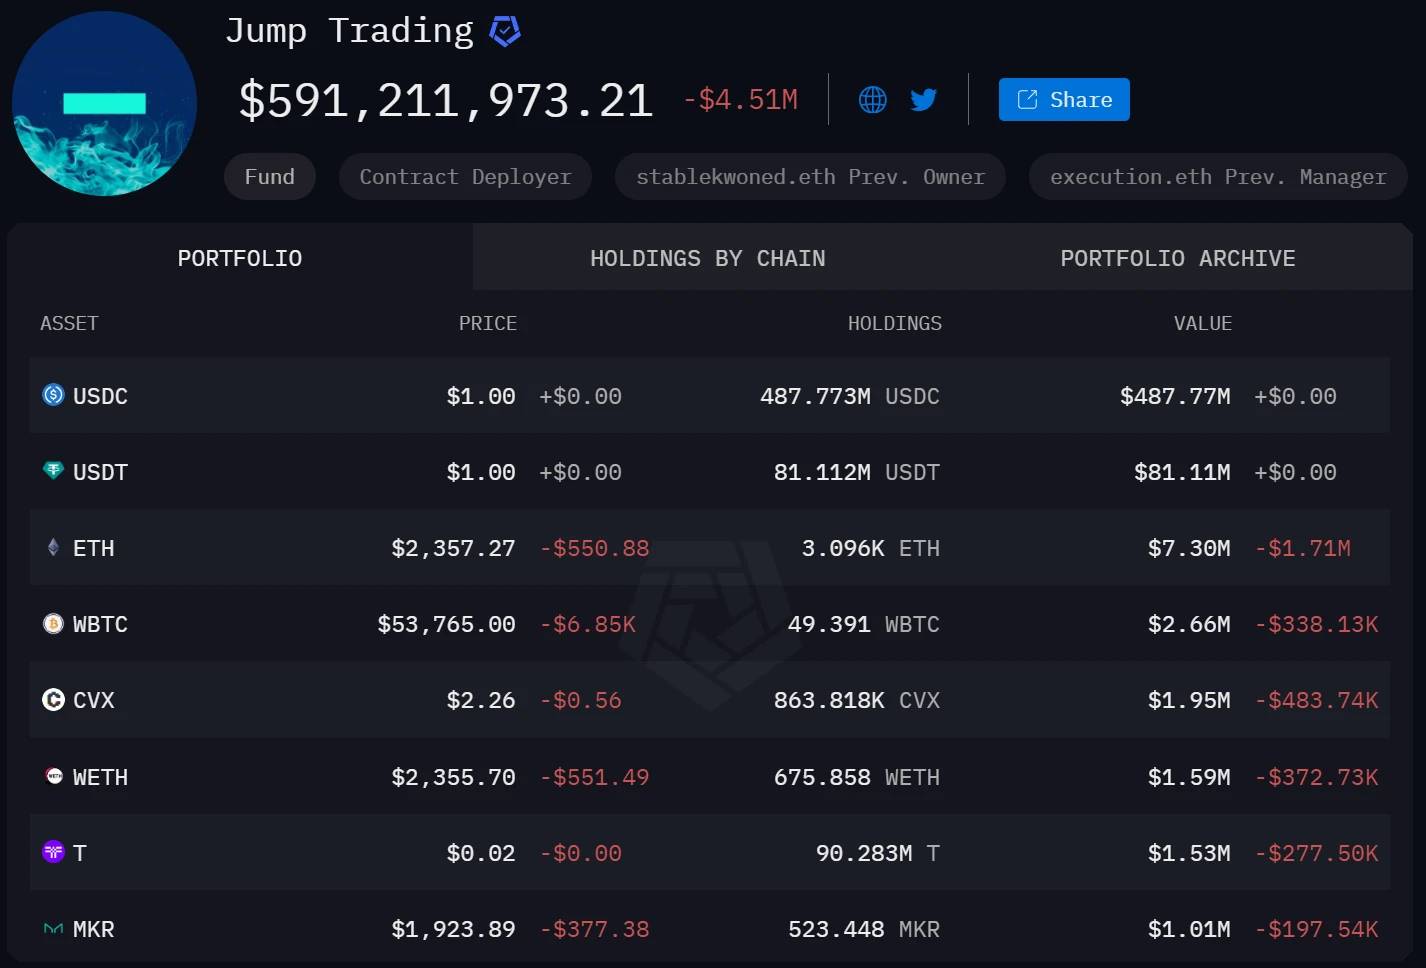
Let's take a detailed look at Jump's position at the end of August 5th:
USDC position value: $325 million
USDT position value: $129 million
WSTETH position value: $128 million
ETH position value: $68 million
RETH position value: $10.44 million
WETH position value: $3.05 million
As of August 7th, Jump is still unlocking its staked ETH on the chain and continues to sell, with its asset holdings continuing to decline.
- USDC holdings value: $307 million
- USDT holdings value: $66.86 million
- WSTETH holdings value: $108 million
- ETH holdings value: $9.62 million
- RETH holdings value: $8.83 million
- WETH holdings value: $2.58 million
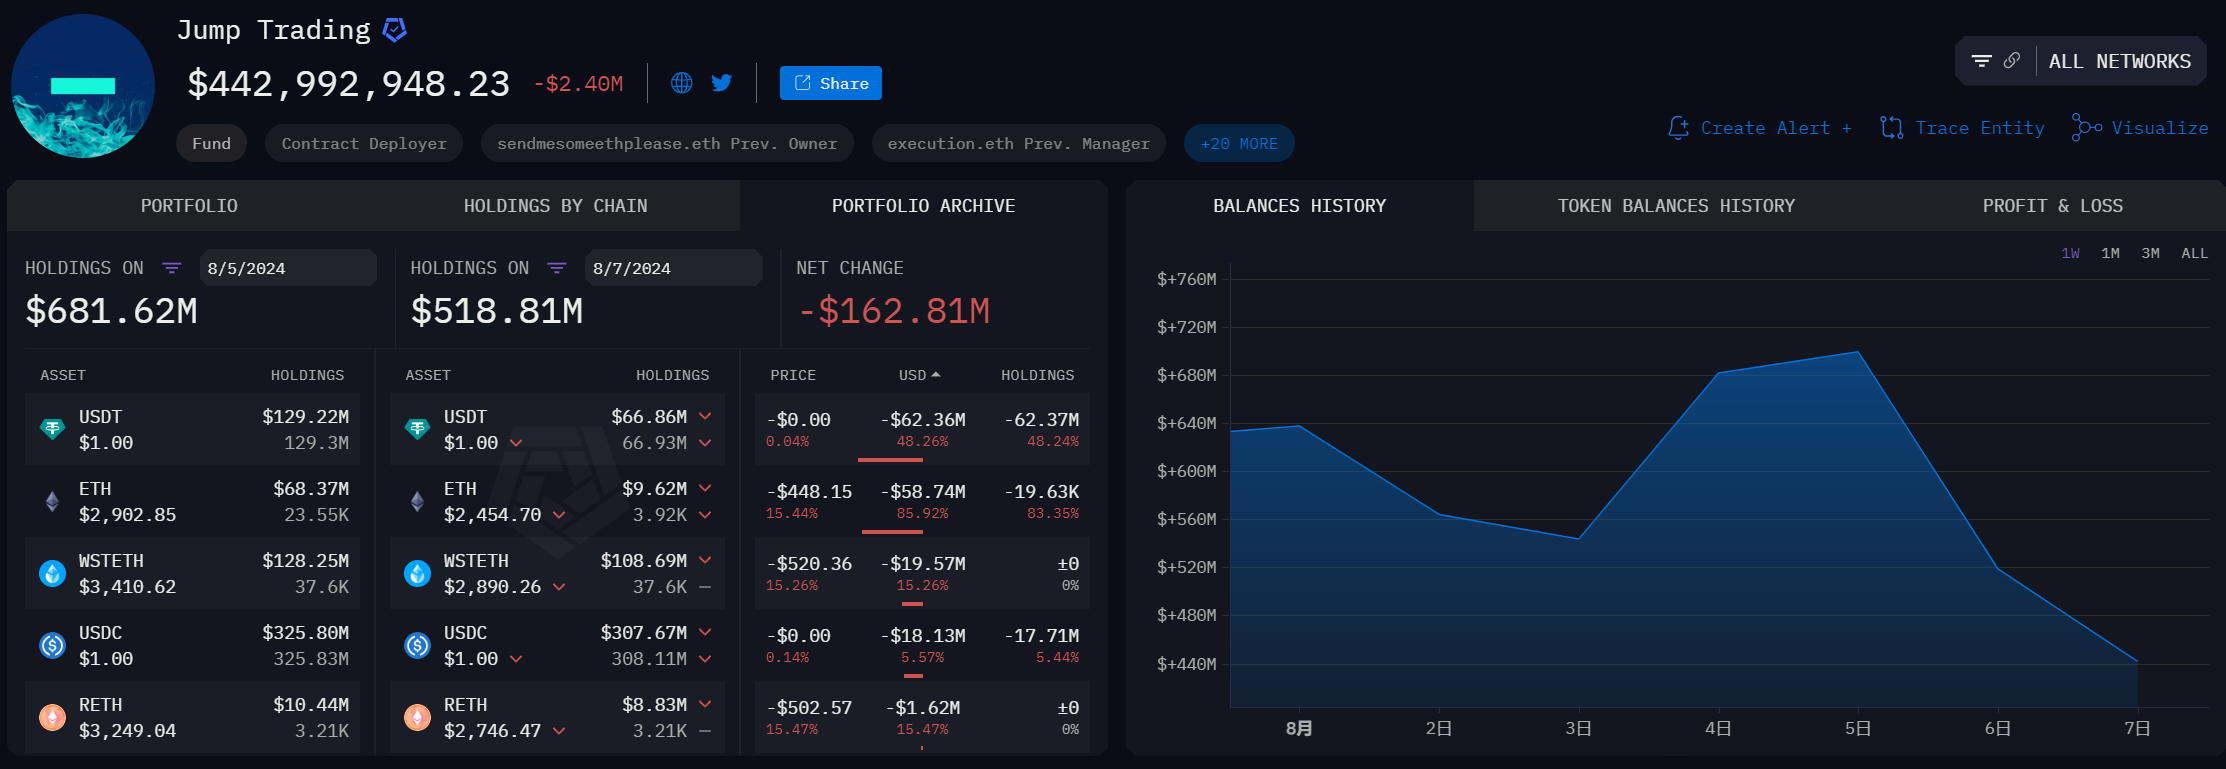
Changes in Jump's holdings, source: Arkham
So, was the sharp decline in ETH really caused by Jump's sell-off? According to Arkham's data monitoring, Jump Trading had actually started selling behavior since July 24th, and as of August 7th, they had already sold 83,000 wstETH ($377 million). The sell-off did not start after the major decline event. If we carefully examine Jump's transfer data, we can see that during the major decline, they also transferred $200 million to the exchange to buy the dip. According to conspiracy theories, Jump likely took advantage of retail panic selling and, in a situation of poor liquidity over the weekend, sold off while opening short positions, and then bought the dip once the price dropped to a certain level.
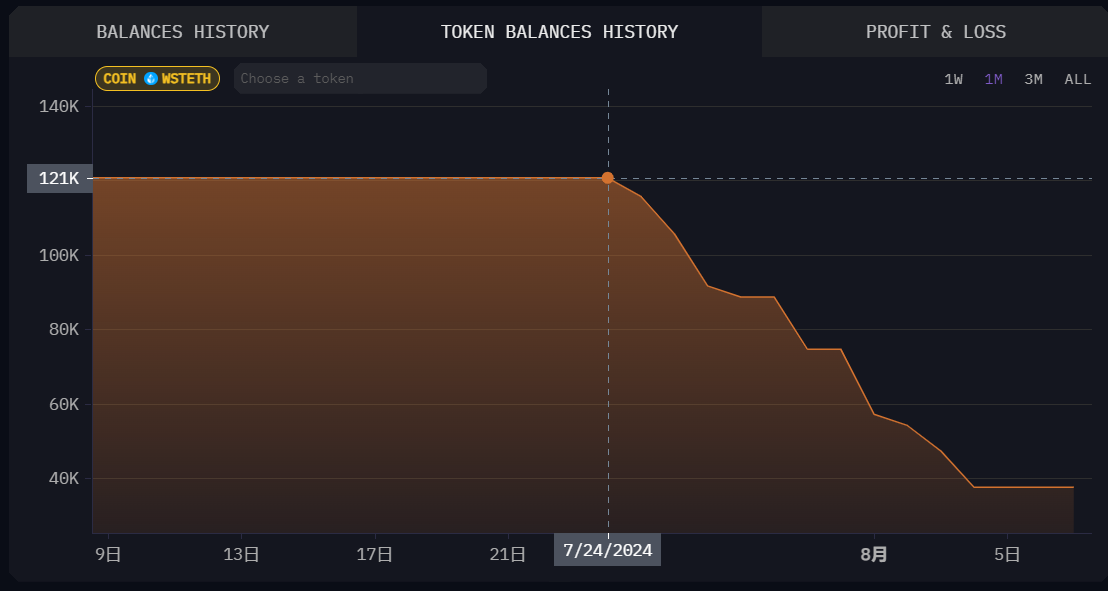
Jump's wstETH holdings changes, source: Arkham
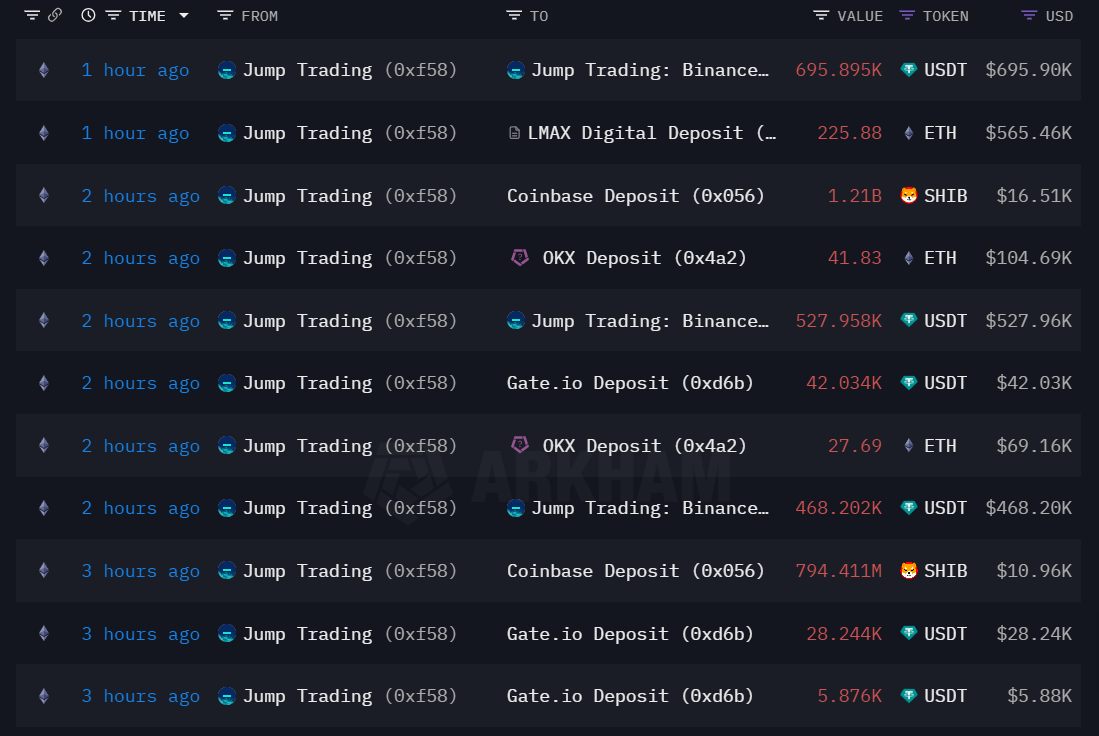
Jump's on-chain wallet transaction records, source: Arkham
In summary, this major decline seems more like a short-term emotional panic triggered by the Japanese interest rate hike to clear leverage, rather than a true black swan event. In fact, since the oversell on August 5th, the market has seen a recovery, with both the US stock market and the cryptocurrency market starting to rebound. In a bull market, a 20% price correction is also quite normal.
III. Violent Rebound of Risk Assets, Cryptocurrency Market May Reverse
US Stock Market
Following the widespread decline in risk assets on Monday, US stock index futures rose on Tuesday, with Nasdaq futures up 2%, S&P 500 index futures up 1.5%, and Dow Jones futures up 1%. After the spot market opened, all three major indices rose, with the Dow up 0.76% at the close; Nasdaq up 1.03%; and S&P 500 index up 1.04%. After the sharp plunge and triggering of the circuit breaker in the Nikkei 225 index in Japan on August 5th, the index surged over 3200 points after opening on August 6th, with an increase of over 10%, and the TOPIX index futures also triggered an upward circuit breaker, automatically suspending trading. The Nikkei 225 index closed up 10.23% on August 6th. The KOSPI index in South Korea soared, with the increase expanding to 5% and triggering another trading halt.
Institutions also took on buying positions, with hedge funds aggressively buying US stocks during the market crash on Monday, purchasing $14 billion worth of stocks. Ark Invest, led by Cathie Wood, bought stocks totaling over $60 million, including Tesla, Meta, Amazon, Coinbase, and Robinhood.
The strong buying behavior of institutions further strengthens the bullish theory, and multiple indicators also suggest that the US stock market may be approaching a short-term bottom: the 14-day RSI of the S&P 500 index and the Nasdaq 100 is close to 30, indicating oversold conditions and a potential short-term rebound.
Cryptocurrency Market
After the plunge on Monday, August 6th saw a wave of oversold rebounds in the cryptocurrency market. Bitcoin rose by 3.7%, reaching a high of $57,000, showing a wide-ranging oscillating trend overall. Ethereum rose by 5.8%, and SOL rebounded by over 15%. Is the worst of the sell-off period over? Let's take a look at the data:
- The total market value of cryptocurrencies plummeted on Monday, but has since rebounded from $1.94 trillion to $2.1 trillion.
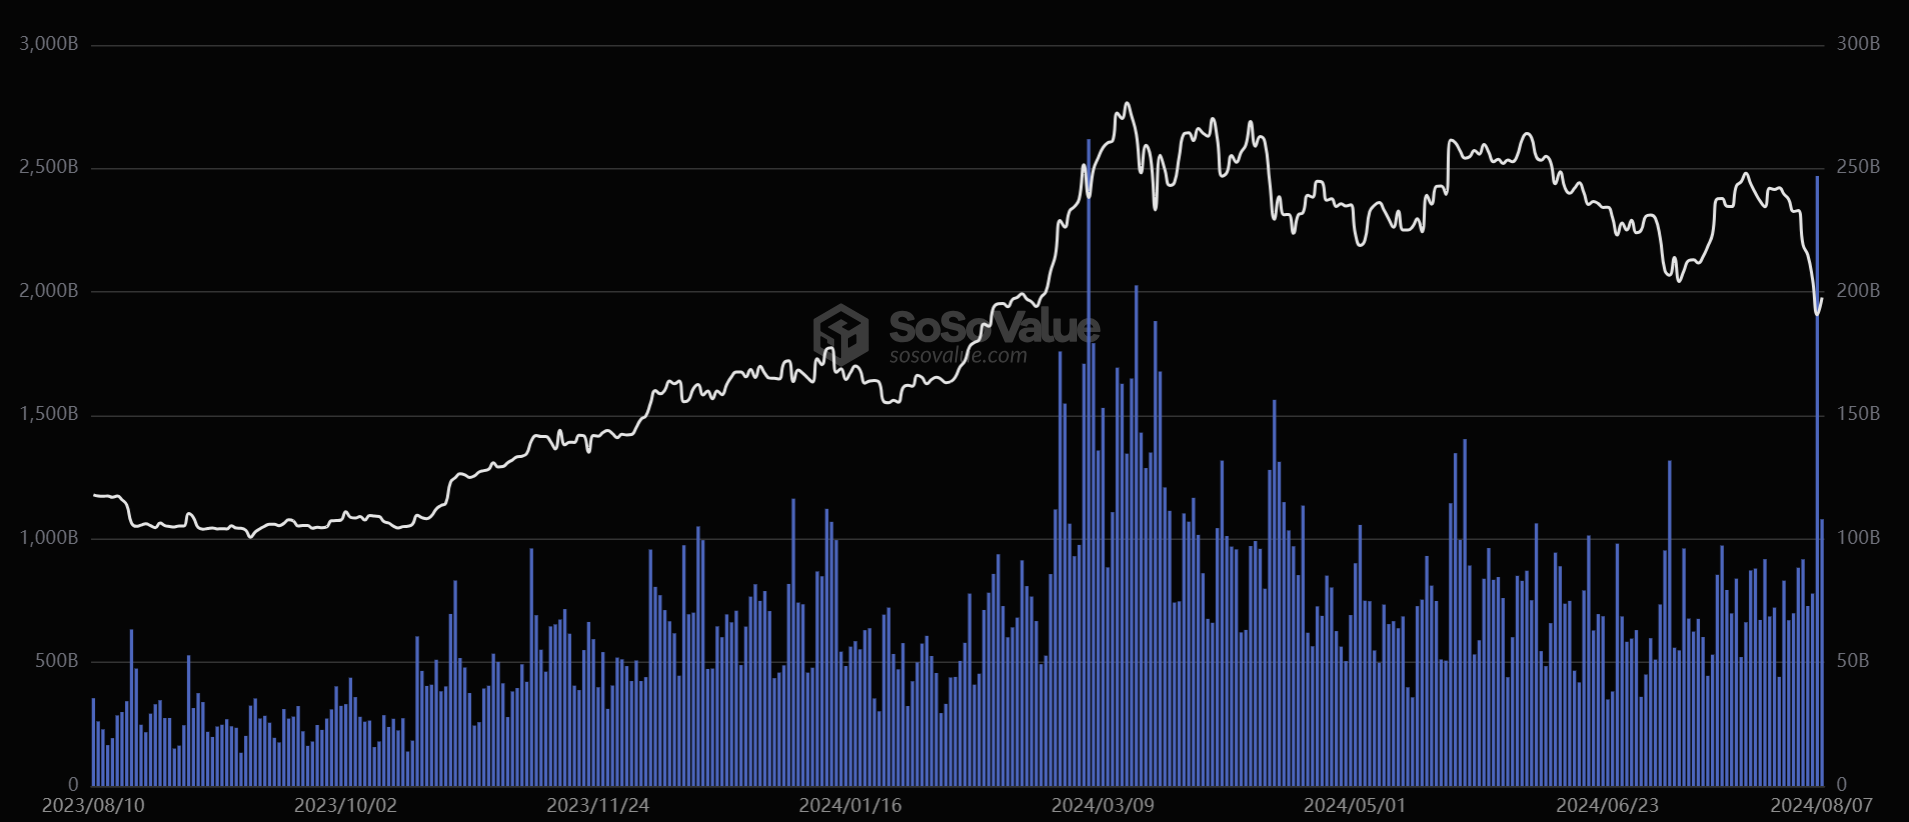
- The trading volume of BTC and ETH on August 5th reached a historical high, and historically, prices tend to reverse due to such volume. Although it does not guarantee an immediate reversal, the speed of the decline may slow down as a result.
The open interest of Bitcoin futures plummeted by over 30% after the major decline on August 5th, reaching $25.8 billion, and the funding rate turned significantly negative, resulting in a large number of leveraged long positions being liquidated. The leveraged bulls may have been cleared, and the fastest phase of the market decline may have ended.
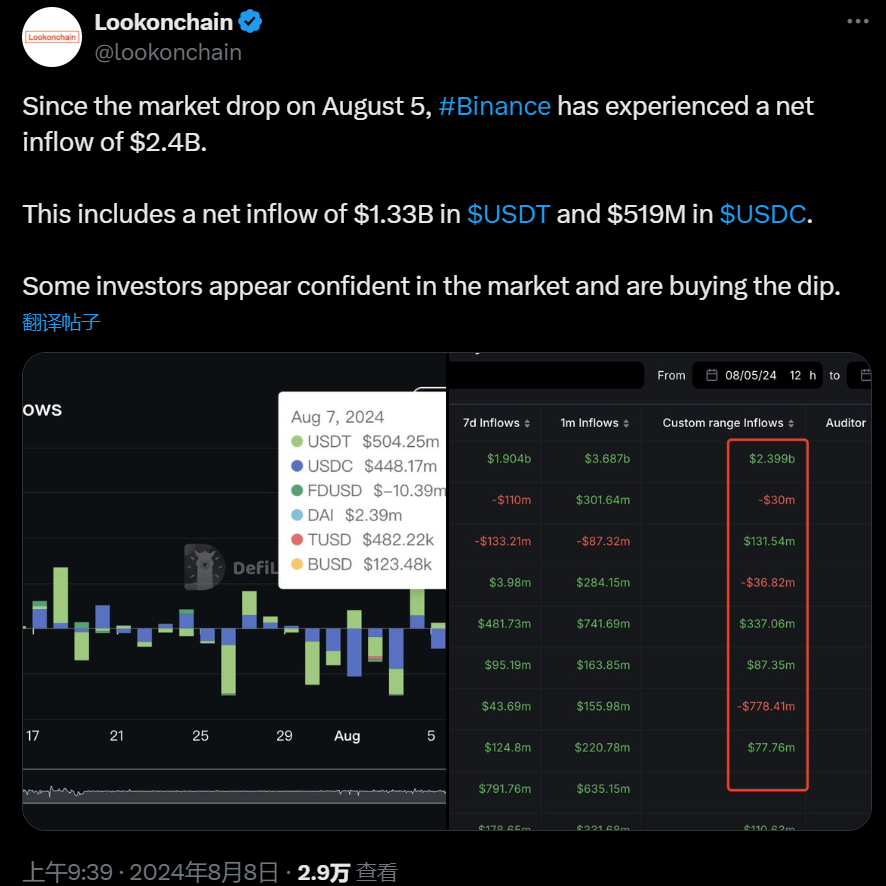
According to Lookonchain data monitoring, CEX stablecoin funds have continued to flow in, with Binance experiencing a net inflow of $2.4 billion since the major decline on August 5th. This indicates that investors seem to have confidence in the market and are buying the dip.
- Whales holding over 1000 BTC have been continuously increasing their holdings during the decline.
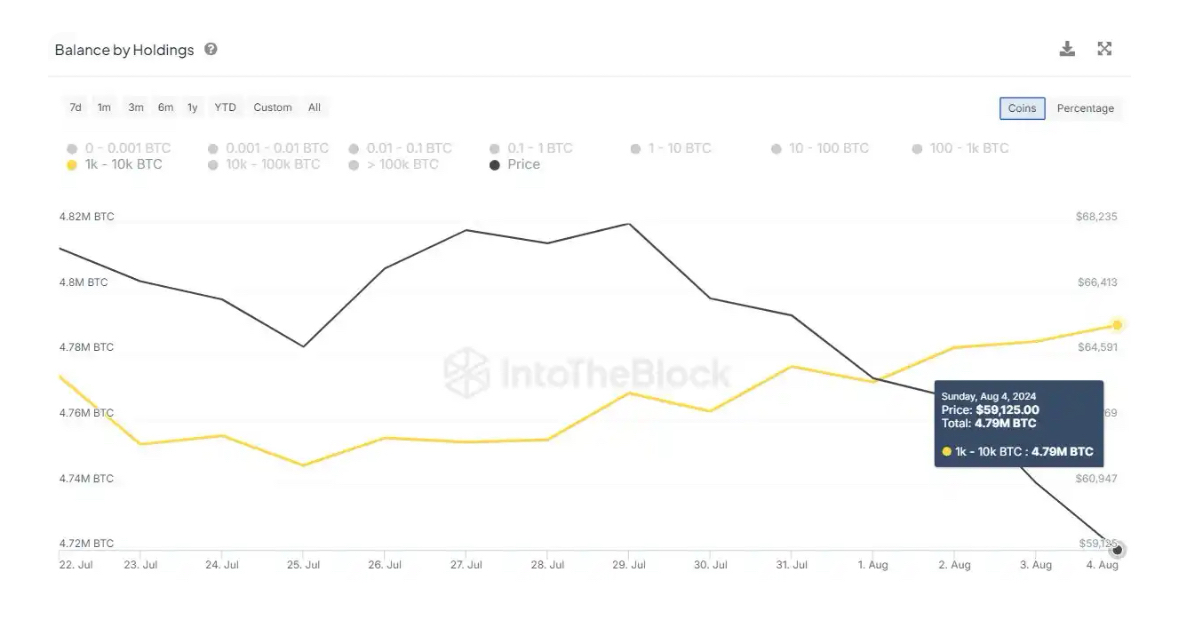
Data source: IntotheBlock
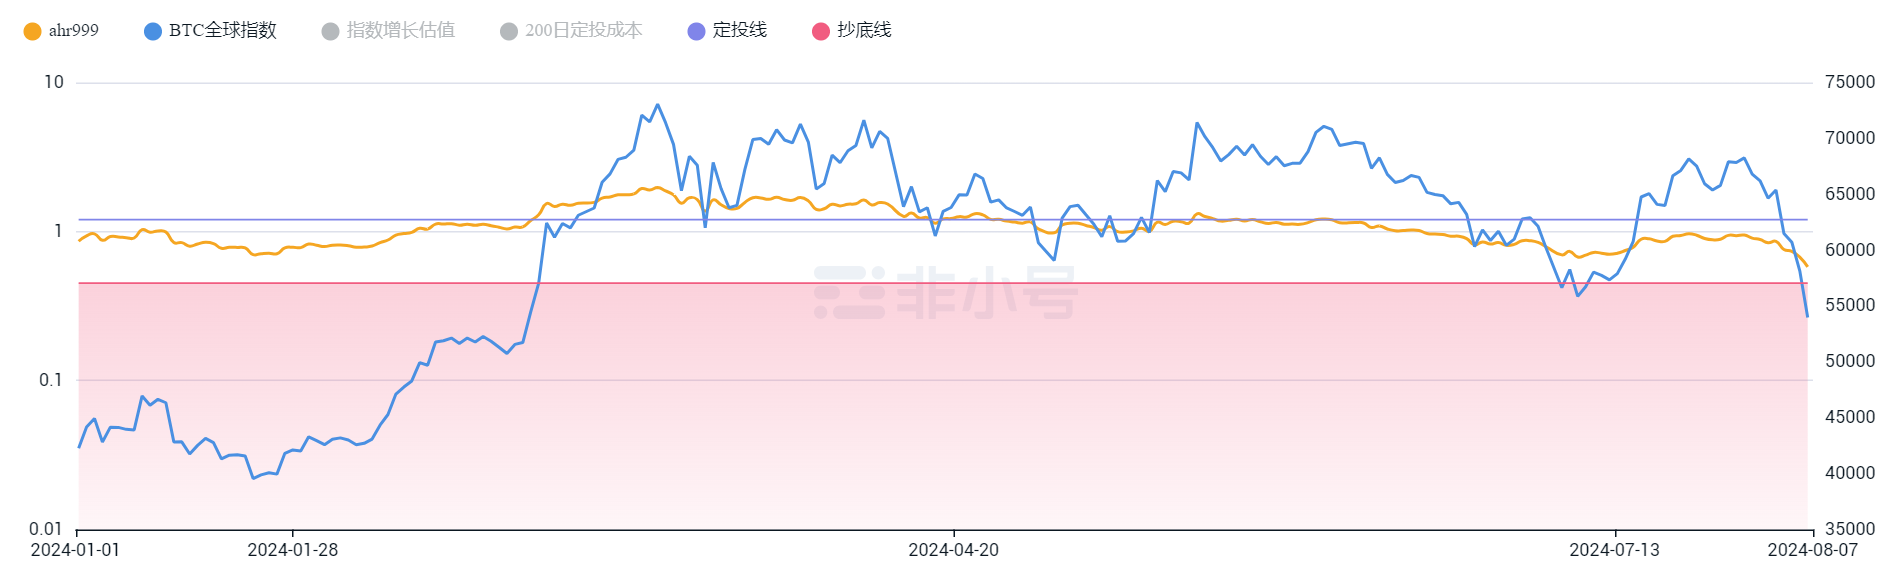
- AHR999 Index: The AHR999 index on August 7th was 0.61, and the index has seen a significant decline since August 5th. The theoretical cost of a 200-day dollar-cost averaging is $60,950, with a theoretical averaging range of 0.45-1.2. The current price of around $55,000 is a good buying opportunity for long-term investors.
- The relative strength index (RSI) of BTC hit a low of 26 at the Monday low point, indicating that Bitcoin is oversold and at a good buying position for bottom fishing.
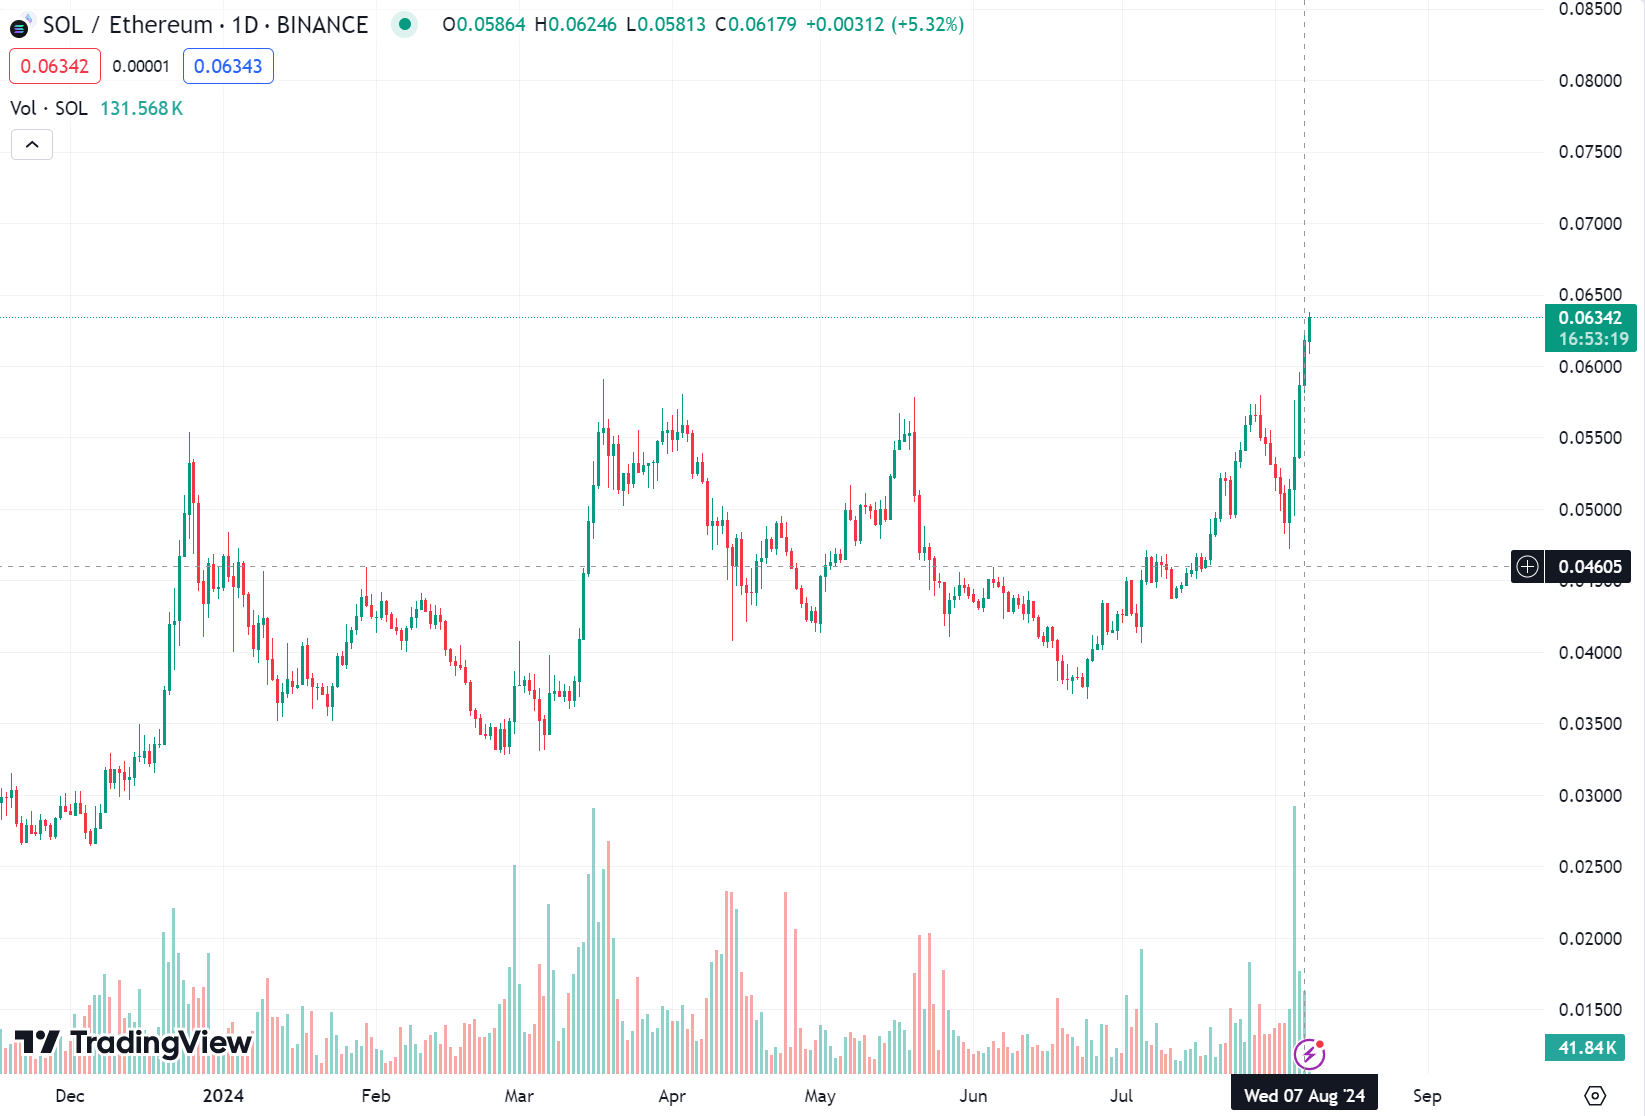
- The SOL/ETH exchange rate broke through 0.06 on August 7th, reaching a historical high, indicating that market sentiment is not completely down.
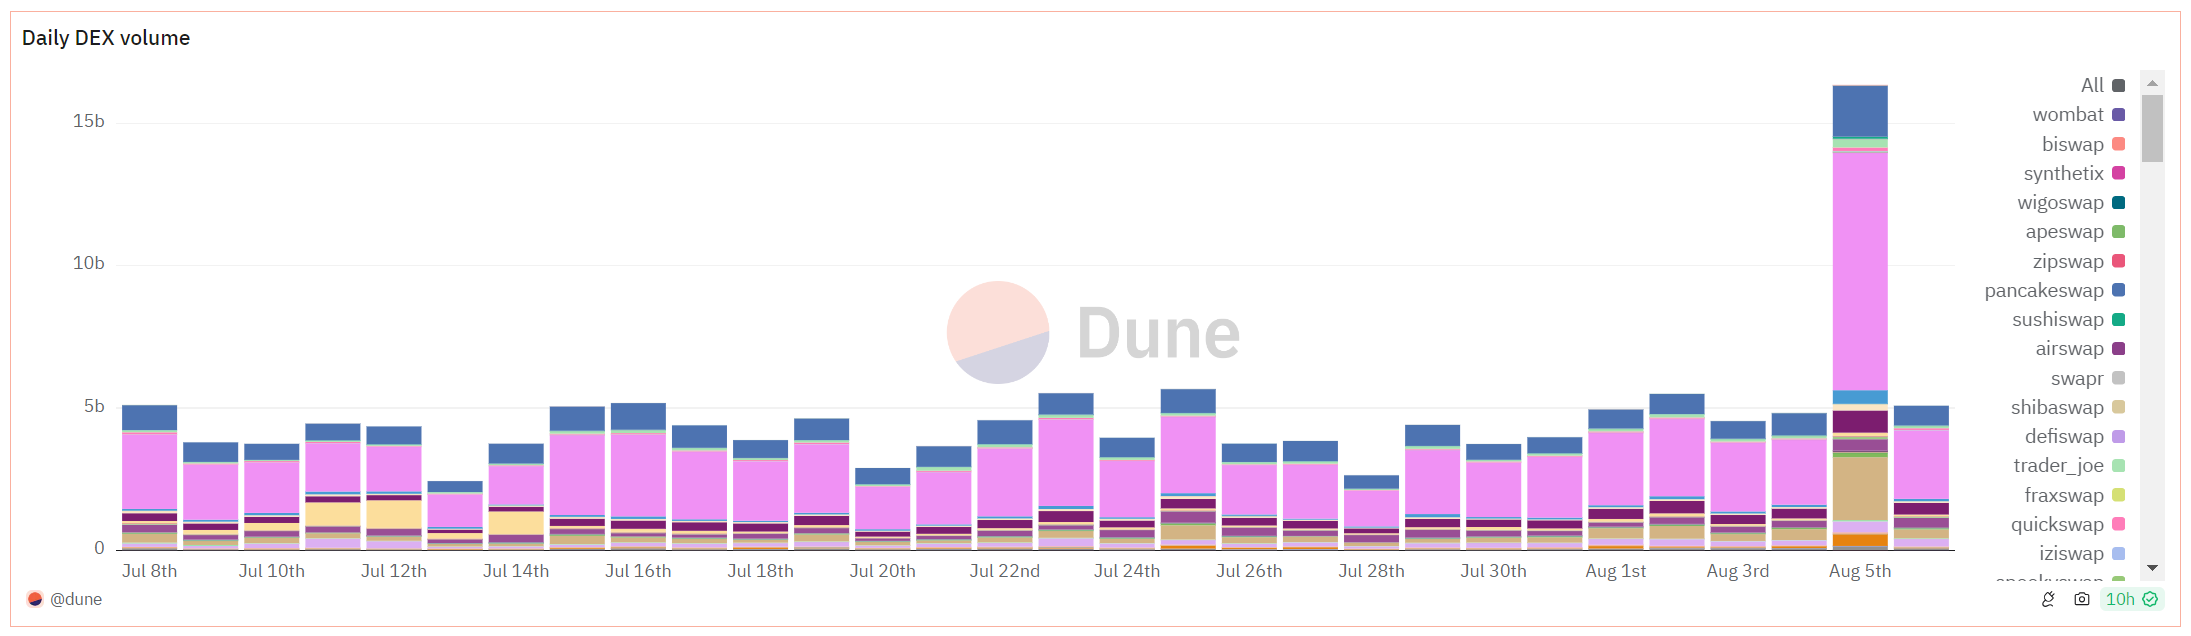
- According to DUNE data monitoring, the total trading volume of DEX exceeded $20.2 billion on August 5th, marking the third-highest record in history, with active trading of altcoins.
IV. Subsequent Influencing Factors
As mentioned in the introduction, the risk market is still being influenced by many factors: global economic recession, geopolitical wars, the Japanese central bank's interest rate hike, and the US presidential election. People seem to be less sensitive to news of the Russia-Ukraine conflict, Middle East wars, recent Iran-Israel conflicts, Hezbollah attacks in Lebanon, and their limited impact on the market. Subsequent factors worth our attention include the US presidential election, and the expectation of a global economic recession, which currently does not seem to be fully priced into the US stock market.
- ### Suspicions of a Global Economic Recession
The proponent of the Say's Law mentioned earlier believes that the current rise in unemployment does not necessarily mean that the economy has already declined. "We still maintain a strong posture, and overall, it is difficult to confirm that we are already in a recession." From the data on US economic activity, there is currently not much evidence to support an economic slowdown. US companies are expected to see a year-on-year profit growth of over 10% in the second quarter, with almost no signs of weakness.
Goldman Sachs CEO: No Recession Risk in the US
Goldman Sachs CEO David Solomon stated, "There is no risk of recession in the US, and it is expected that the Federal Reserve will not urgently cut interest rates." He believes that the July employment report data is not terrible, just weaker than expected, and Solomon thinks that this volatility will continue for some time, which may be healthy. Citigroup also stated that the recession scenario has absolutely not been priced in. If the US economy really does decline, it will not be as easy as it seems, and the market may perform much worse than it is now.
Federal Reserve Officials: Declining Inflation, Good Employment Situation
Federal Reserve official Gulsby stated that inflation has significantly declined, and the employment situation is relatively good. If the economy deteriorates, the Federal Reserve will balance risks and take measures to repair it. Before the September meeting, we can be more patient and wait for more data.
- ### Impact of the Bank of Japan's Interest Rate Hike and Yen Carry Trades
This week's Black Monday has shaken the global risk market. Due to Japan's interest rates being consistently at extremely low levels, even implementing a zero interest rate policy from 2001 to 2006, borrowing in Japan at low rates and then converting funds into high-yield currencies such as the US dollar and the euro to invest in assets in high-yield countries has been a common arbitrage behavior for market participants for over 20 years.
The long-term weakness of the yen has provided liquidity for global market capital carry trades, while also fueling asset bubbles in related countries and markets. The Bank of Japan's interest rate hike and balance sheet reduction on July 31 directly led to a sharp rise in the yen exchange rate, passively prompting the removal of cheap leverage by global capital, leading to the sale of various assets to repay yen-denominated debts.
Yen carry trades have supported the bull market in global stock markets, and the sustained bull market in US stocks has also benefited from the ample liquidity provided by yen carry trades. Massive yen funds are widely distributed in world stock markets, currency markets, and commodity markets, influencing global market trends, and Bitcoin has also benefited from the long-term depreciation of the yen. The end of yen carry trades and the withdrawal of funds will trigger a global asset price crisis and decline, and as financial institutions remove leverage, the credit crunch we do not want to see will occur.
The scale of yen carry trades is actually difficult to track. The Wall Street Journal can only assess the amount of foreign currency loans by Japanese banks based on data from the Bank for International Settlements: as of March this year, the amount of foreign currency loans reached $1 trillion. As of the first quarter of this year, Japan's net international investment, that is, outward investment, reached 487 trillion yen.
Institutions have different opinions. Citigroup's currency analysts predict that the current adjustment is just the beginning. JPMorgan and UBS believe that three-quarters of the yen carry trades have been unwound after the stock market's sharp decline on Monday and the rebound on Tuesday, while Goldman Sachs and Societe Generale believe that the selling by yen carry traders has already ended.
Bank of Japan Governor Uchida also sent a dovish signal after the stock market's sharp decline, promising not to raise interest rates during market instability, temporarily maintaining the current loose monetary policy, and carefully considering the state of the financial markets in future interest rate policy decisions.
- ### US Presidential Election
The US presidential election is still ongoing, and the Trump and Harris campaign teams are preparing for the final showdown. The Harris campaign team recently raised a record $200 million, surpassing the $138.7 million raised by the Trump campaign team in July.
According to the latest survey by Ipsos, Harris and Trump currently have almost the same level of voter support, with both of them at 43% in last month's data. Harris received 70% support among African American voters, a significant increase compared to Biden's 59% support among African American voters at the time. Trump's support among African American voters also slightly increased, from 9% in May and June to 12% in July. At the same time, Trump's support among white voters also increased, from 46% in May and June to 50% in July. Harris's support among white voters increased from 36% previously to 38% in July.
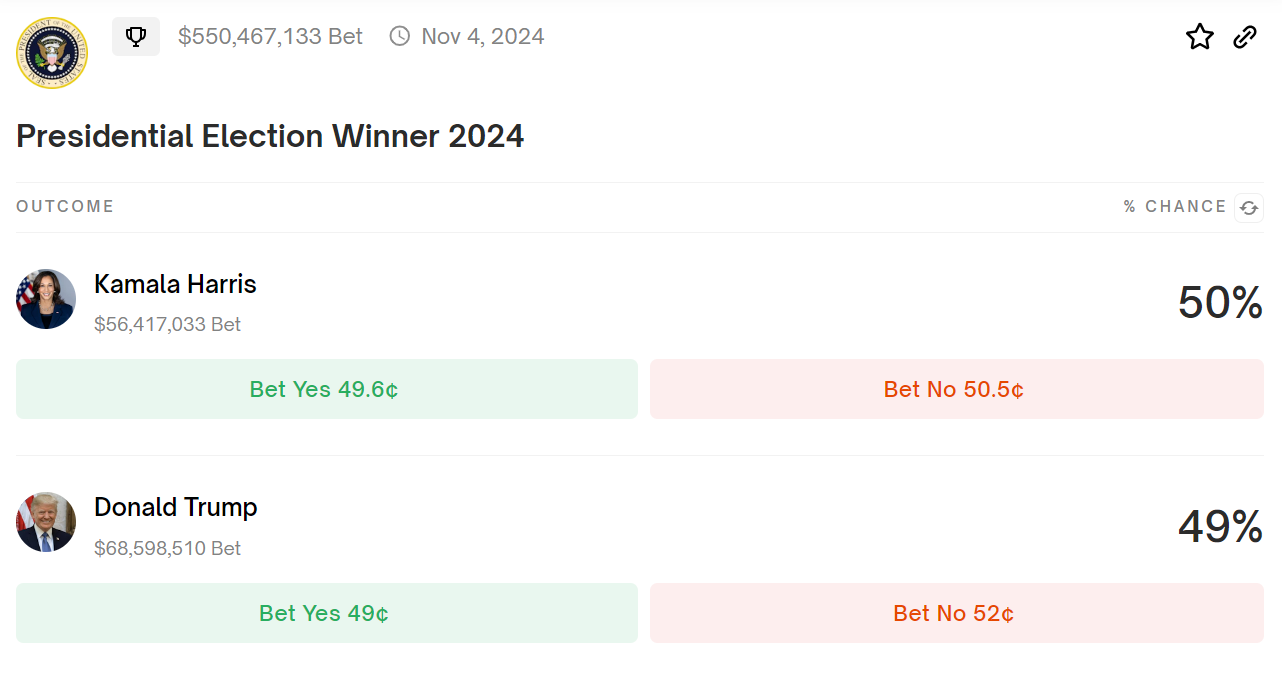
Looking at the cryptocurrency prediction market Polymarket, as of August 8th, the probability of Harris winning is 50%, surpassing Trump's 49%.
It is expected that the US presidential election will continue to affect the volatility of the risk market. Regardless of the final result, as Arthur Hayes said, "It doesn't matter to the cryptocurrency industry whether Trump or Harris wins the next US presidential election. Both the Republican and Democratic parties will loosen monetary policy, just in different ways, so cryptocurrencies will rise, but the road may be very bumpy."
V. Conclusion
The recent mild dovish attitude of the Bank of Japan is because they have seen the serious impact of monetary policy on the risk market and the economy, which has led to soothing the market. Suddenly changing the loose monetary policy of the past few decades will definitely disrupt the global market. Since the beginning of this year, due to the increased correlation between the yen and the US market, a rise in the yen often accompanies a decline in US stocks, and we need to constantly monitor the policies of the Bank of Japan. The logic of the yen is expected to have a significant impact on the recovery and restoration of global risk assets in the coming period.
BTC is currently in a phase of upward correction after oversold rebound, and there should not be major fluctuations before the conclusion of the US election. The market's recovery also takes time. Bitcoin below $60,000 is highly attractive to institutions. Optimistically, the return of the bull market may come in the first quarter of 2025, early next year, in conjunction with a series of policies landing with interest rate cuts.
The recent panic selling in the market reflects an overly sensitive response to US economic data, and the market's panic may be misplaced. Like most industry analysts, I still see a bright future for the cryptocurrency market. I hope everyone can also stabilize their mindset and not let panic affect investment decisions.
With the surge in on-chain DEX trading volume, Meme has also been enthusiastic in recent days. XT Exchange focuses on discovering high-quality assets, research-driven, and filters out on-chain contract risks for users, and is the first to launch the latest hot Meme coins. Buy valuable coins - on XT.com.
New users can register through the following link:
https://www.xt.com/zh-CN/accounts/register/start?channel=XTlabs
Partners interested in Memecoin are also welcome to join our dedicated community for Meme coins, and discover the latest hot Meme coins at the first time: https://t.me/memetothemars
【Disclaimer】This article is for reference only and does not constitute any investment advice. Investment carries risks, so please operate with caution. Readers should independently evaluate the content of this article based on their own situation and bear the risks and consequences of investment decisions on their own.
免责声明:本文章仅代表作者个人观点,不代表本平台的立场和观点。本文章仅供信息分享,不构成对任何人的任何投资建议。用户与作者之间的任何争议,与本平台无关。如网页中刊载的文章或图片涉及侵权,请提供相关的权利证明和身份证明发送邮件到support@aicoin.com,本平台相关工作人员将会进行核查。


