The bull market in the cryptocurrency field provides significant opportunities for investors.
Author: Greythorn
Opening
Today we explore key macroeconomic factors - global liquidity, interest rates, inflation, and Federal Open Market Committee (FOMC) announcements - and how they affect Bitcoin prices during bull markets. We use historical data from early 2014 to the present, employing statistical and econometric analysis to identify trends and correlations, providing insights into how these factors influence market behavior and offer investment strategies.
Data Collection
We collected the following data from reliable sources:
● Interest rates: Federal Reserve Economic Data (FRED).
● Inflation: U.S. Bureau of Labor Statistics (BLS).
● Market prices: Historical prices of stocks and Bitcoin obtained from financial databases.
● FOMC announcements/news: Federal Reserve announcements and news archives, as well as U.S. Treasury press releases.
Global Market Liquidity
Liquidity, the availability of cash and easily tradable assets, is crucial for a healthy economy. Increased liquidity drives asset prices higher as more funds flow into the market, facilitating rapid and stable trading. During periods of high liquidity, trading volume and prices rise. Understanding these trends helps investors seize market opportunities and make wise decisions to maximize returns.
Liquidity is measured through multiple indicators, including:
Money Market Funds: These funds, typically composed of highly liquid, short-term securities, serve as a good indicator of available liquidity in the financial system. They reflect institutions' ability to meet their short-term obligations.
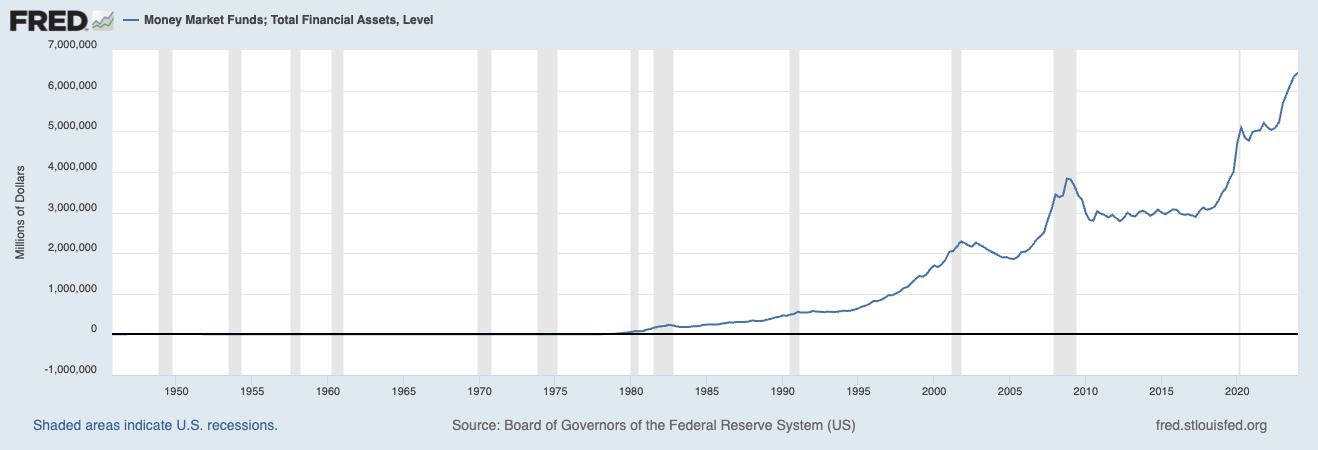
Source: Federal Reserve Economic Data
Bank Reserves: Reserves held by banks at the central bank also indicate liquidity. Higher reserves imply more liquidity available in the banking system to support lending and investment.
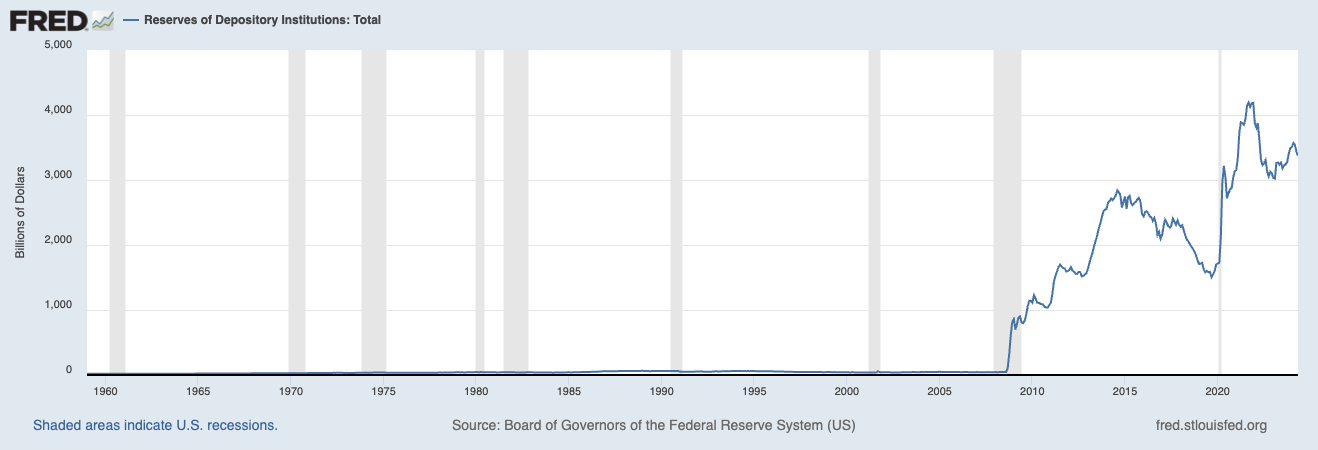
Source: Federal Reserve Economic Data
Liquidity Coverage Ratio: This regulatory standard ensures that financial institutions hold enough high-quality liquid assets to cover their total net cash outflows over 30 days. It is an important indicator of banking liquidity health.
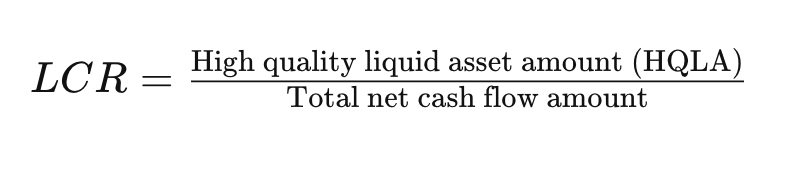
Source: Investopedia
Turnover Ratios: Turnover ratios for stocks and bonds indicate market liquidity. Higher turnover ratios suggest greater market liquidity, allowing assets to be bought and sold quickly without significant price changes.

Source: Investopedia
However, one of the primary measures we use is 'M2' money supply. M2 includes all cash held by the public and in bank accounts. It encompasses physical currency, checking accounts, savings accounts, and other near money assets. Tracking M2 helps us understand the overall liquidity in the economy and the amount of funds available for spending and investment.
Historically, peaks in global M2 growth coincide with Bitcoin bull markets. It is not just the amount of currency in circulation that is important, but also the rate of change in money supply. Bitcoin's volatility often aligns with changes in M2 momentum. Monitoring M2 becomes particularly important during bull markets as increased liquidity typically drives market upswings, making more funds available for investment and thus boosting asset prices.
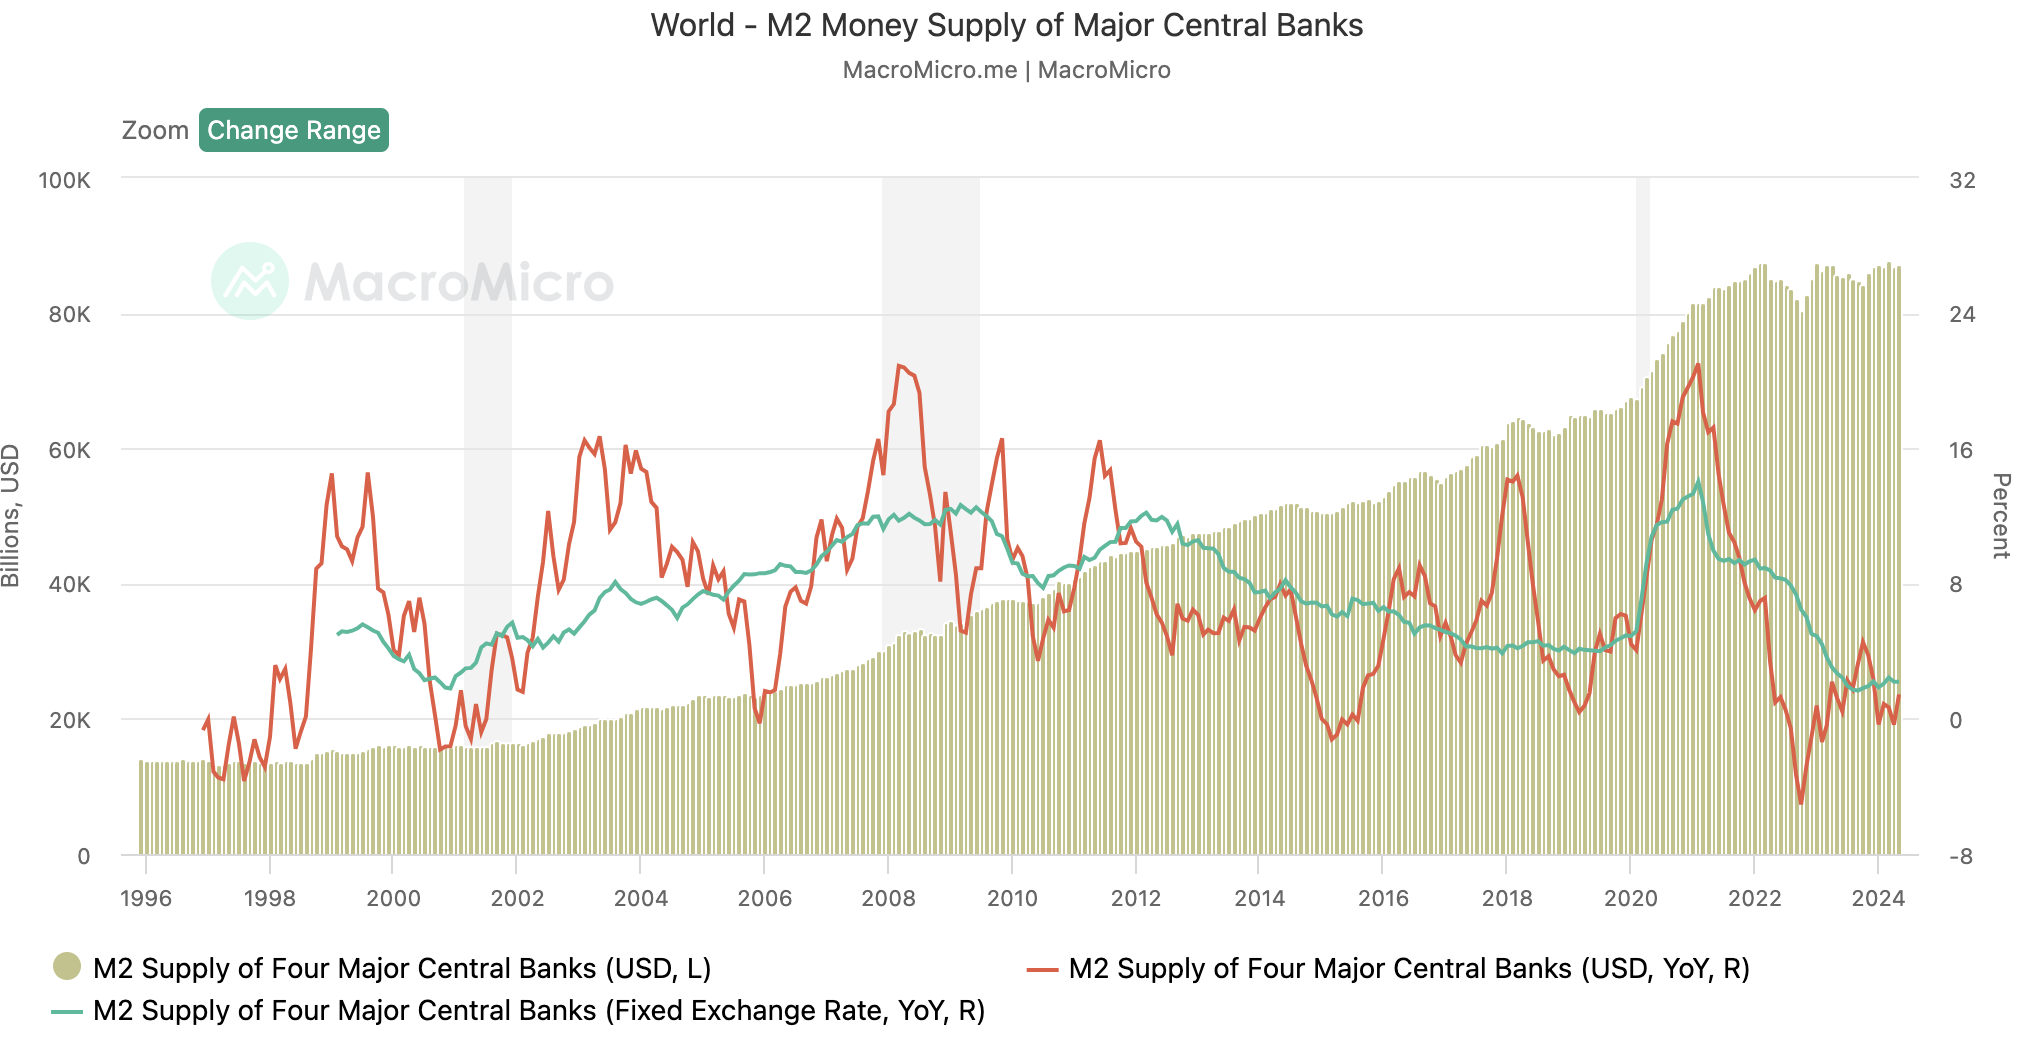
Source: MacroMicro
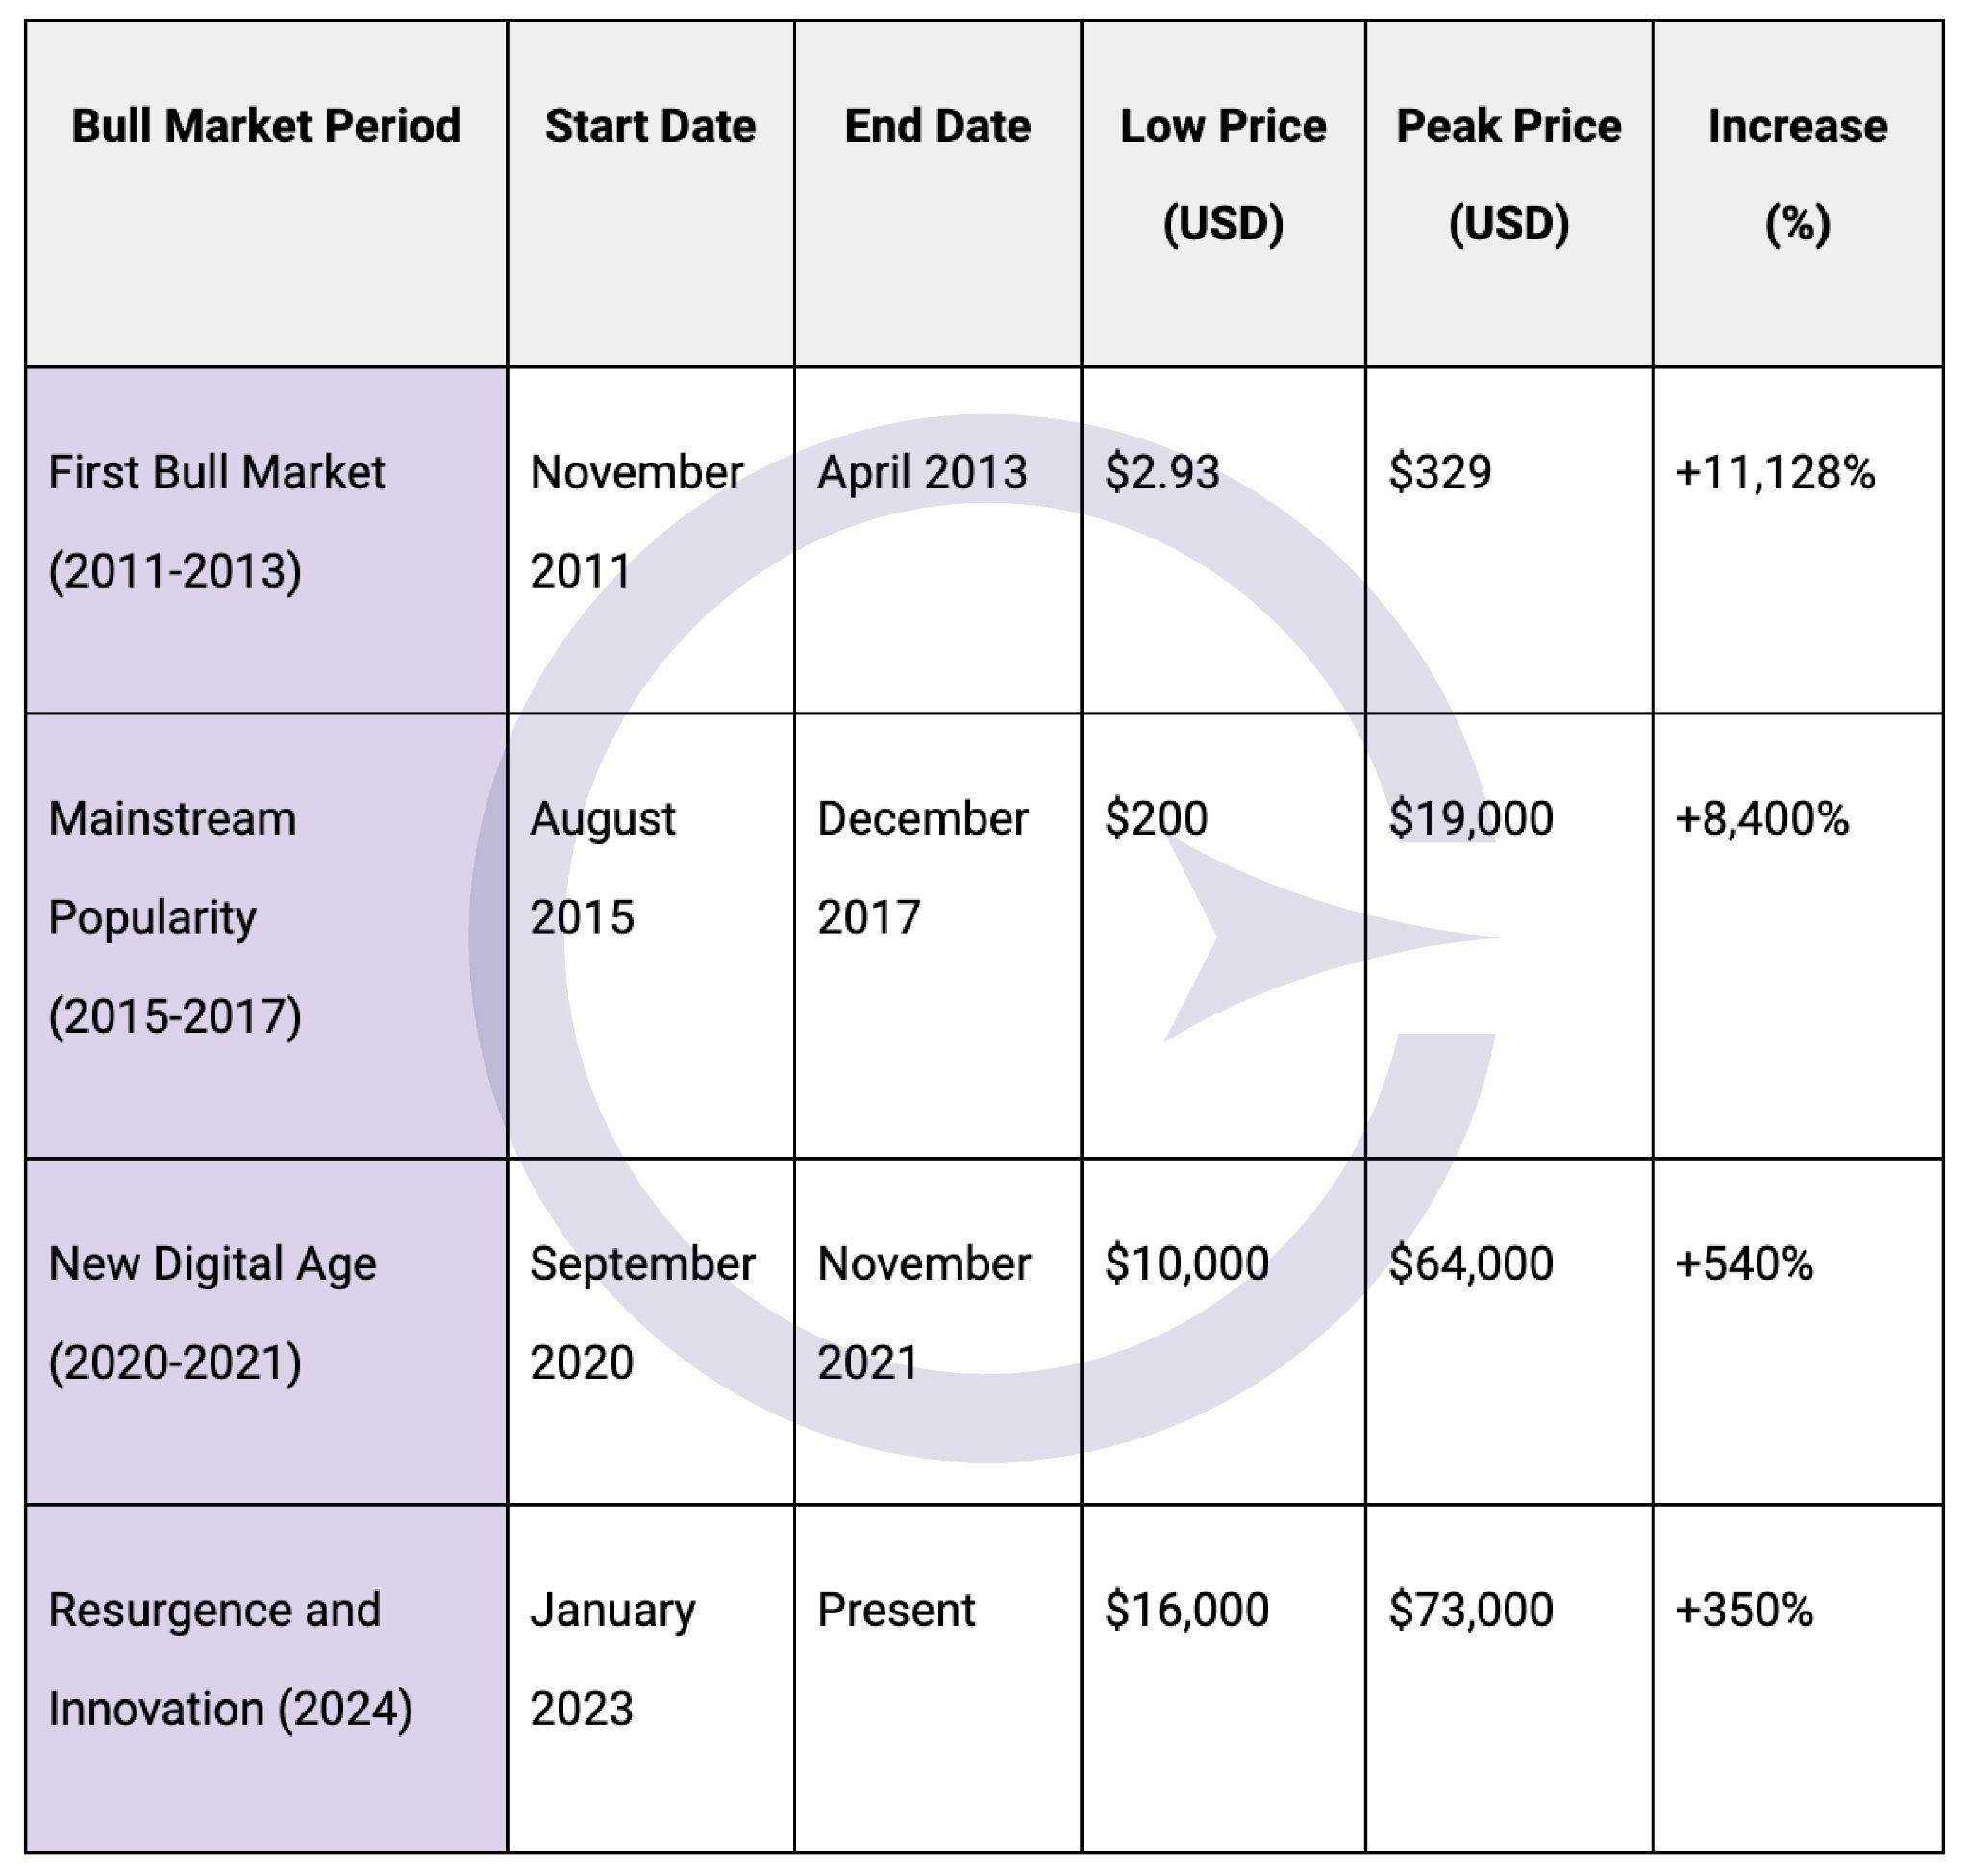
The bull market in the cryptocurrency field provides significant opportunities for investors. Here are some significant bull markets in crypto history:
Source: Greythorn
As shown in the chart, global liquidity cycles exhibit clear periodicity.
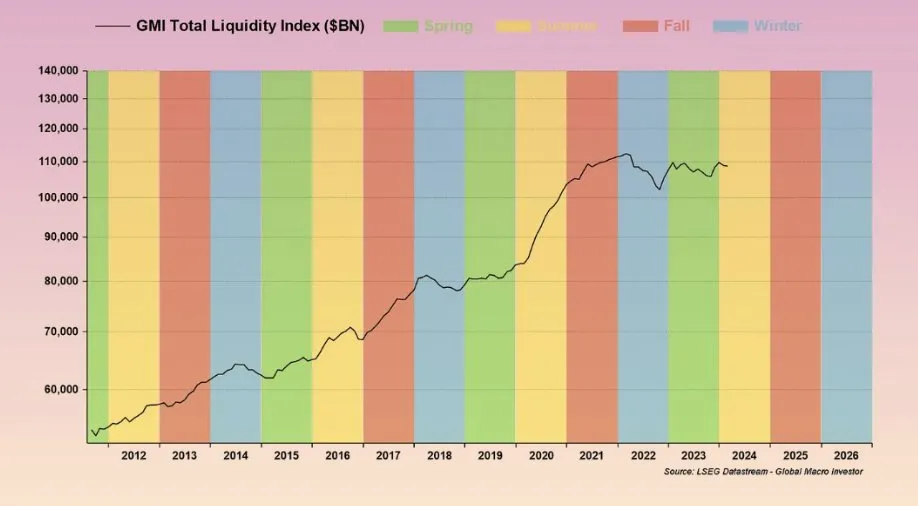
Source: Global Macro Investor
Historically, as mentioned earlier, there is a significant correlation between the growth of global M2 money supply and Bitcoin bull markets.
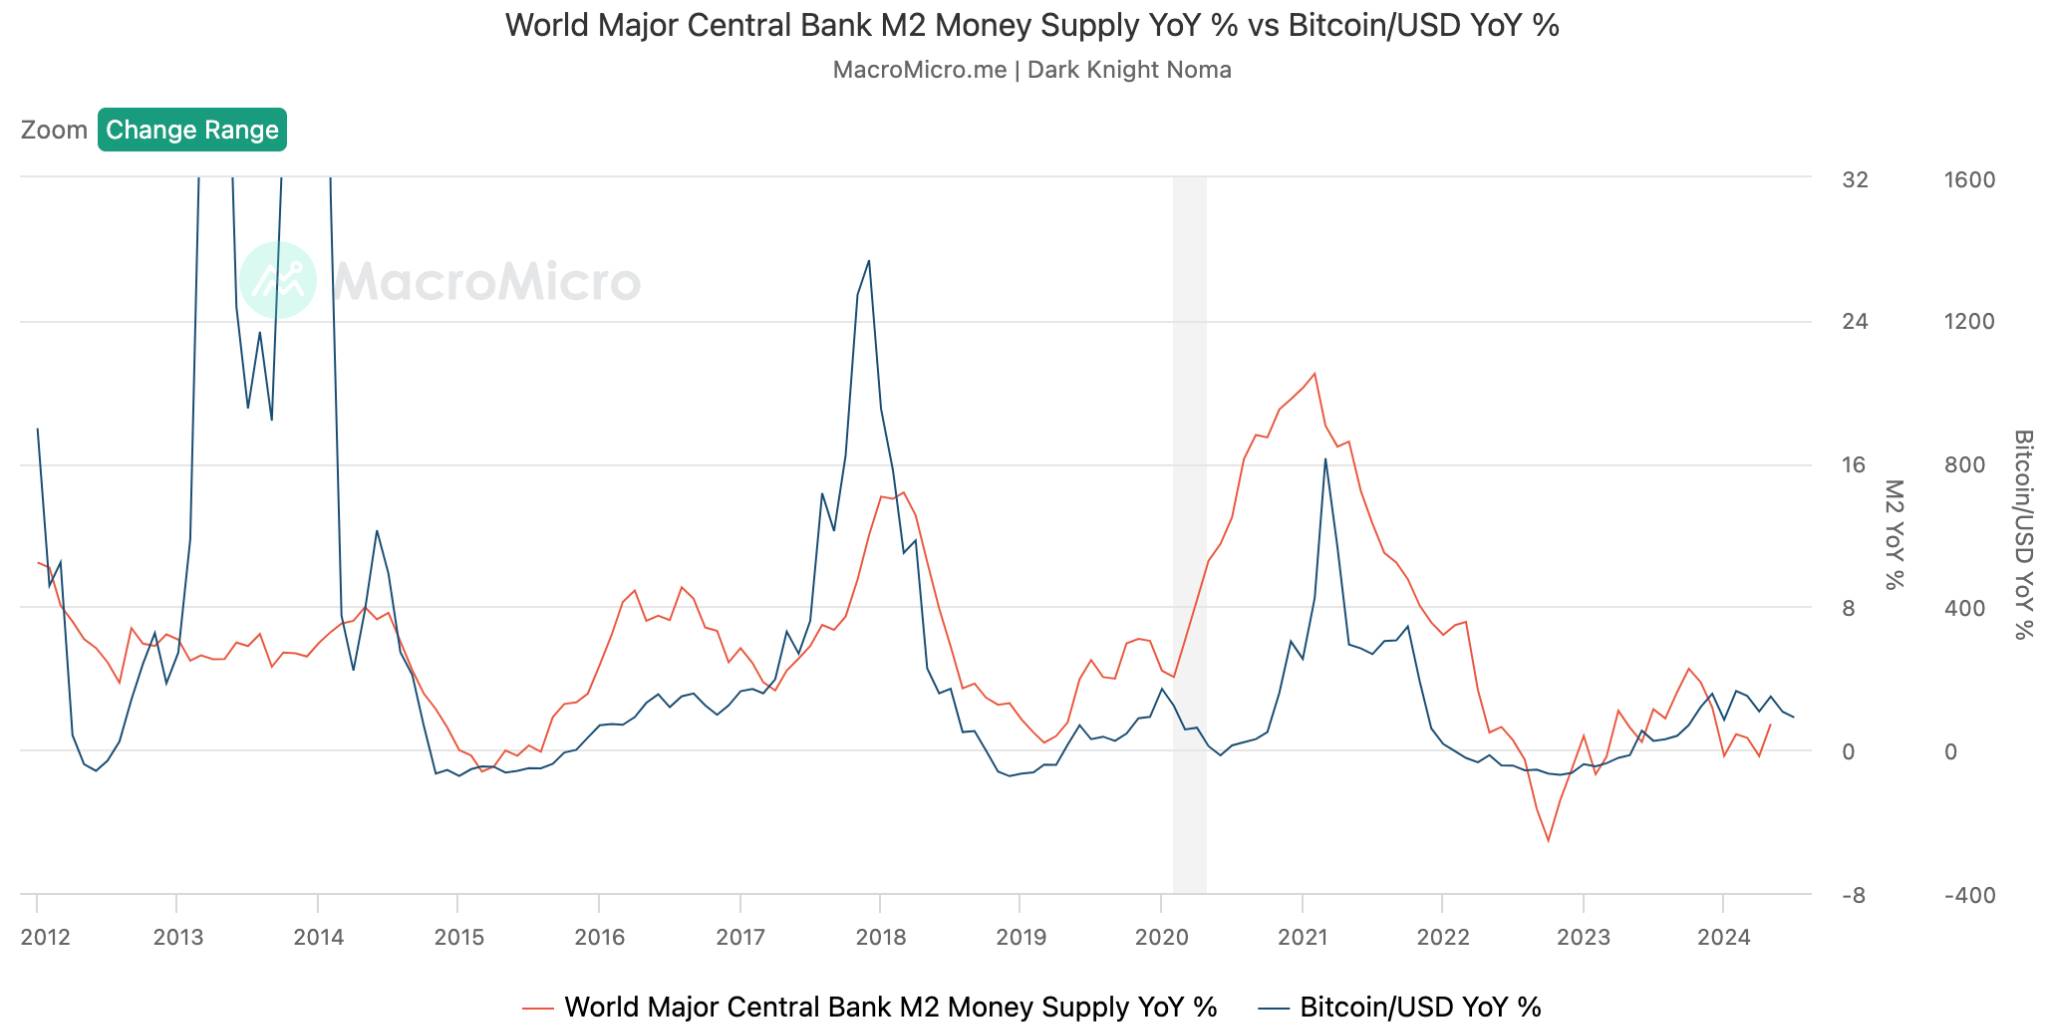
Source: MacroMicro
First Bull Market (2011-2013)
● M2 growth: Central banks increased liquidity to stabilize the economy during the European financial crisis and the Cyprus banking crisis.
● Bitcoin response: With the surge in liquidity, Bitcoin prices skyrocketed from $2.93 to $329, reflecting increased demand for non-traditional financial assets. However, this surge was primarily driven by the novelty of Bitcoin and its small market capitalization, making it more susceptible to significant price fluctuations.
Mainstream Popular Bull Market (2015-2017)
● M2 growth: Following financial turmoil, low interest rates and increased money supply persisted.
● Bitcoin response: Bitcoin surged from $200 to $19,000, with mainstream media and institutional interest further driving its demand amid growing liquidity.
New Digital Age Bull Market (2020-2021)
● M2 growth: The COVID-19 pandemic triggered unprecedented monetary easing and stimulus measures, significantly increasing the M2 money supply.
● Bitcoin response: Bitcoin prices surged from $10,000 to $64,000 as investors sought alternatives to fiat currencies, driven by concerns about inflation and devaluation of traditional currencies.
Recovery and Innovation (2024)
● M2 growth: Efforts to curb inflation post-COVID, raising interest rates, led to an overall decline in liquidity. Liquidity has slightly increased since early 2023, but remains moderate compared to previous cycles.
● Bitcoin response: In 2024, Bitcoin reached a historic high, surging from $25,000 to $85,000. This surge occurred before the next halving event, despite high interest rates. What sets this cycle apart is that it is the first time Bitcoin reached a new high without a significant surge in liquidity, indicating unprecedented maturity in the Bitcoin market.
However, the situation for altcoins is different. As trader Benjamin Cowen pointed out, Alts/BTC is already tracking global net liquidity estimates. We may need to see an overall increase in liquidity for altcoins to enter a growth phase.
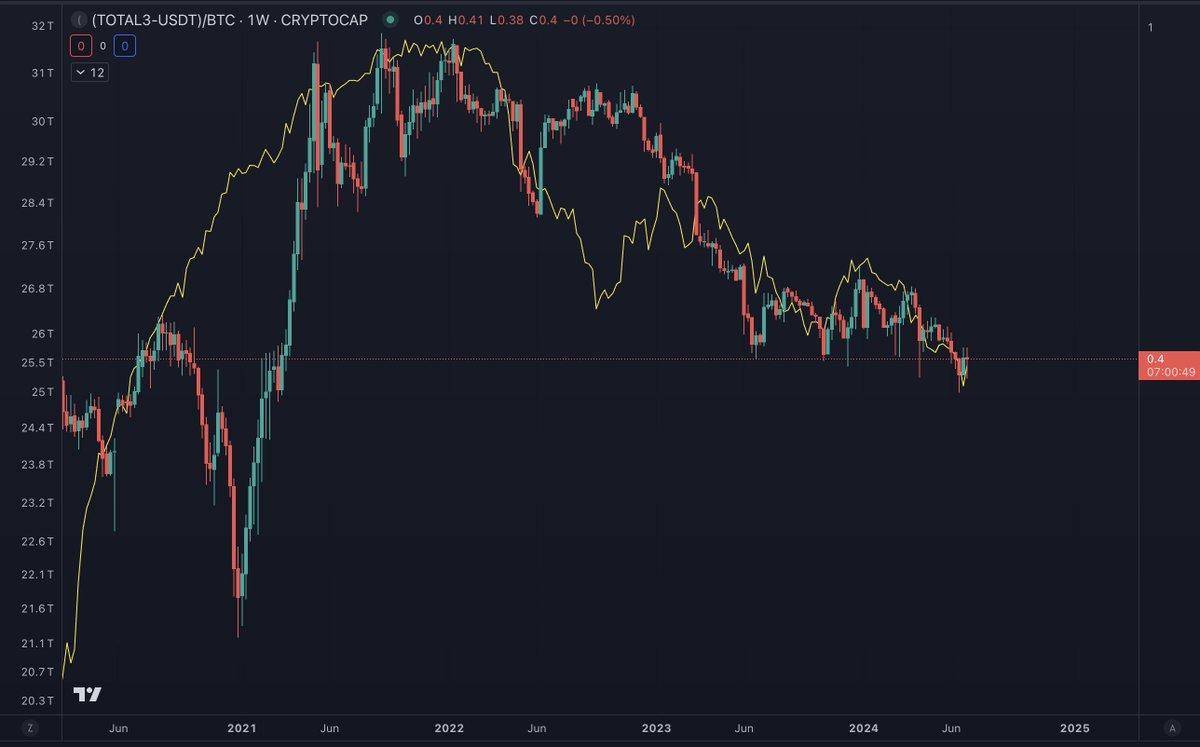
Source: TradingView
Further analysis by trader Nik shows that the dominance of BTC, USDT, and USDC is inversely related to the global money flow rate. This means that when the money supply grows faster than GDP, financialization increases, leading to asset bubbles and lower Bitcoin dominance. Conversely, if GDP grows faster than the money supply, financialization decreases, leading to higher stablecoin and Bitcoin dominance.
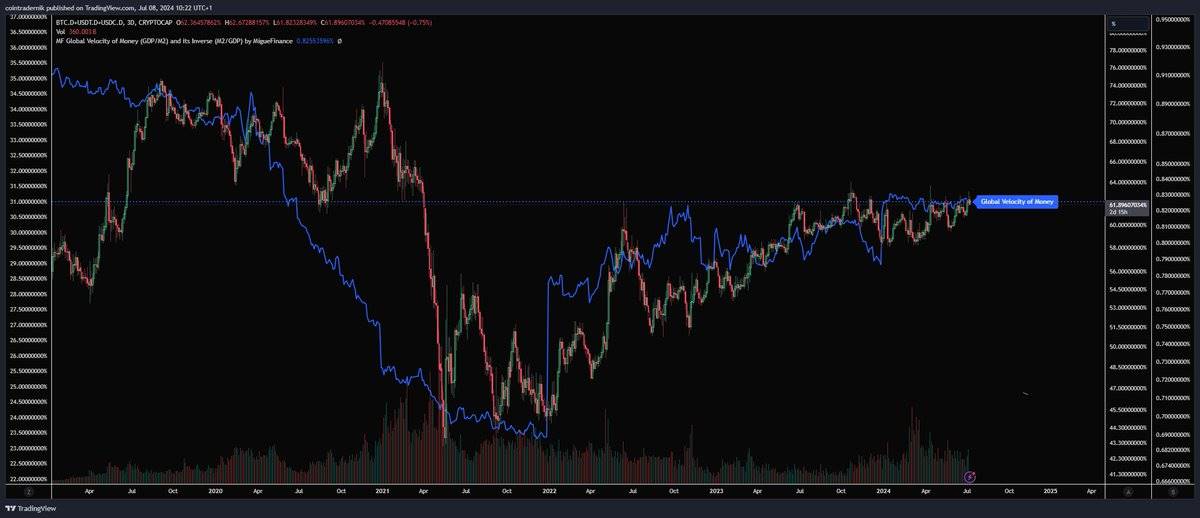
Source: TradingView
We recommend analyzing macroeconomic policies to gain insights into future liquidity trends. Monitor the global M2 money supply to understand liquidity changes and their impact on asset prices. Additionally, study market sentiment and attention flows to predict and position for market changes in advance.
Interest Rates and Inflation: Insights from FRED Data and FOMC Announcements
Despite Bitcoin being decentralized, it exhibits significant volatility around monetary policy events, reacting to changes in interest rates and economic outlook. Let's see if Bitcoin's sensitivity to central bank decisions has changed with its increasing adoption and integration into the financial system.
An interesting study shows that while Bitcoin is designed to be independent of monetary policy, it actually reacts to decisions by the Federal Reserve and the European Central Bank (ECB), with the effect changing over time.
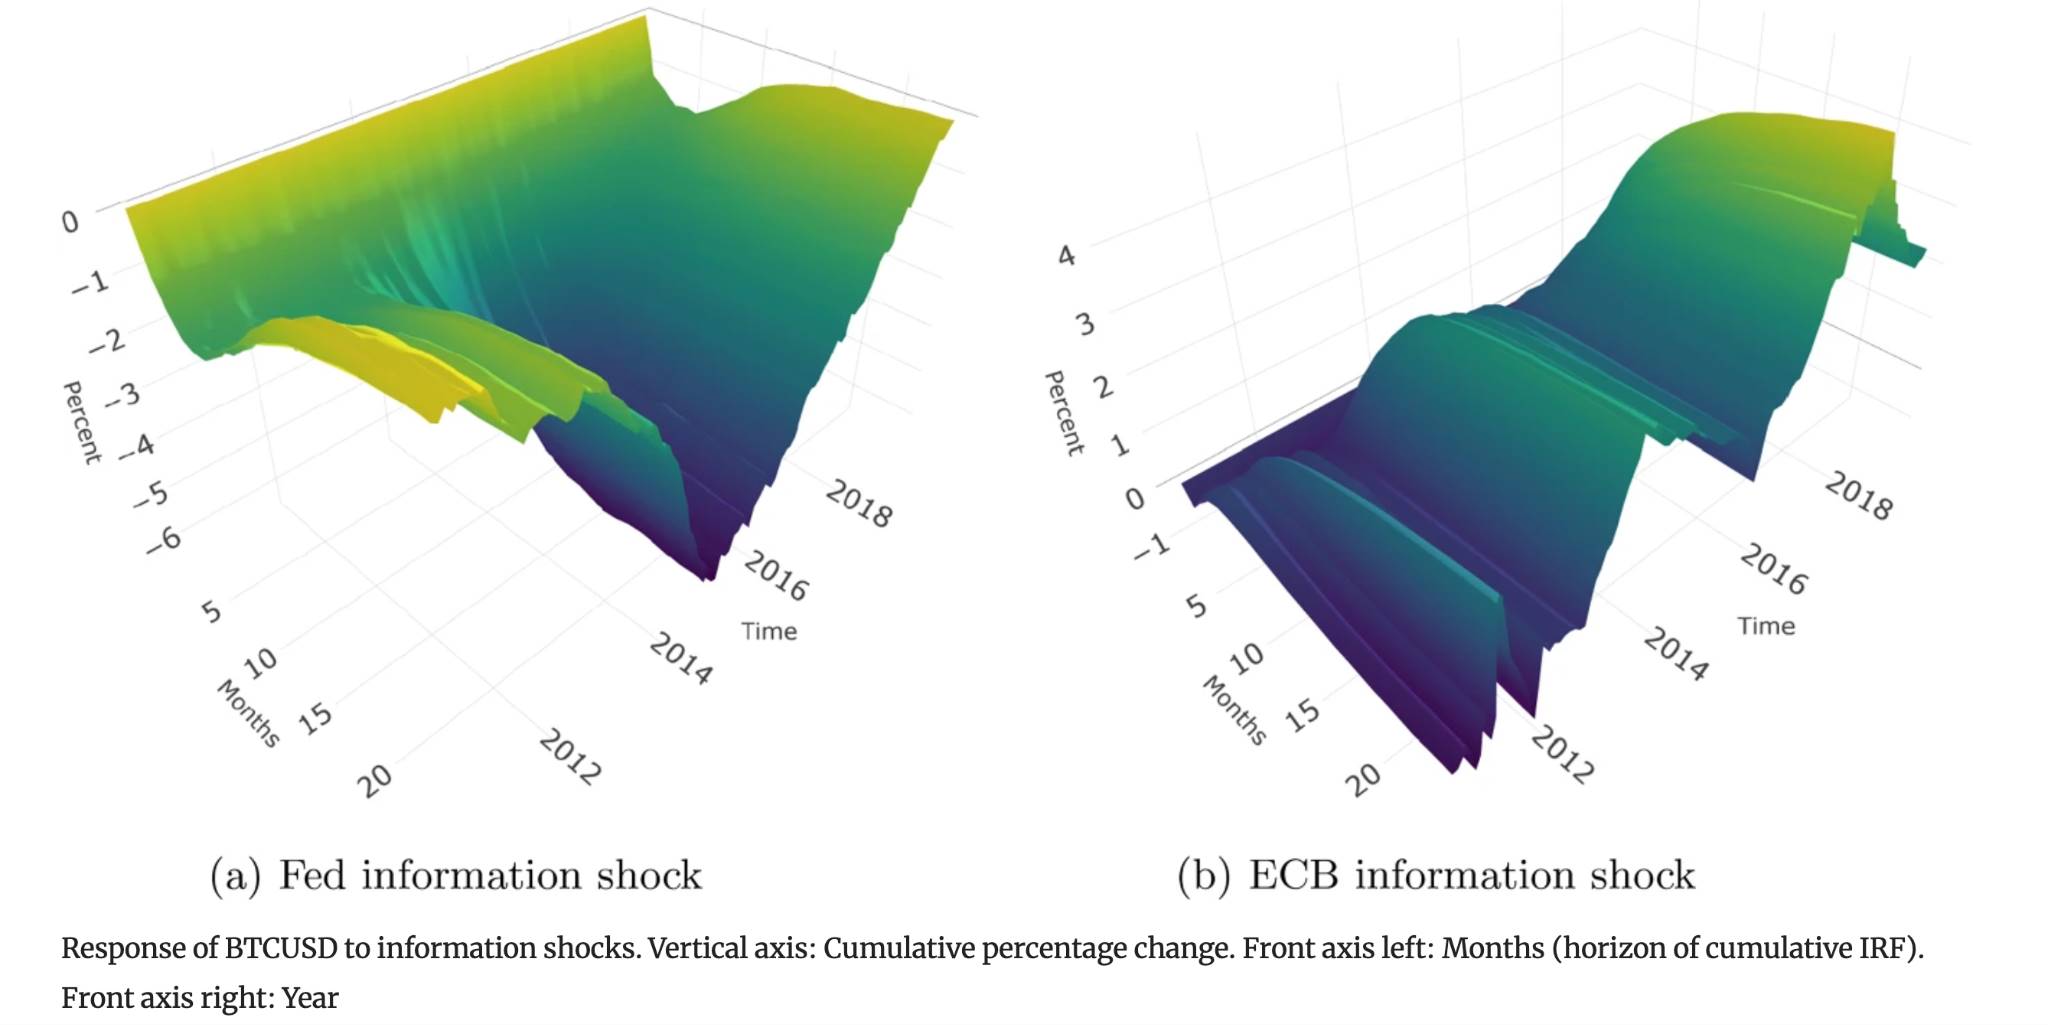
Before 2013, monetary shocks from the Federal Reserve significantly reduced Bitcoin prices. However, after 2013, these shocks began driving up Bitcoin prices, indicating a change in the market's perception of Bitcoin. Meanwhile, positive shocks from the ECB consistently lowered Bitcoin prices, showing Bitcoin's behavior as digital gold in the face of ECB decisions.
Source: Springer
Central bank information shocks have different effects on Bitcoin in the U.S. and the EU. Positive shocks from the Federal Reserve reduce Bitcoin prices, while positive shocks from the ECB typically increase Bitcoin prices, reaching a peak in early 2018. Initially, Bitcoin was not affected by these economic outlooks.
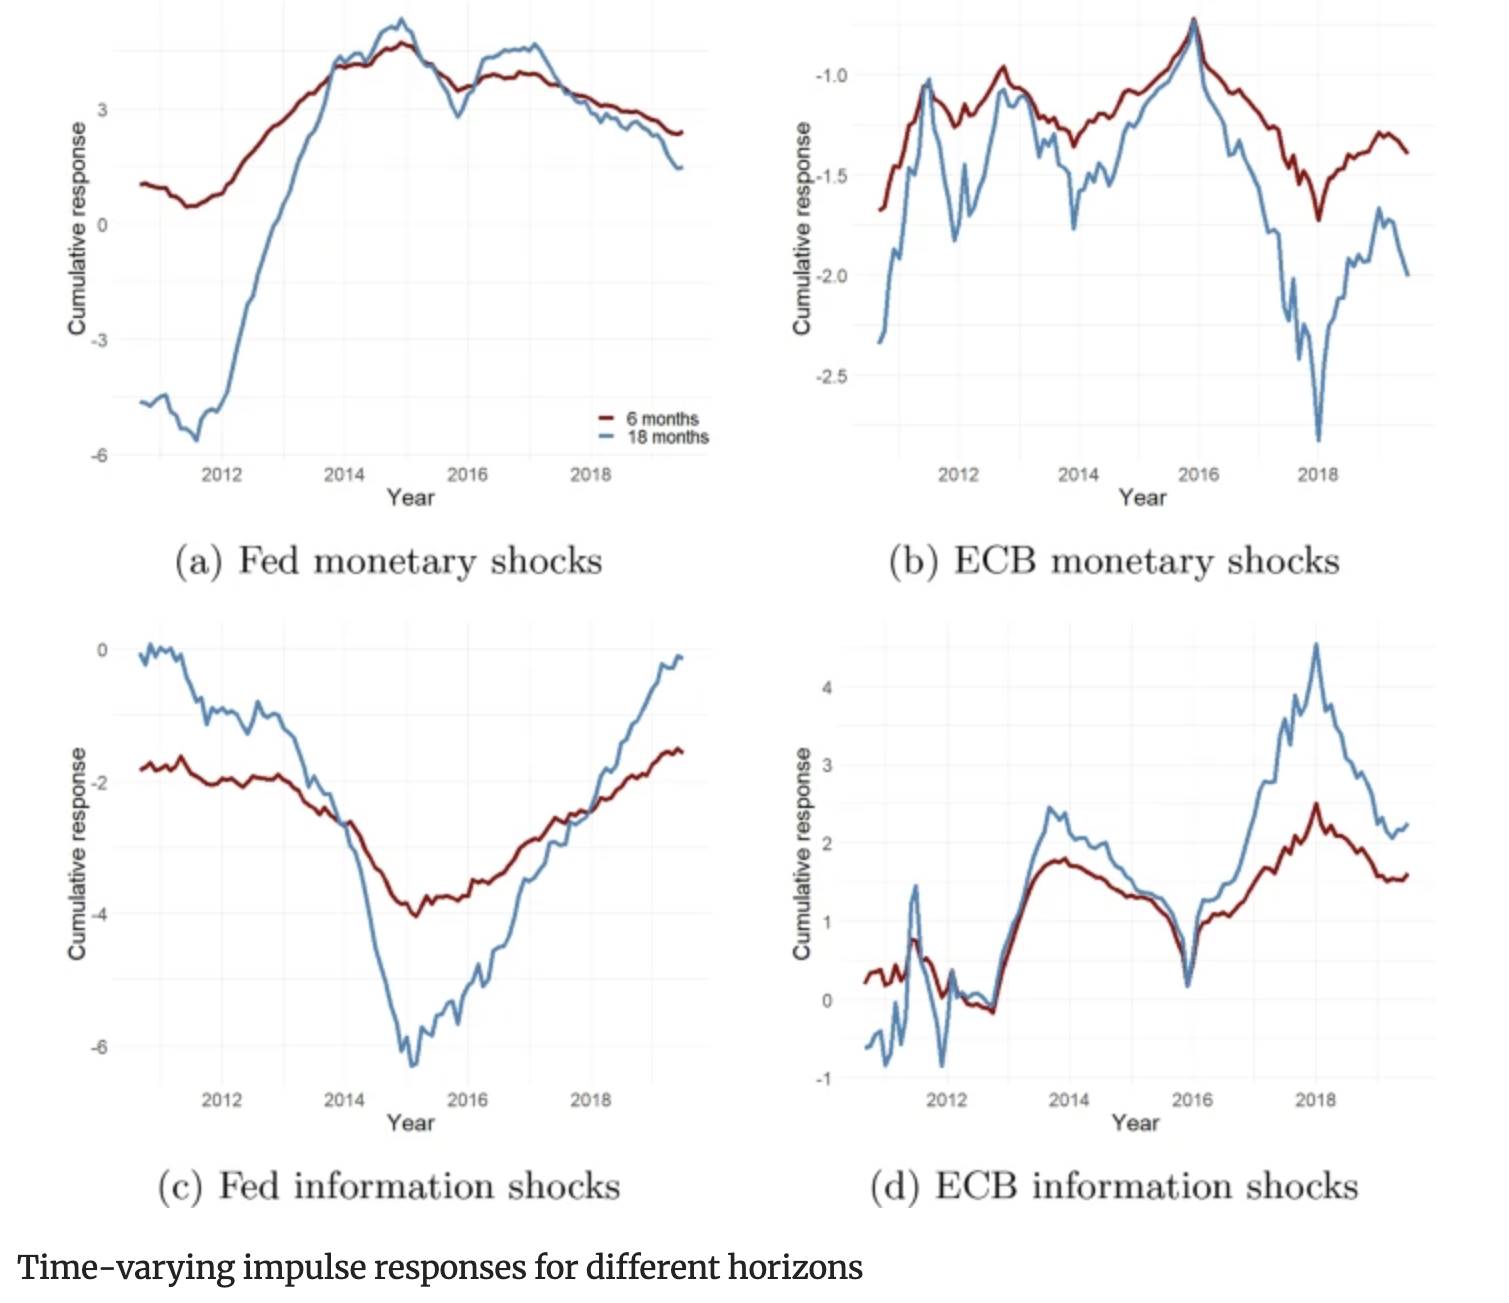
The chart below shows that Bitcoin prices typically adjust in the initial months after the shock, with similar effects at 6 and 18 months. Since 2016, the effects of ECB shocks have been more persistent, with a stronger reaction 18 months later than in the initial 6 months.
This study only includes data up to 2019. However, starting in 2020, Bitcoin's actual volatility around FOMC announcements began to rise, especially after the outbreak of the COVID-19 pandemic at the end of 2020. Bitcoin prices almost immediately reacted to Federal Reserve tightening, indicating a closer and more direct correlation with monetary policy decisions. Bitcoin's valuation response is qualitatively similar to other risk assets (such as stocks, forex, and gold), but quantitatively stronger.
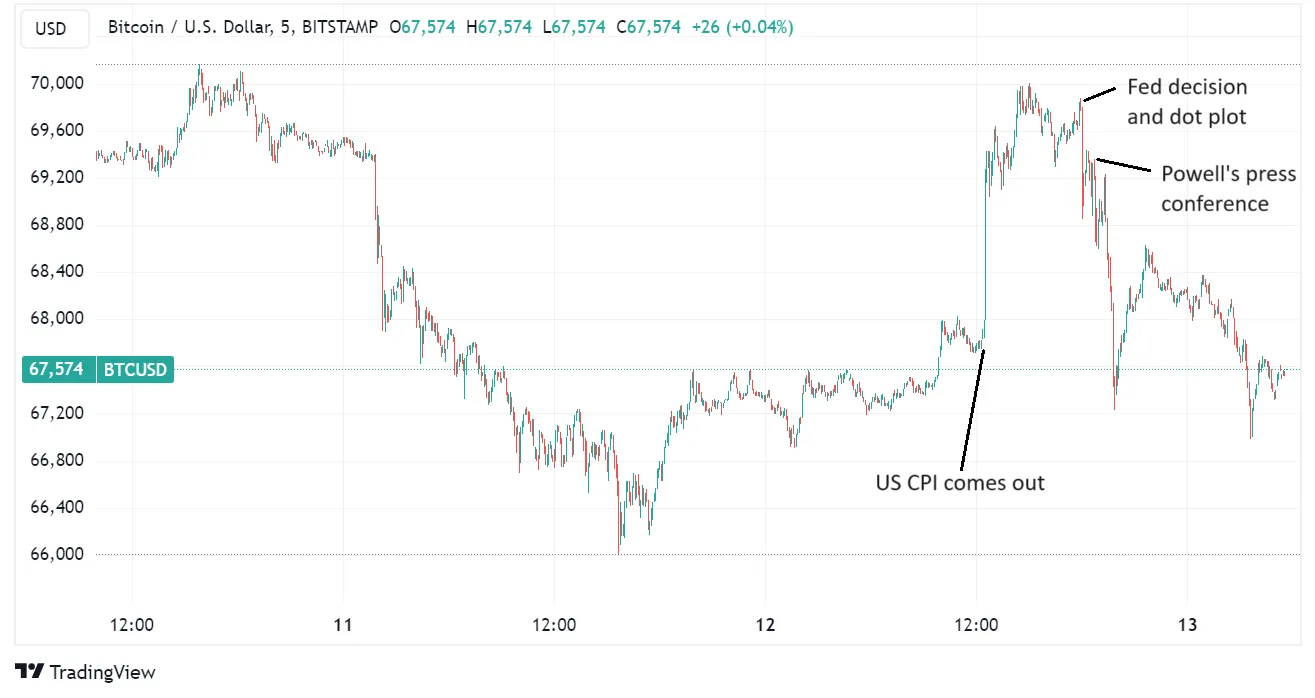
Even in the latest CPI release, we observed an increased sensitivity of Bitcoin valuation to inflation news in the high inflation environment after 2020.
In fact, in the recent CPI announcement, when the U.S. inflation rate for May was 0.0% (month-on-month), an unexpected result, Bitcoin prices rose along with most other assets. However, this initial celebration was promptly corrected when the FOMC attempted to suppress liquidity expectations.
Source: TradingView
Conclusion
Bitcoin's potential as a hedge against inflation has sparked great interest among investors and scholars. Initially, Bitcoin was valued for its scarcity and decentralized nature, seen as a hedge against inflation by some. However, empirical research yields mixed results regarding its effectiveness in this role.
Initially, Bitcoin prices did not significantly react to monetary policy announcements. It wasn't until 2019 that any response typically took several months to materialize. However, since 2020, Bitcoin prices immediately began to decline after Federal Reserve tightening, indicating an increased sensitivity to and closer correlation with monetary policy decisions. This shift highlights an increased sensitivity of Bitcoin to central bank actions.
Evidence suggests that the relationship between Bitcoin and inflation is complex and evolving, influenced by market maturity and broader economic conditions. However, Bitcoin's price dynamics are closely linked to global liquidity conditions, driven by central bank policies, investor behavior, and institutional investment trends.
These findings suggest that the initial demand for Bitcoin was more due to its use as borderless, decentralized digital cash rather than as an inflation hedge. However, after 2020, the substantial drop in Bitcoin prices following Federal Reserve tightening underscores speculative motives and a broader investor base and widespread acceptance.
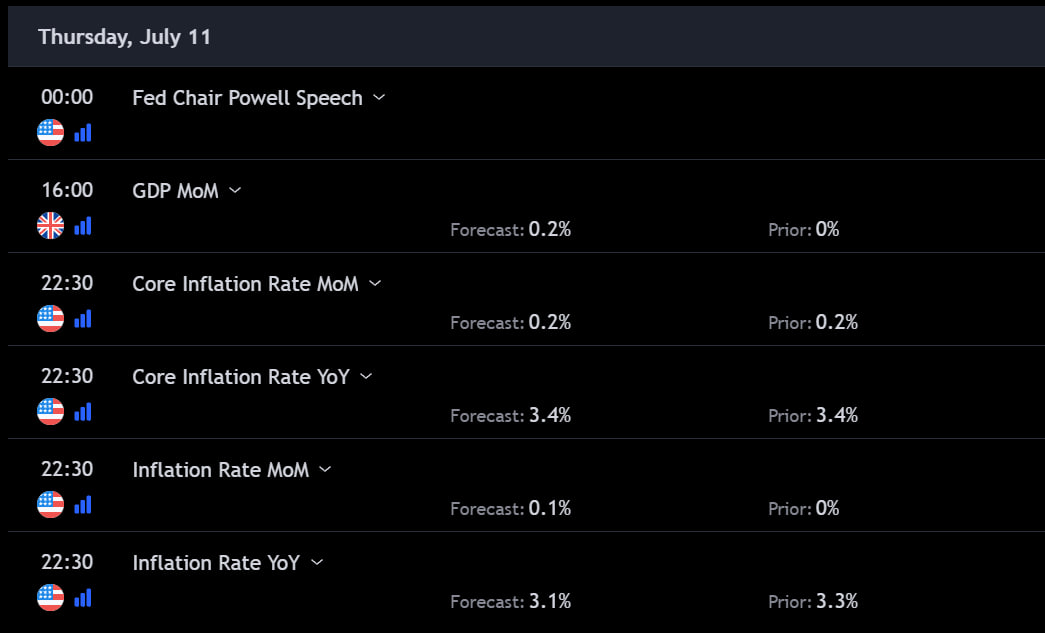
For the upcoming CPI release (Thursday, July 11, 2024), market forecasts show no significant change, with expectations as follows.
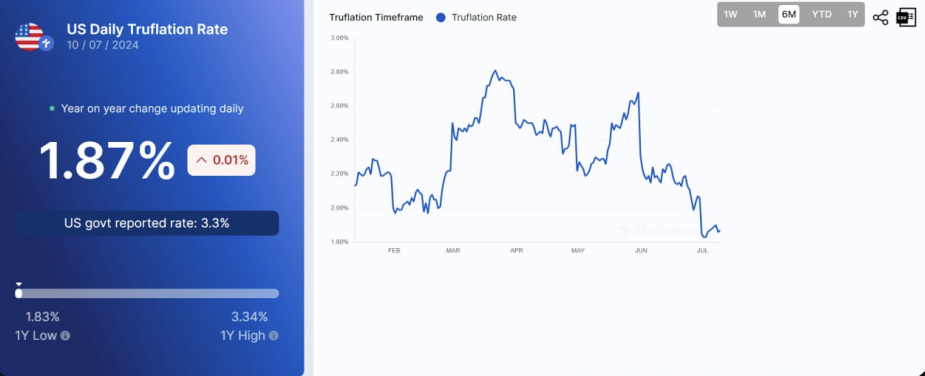
Please note that the Truflation ratio shown above provides additional insights, which may be relevant if the actual results again fall below expectations.
Source: Truflation.com
Disclaimer
This presentation is prepared by Greythorn Asset Management Pty Ltd (ABN 96 621 995 659) (Greythorn). The information in this presentation should be considered general information and not investment advice or financial advice. It is not an advertisement, nor a solicitation or offer to buy or sell any financial instruments or participate in any specific trading strategy. When preparing this document, Greythorn has not taken into account the investment objectives, financial situation, or specific needs of any recipient. Before making any investment decisions, recipients of this presentation should consider their individual circumstances and seek professional advice from their accountant, lawyer, or other professional advisors. This presentation contains statements, opinions, forecasts, projections, and other materials based on various assumptions (forward-looking statements). Greythorn is under no obligation to update the information. These assumptions may be correct or incorrect. Greythorn and its officers, employees, agents, advisors, or any other person mentioned in this presentation do not make any representations about the accuracy or likelihood of achieving any forward-looking statements or their underlying assumptions. To the extent permitted by law, Greythorn and its officers, employees, agents, and advisors are not liable for any loss, claims, damages, expenses, or costs arising from the information in this presentation. This presentation is the property of Greythorn. By receiving this presentation, you agree to keep its contents confidential and agree not to copy, provide, distribute, or disclose any information in its contents without written consent.
免责声明:本文章仅代表作者个人观点,不代表本平台的立场和观点。本文章仅供信息分享,不构成对任何人的任何投资建议。用户与作者之间的任何争议,与本平台无关。如网页中刊载的文章或图片涉及侵权,请提供相关的权利证明和身份证明发送邮件到support@aicoin.com,本平台相关工作人员将会进行核查。


