Introducing the LTP Liquidity Score: A Liquidity Calculation Method Based on Order Book Depth
Report Summary
In the trading world, liquidity is crucial for any type of investor, trader, or exchange. This report aims to introduce and analyze the liquidity changes of various currencies in centralized cryptocurrency exchanges based on order book depth data, and to derive the overall trend of the exchange's liquidity changes for investors' reference.
As a leading prime brokerage service provider in the cryptocurrency industry, LTP uses independently developed liquidity scoring methods to comprehensively evaluate the liquidity performance of exchanges. By comparing order book depth data for over 13 cryptocurrency pairs across 12 mainstream exchanges for a period of over 6 months, this report draws the following key conclusions:
- The top four exchanges with the best liquidity are Binance, Kraken, Coinbase, and OKX, and their rankings remain relatively stable over the observation period of over 6 months.
- Since March 2024, the liquidity performance of Gate and KuCoin has shown a gradual increase, while Bitfinex's liquidity has exhibited higher volatility.
- Bitcoin liquidity performance: Within a 0.1% price range, Binance consistently maintains a leading position in liquidity performance. Once the price range exceeds 0.3%, Binance's liquidity for Bitcoin trading pairs becomes more volatile, while Kraken's liquidity performance is relatively higher.
- Ethereum liquidity performance: Compared to Bitcoin, Ethereum's liquidity across all exchanges is more volatile across five price range levels. Conversely, Binance's Ethereum liquidity score only becomes more stable when the price range exceeds 0.3%.
By observing the LTP liquidity index, from January to June 2024, the overall LLI liquidity index of the market steadily increased and experienced five liquidity peaks. The first three occurred in March when the price of Bitcoin surpassed its previous high, and the last two occurred in early June.
Brief Introduction to Liquidity Concept
What Does Liquidity Mean in Finance?
In the financial market, liquidity refers to the ease with which an asset or security can be converted into cash without significantly affecting its price.
Where "without significantly affecting its price" implies:
- The smaller the impact of a transaction on market prices, the higher the liquidity of the asset.
The larger the impact of a transaction on market prices, the lower the liquidity of the asset.
For example:
- Scenario 1: Alice purchases $100,000 worth of Asset A, causing a 1% price increase.
- Scenario 2: Bob purchases $100,000 worth of Asset B, causing a 2% price increase.
In the above two scenarios, it can be seen that Asset A is more liquid than Asset B. This is because for the same investment amount, the price increase for Asset A is smaller, indicating that the investment has a smaller impact on market prices, and therefore, it has better liquidity.
The ease with which an asset can be converted into cash indicates:
- The easier the process of converting an asset into cash, the better its liquidity.
The more difficult the process of converting an asset into cash, the worse its liquidity.
For example, in general:
- Gold is easier to sell for various national currencies than real estate, indicating that gold can be converted into cash more quickly and easily.
Therefore, gold has better liquidity than real estate.
Liquidity of Crypto Exchanges
Liquidity of Centralized Exchanges (CEX)
In the crypto industry, almost every centralized exchange uses an order book to list all open orders.
Generally, the more buy and sell orders included in the order book, the better the liquidity of the trading asset.
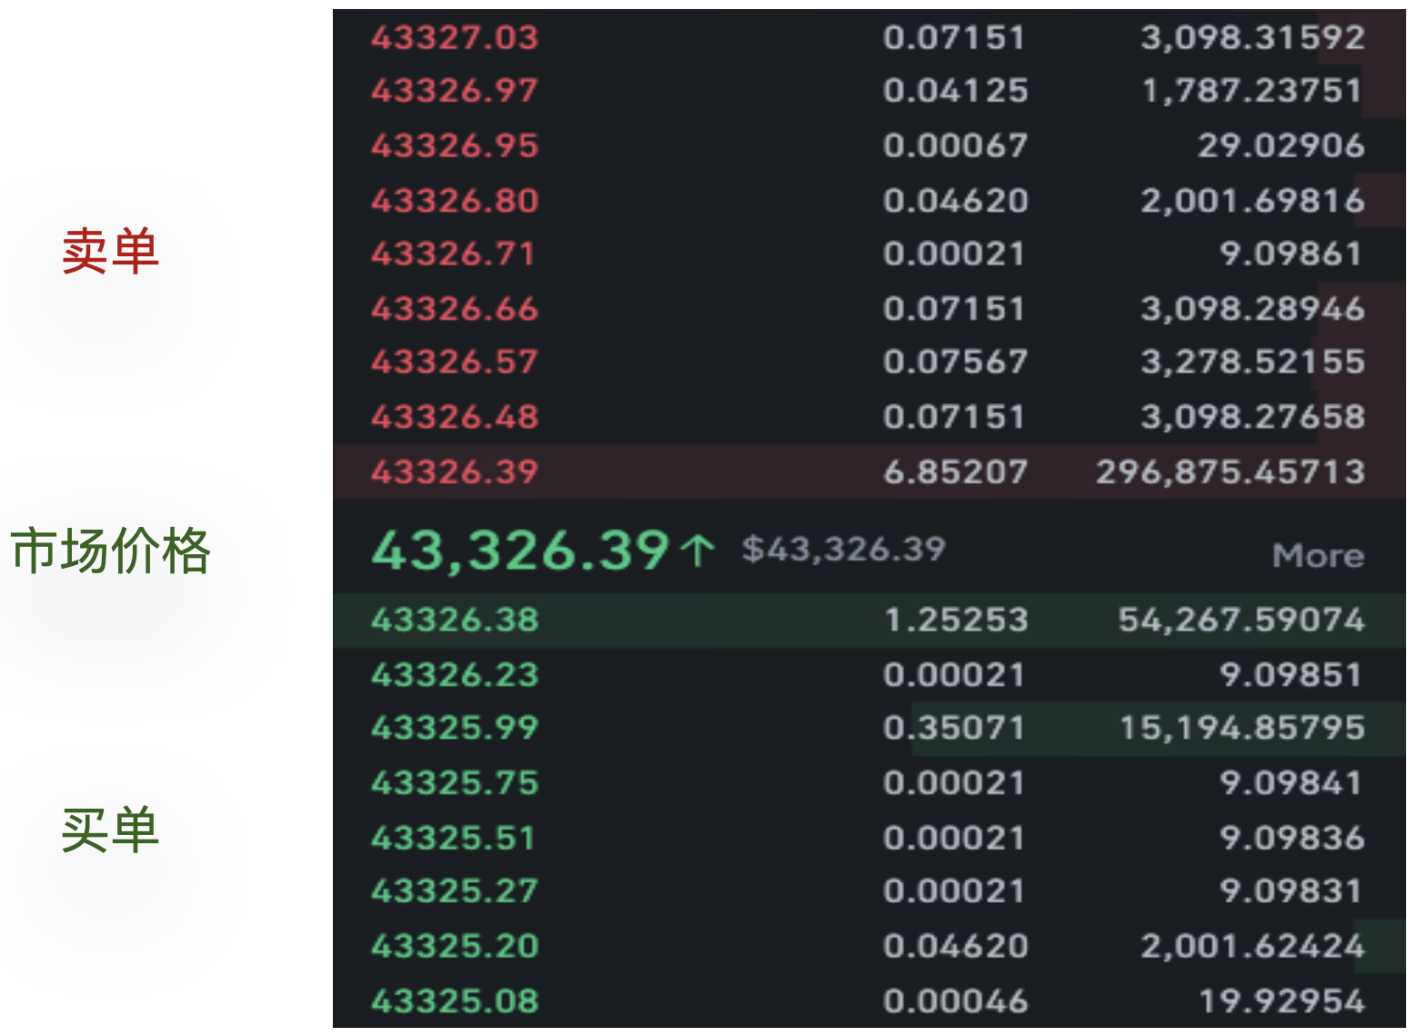
Source: binance.com
In centralized exchanges, investors can identify which exchange provides the best liquidity by comparing the depth of the order book, whether in terms of Bitcoin quantity or in USD.
Liquidity Score Calculation Methodology
Liquidity of Decentralized Exchanges (DEX)
Decentralized exchanges (DEX) serve as the cornerstone protocols and foundation of liquidity in the decentralized finance (DeFi) space, relying on a trading mechanism called an automated market maker (AMM).
As Ethereum's settlement speed is limited, the operation of most DEX does not rely on traditional buy and sell orders and therefore does not require an order book, unlike traditional exchanges. Traders on DEX directly trade with liquidity pools composed of two tokens*. The price of each token in the pool is determined by a fixed mathematical formula. The most classic DEX, Uniswap, uses the constant product formula: x * y = k, meaning that without adding liquidity, the product of the quantities of the two tokens in the pool remains constant regardless of user trades.
In DEX, there is a role for liquidity providers (LPs) who are responsible for providing both tokens in the pool for trading and earning fees. As the popularity of tokens increases, there are more incentives for LPs, resulting in more tokens being added to the pool, an increase in the total value locked (TVL), and an increase in pool liquidity.
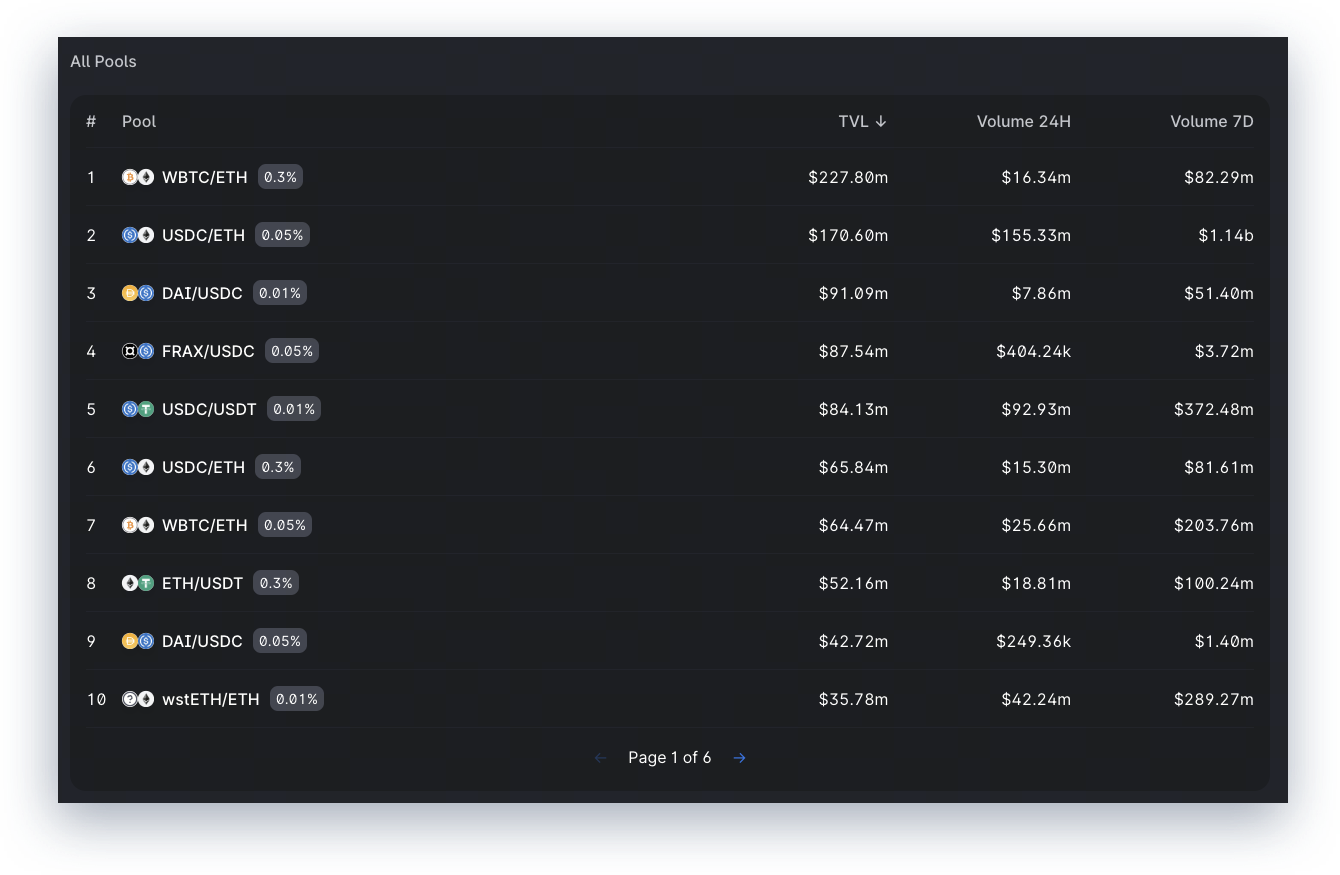
Source: https://info.uniswap.org/
Tokens with higher total value locked (TVL) in liquidity pools have better liquidity in decentralized exchanges.
LTP Liquidity Score
What is the LTP Liquidity Score?
To address the issue of exchanges inflating trading volumes leading to inaccurate reflections of liquidity, LTP has developed a novel exchange ranking method that relies entirely on the analysis of objective order book data, without considering subjective or other confusing factors. Order book data provides valuable insights into exchange trading activity, market depth, and participant behavior. This alternative ranking method is not intended to replace existing volume-based rankings but to serve as a supplementary tool. By examining order book data, we can better understand the differences in liquidity between different exchanges and use liquidity as an indicator to evaluate exchange performance. In the following report, we attempt to:
- Explain the method used to calculate the liquidity score.
- Compare the liquidity of 12 centralized exchanges and their rankings.
- Analyze the liquidity data of mainstream high-volume tokens.
- Introduce and explain what the LTP liquidity index is.
How is the Exchange Liquidity Score Calculated?
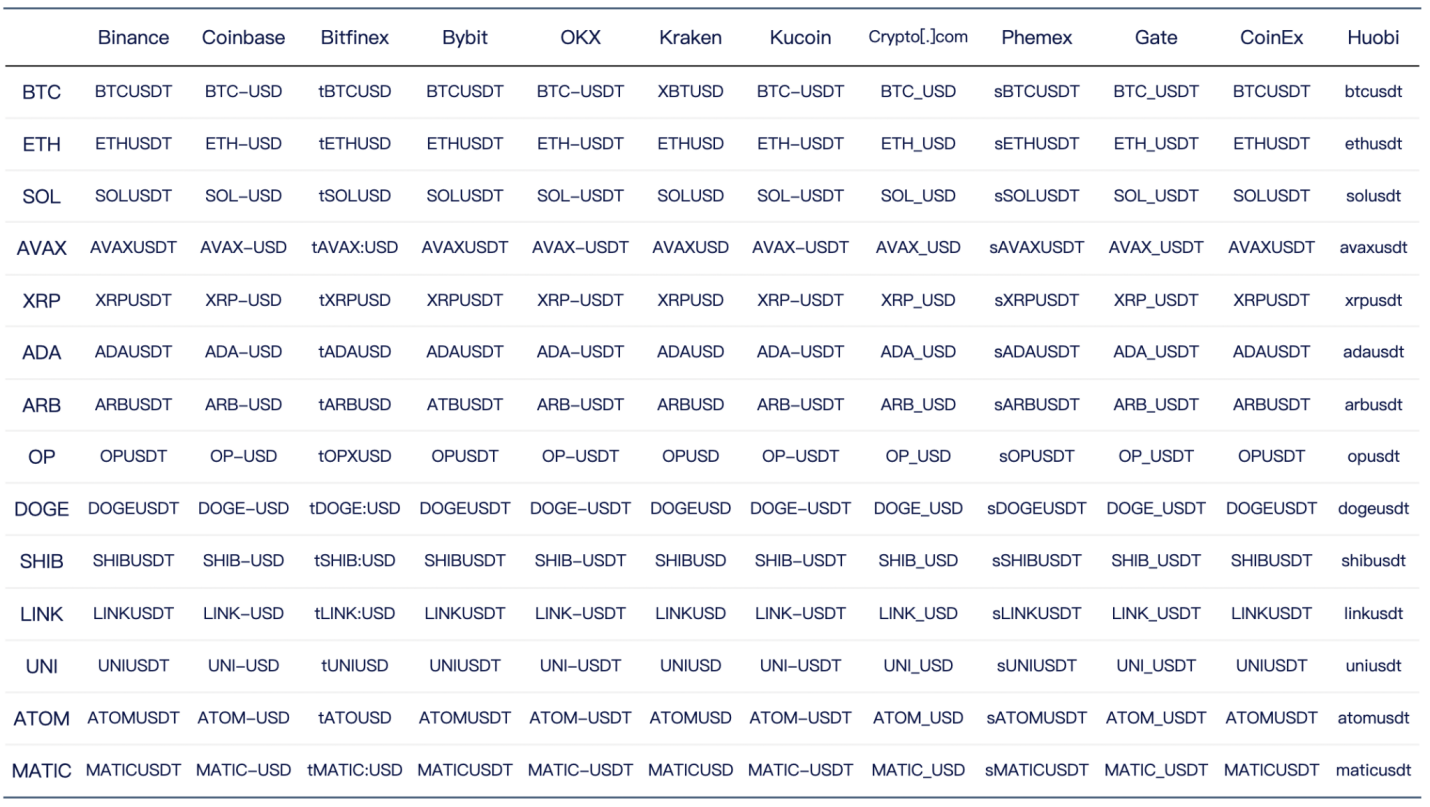
Collect Order Book Snapshot Data: Obtain order book data for the same base token trading pairs from different exchanges. For example, BTCUSDT from Binance, BTC-USD from Coinbase, XBTUSD from Kraken, and tBTCUSD from Bitfinex. This data will include buy and sell prices and corresponding quantities at various price levels.
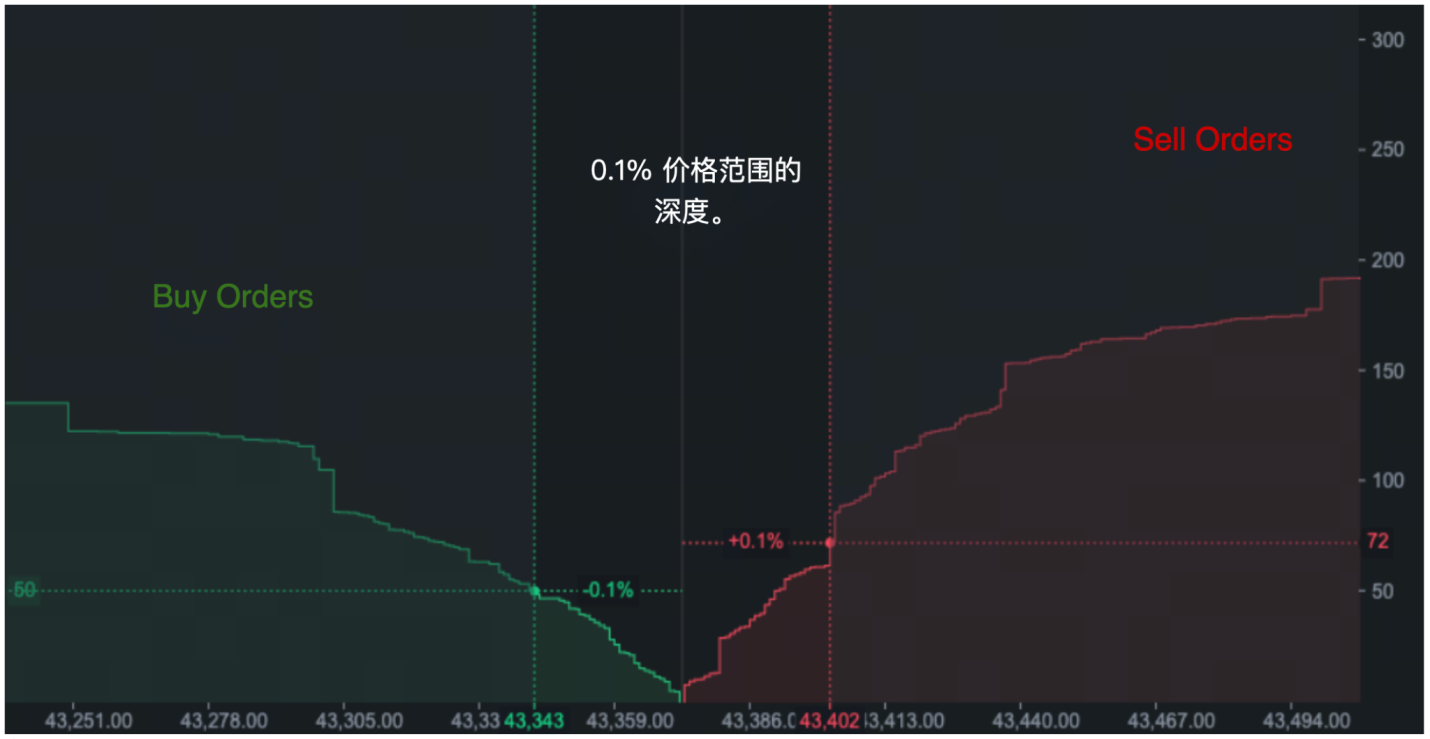
Calculate Depth of Price Ranges: Determine the depth of the order book at specific price range levels. For example, calculate the depth at 0.1%, 0.2%, 0.3%, 0.4%, and 0.5% price range levels. This involves summing the quantities of orders within specific percentage price ranges.
Calculate Liquidity Score for Each Trading Pair: Compare the depth of different trading pairs at each price range. Calculate the liquidity score for each trading pair based on relative depth. The greater the depth, the higher the liquidity score.
Aggregate Liquidity Scores: Combine the liquidity scores obtained for each trading pair at different price ranges (e.g., 0.1% to 0.5%). Calculate a weighted average score by assigning appropriate weights to each price range level and liquidity score.
Calculate Liquidity Scores for Multiple Currency Trading Pairs: Extend the same method to calculate liquidity scores for more trading pairs and different base tokens. Collect the necessary order book data for the trading pairs and repeat steps 2 to 4.
Calculate Liquidity Scores for Individual Exchanges: Finally, calculate the overall liquidity score for each exchange by aggregating the scores of all different trading pairs within the exchange, weighted by the 24-hour trading volume of each trading pair. Trading pairs with higher trading volumes will have a greater impact on the overall exchange liquidity score.
In the next page, we will illustrate the above process with a diagram. For detailed explanations of the methodology, please visit: Exchange Liquidity Ranking Methodology.
Selection of Currencies and Trading Pairs
For spot trading, an exchange offers trading options for multiple currencies and generally provides trading options for multiple quote currencies for the same base currency. Therefore, the liquidity of an exchange is highly diversified.
To analyze the liquidity of exchanges more realistically, we first examine their best liquidity trading pairs.
Ideally, all trading pairs should be considered, but due to specific limitations, we choose a limited number of trading pairs that account for over 70% of the total trading volume.
When comparing exchanges, we focus on trading pairs with the same base currency (e.g., BTC-USDT vs. BTC-USD).
We first analyze the order book data for the selected trading pairs. The score for a trading pair is calculated by comparing different trading pairs with the same base currency within the same exchange.
The overall liquidity score for an exchange is based on the trading pair scores weighted by trading volume.
Exchange Liquidity Ranking
Exchange Liquidity Scores
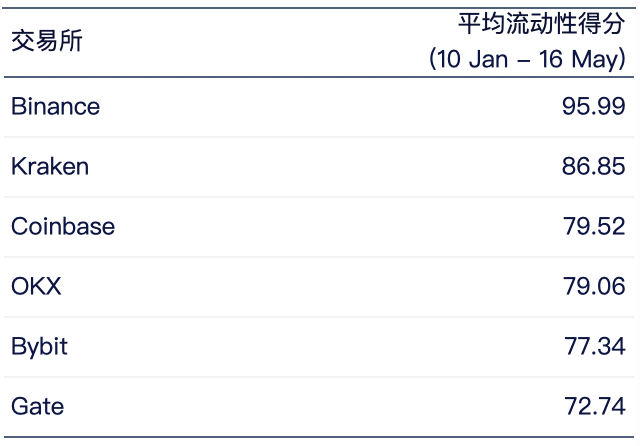
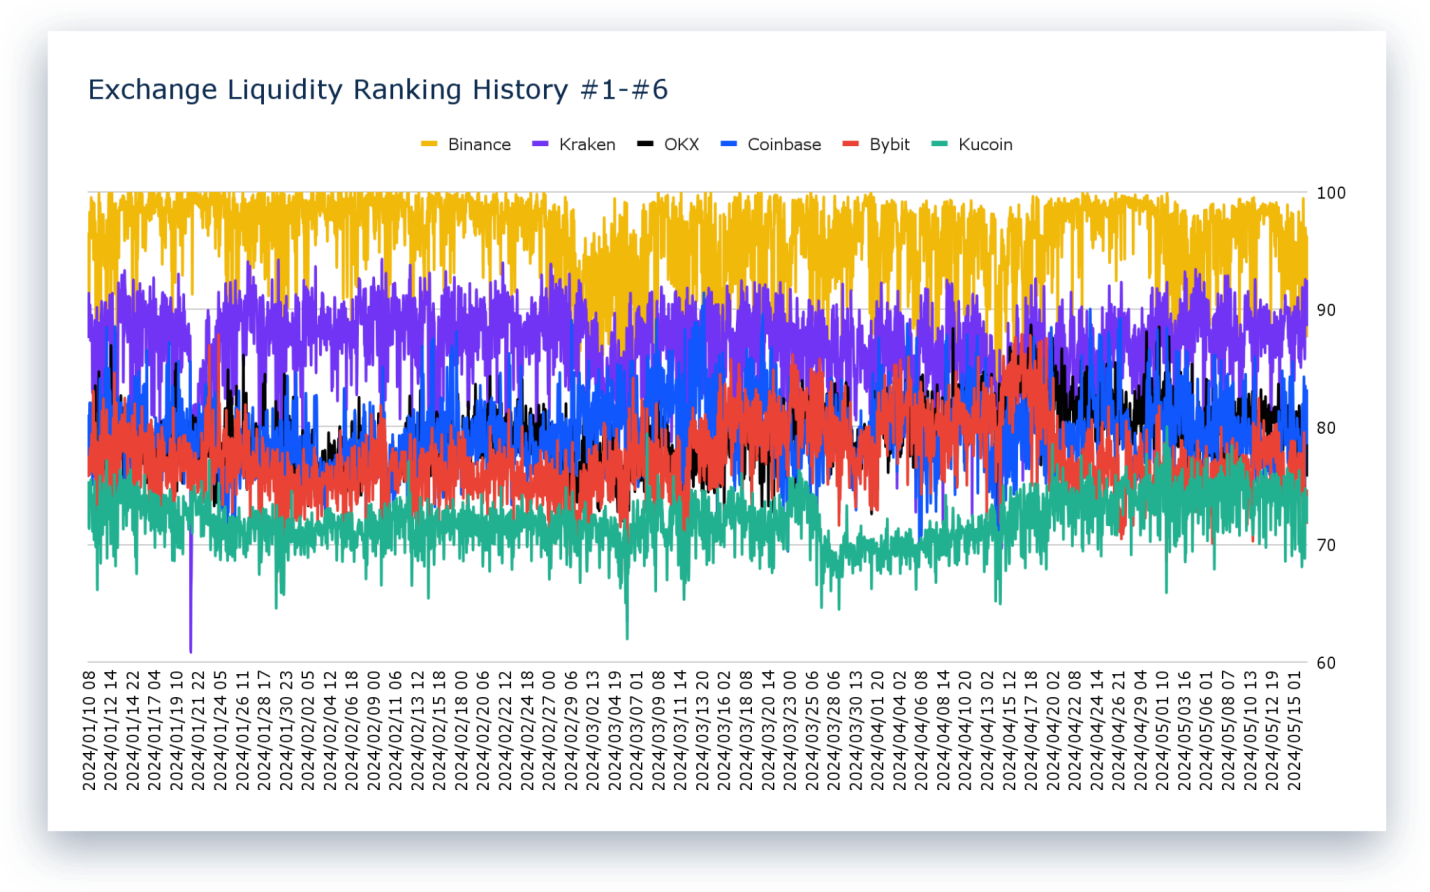
As the world's largest centralized crypto exchange, Binance remains the market leader in liquidity, with an average score of 95.99 over the past 6 months, with only a significant fluctuation in early March. Following closely is Kraken, currently ranking second in liquidity with an average score of 86.85.
The top four exchanges with the best liquidity are Binance, Kraken, Coinbase, and OKX, and their rankings have remained relatively stable over time.
Source: LTP Research
Source: LTP Research
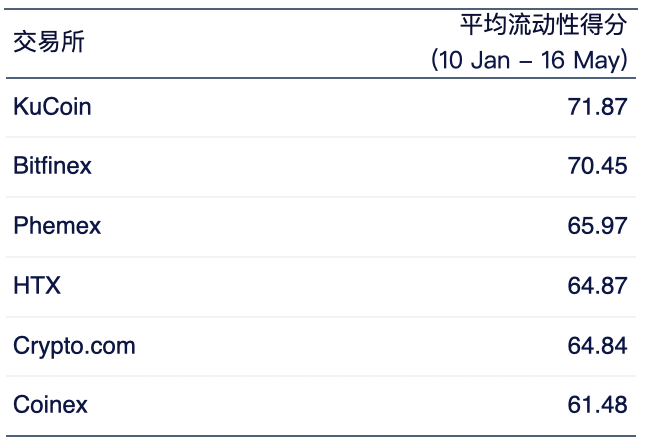
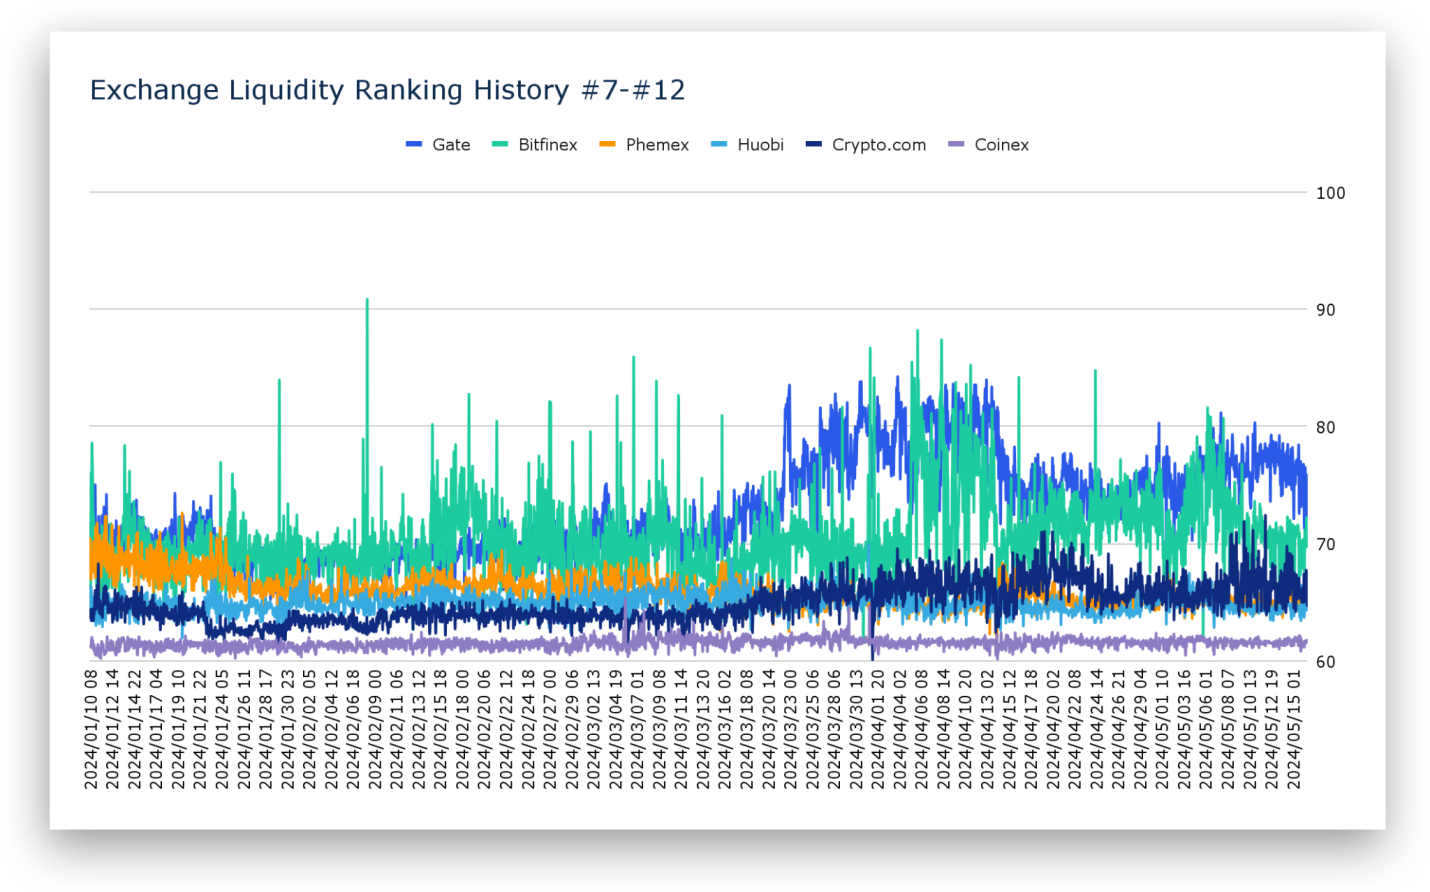
Among the remaining 6 exchanges, Gate.io currently ranks 7th with an average score of 71.87. Gate.io's liquidity score trend has shown a significant increase since March 20, exceeding 80 points for a period of one month before declining. Following closely is Bitfinex, which has the highest volatility among all exchanges.
Looking at the trend since March 2024, Gate and KuCoin's liquidity performance has gradually improved. Phemex, Huobi, Crypto.com, and Coinex show no significant changes.
Source: LTP Research
Source: LTP Research
Liquidity of Currencies
Liquidity of Bitcoin
Source: LTP Research
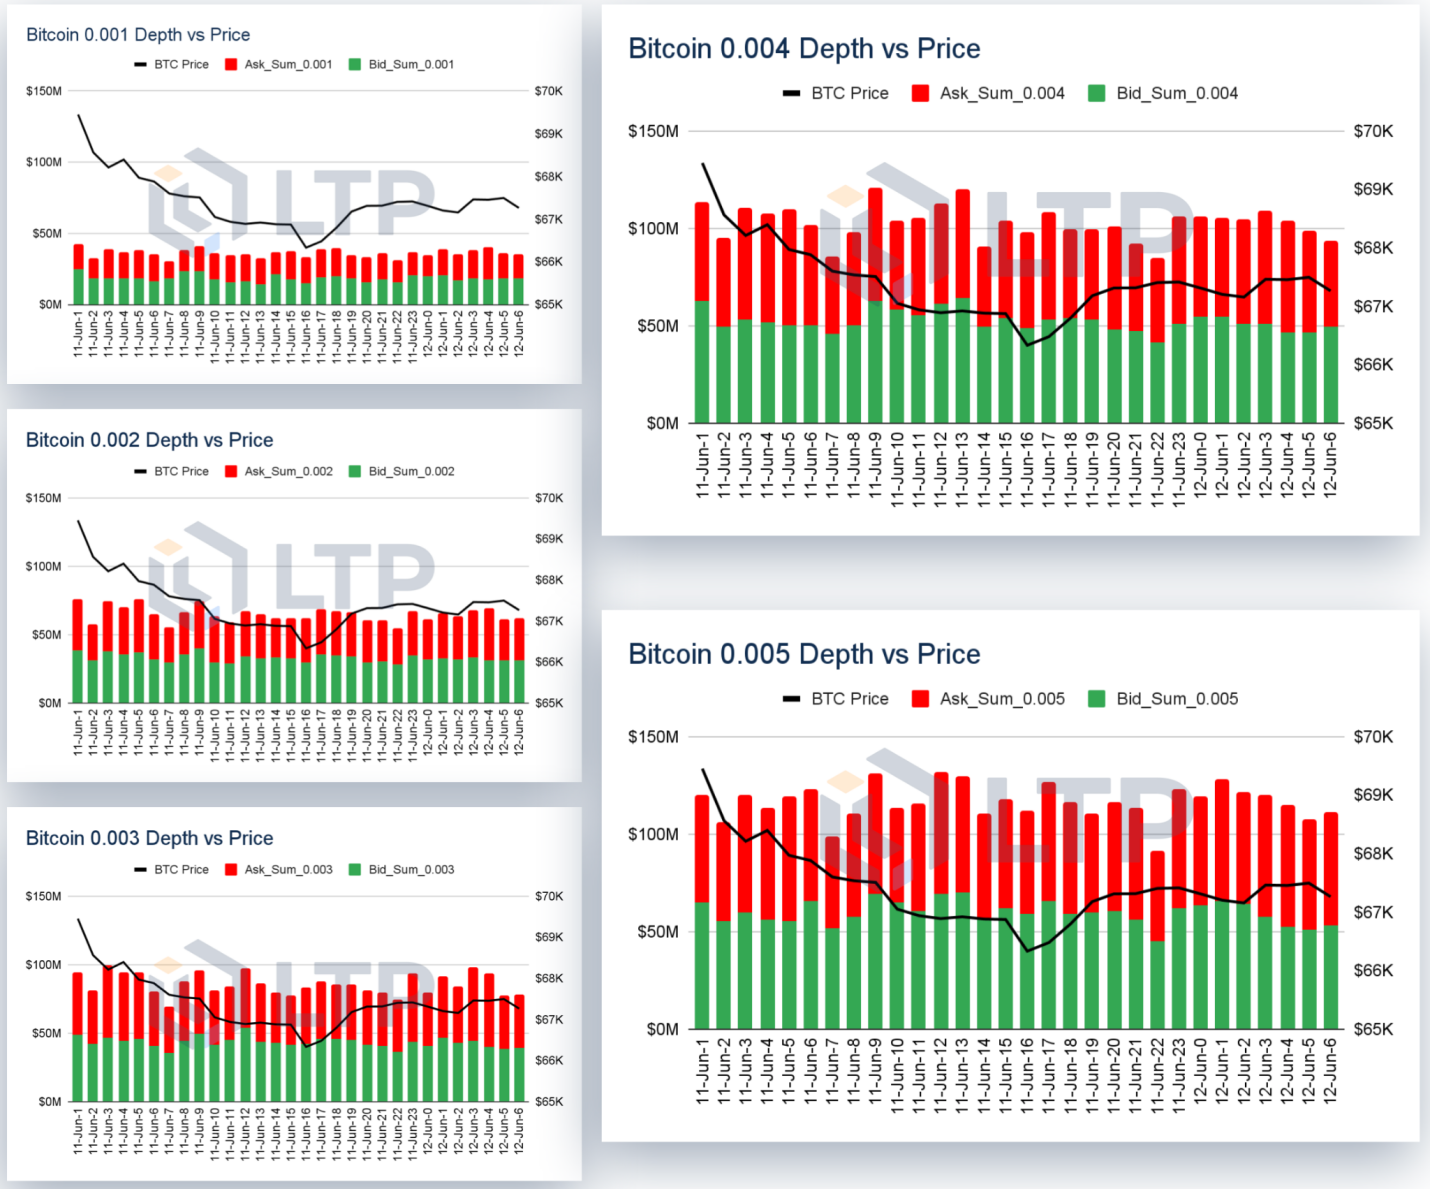
By aggregating Bitcoin order book data from 12 centralized exchanges and categorizing them into buy and sell orders, we observed the order book depth performance of Bitcoin within five price range levels from 0.1% to 0.5%.
To zoom in on the granularity, we selected depth change data for Bitcoin between June 11th and 12th, 2024, over a period of 30 hours.
It is evident that the average Bitcoin depth does not exceed $50 million within the 0.1% price range. At the 0.3% level, it only reaches $100 million. The difference between the 0.4% and 0.5% ranges is not significant.
Liquidity Ranking of Bitcoin Markets on Various Exchanges
Source: LTP Research
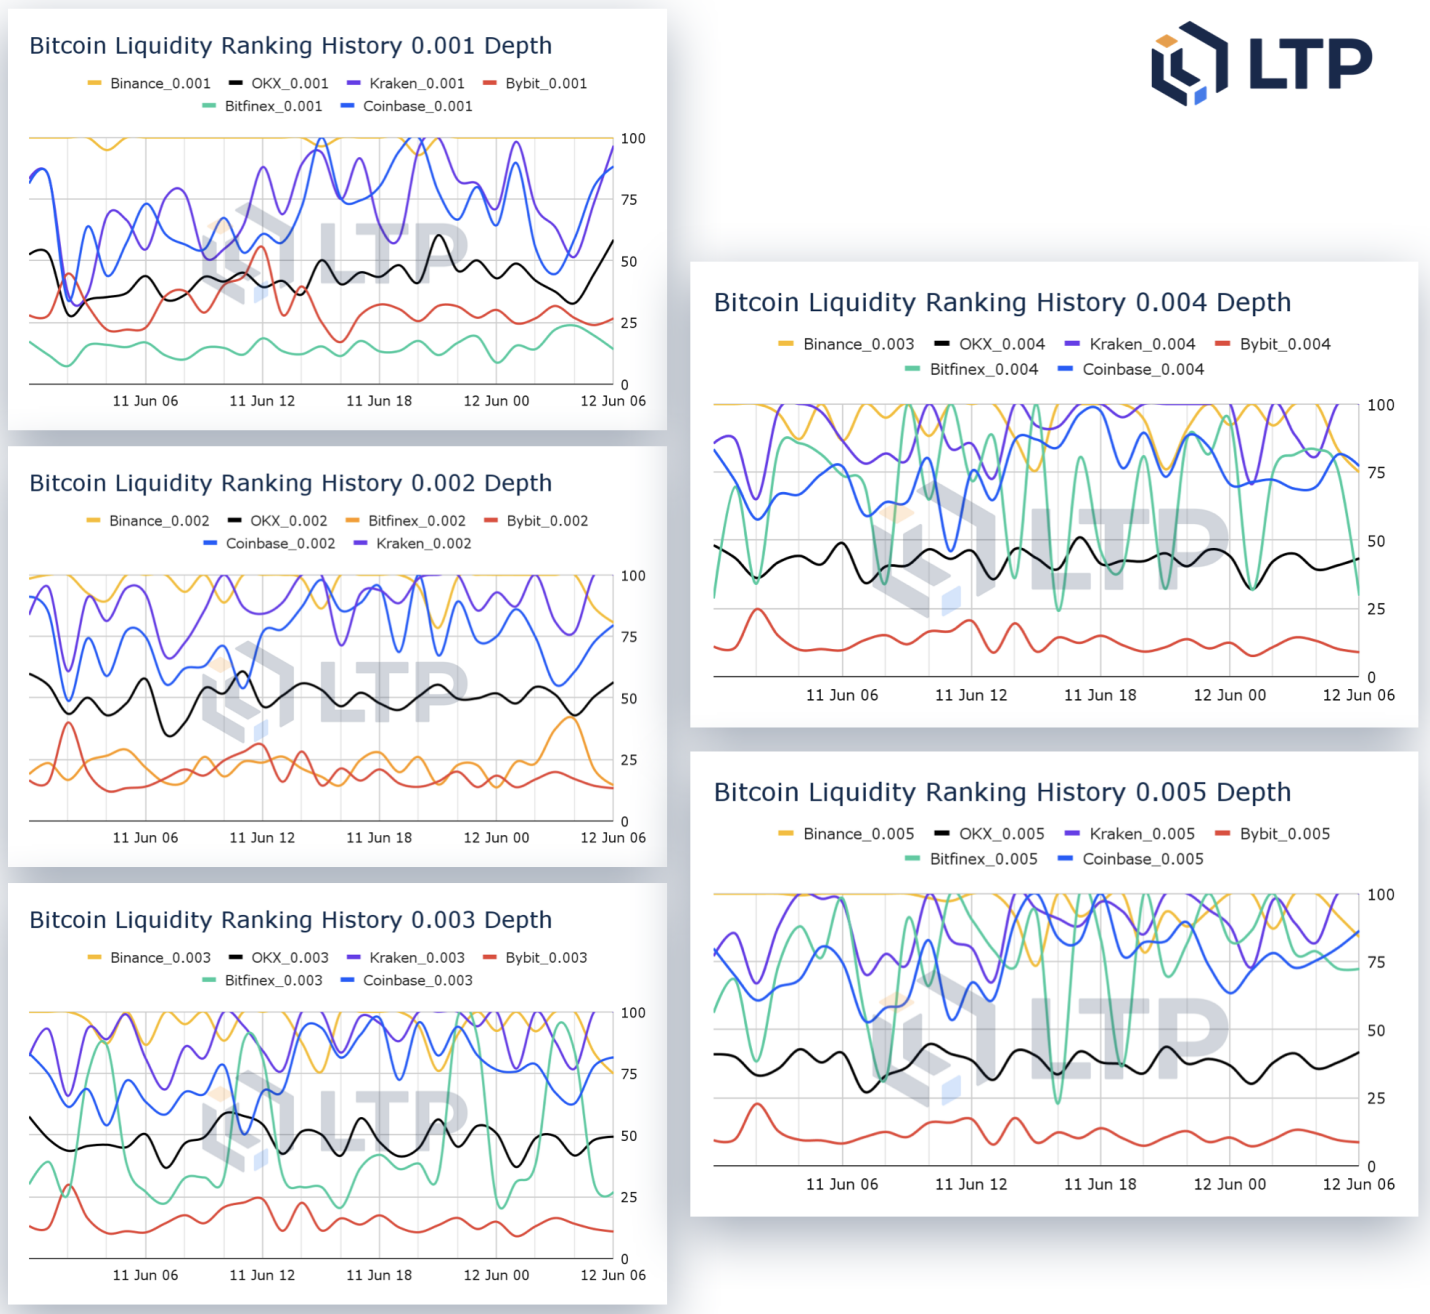
Binance is the most liquid exchange for Bitcoin trading orders. Especially near the market price, Binance consistently maintains the top position in liquidity performance. From this perspective, retail traders can always execute orders at the best price on Binance.
However, when considering orders far from the market price, Binance's advantage is not as pronounced. In price ranges of several hundred points, OKX and Kraken often take the top position.
When the price range expands to 0.4%, Kraken can maintain the top position most of the time. In such price ranges, Kraken's ability to rank first is closely related to its ability to provide free Bitcoin trading fees.
Liquidity of Ethereum
Source: LTP Research
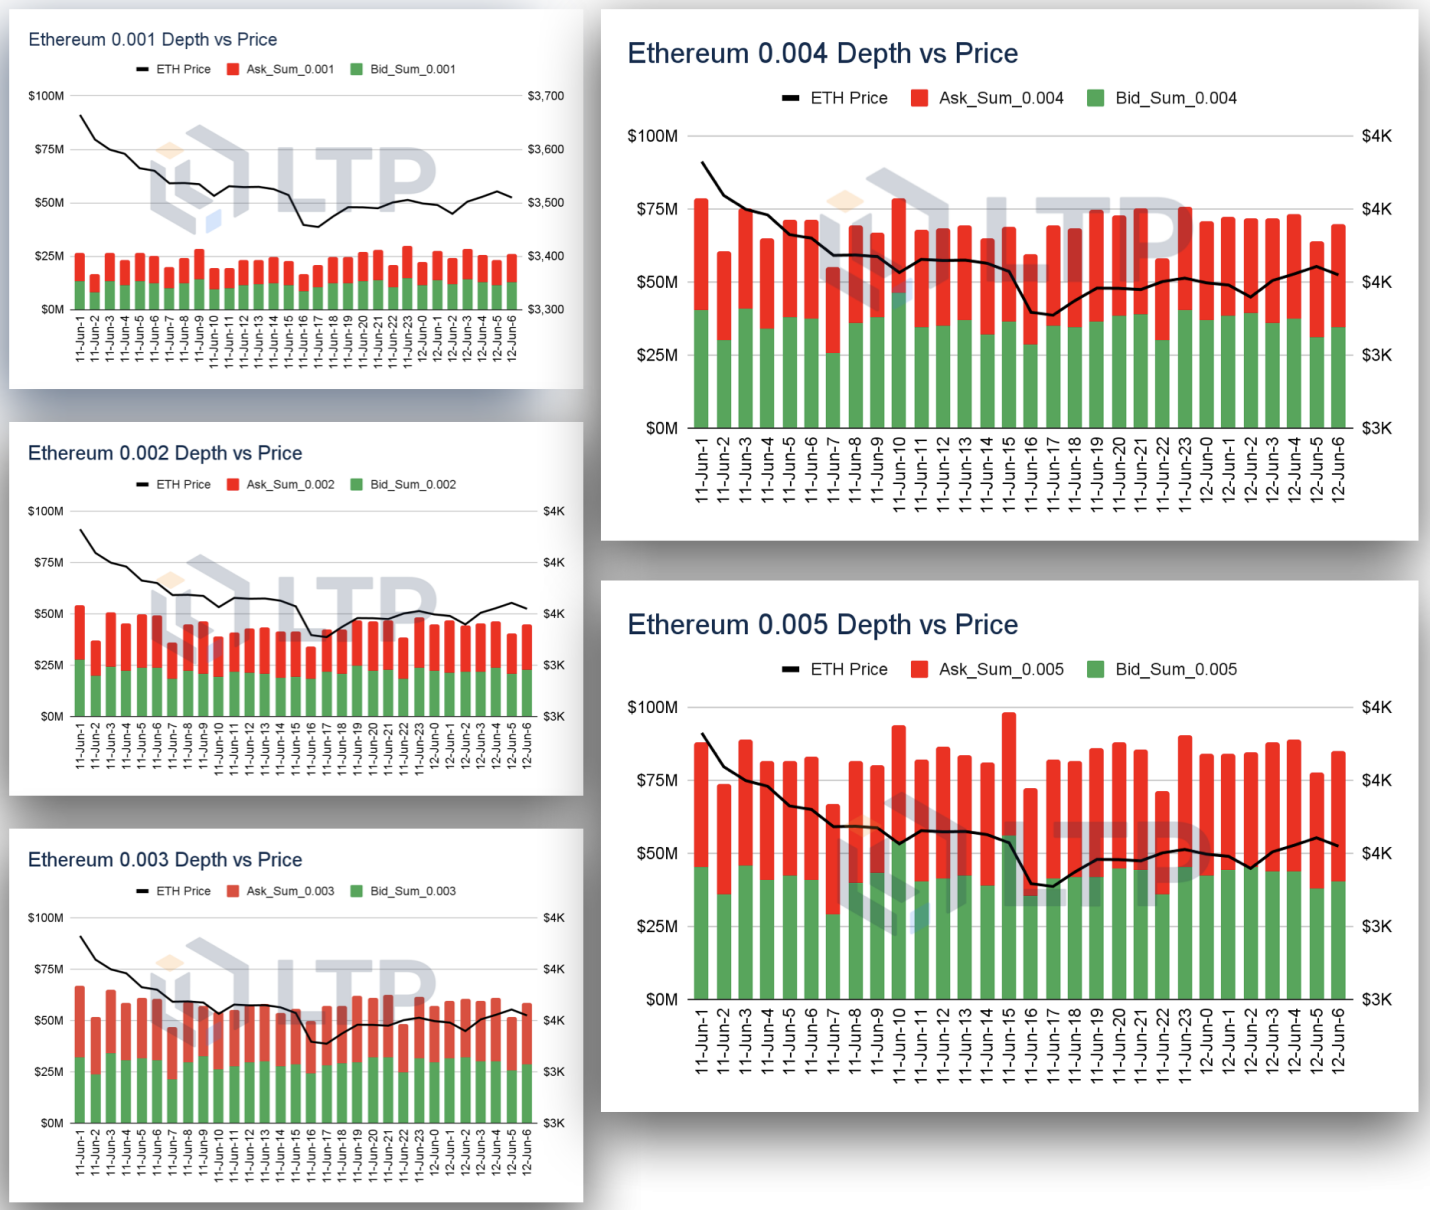
Similar to Bitcoin, the left-hand data shows the depth changes of Ethereum (ETH) within a 30-hour period from June 11th to 12th, 2024.
The depth distribution of ETH is more concentrated in the 0.3% to 0.4% range. At the 0.1% level, the depth is less than $25 million; at the 0.3% level, the depth exceeds $50 million; at the 0.4% level, the depth exceeds $75 million. However, there is no significant increase at the 0.5% level.
According to the data from this period, the buy and sell orders for Ethereum (ETH) have consistently maintained a 1:1 ratio.
Liquidity Ranking of Ethereum Markets on Various Exchanges
Source: LTP Research
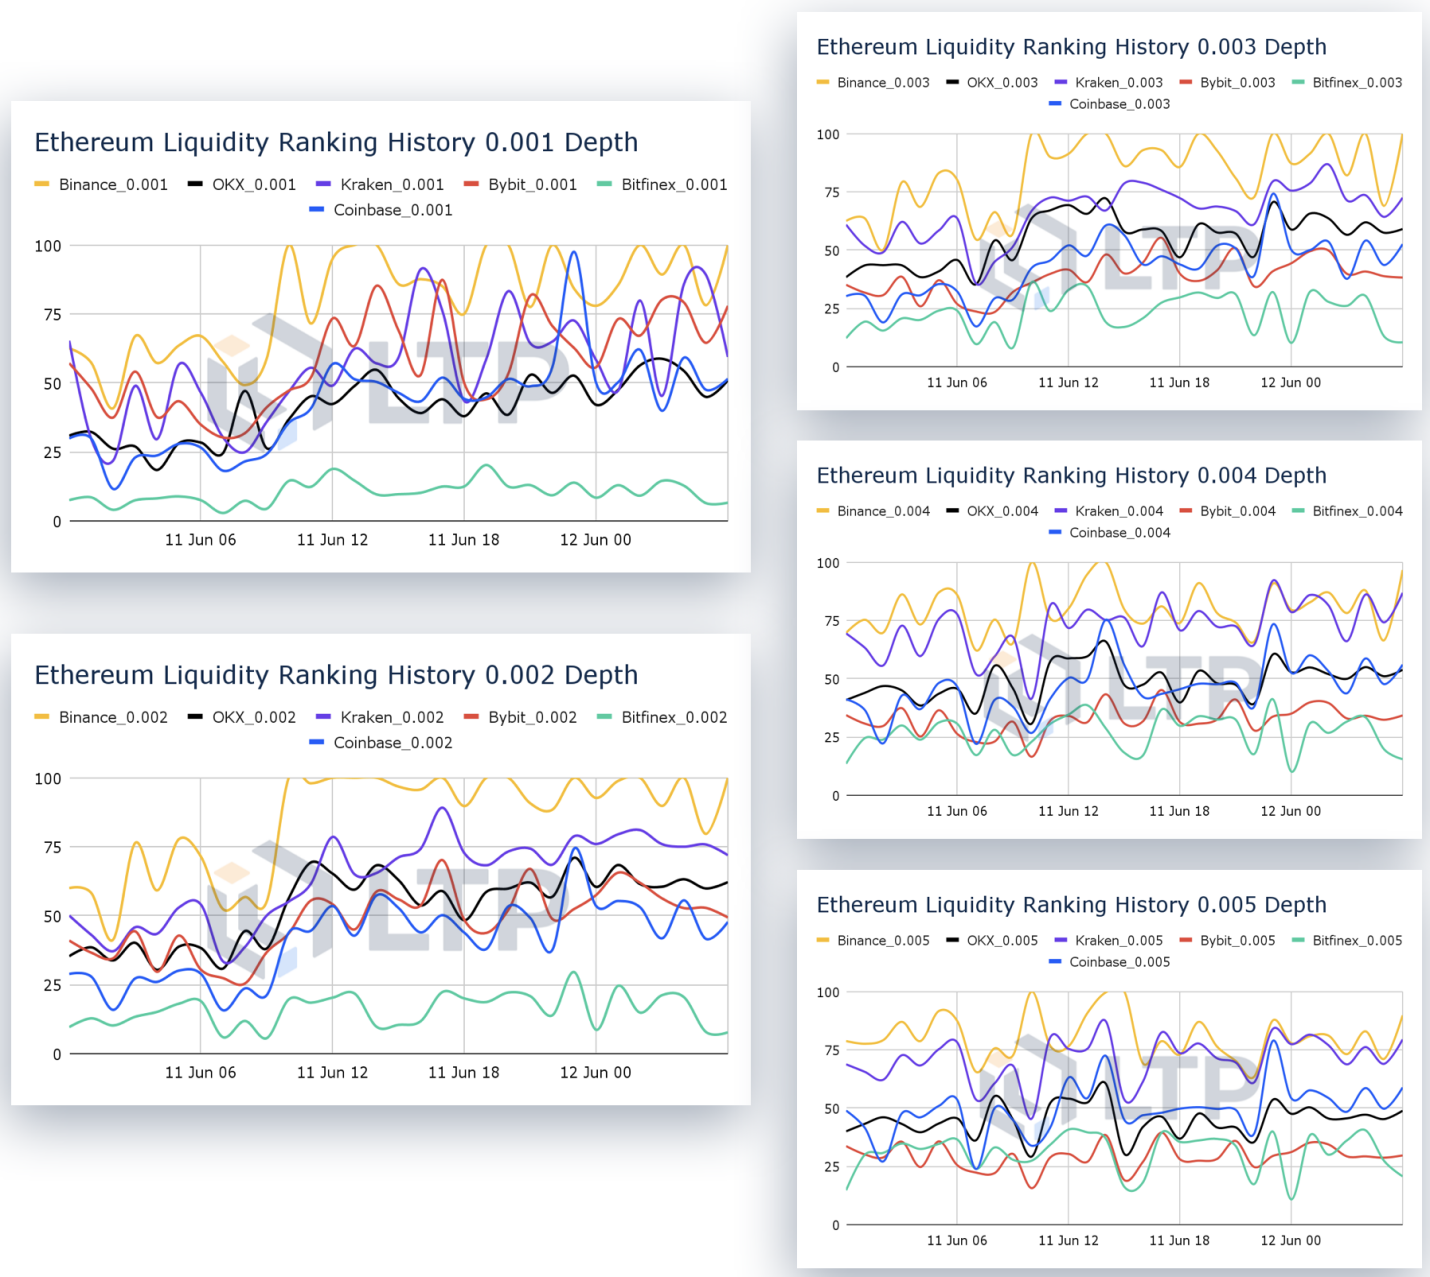
The fluctuation of Ethereum (ETH) liquidity is higher among the 12 exchanges compared to BTC. Although Binance still ranks first, its score fluctuated by over 50% during the observed 30-hour interval.
Especially in the early hours of June 11th, the liquidity scores for Ethereum (ETH) in all price ranges except 0.5% did not exceed 75 points. It was not until after 6 AM that Binance and other exchanges showed improvement.
OKX and Bybit have the potential to catch up with Binance in terms of Ethereum (ETH) liquidity performance. Especially in the 0.1% price range, their liquidity scores are very close to Binance.
LTP Liquidity Index (LLI)
What is the LTP Liquidity Index?
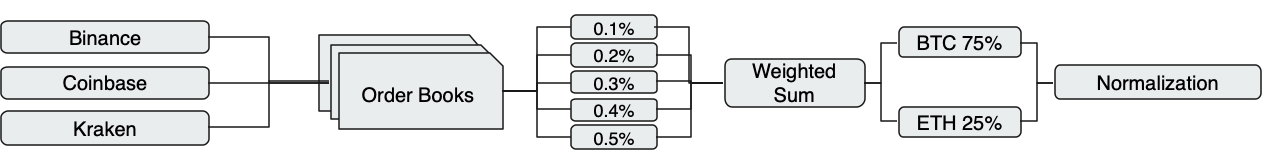
The LTP Liquidity Index is an indicator that measures the overall liquidity of the cryptocurrency market, derived from the weighted order book depth data of BTC and ETH from the three major centralized exchanges: Binance, Coinbase, and Kraken. It intuitively helps investors understand how market-wide liquidity changes with time and BTC price fluctuations. Let's take a look at the basic principles of the LTP Liquidity Index.
How is the LTP Liquidity Index (LLI) Calculated?
- We extract buy and sell depth data from the BTC order books of Binance, Coinbase, and Kraken and divide the depth into five price ranges, from 0.1% to 0.5%. Then, we calculate the total depth for each price range.
- Next, we assign weights to each price range: 0.1% is 30%, 0.2% is 25%, 0.3% is 20%, 0.4% is 15%, and 0.5% is 10%.
- On a daily basis, we use these weights to calculate the weighted depth for each exchange at each price range. Then, we add the weighted depths of the three exchanges to obtain the daily weighted depth of BTC.
- We set the depth data from the starting day as the base value of 1,000. By comparing the remaining depth data with the starting day data and using their percentages as a reference, we start from 1,000 points and derive the BTC liquidity index.
- Using the same method, we calculate the liquidity index for ETH. Then, we combine the BTC liquidity index and ETH liquidity index, with BTC accounting for 75% and ETH accounting for 25%, to obtain the LTP Liquidity Index.
- The current LTP Liquidity Index only includes BTC and ETH as the main crypto assets, and more crypto assets will be introduced based on market value in the future, accompanied by corresponding weights.
LTP Liquidity Index (LLI)
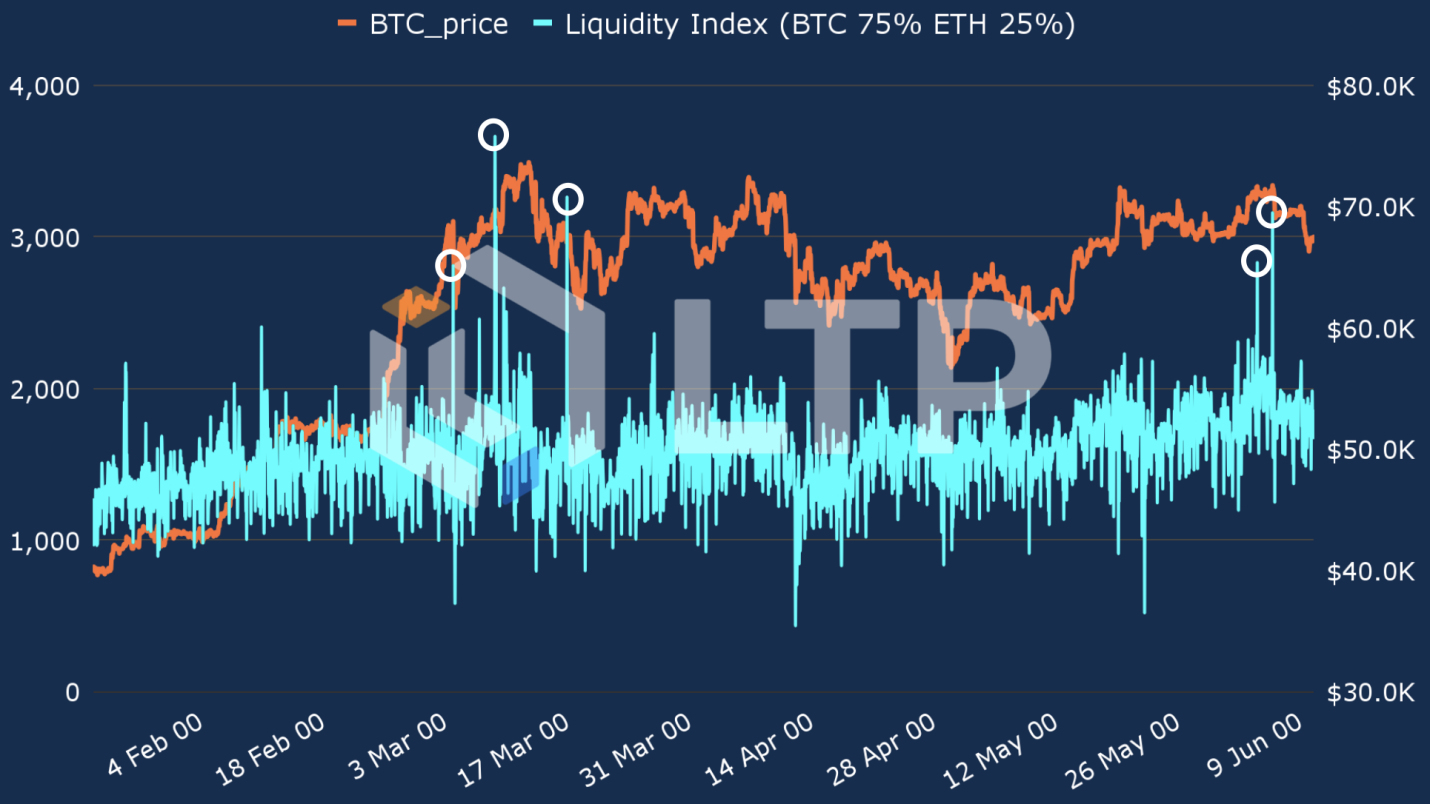
Source: LTP Research
The upper chart, based on hourly changes, clearly shows the relationship between the LTP Liquidity Index (LLI) and the Bitcoin price from January 2024 to mid-June 2024.
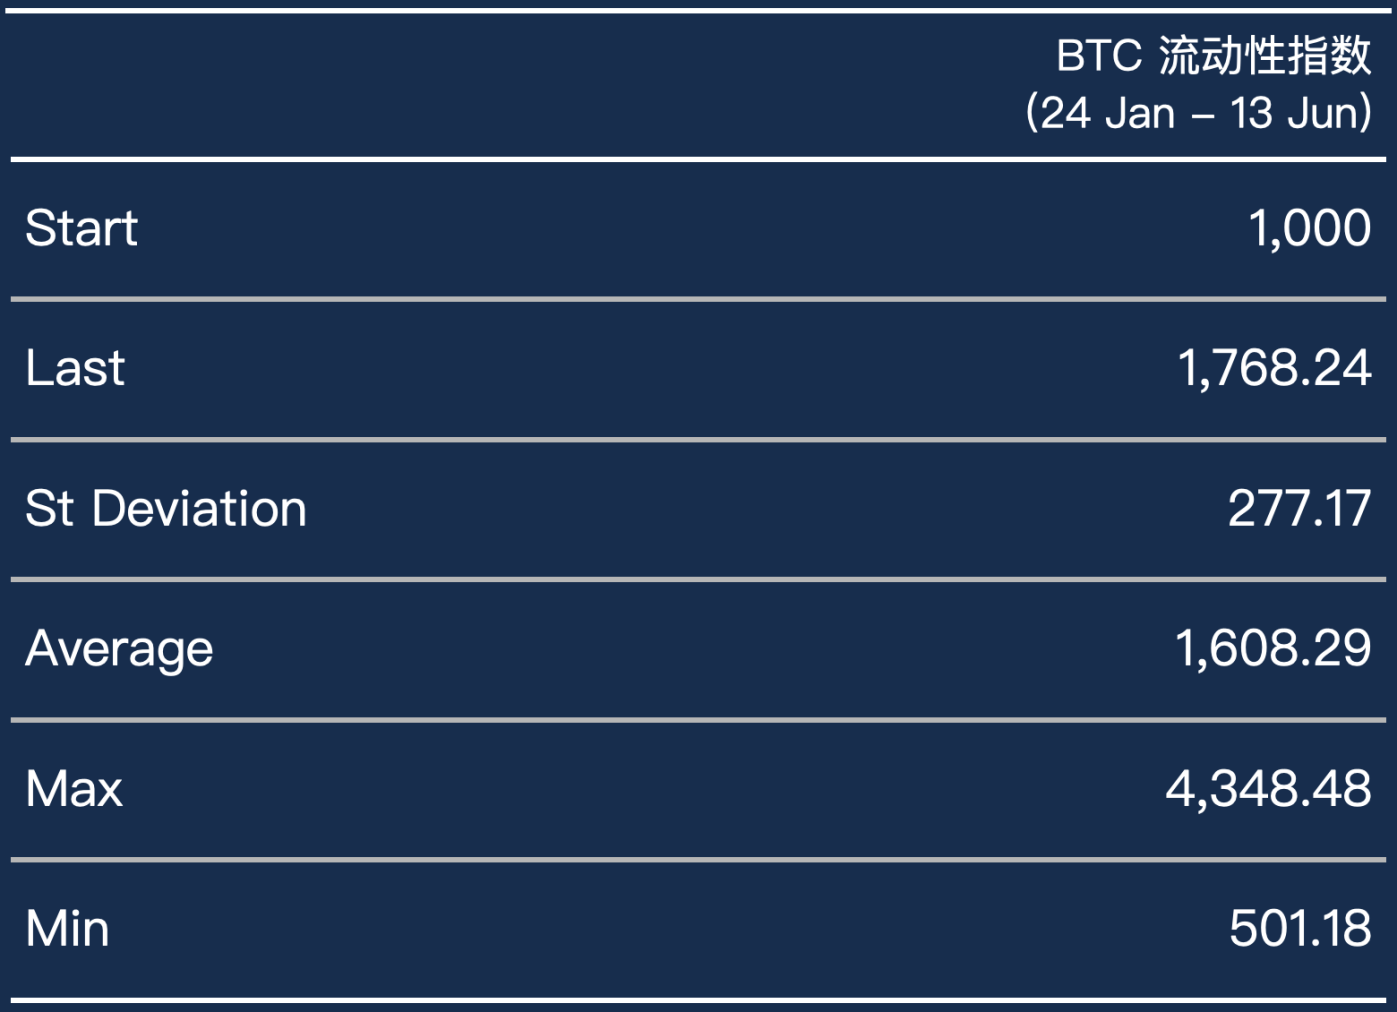
From the chart, it can be seen that over the past six months, the liquidity index has gradually increased from the starting point of 1,000 points, with a standard deviation of approximately 250 points.
As of June 13th, 2024, the liquidity index has risen to 1,748 points. During the historical high price of Bitcoin (ATH), there were several outliers exceeding 3,000 points, indicating a significant increase in market liquidity in the short term, which is an important signal of price increase. It is worth noting that this signal also appeared in early June.
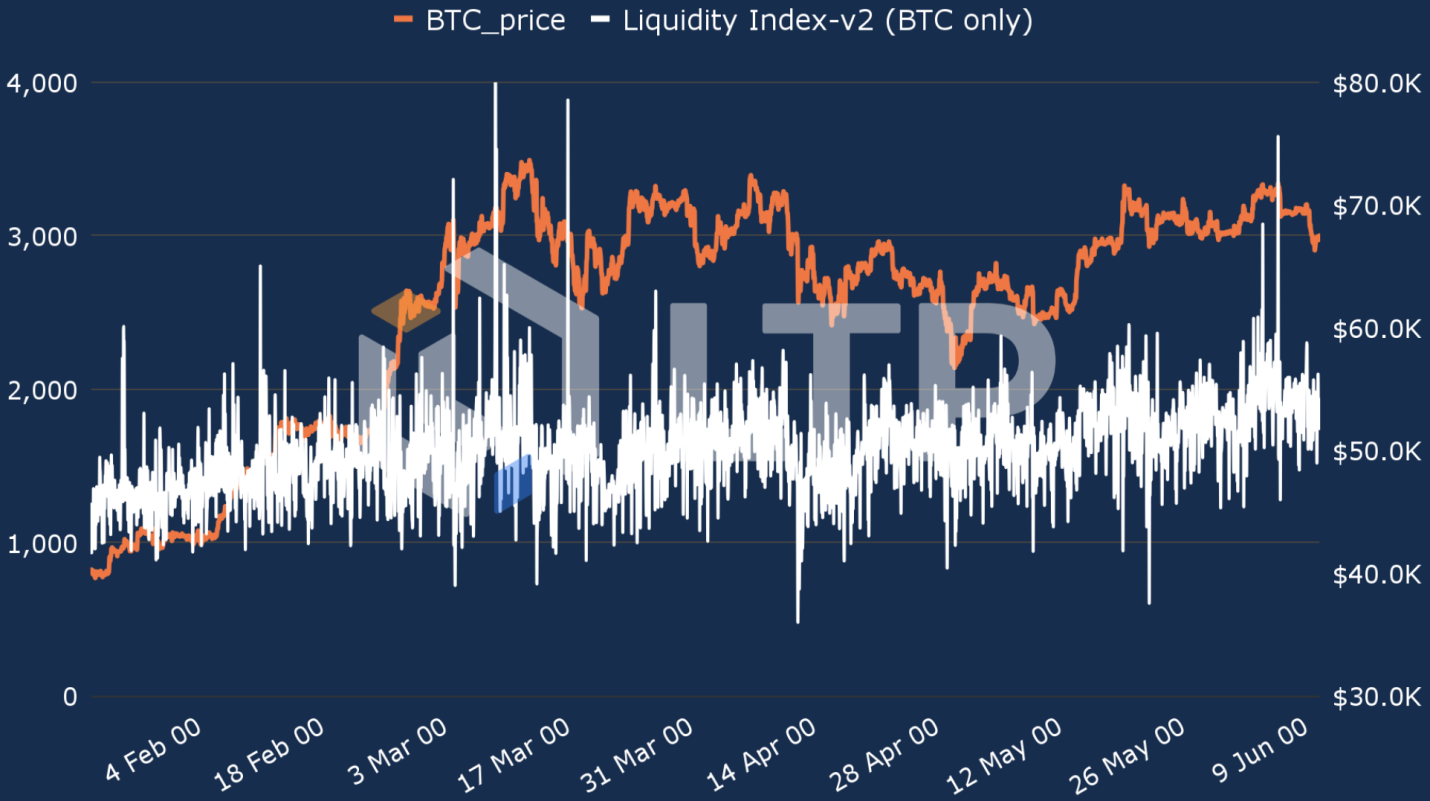
BTC Liquidity Index
When we examine the liquidity index for BTC separately, we can see that the two liquidity peaks in March and June both came from BTC, reaching close to 4,000 points.
In contrast, there were only two significant dips in BTC liquidity within this range, occurring in mid-April and late May.
Source: LTP Research
Source: LTP Research
Depth Data of Bitcoin Order Book
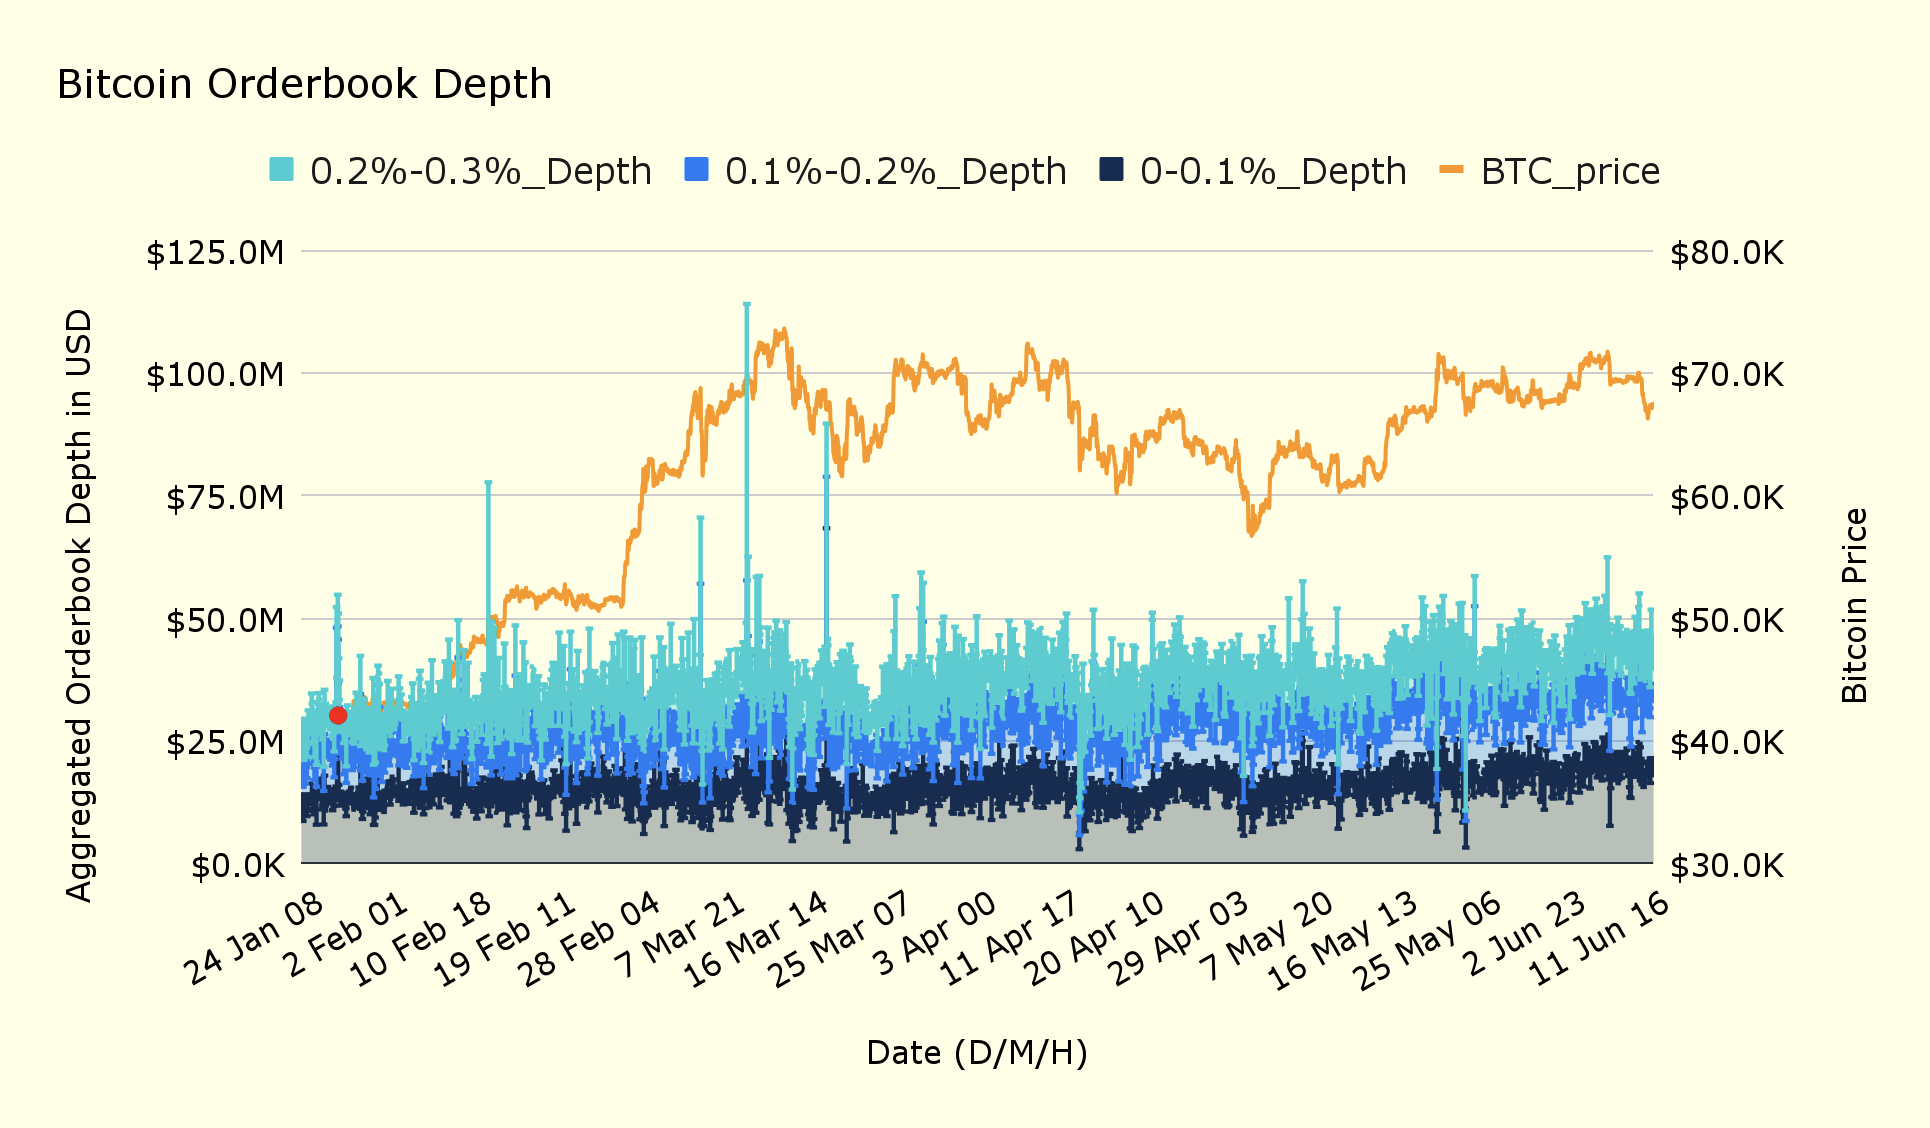
Source: LTP Research
This chart displays the layered depth data of the BTC order books from three exchanges.
Although the actual calculation divides the BTC order book depth data into five levels (0-0.1%, 0.1%-0.2%, 0.2%-0.3%, 0.3%-0.4%, 0.4%-0.5%), for clarity, the chart only shows the first three levels.
It is evident that the liquidity peak for Bitcoin in March mainly occurred in the 0.2%-0.3% range.
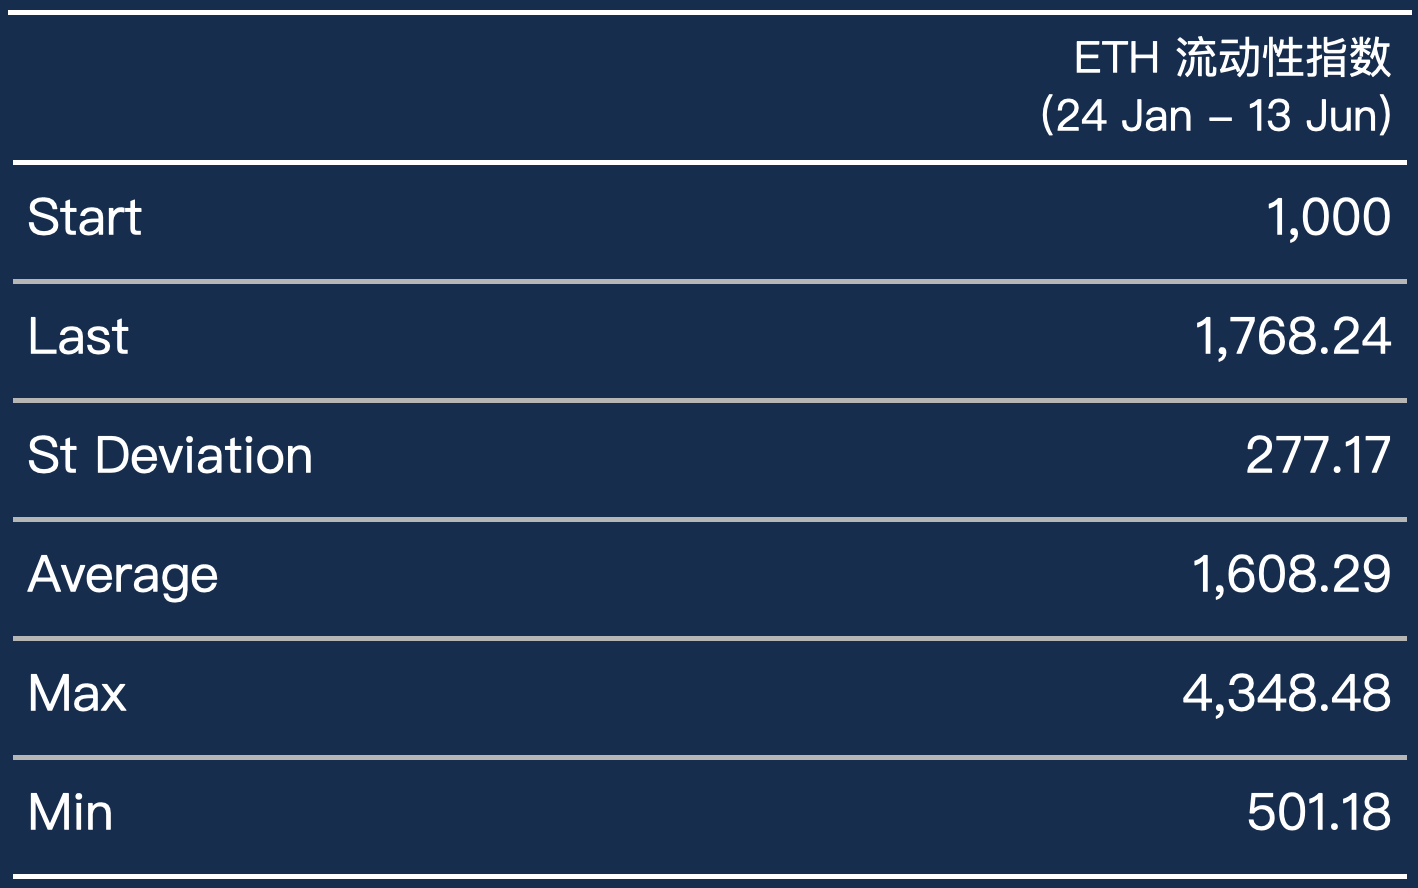
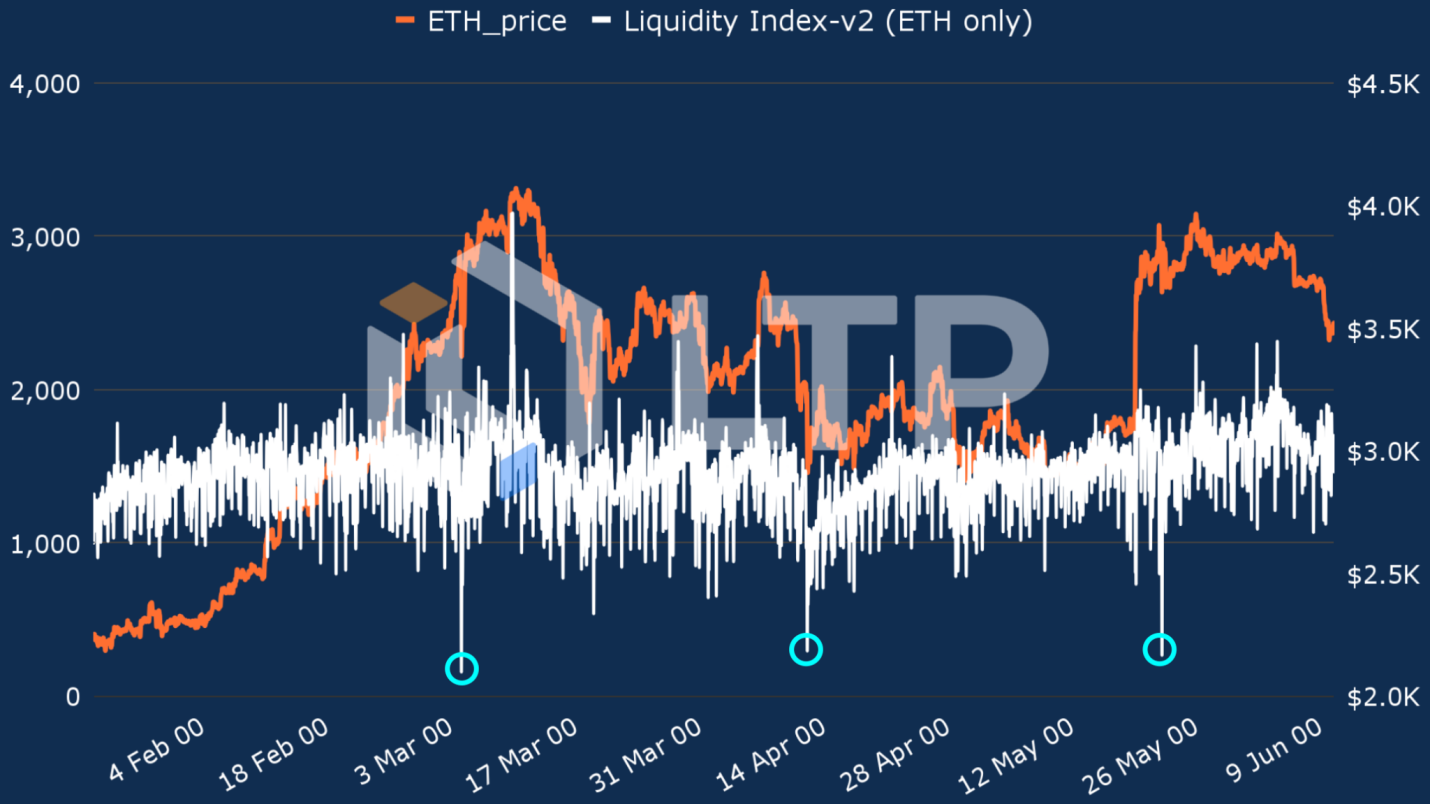
ETH Liquidity Index
As for the liquidity index of Ethereum (ETH), there was only one peak exceeding 3,000 points during the historical high in mid-March, and no such peaks occurred in June. Instead, the ETH liquidity index dropped below 500 points at three time points: before the peak in March, in mid-April, and after the approval of the Ethereum ETF at the end of May.
Source: LTP Research
Source: LTP Research
Depth Data of Bitcoin Order Book
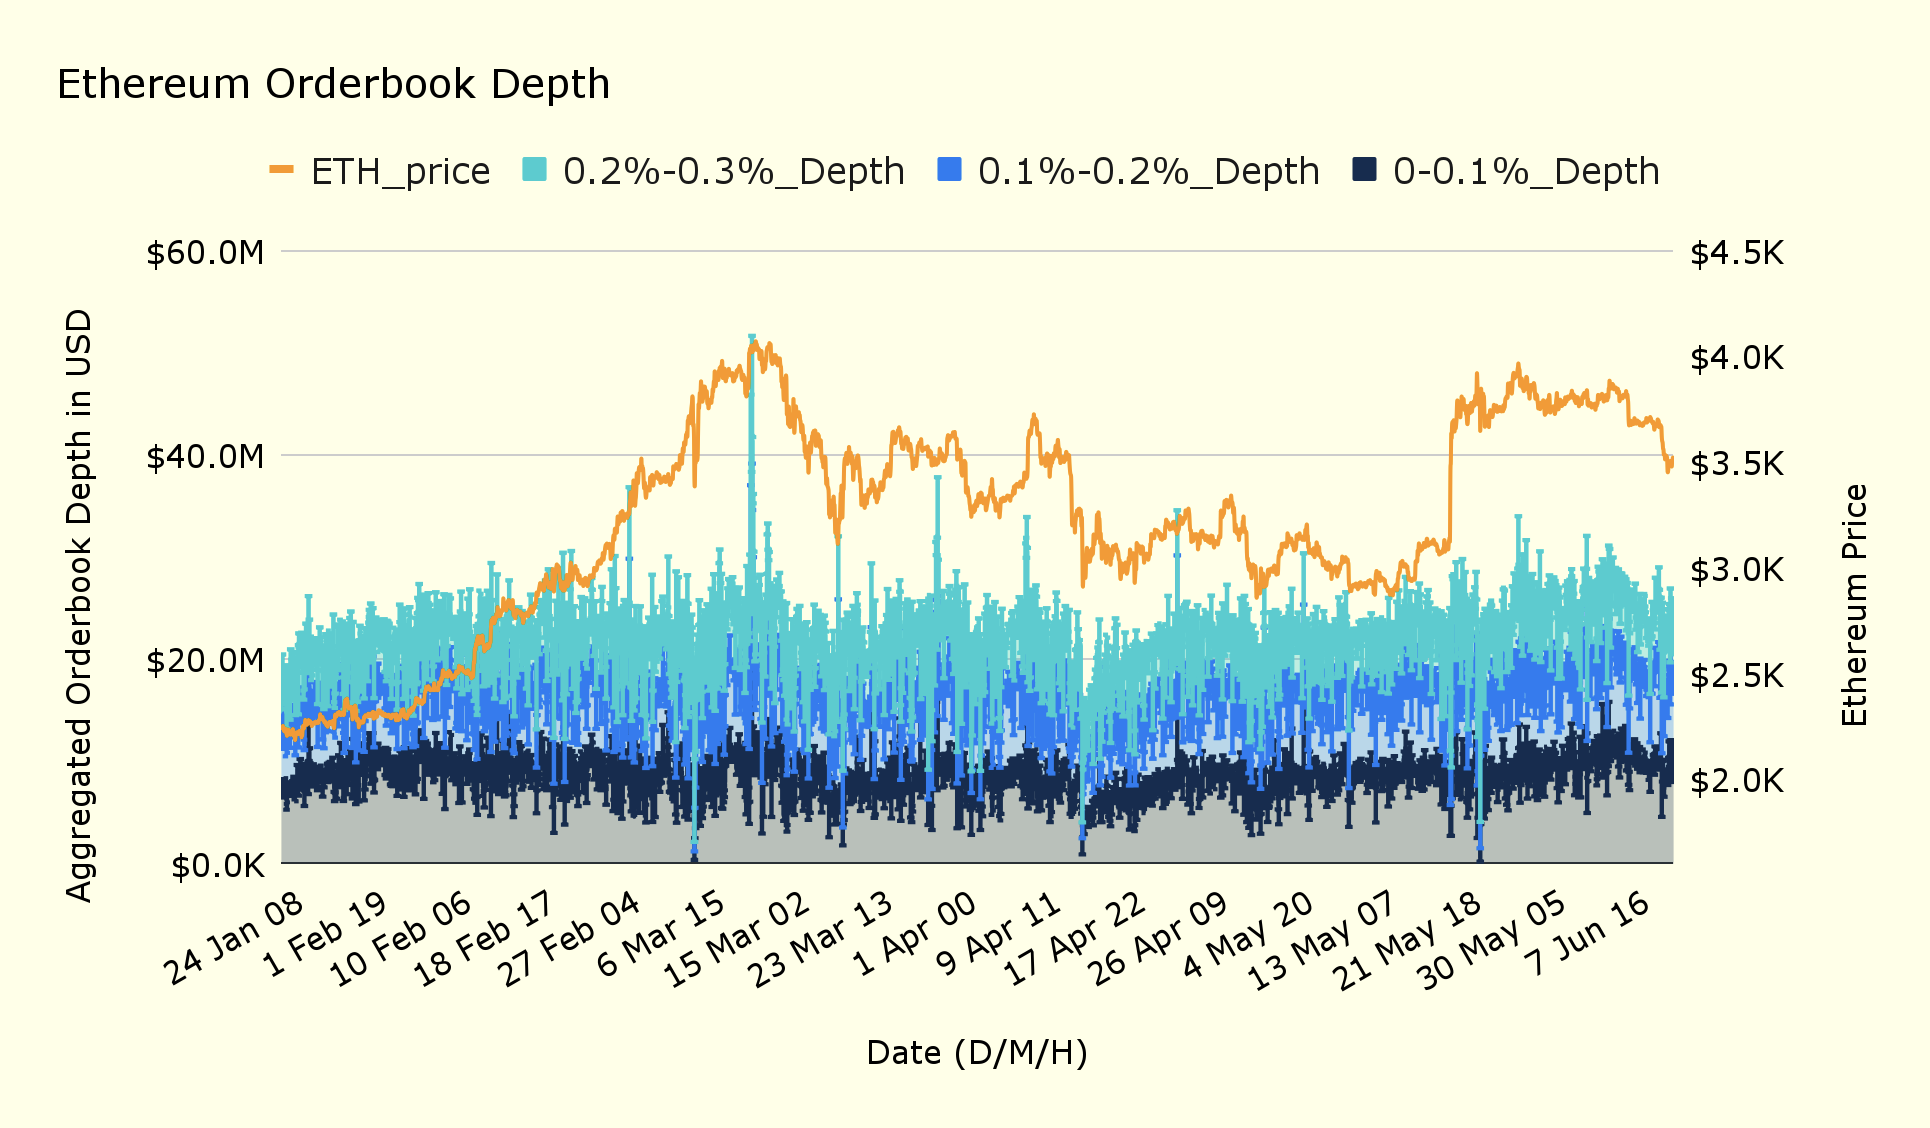
Source: LTP Research
This chart displays the depth data of the ETH order books from the three exchanges: Binance, Kraken, and Coinbase.
Similarly, although the actual calculation divides the ETH order book depth data into five levels, the chart only shows the first three levels, from 0-0.1% to 0.2%-0.3%.
It is evident that the three liquidity troughs in the past six months all occurred in the 0.2%-0.3% range. Each time the liquidity sharply decreased, the overall liquidity level dropped to below $10 million.
Summary
We started by introducing the basic concept of liquidity and how it is understood in traditional finance to investors. Next, we explained how the order book depth of cryptocurrency exchanges affects liquidity and briefly introduced the concept of liquidity in decentralized exchanges.
Then, we explained how LTP uses depth data from different price ranges in the exchange order book to calculate the LTP liquidity score for each exchange and cryptocurrency. After obtaining long-term data, we ranked the liquidity of 12 target centralized exchanges.
From the liquidity score data, it can be seen that the top four exchanges with the best liquidity are Binance, Kraken, Coinbase, and OKX, and their rankings remained relatively stable over the observation period of over 6 months. Since March 2024, Gate and KuCoin have shown a gradual increase in liquidity performance. Bitfinex's liquidity, on the other hand, has shown higher volatility.
Additionally, we compared the liquidity performance of BTC and ETH trading pairs on various exchanges over a six-month period and observed that Binance does not always maintain the top position.
Only in the 0.1% price range, Binance's liquidity performance consistently maintains a leading position. Once the price range exceeds 0.3%, the liquidity of Binance's BTC trading pairs becomes more volatile, while Kraken's liquidity performance is relatively high.
Finally, to assess the overall market liquidity volatility, we introduced the LTP Liquidity Index. We observed that market liquidity has shown a gradual upward trend over the past six months.
It is important to note that the original data for this report comes from public exchange order book APIs, and we only used the main trading pairs of 12 major exchanges, so the coverage is not comprehensive. In future versions, we will include more trading pairs to make the scores and indices more effective.
免责声明:本文章仅代表作者个人观点,不代表本平台的立场和观点。本文章仅供信息分享,不构成对任何人的任何投资建议。用户与作者之间的任何争议,与本平台无关。如网页中刊载的文章或图片涉及侵权,请提供相关的权利证明和身份证明发送邮件到support@aicoin.com,本平台相关工作人员将会进行核查。


