Author: HAMSTER, ChainFeeds
In the first half of 2024, the NFT market experienced drastic fluctuations.
TL,DR:
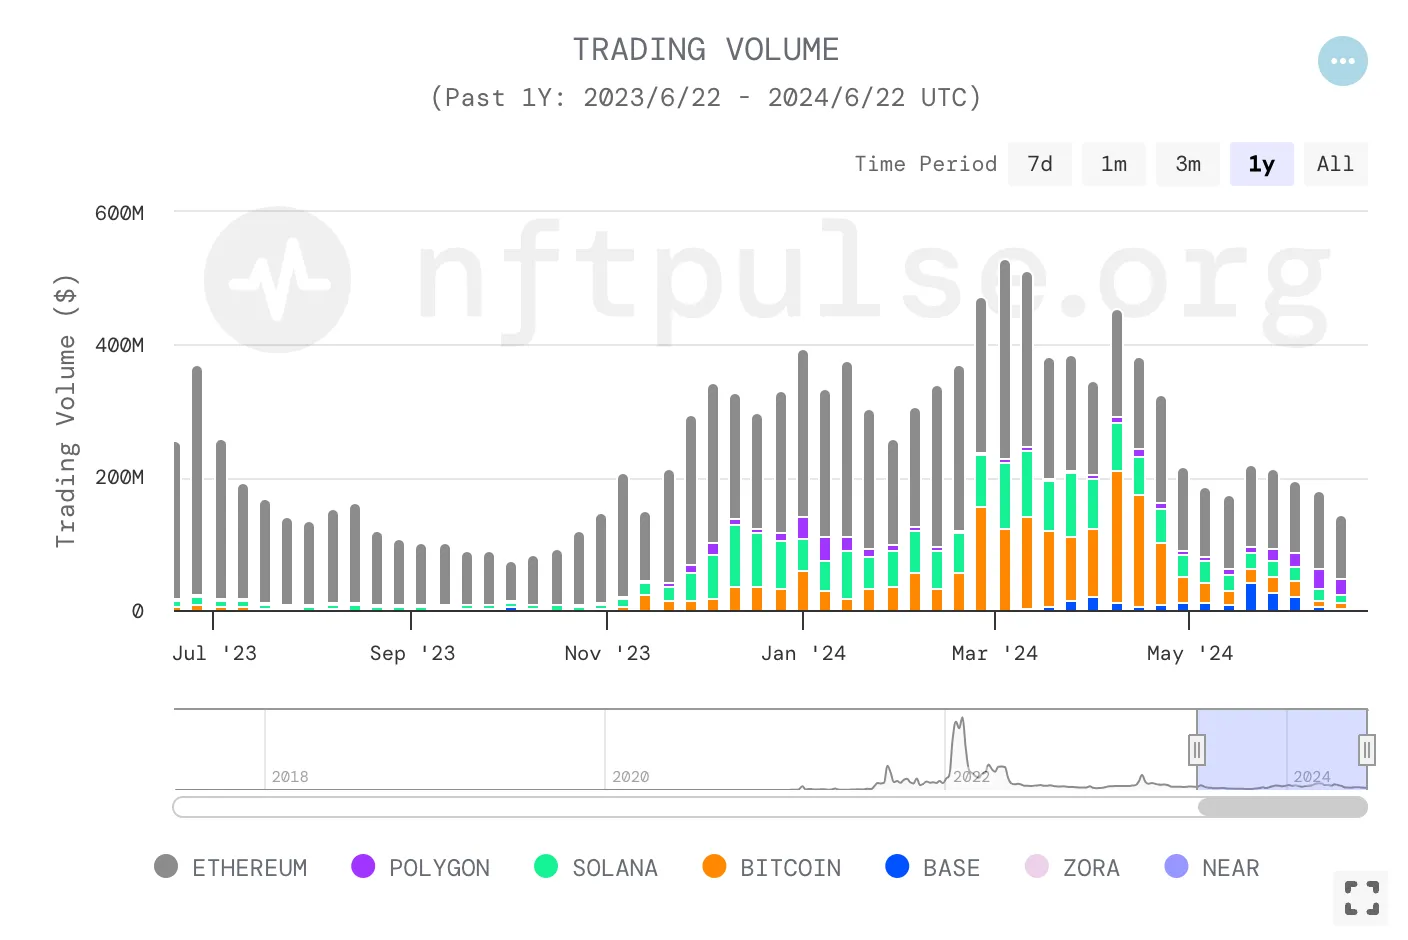
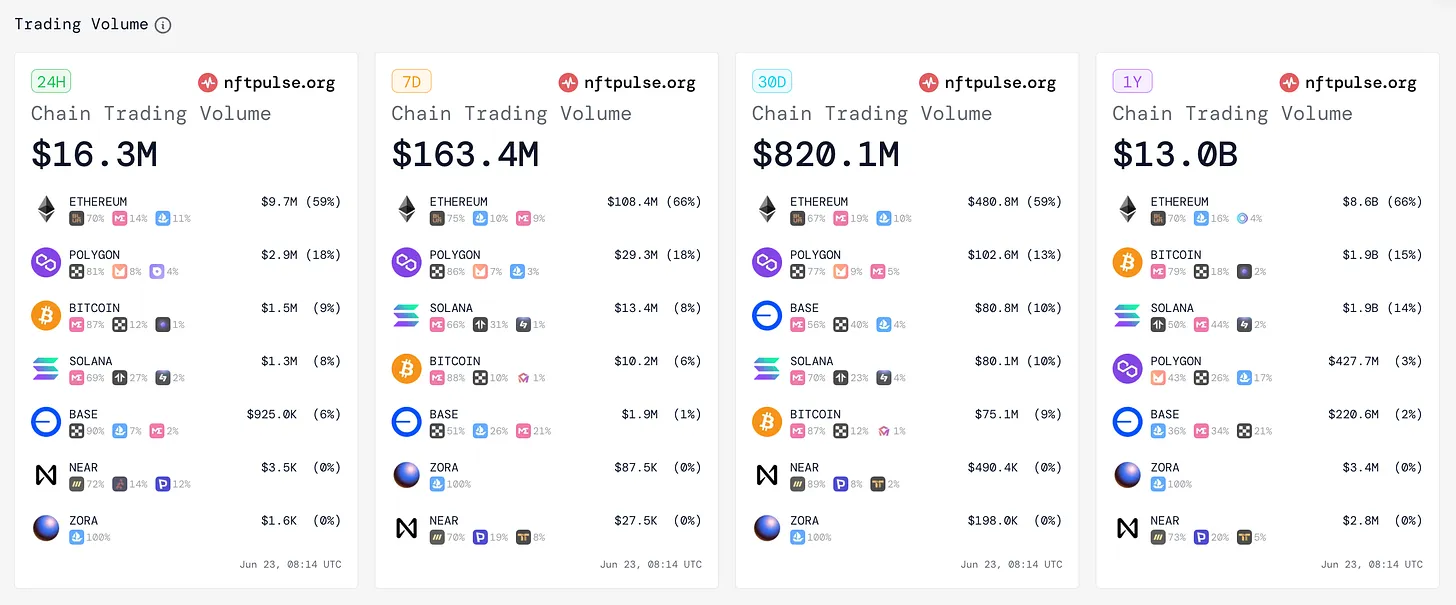
- Total transaction volume data: Although the transaction volume reached $12.80 billion in January 2024, a 35.3% year-on-year increase compared to January 2023, the market subsequently experienced fluctuations, especially in May, when the transaction volume plummeted to $7.95 billion, a 42% decrease from April.
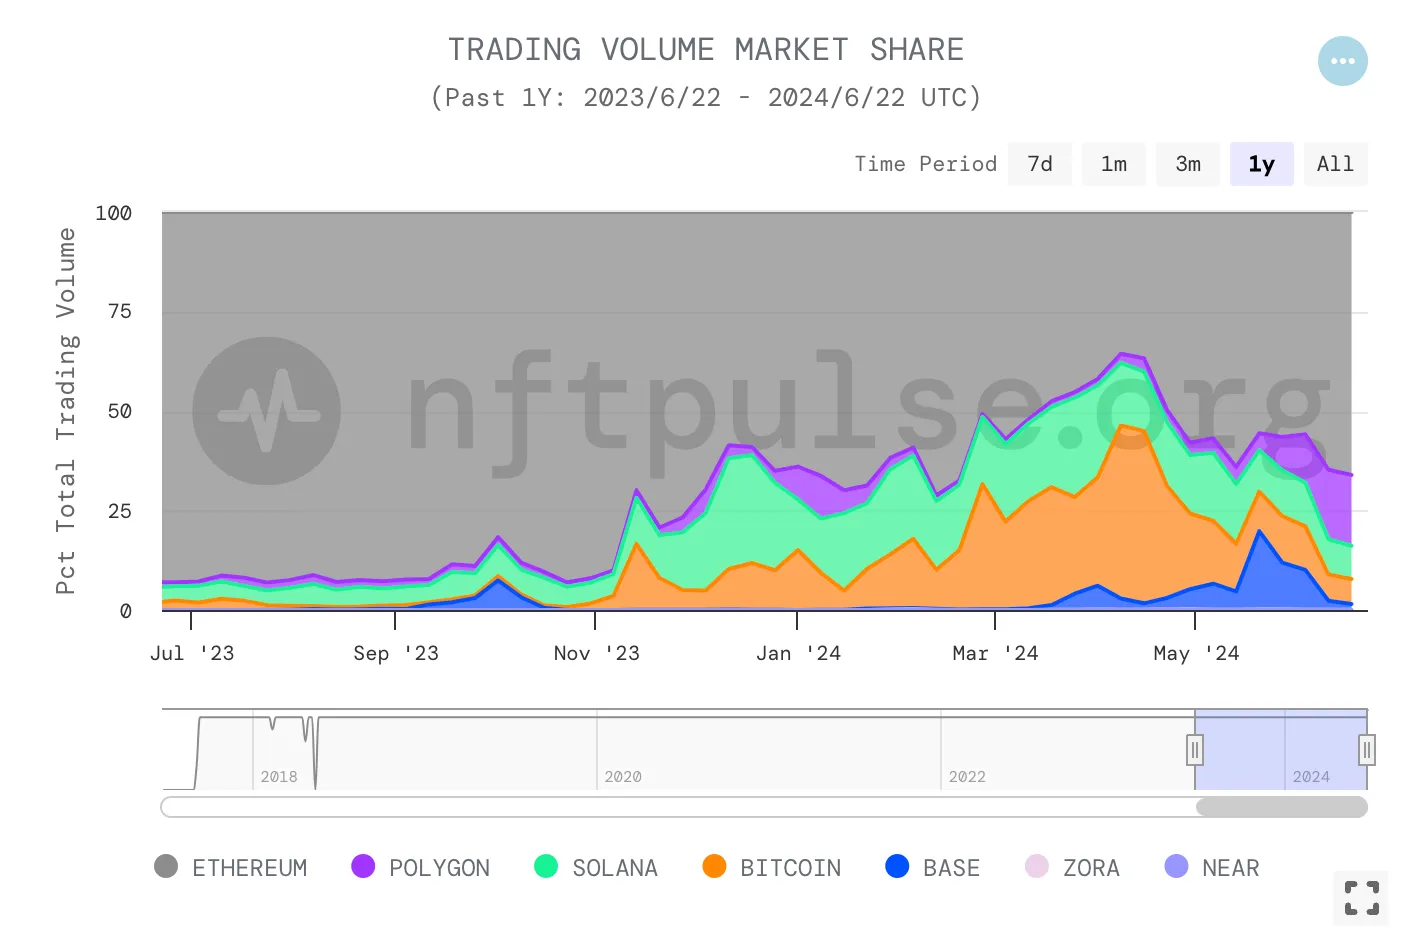
- Multi-chain transaction volume: Ethereum continued to dominate the NFT market, but its market share fluctuated in the first half of the year, dropping from 66.67% in January to 45% in April, then recovering to 58.22% in May and 62.2% in June. Driven by the Ordinals protocol, Bitcoin's market share in the NFT market significantly increased from 9.4% in January to 33.47% in April, but then fell back to 12.37% and 11.76% in May and June, respectively. Solana's market share remained relatively stable, while Polygon's market share experienced significant fluctuations.
- Major NFT trading platforms: Blur maintained its leading position, occupying 46.38% of the market share. Magic Eden expanded its market share to 11.74% through multi-chain support and airdrop programs, while OpenSea's market share decreased to 15.96%. In addition, emerging platforms such as OKX NFT and Tensor maintained and expanded their respective market shares through innovative incentive measures.
Total transaction volume data: Significant fluctuations in the first half of this year, with a sharp drop in May
In December 2023, the total transaction volume of the NFT market reached a record level. According to NFT Pulse data, the sales of NFTs on the Bitcoin network exceeded $881 million for the first time, setting a new monthly sales record. This figure significantly exceeded the sales on Ethereum and Solana, with NFT sales on Ethereum at $365 million and on Solana at $325 million. Overall, the total transaction volume of the entire NFT market in December 2023 reached approximately $1.7 billion.
However, in January 2024, the transaction volume of the NFT market decreased to $12.80 billion, a 24.7% decrease from December 2023. The overall transaction volume in the first half of 2024 showed an upward and downward trend. In March 2024, the total transaction volume reached a peak of $21.57 billion. The total NFT transaction volume in May experienced a sharp decline, dropping from $13.8 billion in April to $7.95 billion, a decrease of 42%. The NFT transaction volumes on Bitcoin, Ethereum, and Solana decreased by 80.5%, 20%, and 50.1%, respectively. The number of NFT traders in May also decreased compared to previous months, especially for Bitcoin, with the number of traders decreasing from 393,000 in April to 114,400.
Year-on-year comparison between 2024 and 2023
January comparison
- January 2023: NFT market transaction volume was close to $946 million.
- January 2024: Transaction volume was $12.80 billion, a 35.3% increase from the previous year, indicating sustained market growth.
May comparison
- May 2023: NFT market transaction volume was approximately $870 million.
- May 2024: Transaction volume decreased to $7.95 billion, an 8.6% decrease from the same period the previous year, reflecting a significant market decline.
Data source:NFT Pulse
Summary
Overall, despite the strong market performance at the beginning of 2024, the market experienced significant fluctuations and declines over time, especially in May, when both transaction volume and activity decreased significantly. This indicates that the NFT market faced challenges in the first half of 2024 and requires further observation of future market trends and recovery potential.
Multi-chain transaction volume: BTC market share continues to expand, surpassing Ethereum at one point
In the first half of 2024, the market share of NFT market transaction volume on different blockchains underwent significant changes. Here is the market share situation of transaction volume on major blockchains:
- Ethereum: Market share was 72.3% in 2023, which declined in the first half of 2024 but rebounded, temporarily losing its leading position.
- Bitcoin: Market share was 12.9% in 2023, and in the first half of 2024, the transaction volume fluctuated significantly, with market share increasing to around 40% at one point, then falling back to around 12%.
- Solana: Market share was 7.4% in 2023, but in the first half of 2024, Solana's market share significantly increased to around 20%, remaining the most stable in market share amid market fluctuations.
- Base: Market share was negligible at 2.3% in 2023, but influenced by the launch of MEME and Degen's L3, its NFT transaction volume surged, reaching a market share of up to 10.62%.
- Polygon: Market share was 2.2% in 2023, but in the first half of 2024, its transaction volume experienced significant fluctuations and declines.
Data source:NTF Pulse
Monthly data (source: NFT Pulse)
- January 2024: In January, BTC accounted for 9.4% of the NFT transaction volume market share, Ethereum for 66.67%, Solana for 17.75%, and Polygon for 5.9%. It is worth noting that Polygon's transaction volume sharply declined during the month.
- February 2024: BTC NFT transaction volume significantly increased, mainly driven by collections such as NodeMonkes from the Ordinals, leading to a rise in market share to 18.37%. Ethereum accounted for 62.15%, Solana for 17.85%, and Polygon's share dropped to 1.32% during this month. Influenced by the MEME sector, Base's chain NFT transaction volume started to show improvement, capturing a market share of 0.15%.
- March 2024: In March, BTC NFT transaction volume continued to rise, occupying 26.02% of the market share, while Ethereum accounted for 48.76% and Solana for 21.44%. Ethereum's NFT transaction volume share declined weekly, and Base emerged as a strong contender, reaching a transaction volume market share of 6% in the last week of March.
- April 2024: BTC NFT market share reached 33.47%, showing strong growth, especially in early April when the transaction volume share briefly exceeded ETH, reaching 43.5%. In comparison, Ethereum's NFT transaction volume market share decreased to 45%, Solana's market share slightly declined but remained around 16.37%, and Base accounted for 3%.
- May 2024: In May, BTC NFT transaction volume market share experienced a sharp decline to 12.37%, while Ethereum's market share recovered to 58.22%. Solana accounted for 13.5%, and Base surged to 10.62%.
- June 2024: As of the article's deadline (June 24th), in June, BTC NFT transaction volume market share continued to decline to 11.76%, while Ethereum's market share recovered to 62.2%. Solana dropped to 9.4%, Base to 4.56%, and Polygon rebounded to 15.83%.
Summary
In summary, the NFT market's transaction volume market share on different blockchains experienced significant changes in the first half of 2024. The significant growth in BTC NFT transaction volume was mainly attributed to the Ordinals protocol. In January, BTC's market share was 9.4%, but by April, this share had surged to 33.47%, briefly surpassing Ethereum at the beginning of the month. Although BTC's market share declined in May and June, dropping to 12.37% and 11.76% respectively, its overall performance still showed strong growth momentum.
In contrast, while Ethereum's market share fluctuated in the first half of the year, it still maintained its dominant position, decreasing from 66.67% in January to 45% in April, then recovering to 58.22% and 62.2% in May and June. Solana demonstrated relatively stable performance, while Polygon's market share experienced significant fluctuations, especially rebounding to 15.83% in June.
These changes in market share not only reflect the dynamic nature of the NFT market but also demonstrate the competition and development potential of different blockchains in the NFT ecosystem. With the continuous emergence of new protocols and projects, the market share of the NFT market may continue to change in the coming months and years, bringing more opportunities and challenges for market participants.
Marketplace Market Share Changes: Blur Continues to Lead, Magic Eden Briefly Takes the Lead at the End of May and Early June
Major NFT Marketplace Market Share in 2023
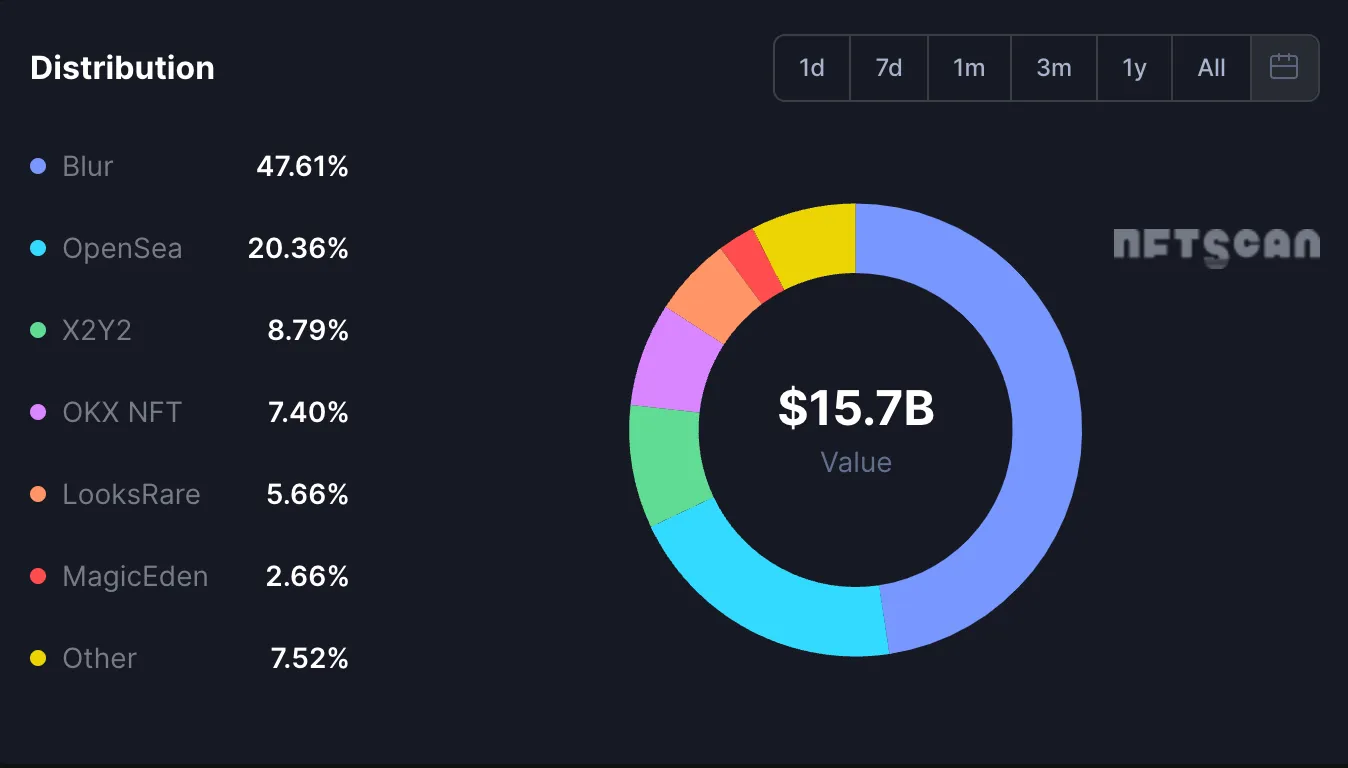
Blur: Due to its airdrop incentive strategy, zero transaction fees, and non-mandatory enforcement of creator royalties, Blur successfully surpassed OpenSea, capturing 47.61% of the market share. This strategy attracted a large number of users, especially those looking to maximize trading profits.
OpenSea: Despite facing fierce competition, OpenSea maintained its position as a leading NFT trading platform, occupying 20.36% of the market share. As a veteran platform in the market, OpenSea remains a top choice for many users, especially within the Ethereum ecosystem.
X2Y2: The average market share in 2023 was 8.79%, with relatively high market share at the beginning of the year, but dropping to negligible levels by the end of the year. X2Y2 initially attracted a large number of users through low transaction fees and a royalty-free strategy, but as market competition intensified, its advantage gradually weakened.
OKX NFT: The OKX NFT Marketplace emerged as a strong contender in 2023, with an average market share of 7.4%, mainly due to its focus on the BTC ecosystem, becoming one of the main trading platforms for Ordinals NFT in the second half of the year. OKX's multi-chain support and zero-fee transactions quickly attracted a large number of users, especially within the Bitcoin ecosystem.
Magic Eden: Capturing 2.66% of the market share, primarily in the Solana-based NFT market, its share significantly increased at the end of 2023, mainly due to its expansion to multiple blockchains, including the BTC chain.
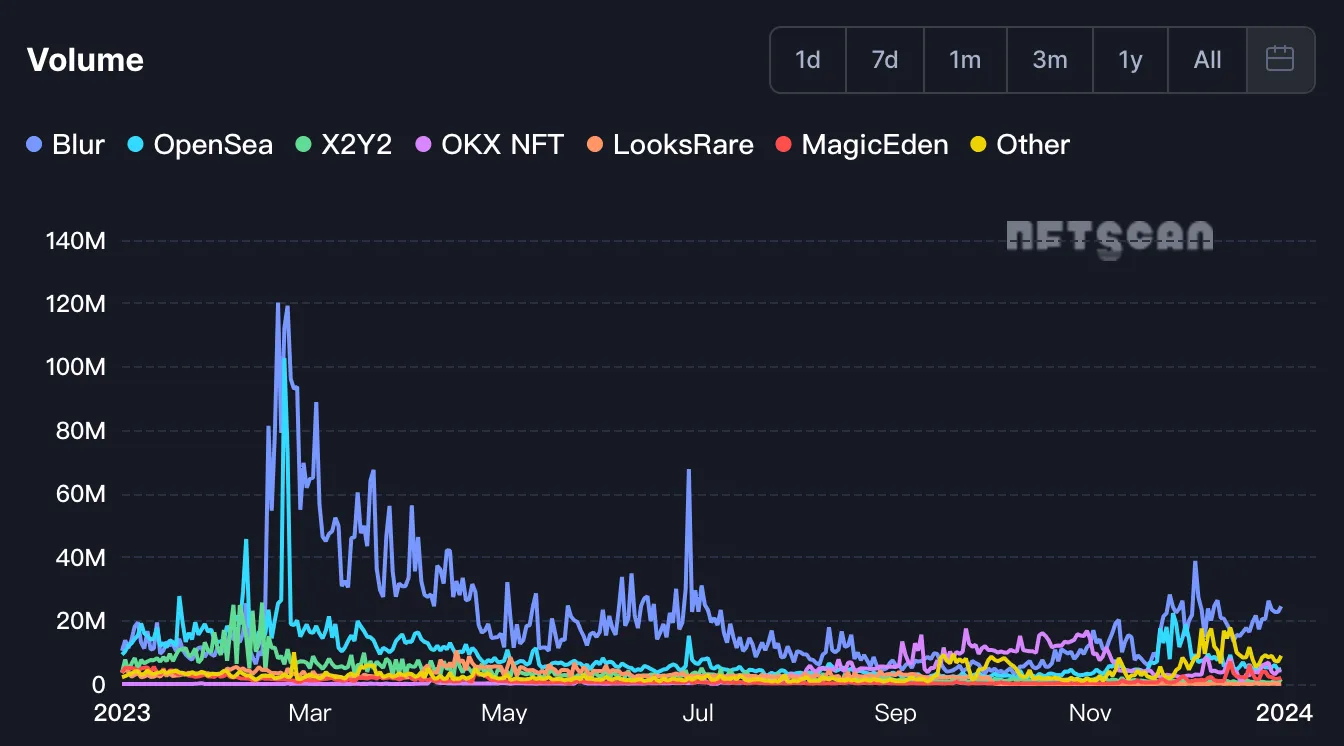
Data source:NFT Scan
Overall, the NFT market in 2023 showed significant changes in market share, with major NFT trading platforms continuously innovating in technology and user experience, as well as attracting and retaining users through multi-chain support and various incentive mechanisms. This diverse competitive environment not only promoted the development of various platforms but also drove the prosperity and progress of the entire NFT market.
Major NFT Marketplace Market Share in 2024: As of June 24th
- Blur: Continues to maintain its leading position, capturing 46.38% of the market share, with the majority of its trading volume still coming from Ethereum, while the Blast chain's transaction volume only accounts for 0.56%.
- OpenSea: Faced with intense competition, OpenSea did not make any innovative moves during the year, leading to a decrease in market share to 15.96%. Despite losing the lead, OpenSea remains one of the most important NFT trading platforms in the market, especially with a wide user base within the Ethereum ecosystem.
- X2Y2: Market share is negligible, almost disappearing from the NFT race competition.
- OKX NFT: Shows stable performance, maintaining a market share of around 5.37%. As a multi-chain support platform, OKX NFT Marketplace supports multiple blockchains such as Ethereum, Solana, and BSC, attracting users with its user-friendly interface and low transaction fees.
- Magic Eden: Continues to expand its market share, reaching 11.74%, becoming a major trading platform for Solana and BTC NFT. Magic Eden's expansion strategy and potential airdrop plans have led to a significant increase in its user base and transaction volume.
- Tensor: Due to its airdrop incentive program, Tensor, as one of the main Solana NFT trading platforms, saw its market share rise to 4.49 in the first half of the year. Tensor's incentive strategy significantly increased user participation and trading activity.
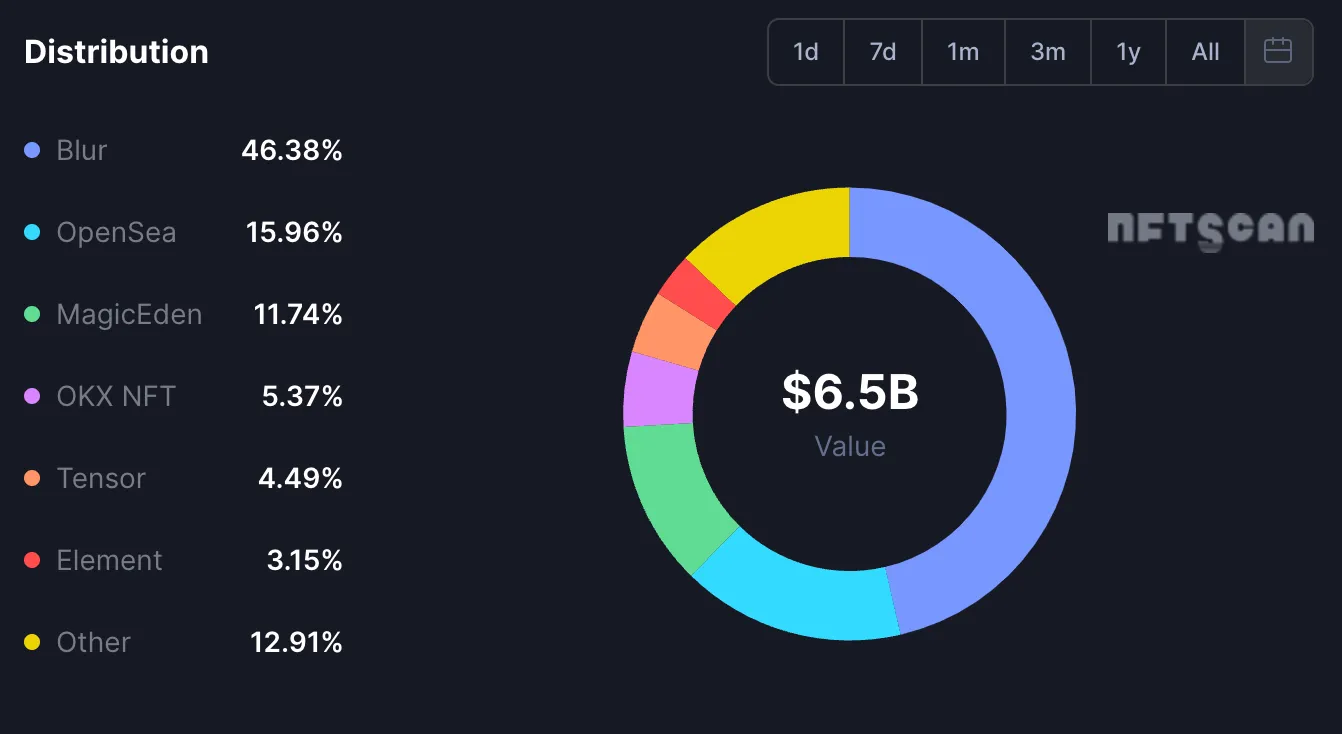
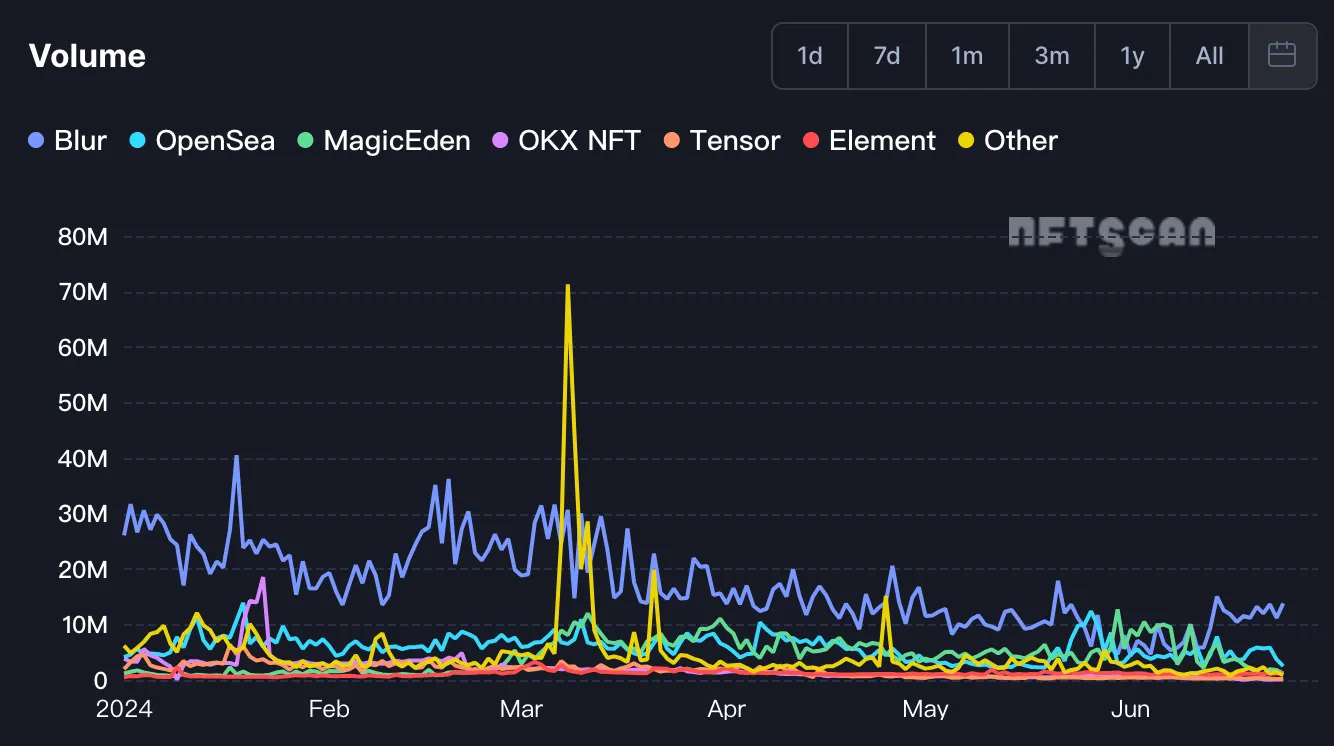
Data Source:NFT Scan
Summary
From the above information, it can be seen that Blur and Magic Eden performed exceptionally well in 2024, while OpenSea, despite losing some market share, still maintains an important position. Emerging platforms such as OKX and Tensor are gradually expanding their market influence through innovative incentive measures.
Conclusion
In the first half of 2024, the NFT market experienced significant fluctuations, showing overall instability. Although the launch of Bitcoin ETF brought new capital inflows, it did not significantly drive the overall market up. On the contrary, the recent sharp decline has triggered market panic, leading to a significant decrease in trading volume and low investor sentiment. This market volatility demonstrates high risk and uncertainty, and whether the NFT market can enter a bull market in the future remains an open question.
免责声明:本文章仅代表作者个人观点,不代表本平台的立场和观点。本文章仅供信息分享,不构成对任何人的任何投资建议。用户与作者之间的任何争议,与本平台无关。如网页中刊载的文章或图片涉及侵权,请提供相关的权利证明和身份证明发送邮件到support@aicoin.com,本平台相关工作人员将会进行核查。


