Original Title: 《Top 5 Chart Patterns Every Crypto Trader Should Know》
Author: Richard Knight
Translation: DeepTechFlow
Mastering chart patterns is a fundamental skill for every cryptocurrency trader. This article introduces the five most common chart patterns to help beginners identify market trends and provide practical trading strategies. Whether you are a novice or an experienced trader, these patterns can help you make wiser decisions in the cryptocurrency market.
1. Head & Shoulders
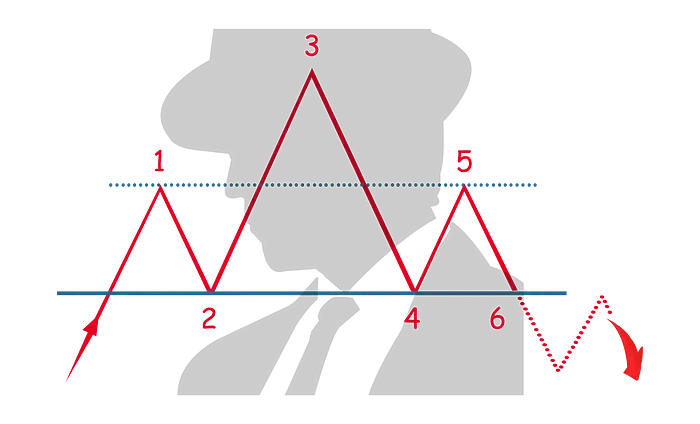
The head and shoulders pattern is a classic reversal signal, indicating a shift from a bull market to a bear market or vice versa. It consists of three peaks: the first and third peaks (shoulders) are similar in height, while the middle peak (head) is higher. The neckline formed by connecting the lows between these peaks acts as a support or resistance line. When the price breaks through the neckline, it indicates an impending reversal.
Usage: Traders can short when the bearish head and shoulders pattern breaks through, or buy when the bullish head and shoulders pattern breaks through.
2. Double Top & Double Bottom
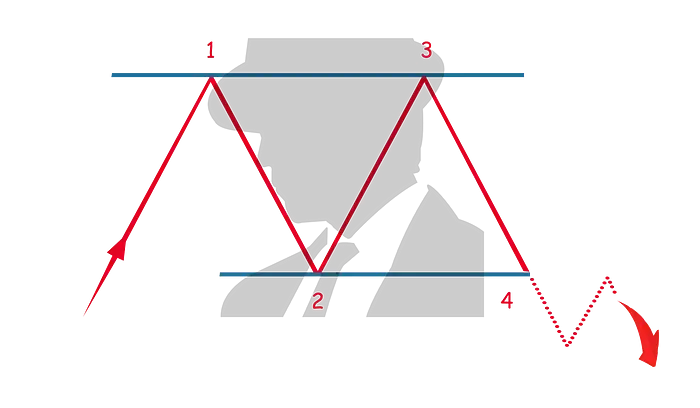
These patterns indicate potential trend reversals, resembling a "W" (double bottom) or "M" (double top) shape. In the double top pattern, the price rises to the resistance level twice but fails to break through, then reverses downward. In the double bottom pattern, the price touches the support level twice but fails to further decline, then reverses upward.
Usage: Traders can look for these patterns at market extremes. A breakout signal below the neckline of a double top may present a shorting opportunity, while a breakout signal above the neckline of a double bottom may present a buying opportunity.
3. Triangles: Ascending, Descending, and Symmetric
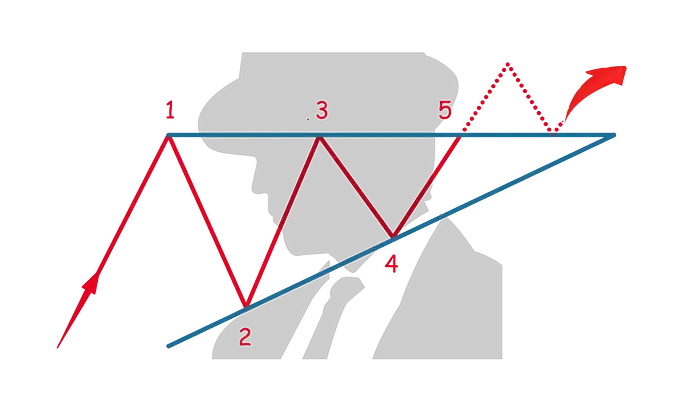
Triangle patterns indicate market consolidation, often leading to trend continuation or reversal. They can be categorized into three forms:
- Ascending Triangle: Formed when there are horizontal resistance lines and an upward trend line. A breakout of the resistance line typically indicates a bullish trend continuation.
- Descending Triangle: Formed when there are horizontal support lines and a downward trend line. A breakout of the support line typically indicates a bearish trend continuation.
- Symmetric Triangle: Formed by two converging trend lines, indicating a consolidation phase. A breakout in either direction indicates trend continuation.
Usage: Traders can establish positions in the breakout direction, or view the symmetric triangle as a potential signal for trend continuation or reversal.
4. Flags and Pennants
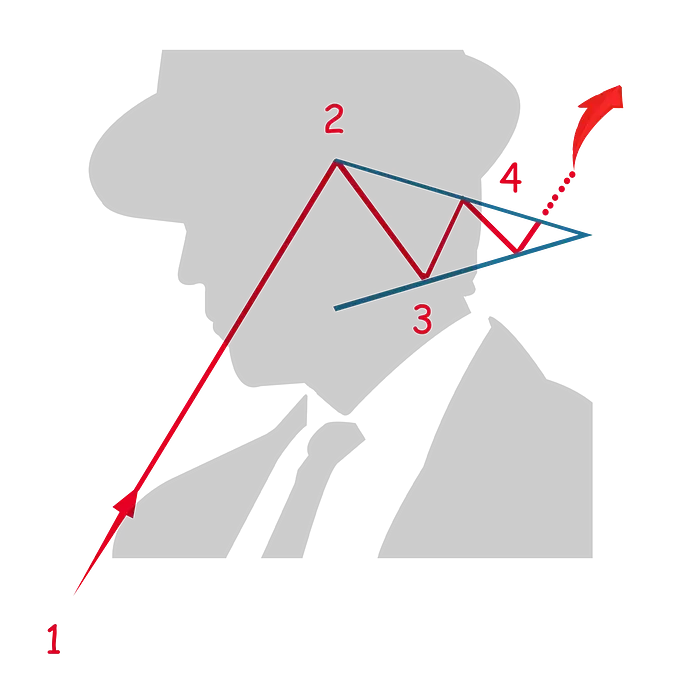
These patterns typically indicate the continuation of an existing trend after a brief consolidation period.
- Flag: Formed by parallel trend lines, indicating a temporary counter-trend to the main movement.
- Pennant: Similar to a small symmetrical triangle, indicating a brief consolidation phase.
Usage: When the price breaks out of a flag or pennant, traders can establish positions in the direction of the main trend.
5. Cup & Handle Pattern
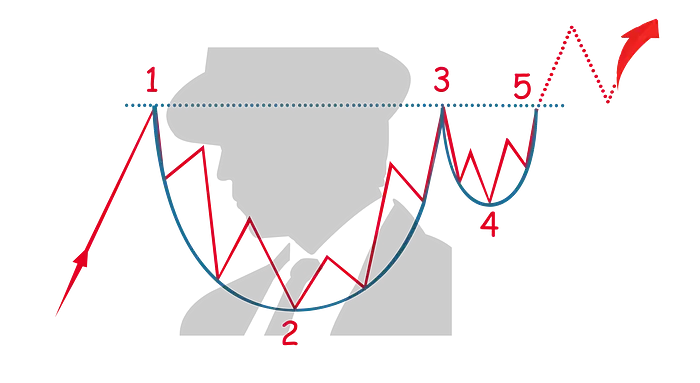
This bullish continuation pattern resembles a cup shape, with a round "cup" followed by a smaller "handle." The handle represents a minor consolidation, typically leading to a breakout in the same direction as the initial upward trend.
Usage: Traders can establish long positions when the price breaks above the handle's resistance level, anticipating a continuation of the previous upward trend.
Conclusion
Understanding your cryptocurrency trading patterns is an invaluable tool for traders, helping you insight potential reversals or trend continuations. Mastering these five key patterns can significantly enhance your ability to navigate cryptocurrency market fluctuations. Through practice, you will be able to confidently identify these patterns.
免责声明:本文章仅代表作者个人观点,不代表本平台的立场和观点。本文章仅供信息分享,不构成对任何人的任何投资建议。用户与作者之间的任何争议,与本平台无关。如网页中刊载的文章或图片涉及侵权,请提供相关的权利证明和身份证明发送邮件到support@aicoin.com,本平台相关工作人员将会进行核查。


