This report provides an in-depth analysis of the cryptocurrency market in the first four months of 2024, with a special focus on April 2024.
Author: HashKey Capital
Translation: DeepTechFlow
Introduction
This report provides an in-depth analysis of the cryptocurrency market in the first four months of 2024, with a special focus on April 2024. Despite a 20% correction in April, the total market value of the cryptocurrency market has still grown by 27% since the beginning of the year. Bitcoin accounts for 53% of the total market value of the cryptocurrency market and has achieved a 30% return in the first four months of 2024, far exceeding traditional assets such as the S&P 500 index.
Key Points of the Article
The total market value of the cryptocurrency market has increased by 27% since the beginning of the year. Bitcoin holds a 53% market share.
There are 78 cryptocurrencies with a market value exceeding $1 billion.
From January to April 2024, Bitcoin's return rate was 5 times that of the S&P 500 index.
Bitcoin's Sharpe ratio is 3.
By the end of April, most indicators showed that the market was in an "oversold" state.
Major topics in April included Layer 1 protocols, artificial intelligence, gaming, Meme, DePin, and DeFi.
Since the Dencun upgrade on March 13th, the price of Ethereum has dropped by 27%, and the supply has increased by 38,000 ETH.
The Dencun upgrade greatly increased the income of L2 and user payment fees.
Compared to last year, trading volume and open interest contracts remain high.
By the end of April, the managed assets of spot Bitcoin ETFs reached $52 million. Hong Kong launched six cryptocurrency ETFs.
In March and April, venture capital firms invested over $1 billion in cryptocurrency startups.
After the Bitcoin halving on April 19th, Bitcoin's computing power decreased by 7.5%. On the other hand, April was the month with the highest Bitcoin transaction fee income.
April Highlights
April 5th—Ethena backed Bitcoin as USDe's support asset.
April 6th to 9th—The Hong Kong Web3 Festival organized by HashKey attracted over 30,000 people.
April 7th—Publication of the book "Cryptocurrency Valuation Framework."
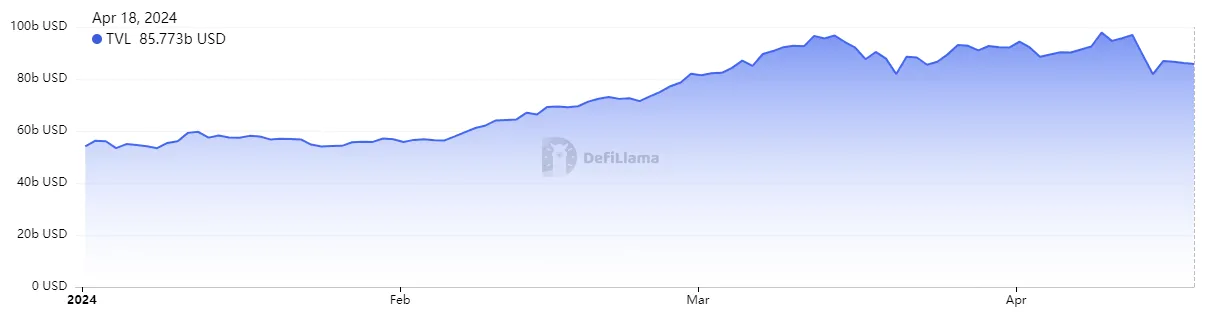
April 8th—The total locked value (TVL) of DeFi exceeded $100 billion for the first time in two years.
April 8th—Bitcoin reached $72,300.
April 9th—Monada Labs raised $225 million led by Paradigm.
April 10th—HashKey announced L2HashKey Chain.
April 11th—Uniswap received an enforcement notice from the SEC.
April 15th—Bitcoin experienced its fourth halving, reducing mining rewards to 3.125 BTC.
April 24th—Blackrock's spot Bitcoin ETF saw net inflows for 70 consecutive days.
April 30th—Six cryptocurrency ETFs, including HashKey's spot Bitcoin and Ethereum ETFs, were listed in Hong Kong.
Market Overview
This report provides an in-depth analysis of the cryptocurrency market in the first four months of 2024, with a special focus on April 2024. Despite a 20% correction in April, the total market value of the cryptocurrency market has still grown by 27% since the beginning of the year. Bitcoin accounts for 53% of the total market value of the cryptocurrency market and has achieved a 30% return in the first four months of 2024, surpassing traditional assets such as the S&P 500.
In April 2024, the cryptocurrency market experienced many important events and developments. The Bitcoin halving was a key event, reducing the mining rewards for Bitcoin transactions and causing excitement and anticipation within the cryptocurrency community. Historically, this event is often associated with price fluctuations and is expected to impact the supply dynamics of Bitcoin.
The total market value of the cryptocurrency market continued to rise, reaching a new high of $2.9 trillion in March, indicating strong growth in the first quarter of 2024. This growth was primarily driven by the approval of the US spot Bitcoin ETF in January, which greatly boosted the price of Bitcoin, leading to a historic high in March.
Significant developments were also seen in the re-staking of Ethereum on EigenLayer, reaching 4.3 million ETH with a quarterly growth rate of 36%. This indicates increasing interest in subscriptions and the Ethereum ecosystem. The approval of the US spot Bitcoin ETF and expectations for the Ethereum spot ETF further stimulated market sentiment.
Solana also received attention, with its Meme increasing by $8.32 billion in market value in the first quarter of 2024. Overall, driven by significant events such as the Bitcoin halving and developments in alternative currencies, the cryptocurrency market in April 2024 was filled with anticipation, excitement, and volatility.
Cryptocurrency Market Value
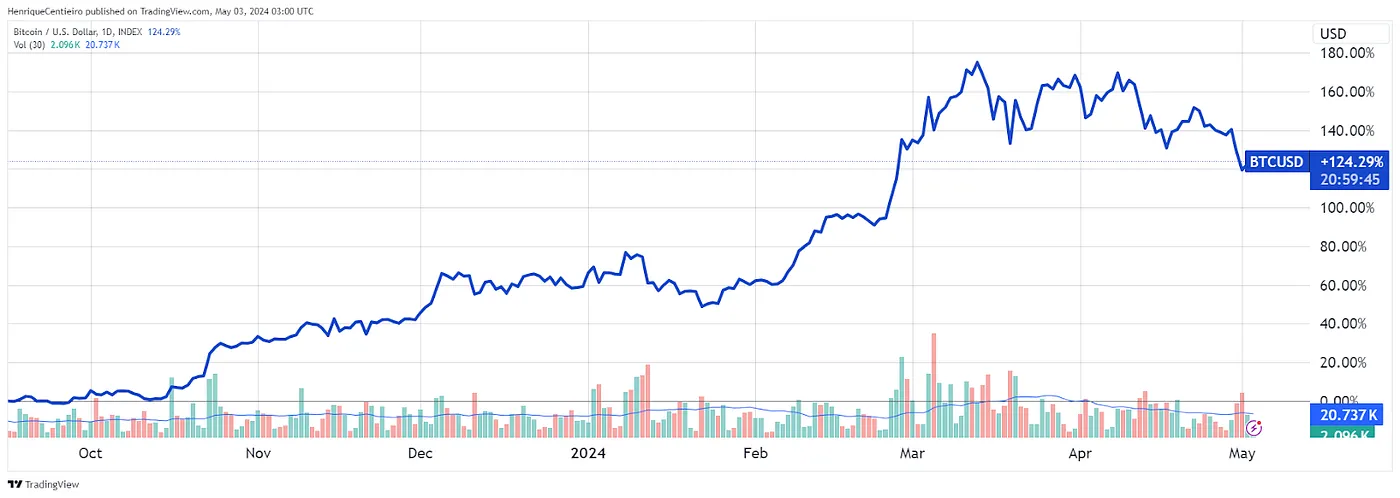
From the beginning of the year to the end of April, the total market value of the cryptocurrency market increased by 27%. The current market value is $2.11 trillion, only 25% lower than the historical high of $2.8 trillion in November 2021. Bitcoin accounts for 53% of the total market value of the cryptocurrency market.
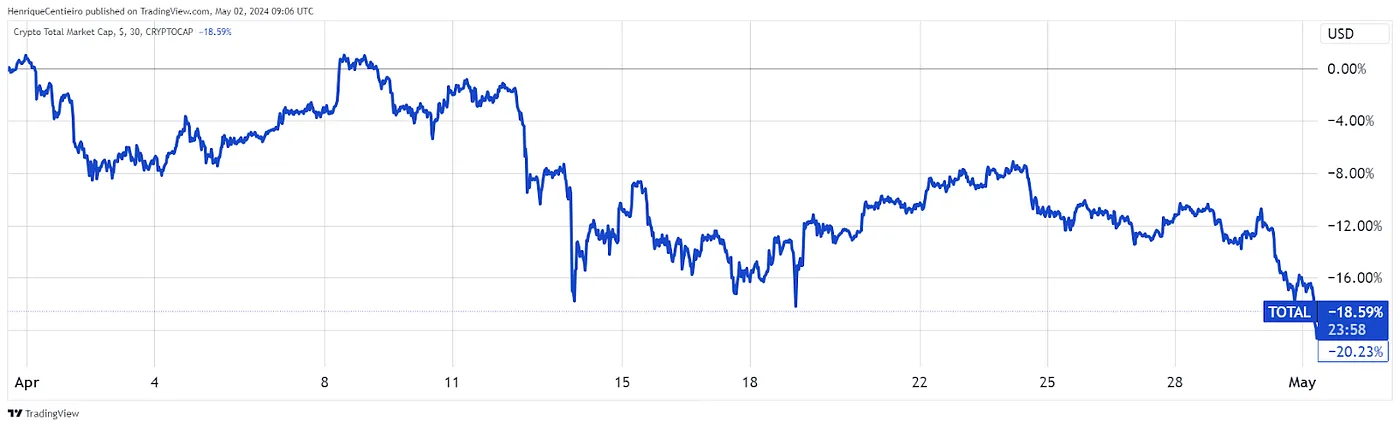
April was a month of correction for the cryptocurrency market, with a 20% decrease in market value. However, it is important to note that the cryptocurrency market had a very strong performance at the beginning of the year, soaring by 70% from the beginning of the year to March 14th. Therefore, this correction is a natural reaction to an overbought market.
Currently, there are 14 different cryptocurrencies with a market value exceeding $100 billion, and 78 assets with a market value exceeding $10 billion.
Comparison of Bitcoin and Benchmark Assets
Bitcoin achieved a 30% return in the first four months of 2024. Compared to other traditional assets, Bitcoin and other cryptocurrencies have shown interesting excess returns and risk-adjusted returns.
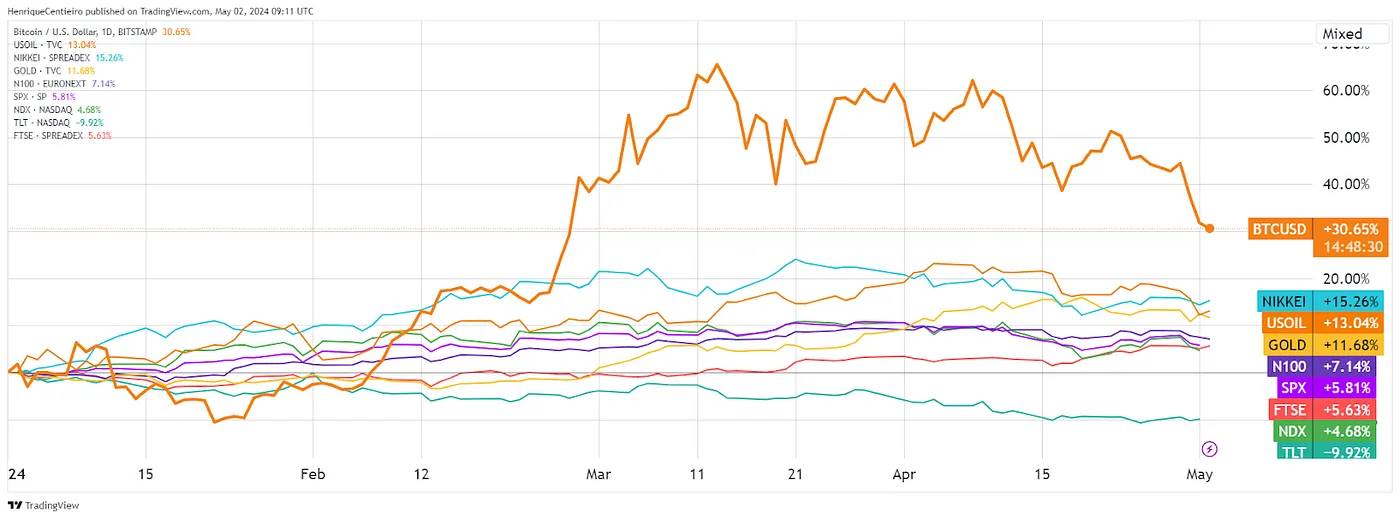
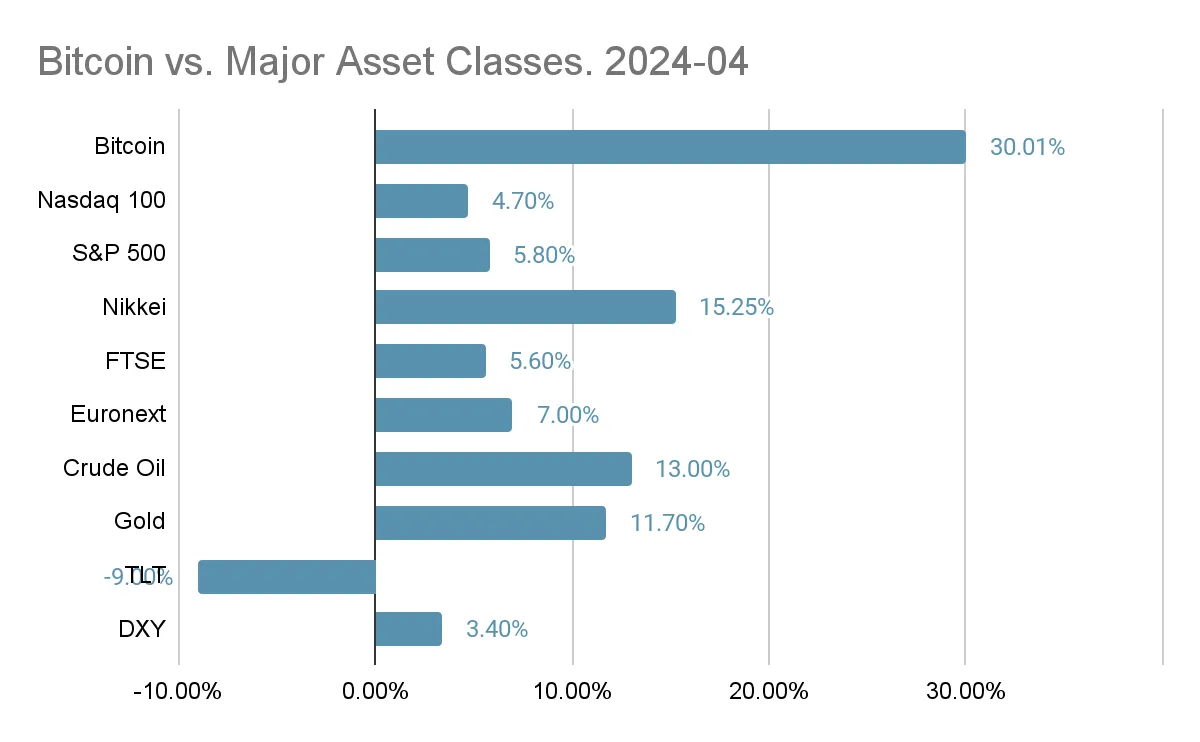
Despite the strong performance of the stock market this year, Bitcoin's return rate is 5 times that of the stock market (S&P 500). It is important to note that Bitcoin is typically the least volatile of the cryptocurrencies, with the returns of many other cryptocurrencies being multiples of Bitcoin's. For example:
Toncoin 107%
Dogwifhat 1,637%
Arweave 201%
Fetch.ai 193%
Jupiter 4,629%
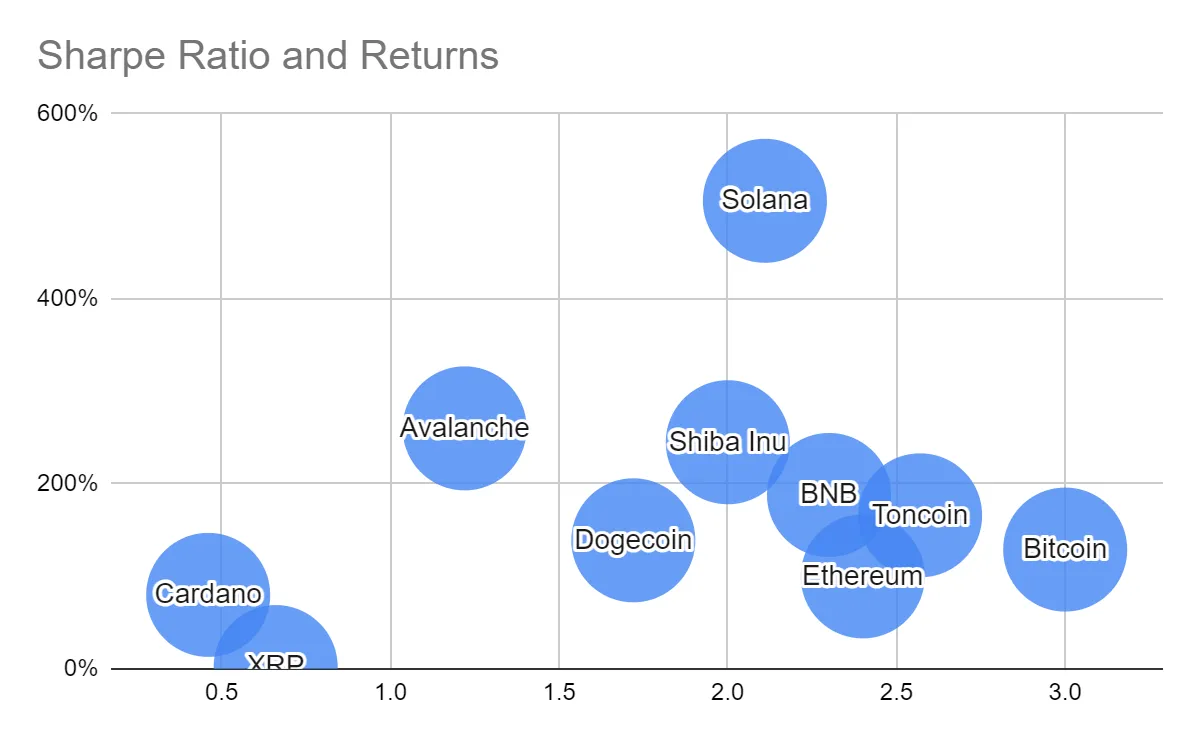
Volatility and Sharpe Ratio
Although cryptocurrencies are generally considered to be highly volatile assets, their risk-adjusted returns are often more attractive than other asset classes. While cryptocurrencies are traditionally viewed as risky assets, they also provide better risk-adjusted returns than traditional assets. In other words, considering the volatility that investors must endure, these returns are attractive.
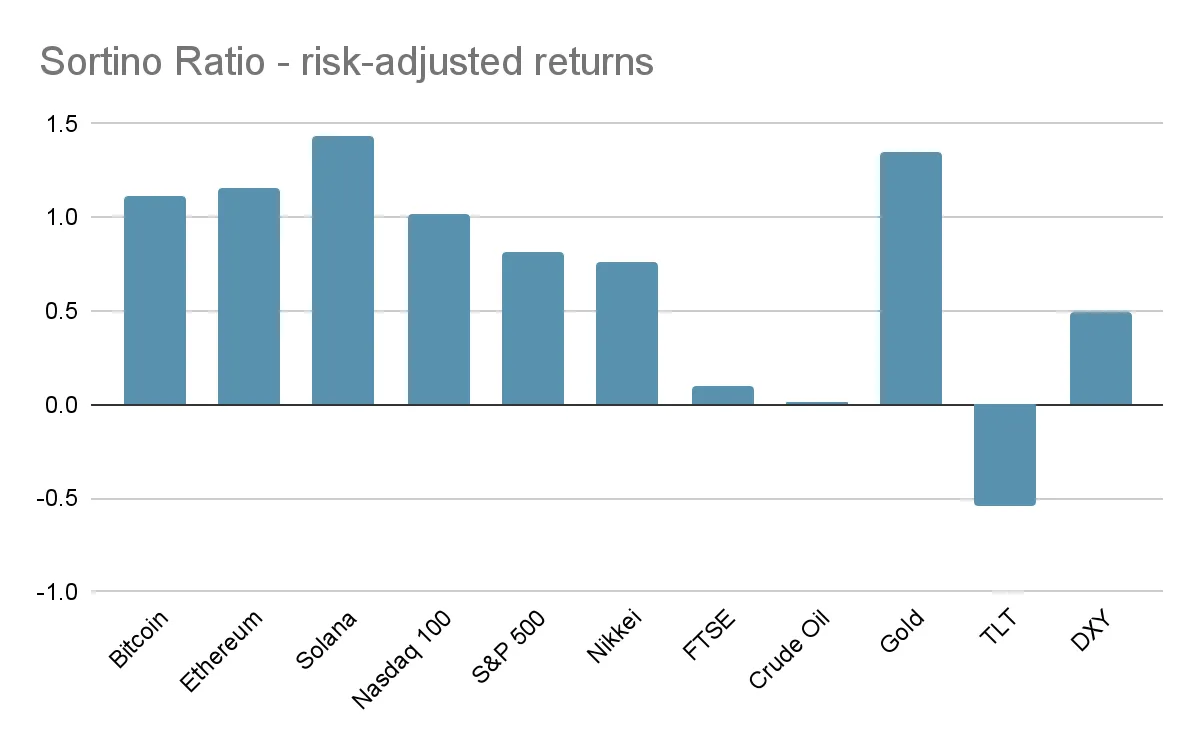
In the first four months of this year, Solana performed the best among high-market-cap cryptocurrencies. On the other hand, Bitcoin's Sharpe ratio reached 3, indicating a good return on the amount of risk provided. Typically, we would prefer to see assets located on the right side of the chart.
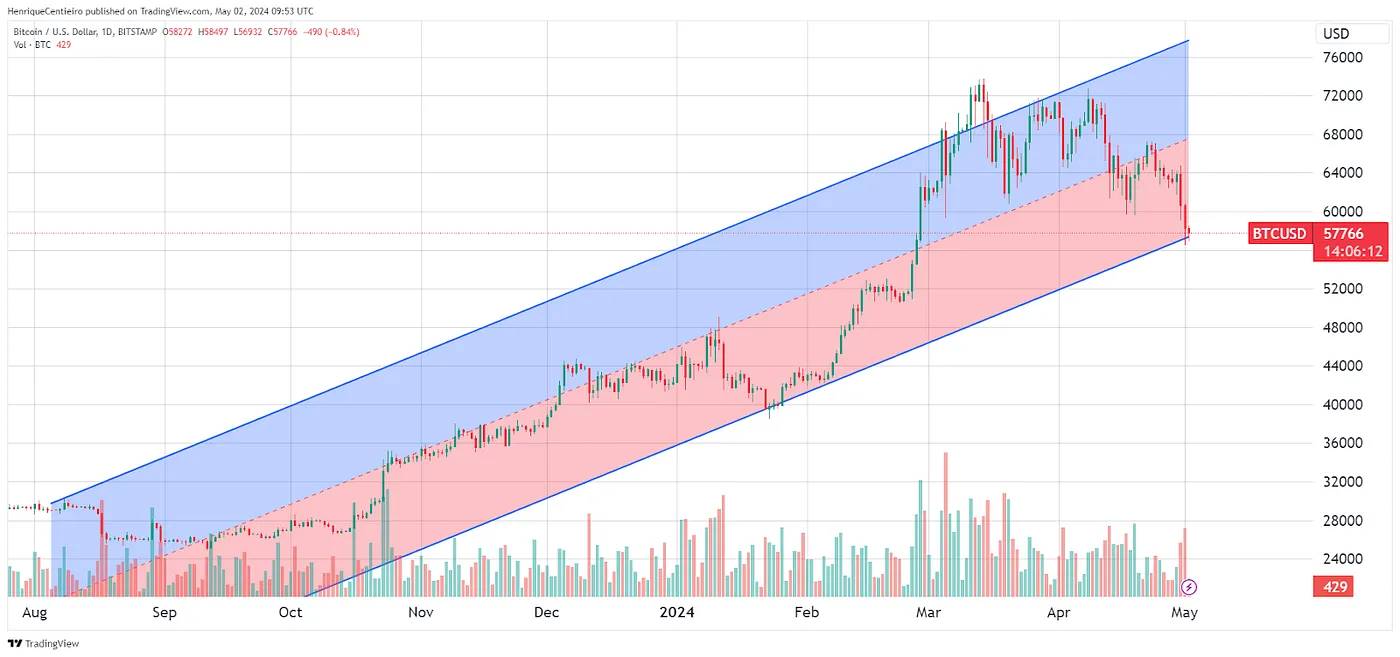
Price Trends and Technical Analysis
The 6-month return trend for Bitcoin is $67,500 (while the BTC price is $57,766), indicating that BTC may eventually retrace to the $67,000 level while continuing its growth trajectory.
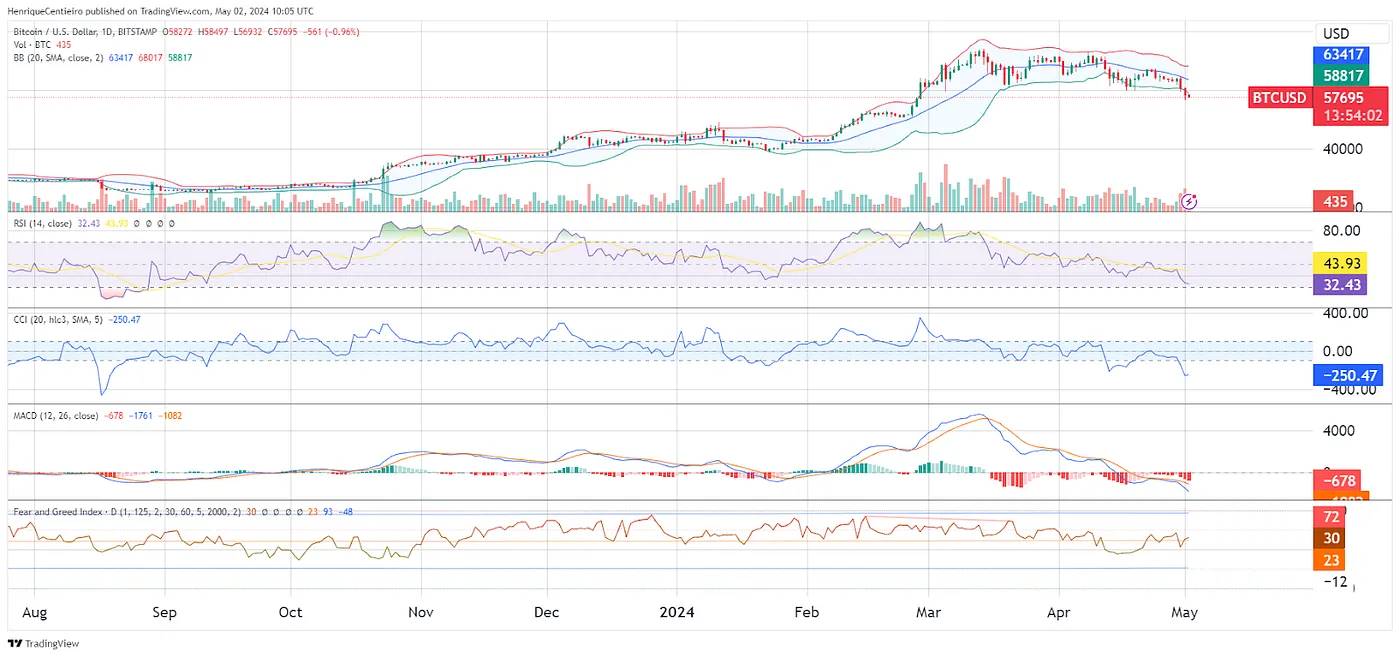
Currently, most momentum oscillators are in a neutral to oversold state.
Bollinger Bands: Oversold
RSI: Neutral/Oversold
CCI: Oversold
MACD: Oversold
Fear and Greed Index: Neutral
Based on the levels shown in the chart, we can expect a retracement to the $67,000 level.
BTC vs ETH
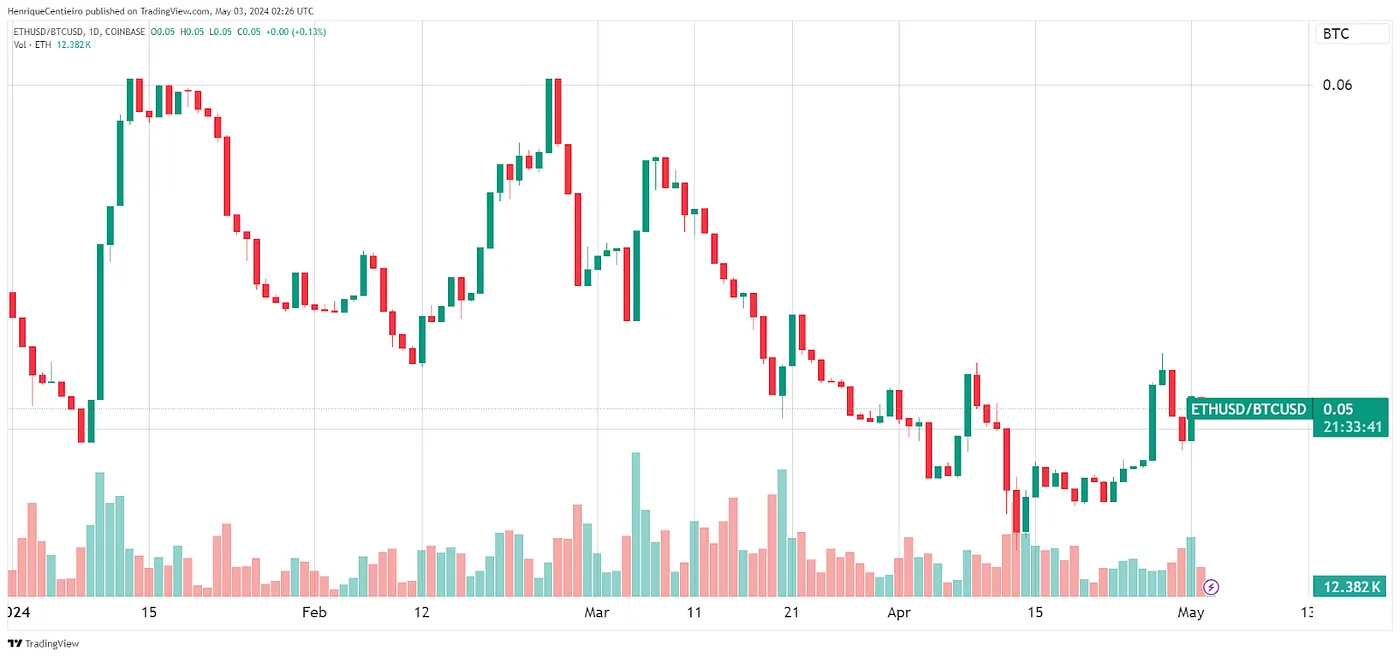
ETH has lost ground in comparison to BTC. ETH/BTC has declined by 6% since the beginning of the year. On one hand, this indicates that ETH is lagging behind in price action compared to BTC. On the other hand, it can be seen as a bullish signal, as ETH (and its related L2 ecosystem) has more room for growth.
In April, the biggest topic in the retail market was Meme. Among the top 10 coins with the best performance in the top 100 market cap, 2 are Meme coins: Bonk and Pepe.
Other top-performing coins (compared to BTC) include:
Neo (+22%)—Layer 1 protocol
Toncoin (17%)—Layer 1 protocol
Tron (16%)—Layer 1 protocol
BNB (12%)—Layer 1 protocol
Ondo (11%)—RWA
The main trends continue to be Meme, artificial intelligence, gaming, DePIN, and DeFi, with the latter receiving high attention on LSTfi, re-staking, and Emerging Chains (such as Linea) in the DeFi space.
Ethereum Price, Upgrades, and Burning
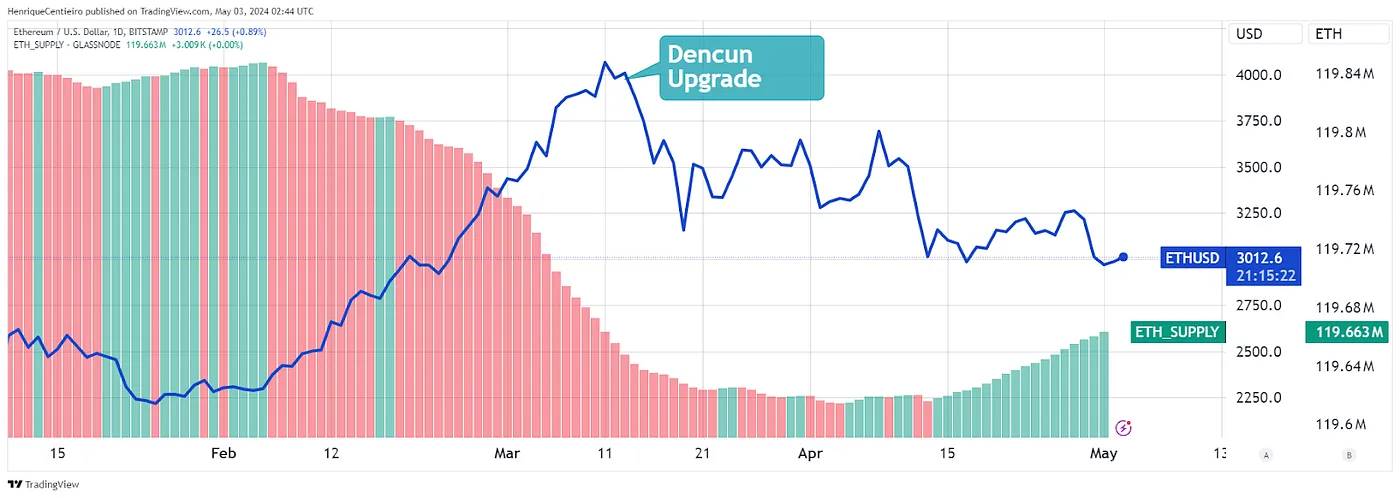
Ethereum closed the first quarter of 2024 at $3,507, a quarterly growth of 59.9%. The peak occurred before the Dencun upgrade on March 13th. The Dencun upgrade included EIP-4844, also known as Proto-Danksharding, which significantly reduced fees on L2 chains, greatly improving the user experience of the Ethereum ecosystem. Now, user transaction fees on L2 rollups can be less than $0.01.
Since the beginning of the year, the price of ETH has risen by 15%, but has decreased by 9% quarter-on-quarter, and has dropped by 27% since the Dencun upgrade on March 13th.
Since the merge upgrade (September 2022), Ethereum has become a deflationary asset, with a net supply reduction of nearly 1 million ETH (over $30 billion). In the first quarter alone, the circulating supply of Ethereum decreased by 0.2%.
Since the beginning of the year, the supply of ETH has decreased by 0.16%, equivalent to a reduction of 187,000 ETH, worth approximately $650 million. However, in April, the supply of ETH increased by approximately 38,000 ETH.
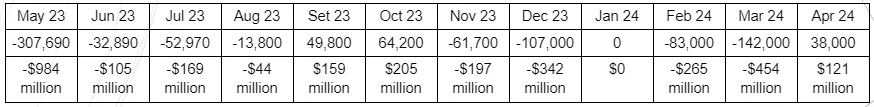
Monthly Ethereum Supply Changes
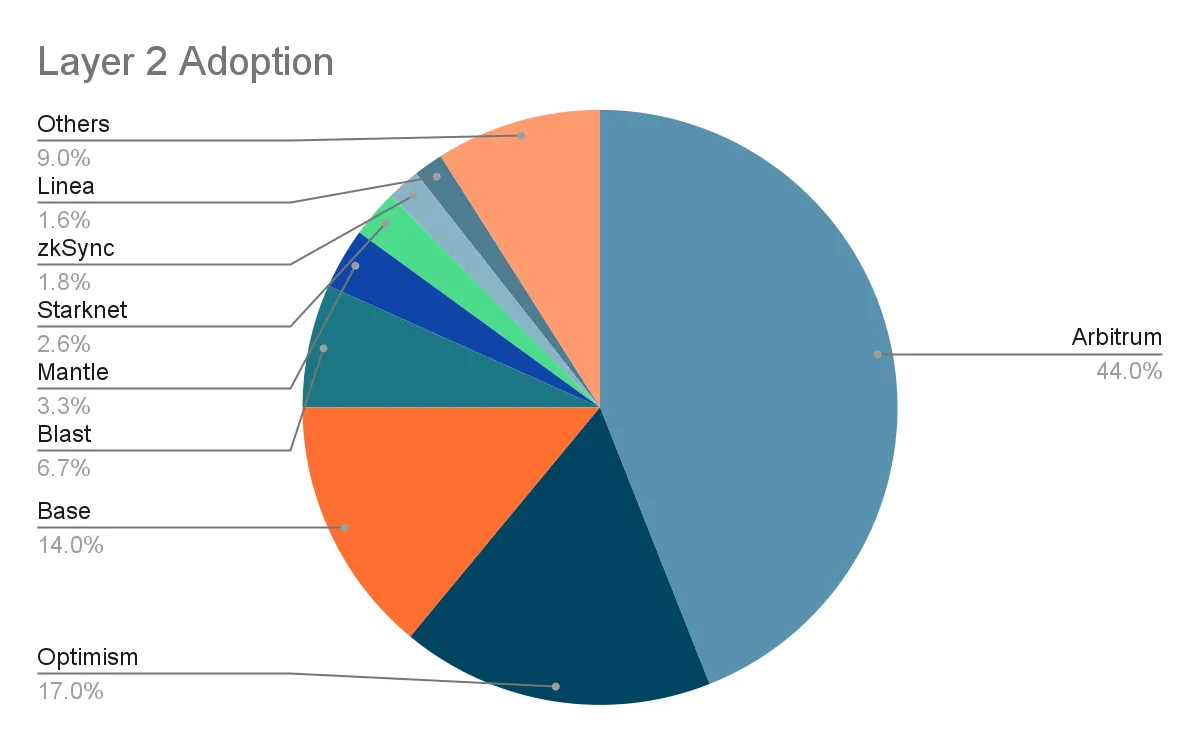
Adoption of L2
L2 networks are currently handling over $360 billion in TVL, with trading volume 11 times that of the Ethereum network. Since the Ethereum Dencun upgrade on March 13th, the user experience of L2 has significantly improved, especially in terms of transaction fees. In some cases, transaction fees have been reduced by over 90%. Proto-Danksharding introduced Blobs, which are like attachments to data blocks.
The main beneficiaries of the upgrade will be Ethereum rollup chains, which now have lower fees and faster transaction settlements. By making rollup transactions faster and cheaper, the upgrade will improve the user experience and potentially increase user adoption of the Ethereum ecosystem (including in the face of competitors). This will have a positive impact on L2, as they become cheaper, potentially increasing their revenue.
In addition to Proto-Danksharding, here are the other upgrades included in the Dencun upgrade:
EIP-1153: Forkless frontiers—aimed at allowing future network upgrades without the need for a hard fork
EIP-4788 and state receipt credentials—improving communication between the consensus layer and the execution layer to enhance network efficiency. State receipt credentials contain only basic information about transactions.
EIP-5656 and MCOPY opcode—improving smart contract efficiency by enhancing memory operations. This will translate to faster execution and lower transaction fees.
EIP-6780 and SELFDESTRUCT gas metering—better gas calculation for the selfdestruct function.
All of these updates are part of the long-term roadmap for Ethereum, with the ultimate goal of transforming Ethereum into the settlement/security layer of the internet.
Spot Trading Volume
March 2024 was the fourth highest volume month in history, with a volume of $2.48 trillion. High trading volume indicates increased market activity, confirmation of market trends, and increased institutional interest.
On the other hand, the trading volume in April dropped to an average of about 500,000 BTC per day.
Centralized Exchange (CEX) and Decentralized Exchange (DEX) Trading Volume
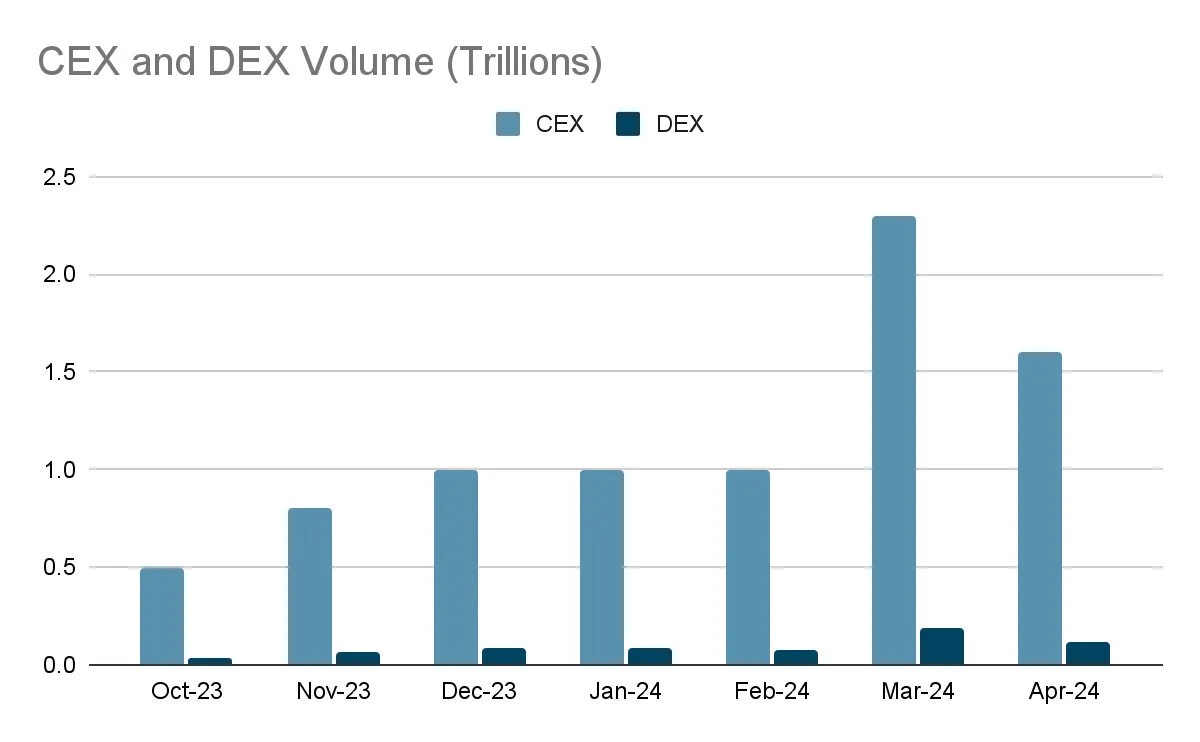
CEX trading volume increased by 95% in the first quarter of 2024, while DEX trading volume increased by 78%. Compared to March, the volume in April decreased by 31%, although it is still far above the average monthly volume of the past 6 months.
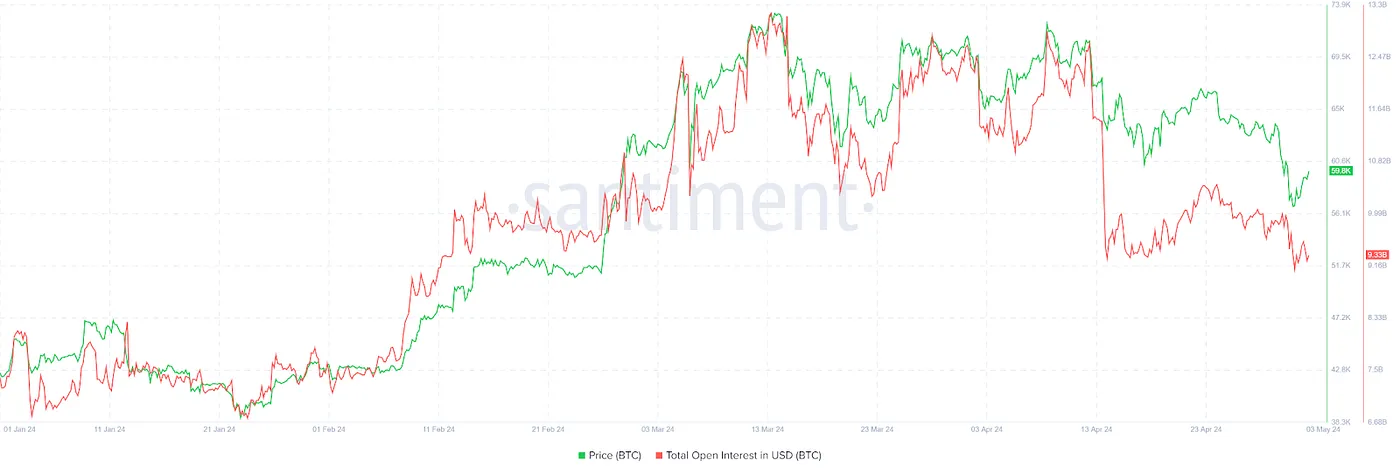
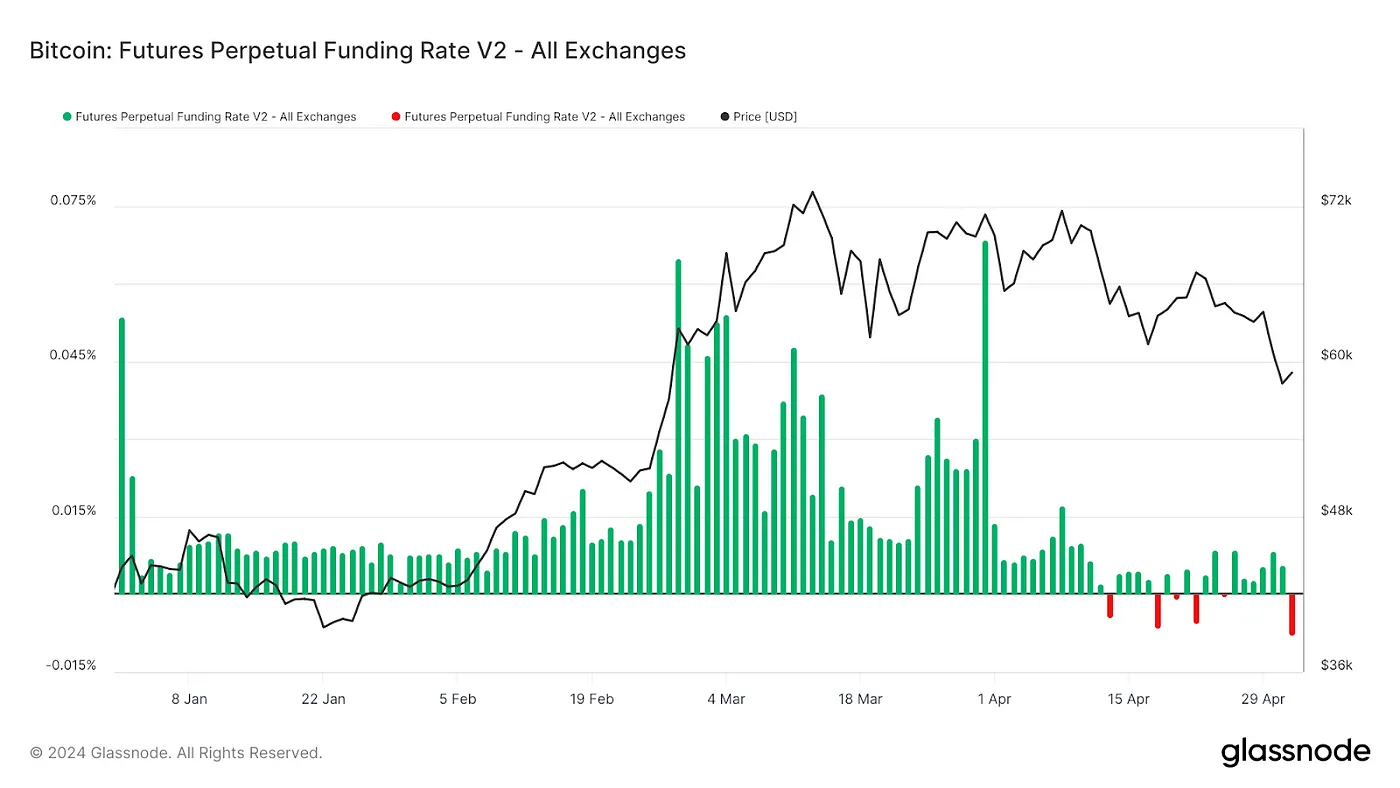
Futures Data
Funding rates are generally high and positive, indicating more long positions than short positions. However, liquidation events push funding rates into negative territory.
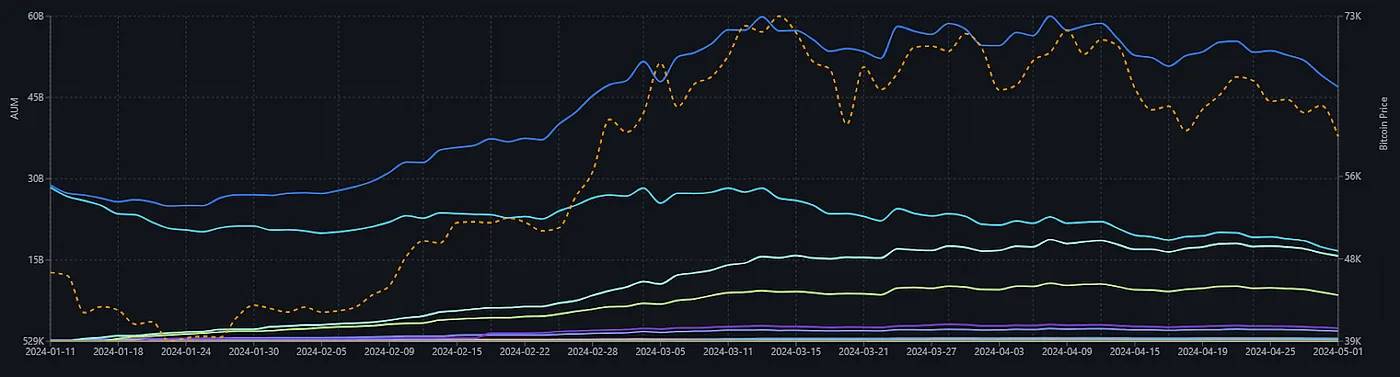
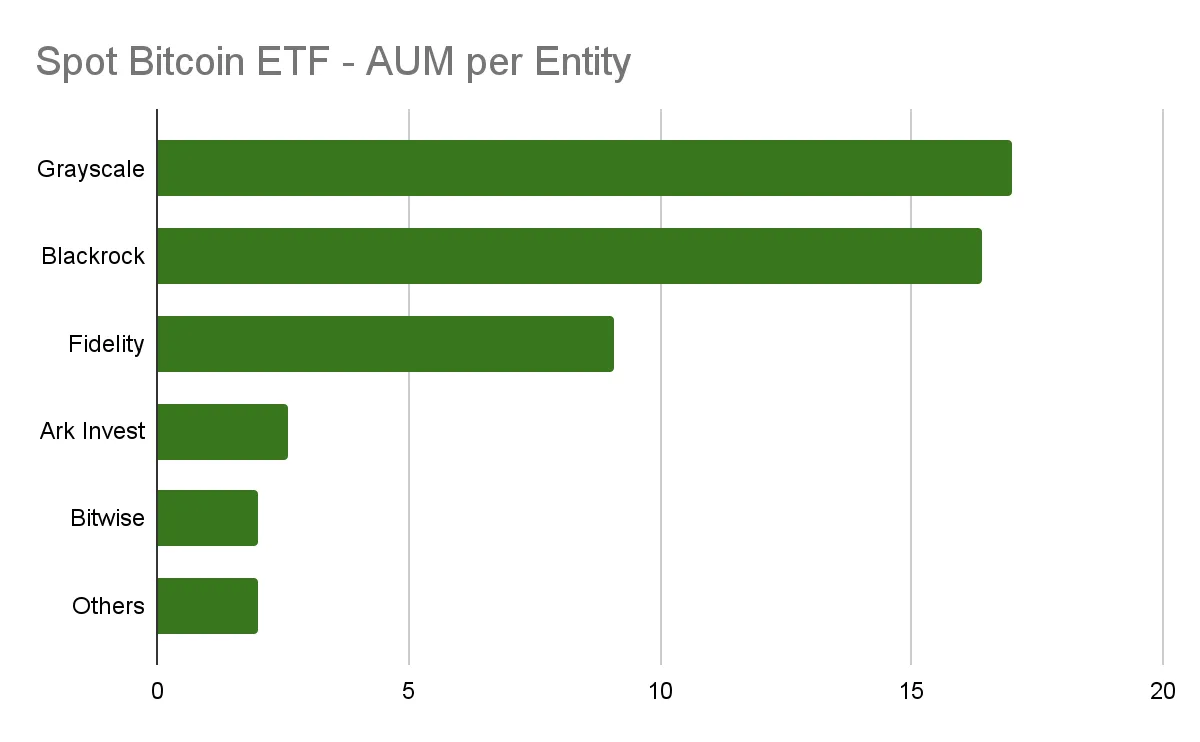
Spot Bitcoin ETF
The management assets of the US spot Bitcoin ETF at the end of April were $52 billion. Blackrock's ETF created a historical consecutive 72 days of positive net inflows, reaching $16.4 billion in management assets at the end of April.
HashKey also made history on April 30th, becoming part of the first batch of spot Bitcoin and Ethereum ETFs in Hong Kong, along with Borsera. The trading code for HashKey BTC ETF is 3008, and the trading code for ETH ETF is 3009.
Cryptocurrency Venture Capital Activity
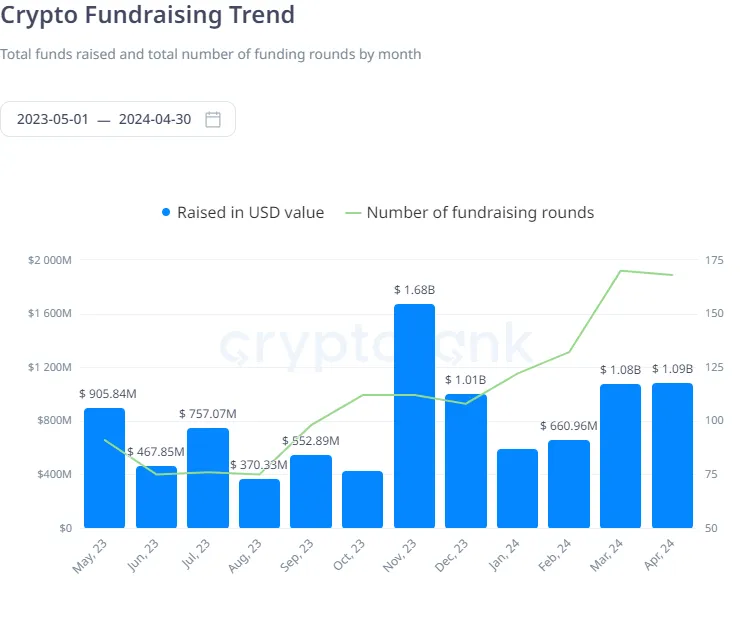
Venture capital activity has increased compared to most of 2023. In March and April, crypto startups attracted over $1 billion in monthly inflows.
Market Share and Dominance, and M2 Correlation
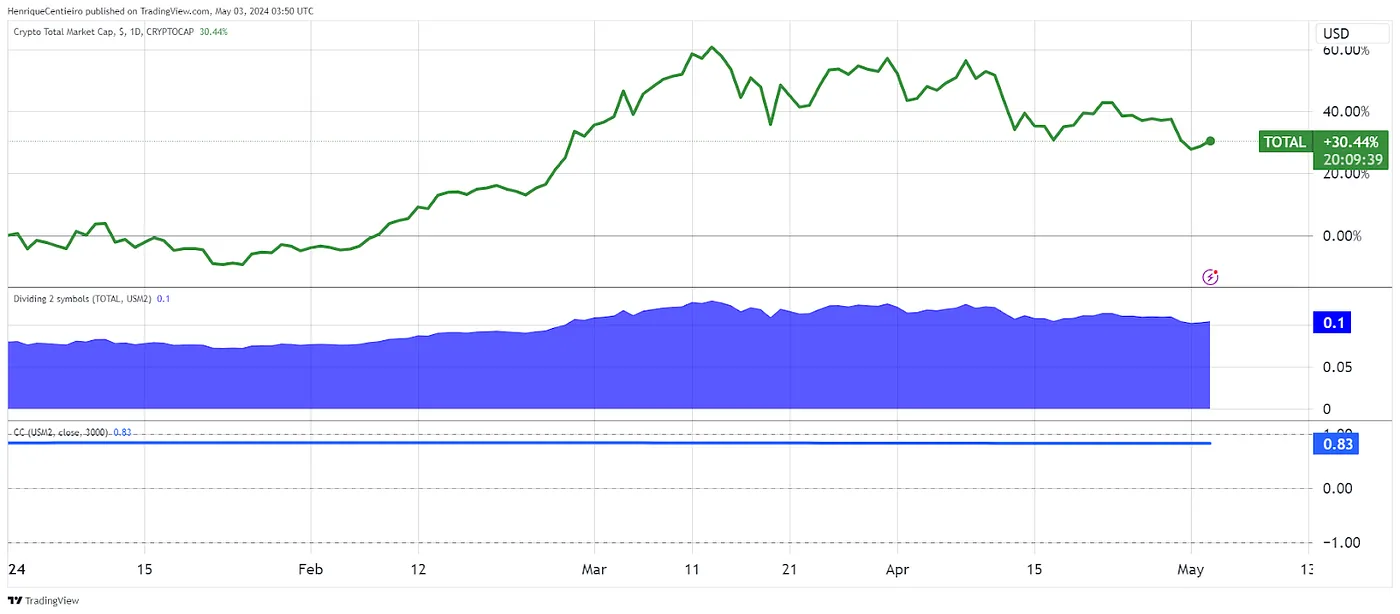
The 10-year correlation between the cryptocurrency market cap and the US M2 is 0.83. We can also observe that despite M2 not significantly increasing over the past two years, the cryptocurrency market cap has increased significantly.
The middle line shows the ratio of cryptomarketcap/US M2, currently at 0.10. This essentially means that if we compare the cryptocurrency market size to the US M2, the cryptocurrency market accounts for 10% of it.
Explanation: Cryptocurrency assets are attracting more and more market capital. This ratio is close to the previous historical high of 0.14. However, there is a major difference: the previous historical high of 0.14 was in November 2021, when the market was driven by very loose monetary policy. This means that the current market surge is more based on fundamentals rather than simple monetary printing momentum.
Bitcoin vs. Google Trends
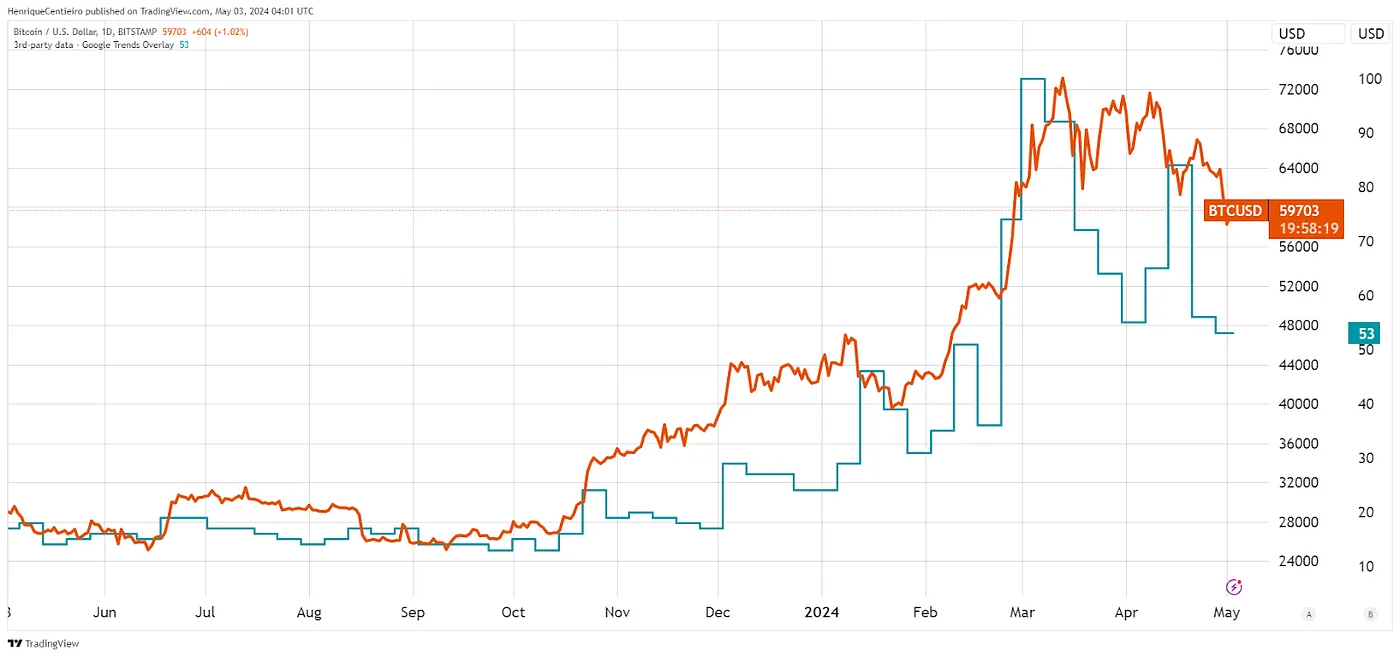
According to our analysis, there is a significant correlation between Google Trends (Google search frequency) and Bitcoin prices.
Coincidentally, lower Google search volume indicates a relatively quiet market from a retail perspective, thus consistently forming good buying opportunities.
Compared to last year, Bitcoin Google trend data shows a significant increase in Bitcoin's Google search volume. However, it should be noted that over time, there may be fewer people searching for Bitcoin as more people already know what Bitcoin is. Despite the decrease in Google search volume in April, the volume still exceeds 90% of all historical months.
Bitcoin Hash Rate and Hash Indicators, and Mining Income per Terahash
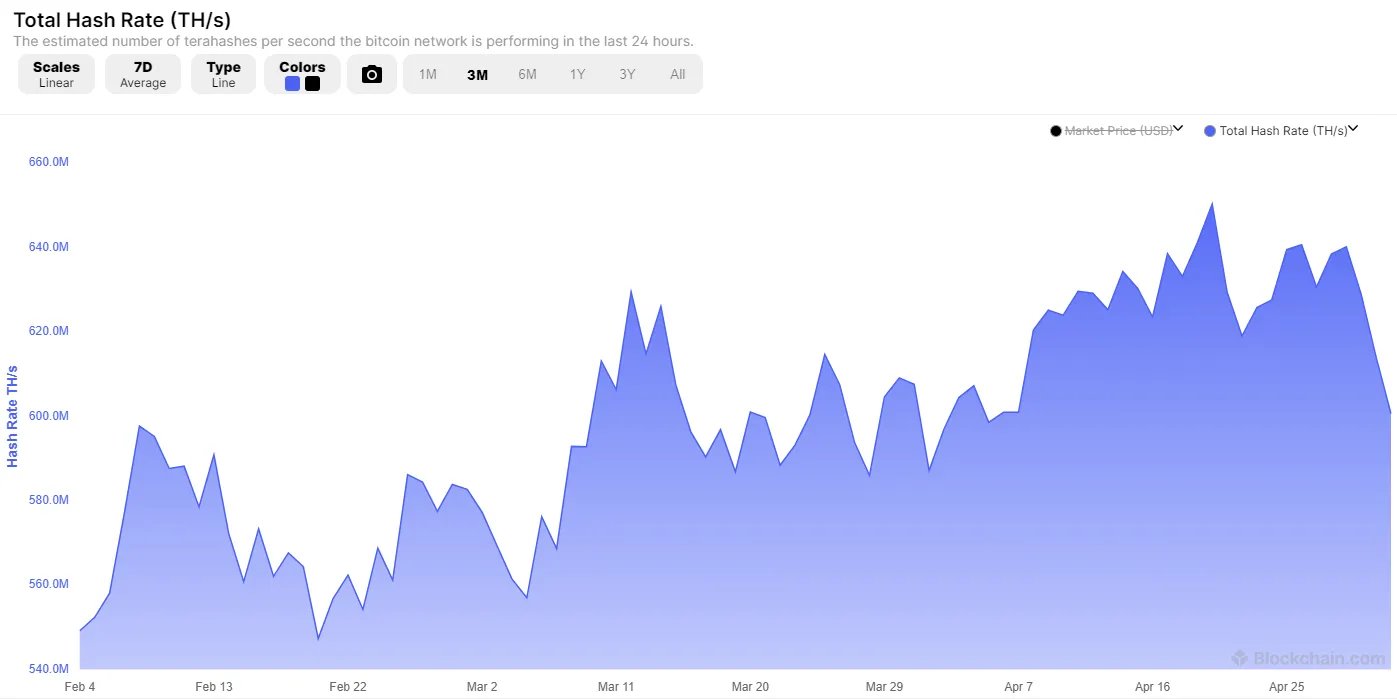
The Bitcoin hash rate measures the computational power on the network and also reflects the security of the network.
Despite the upcoming Bitcoin halving, we continue to see the hash rate reach new all-time highs, increasing by 2% in the first quarter of 2024.
However, after the Bitcoin halving on April 19th, the mining reward decreased from 6.25 to 3.125, and the Bitcoin hash rate decreased by 7.5%. With the reduction in mining rewards, it will no longer be feasible for higher-cost miners.
However, April 2024 was the month with the highest user-paid transaction fees. This is also an important source of income for miners.
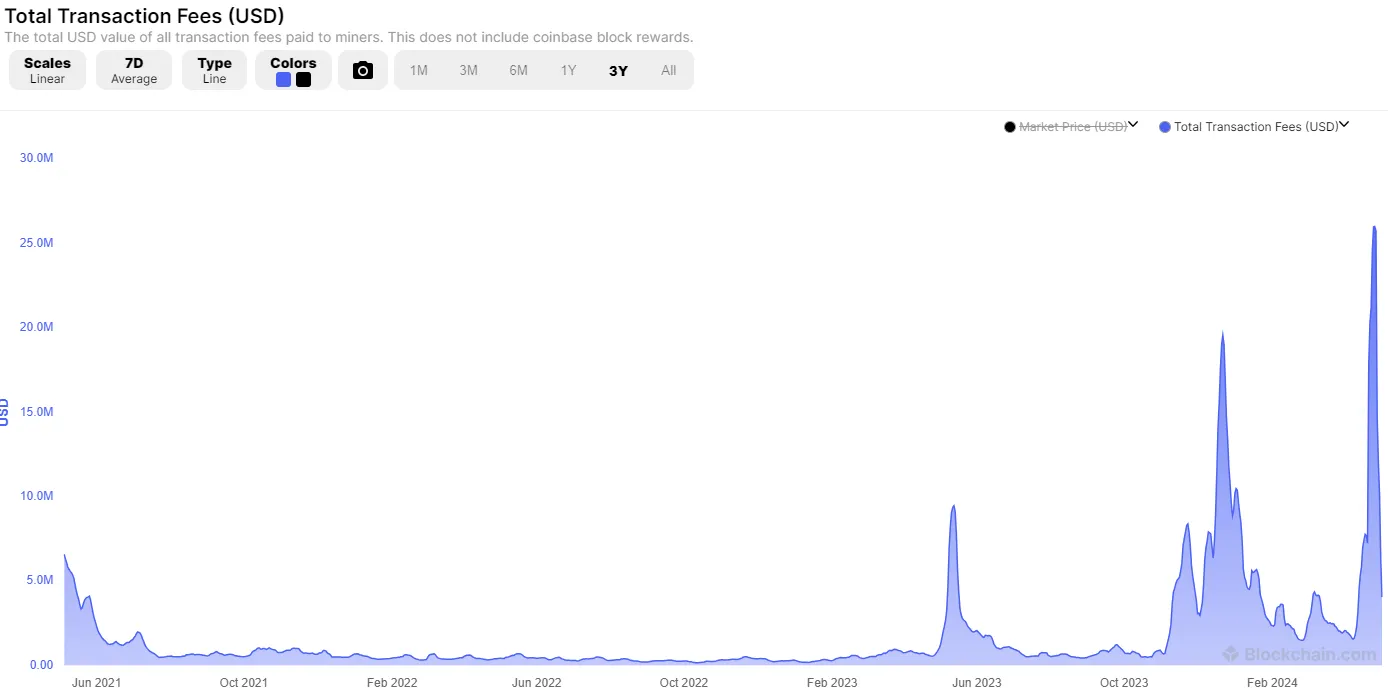
With the growth in network activity and the revival of BRC-20, Runes, and Bitcoin L2 chains, transaction fees may continue to increase and eventually replace block rewards as the main source of income for miners.
Realized Profits and Losses for Bitcoin
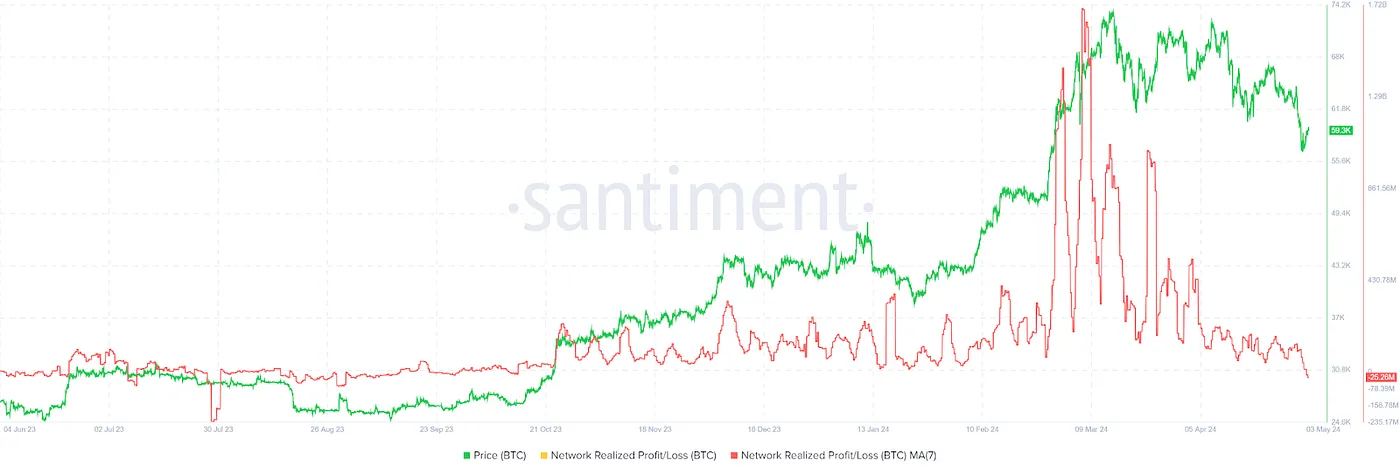
In March 2024, Bitcoin realized profits reached a new high. However, the realized profits turned negative in late April. This important indicator uses the concept of price tagging, where each UTXO is assigned a price.
When the value is negative, it means that investors may be selling Bitcoin at a loss. This is a signal of surrender (usually a relatively good buying opportunity). This can be explained as there is more room for growth after the market adjustment.
DeFi Activity
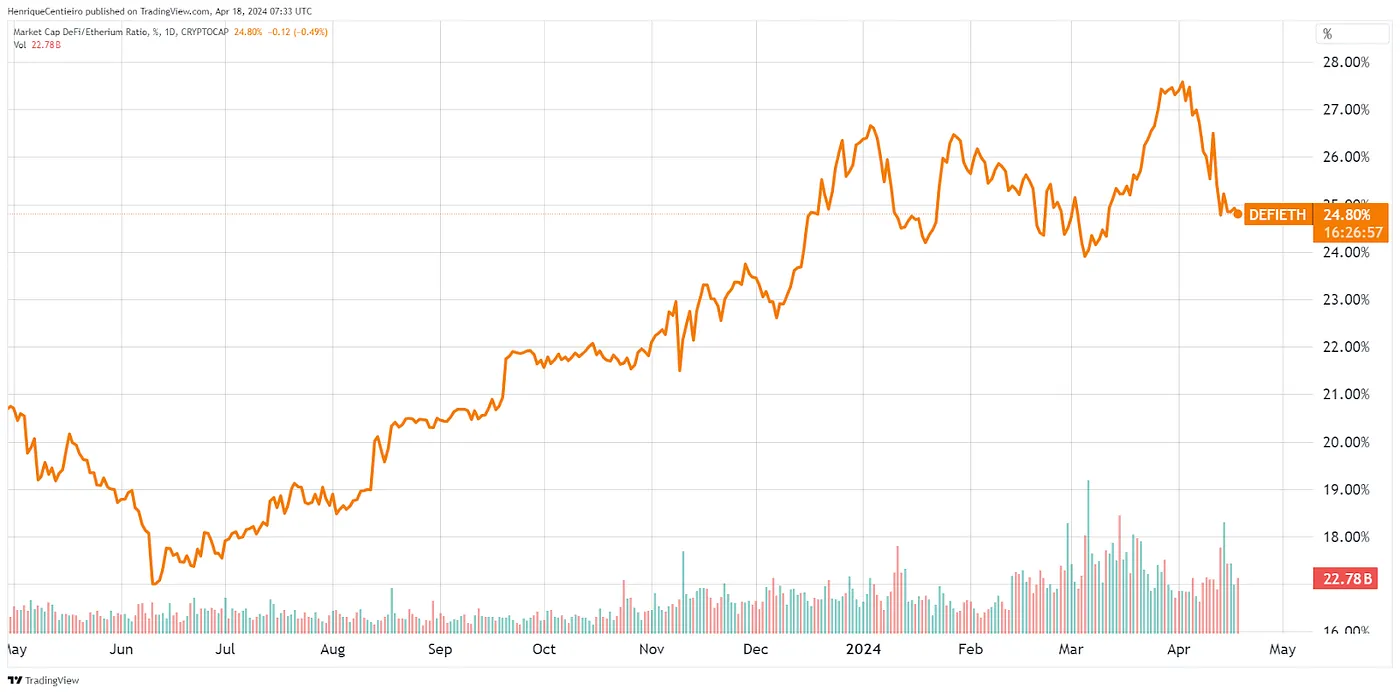
Over the past 6 months, we have seen a significant increase in DeFi activity. The DeFi market cap has risen from 17% of the Ethereum market cap to 25%, indicating an acceleration of DeFi activity relative to ETH price dynamics.
At the same time, DeFi is one of the biggest winners in the space. As shown in the chart, the DeFi market cap has increased from $35 billion to $120 billion in the past 6 months.
Additionally, the total value locked (TVL) of DeFi has grown by 60% since the beginning of the year, but contracted by about 10% in April.
Overview of the DeFi Ecosystem
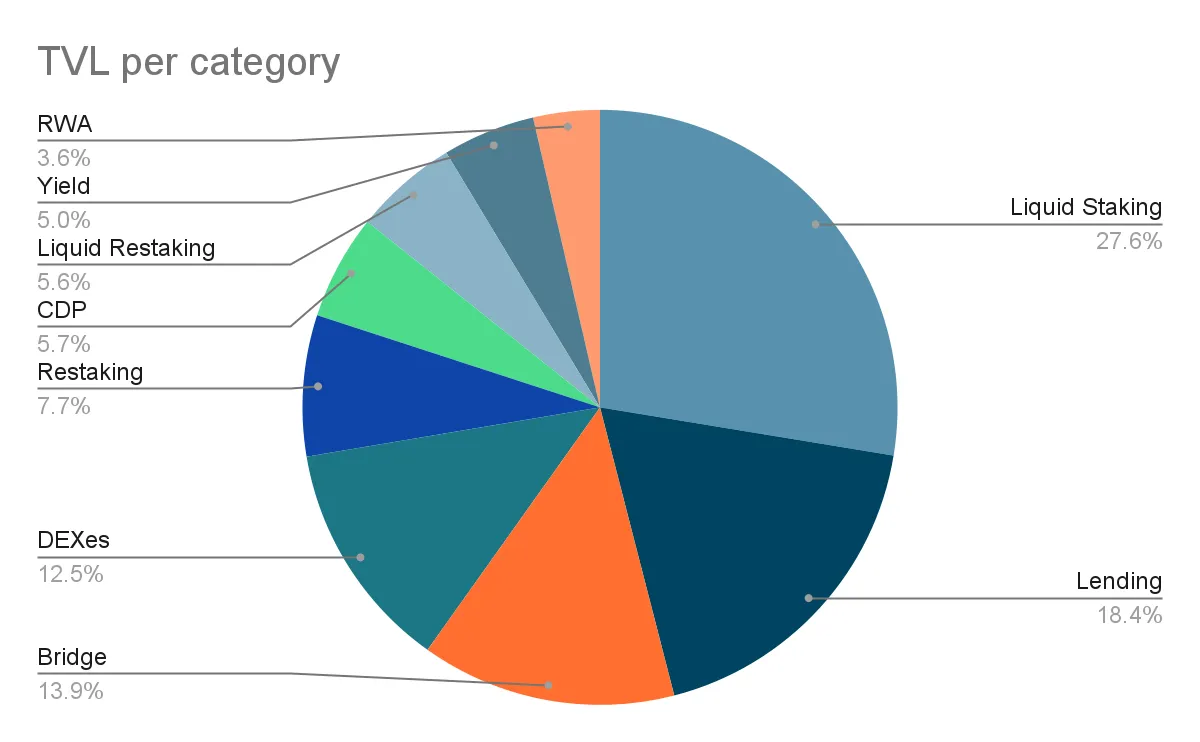
Since the beginning of 2024, liquidity staking has been the dominant use case in terms of TVL in the DeFi space. However, other use cases such as staking and yield have also seen significant inflows of funds. This is thanks to protocols like EigenLayer, EtherFi, Zircuit, Swell, Puffer, and Pendle.
免责声明:本文章仅代表作者个人观点,不代表本平台的立场和观点。本文章仅供信息分享,不构成对任何人的任何投资建议。用户与作者之间的任何争议,与本平台无关。如网页中刊载的文章或图片涉及侵权,请提供相关的权利证明和身份证明发送邮件到support@aicoin.com,本平台相关工作人员将会进行核查。


