
Author: 0xWeilan
The information, opinions, and judgments mentioned in this report regarding the market, projects, and currencies are for reference only and do not constitute any investment advice.
As the United States and Hong Kong successively approved BTC ETFs, and we cheered for the integration of DeFi and TradFI, we did not realize the profound changes in the structure of the Crypto market.
What parts of the market are changing, what parts have not changed, what new factors are affecting market trends, and which existing factors continue to play a significant role… These are what investors who attempt to explore market trends and industry cycles need to understand.
In April, policy expectations brought about new variables, causing severe turbulence in the global financial markets.
Macro Finance
For the over $1.2 trillion BTC, its strong correlation with the Nasdaq's trend, as its market value expands and participant groups change, has become widely known. This makes macroeconomic and financial data, as well as global central bank policies, often the most important factors affecting BTC price trends. In April, these data took over the trend of BTC.
The U.S. March CPI data released in April surged to 3.5%, exceeding February's 3.2%. The unexpected rebound of the CPI caused market expectations for a U.S. interest rate cut in the first half of the year to plummet. Previously, there was considerable attention on the pressure on U.S. government bond interest payments in a high-interest-rate environment. However, with the current core mission of the Federal Reserve—bringing the CPI below 2%—seemingly hopeless, no one doubts the further delay of interest rate cuts. There are even voices suggesting that there is no hope for interest rate cuts this year and that there may even be a possibility of further rate hikes—this is not impossible. If the CPI rebounds significantly, what else can the United States do besides raising interest rates?
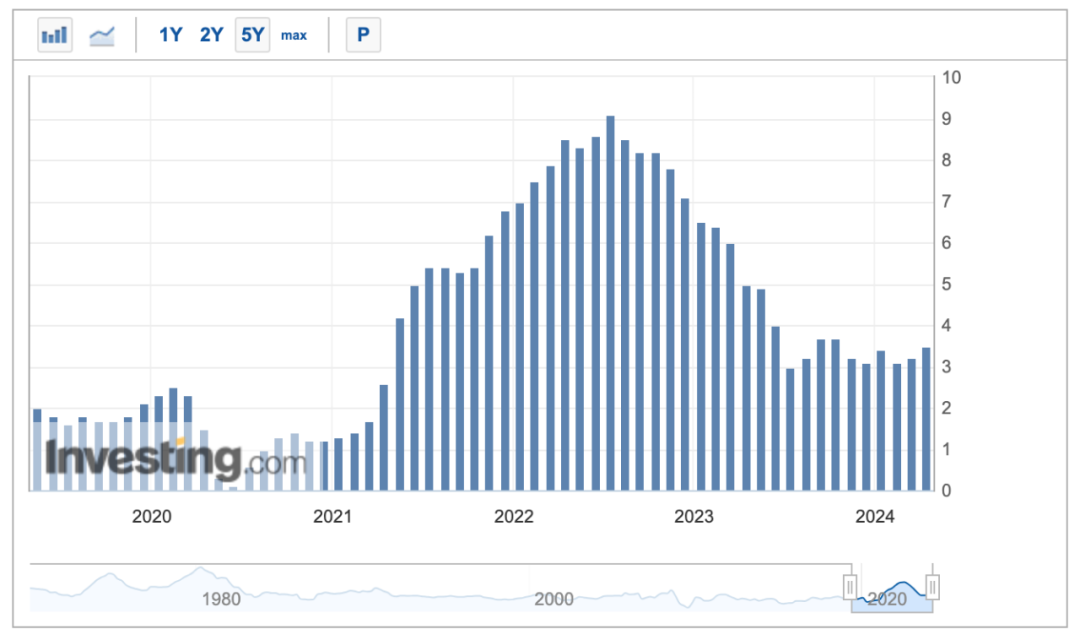
U.S. CPI index rebounded for two consecutive months
At the same time, the Federal Reserve's balance sheet reduction plan is still being firmly implemented.
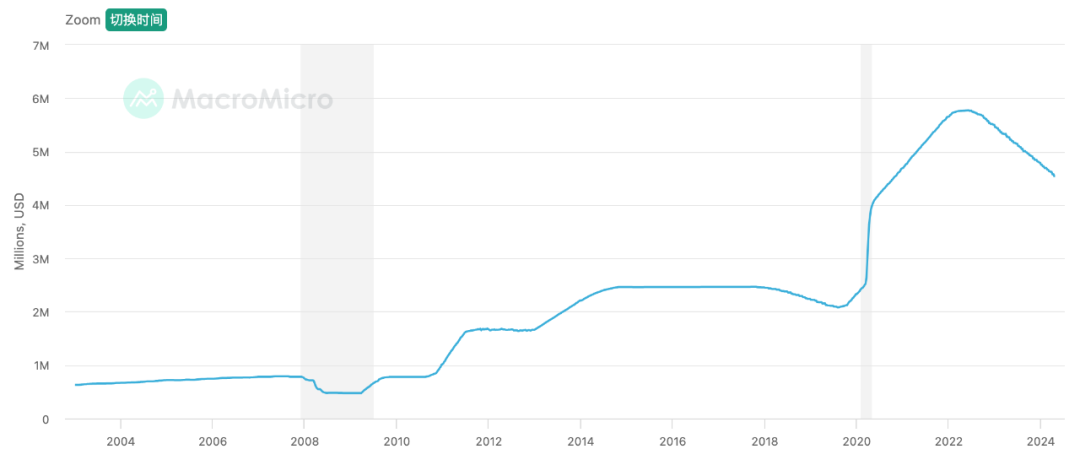
Size of U.S. Treasury holdings by the Federal Reserve
Since initiating the balance sheet reduction action in 2022, the Federal Reserve has sold over $1.2 trillion worth of U.S. Treasury bonds. This is another powerful pump in a high-interest-rate environment. This pump extracts up to $95 billion in liquidity from the market every month ($60 billion in U.S. Treasury bonds and up to $35 billion in institutional bonds).
The pessimistic expectations and changes in response strategies triggered by the above two points have driven the U.S. dollar index to continue to strengthen, leading to a 5-month decline in the Nasdaq and Dow Jones indices at the end of this month. After reaching historic highs in March, the two indices experienced declines of 4.41% and 5.00% respectively this month.
Correspondingly, BTC, which completed its halving this month, also ended its 7-month rally, with a monthly decline of $10,666.80, a 14.96% decrease. After breaking through the upward channel in March, the efforts to construct a trading range in April seem to be failing.
A storm seems to be brewing, and the tide appears to be turning.
Crypto Market
In April, BTC opened at $71,291.50 and closed at $60,622.91, a 14.96% decrease for the month, with a volatility of 19.27%. This marked the largest monthly decline since January 2023 (i.e., since the current bull market recovery period) in a shrinking trading volume.
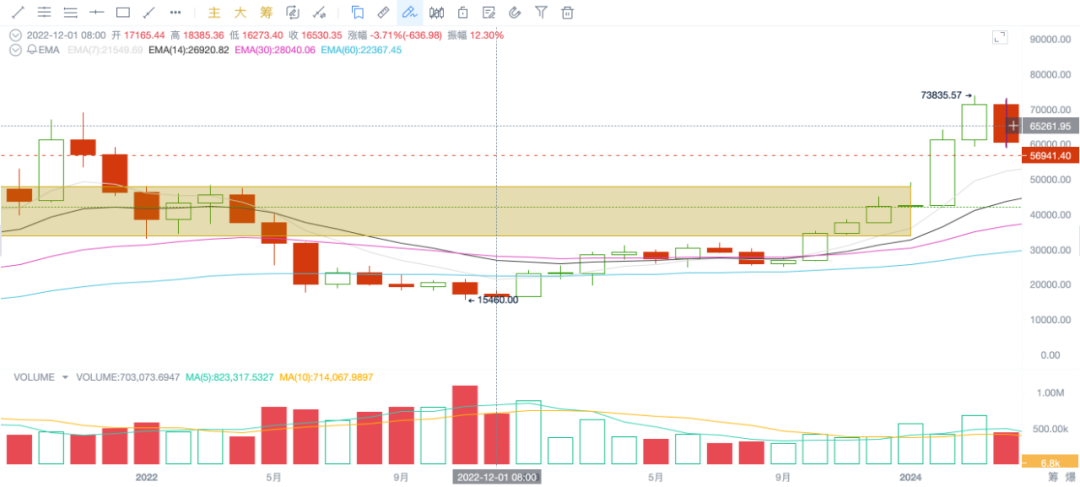
Monthly trend of BTC
After the major sell-off in March, buying pressure within the BTC market suffered a major setback and has been consistently weak. On the trading front in April, it mostly operated below the 7-day average price, hitting a low of $59,573.32 on April 19.
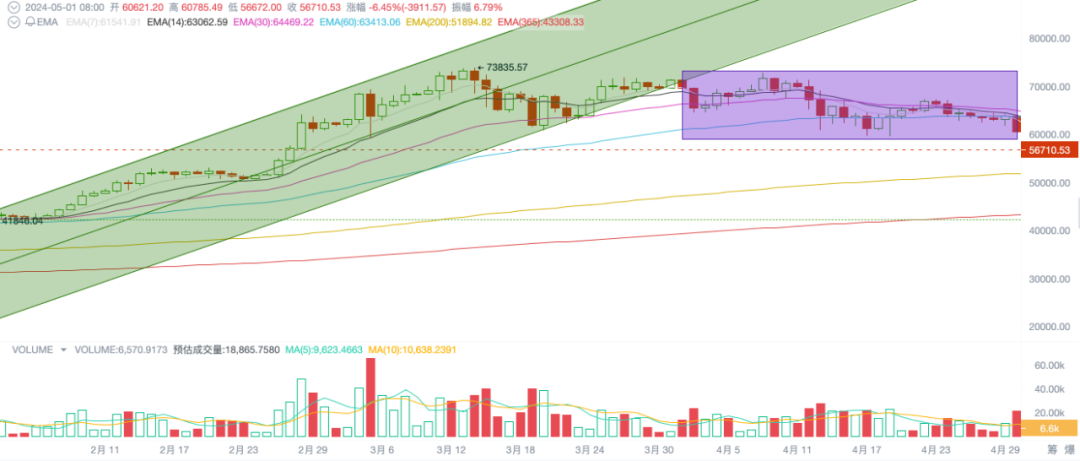
Daily trend of BTC
Since February, BTC has established a bull market price uptrend on the daily chart (green background in the above image). After reaching its all-time high price on March 13, it began testing the lower boundary of the uptrend and attempted to establish a trading range between $59,000 and $73,000 throughout April (purple background in the above image). With the shift in macro financial expectations and the breaking of U.S. stock indices, the effort to construct a trading range has become increasingly difficult.
Selling and Holding
In the March report, we mentioned that "December 3, 2023, was the highest point of long positions in history, with a total of 14,916,832 BTC held at that time. Subsequently, with the gradual start of the bull market, long positions began their cyclical major sell-off, totaling 897,543 BTC sold by March 31."
The biggest positive for BTC's narrative in January—the realization of 11 spot ETF approvals—led long positions to sell massively at historic highs, resulting in short-term saturation and a cooling of enthusiasm for new short positions.
This behavior was a response to the phase of BTC's upward movement and the reason for the halt in BTC price increases in March, leading to continued oscillation. After entering April, the trend of "long to short" within the market was temporarily suspended.
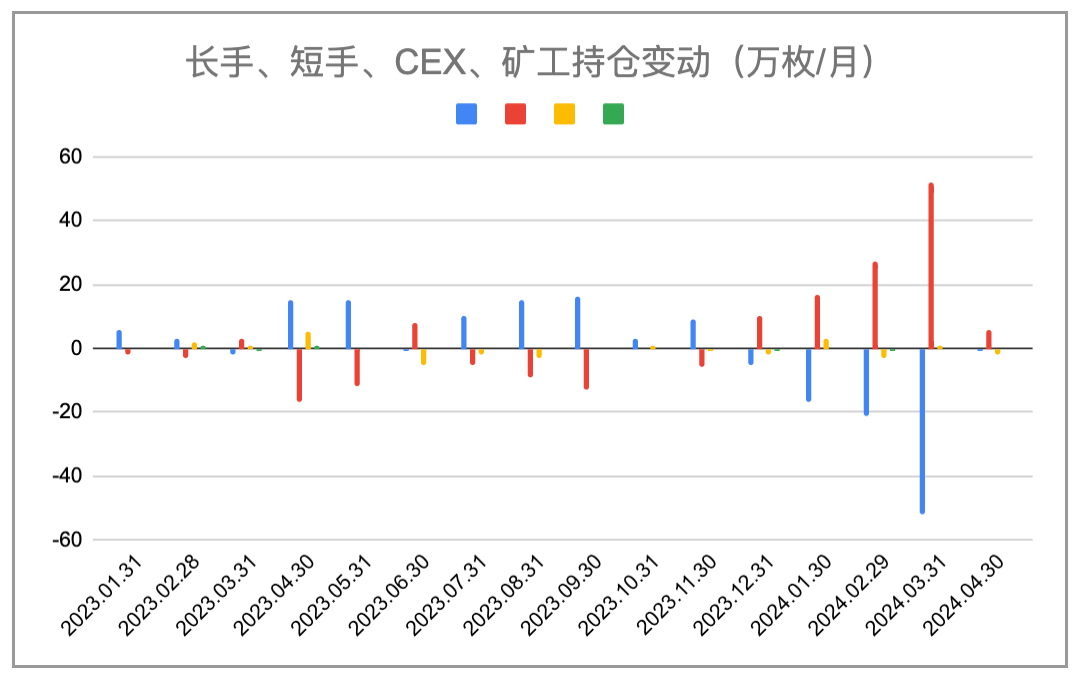
Changes in BTC positions across the market (monthly)
From the statistical data, the selling volume of long positions in April decreased to 10,000 BTC (with a high of 520,000 BTC sold in March), while short positions increased their holdings during the price decline this month. They not only absorbed the selling of long positions but also withdrew tens of thousands of BTC from centralized exchanges.
Despite the completion of the halving this month, the mining community continues to maintain a "hold" stance (unchanged overall positions, indicating that the scale of market selling is roughly equal to the output). Although the downward price trend is approaching the cost price for some miners, a major sell-off has not occurred, and miners continue to hold approximately 1.81 million BTC steadily.
From the statistical chart of the scale of holdings across the market, the temporary suspension of the trend from "long to short" is clearly visible.
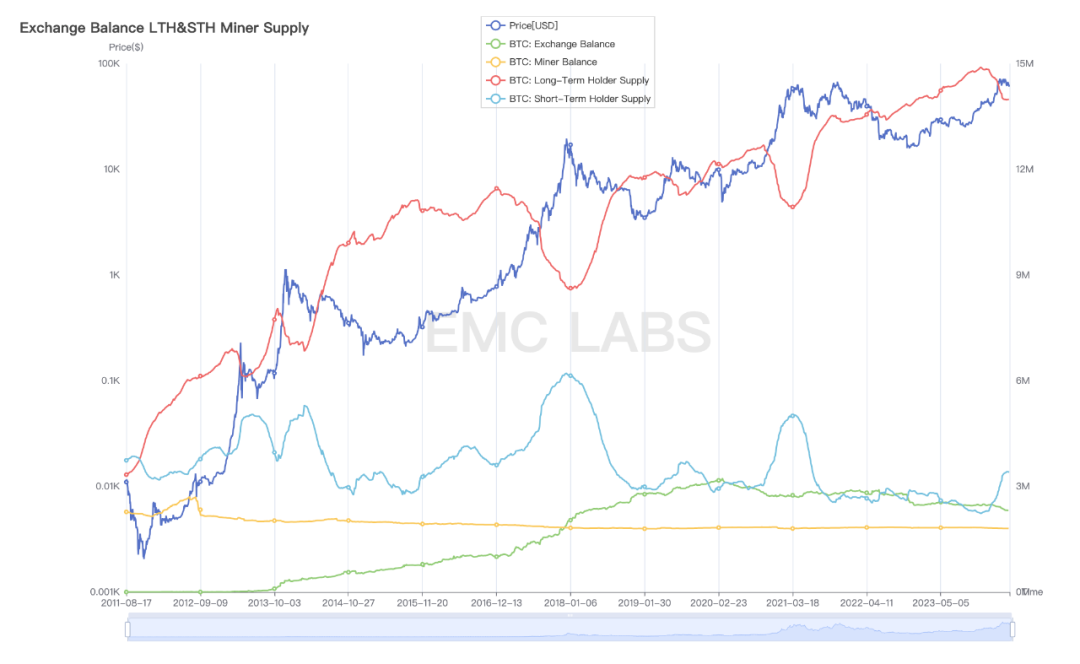
BTC holdings across the market
Looking at the data changes in the scale of holdings across the market over the past 11 years, it can be observed that the phenomenon of the temporary suspension of long position sell-offs in the middle of the bull market also occurred in mid-2016. This often indicates that the long position group, which believes in the continued bull market, chooses to hold off as prices sharply decline, and then restarts selling after the market restores supply-demand balance and resumes its upward movement.
The pessimistic expectations and changes in response strategies triggered by the above two points have driven the U.S. dollar index to continue to strengthen, leading to a 5-month decline in the Nasdaq and Dow Jones indices at the end of this month. After reaching historic highs in March, the two indices experienced declines of 4.41% and 5.00% respectively this month.
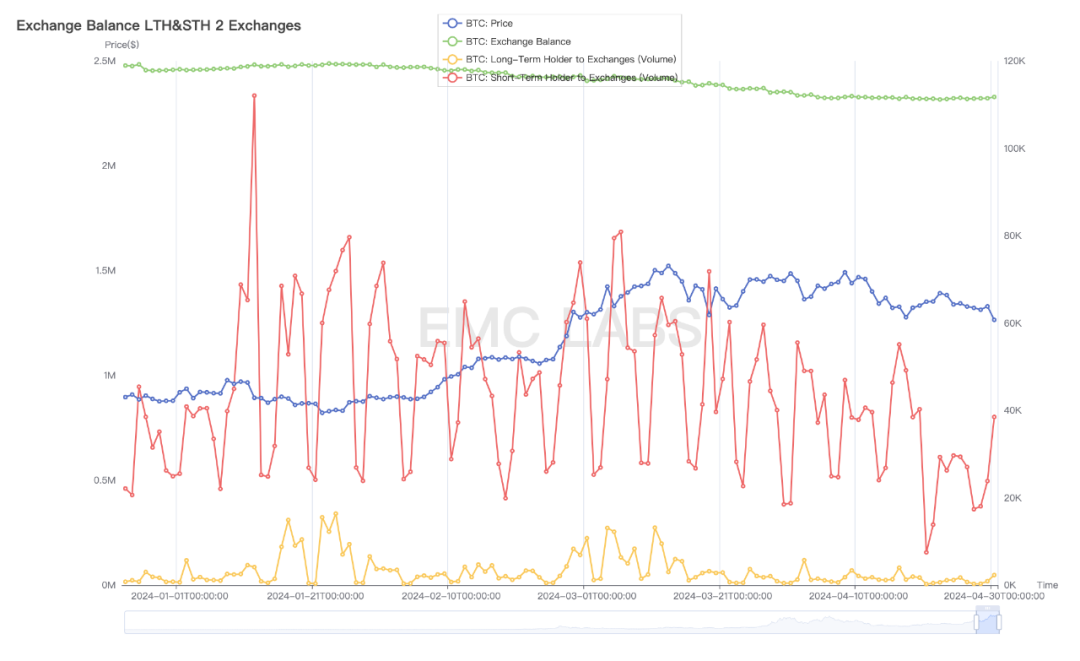
Scale of long and short position sell-offs and CEX accumulation statistics (daily)
Looking at the data of BTC transferred from long to short positions on exchanges, the scale of transfers in April has been continuously decreasing compared to March, with little change in the stockpile of centralized exchanges and a small outflow.
Capital Flow
Capital is an important factor determining market trends. After observing the internal market structure, we continue to examine the inflow and outflow of capital.
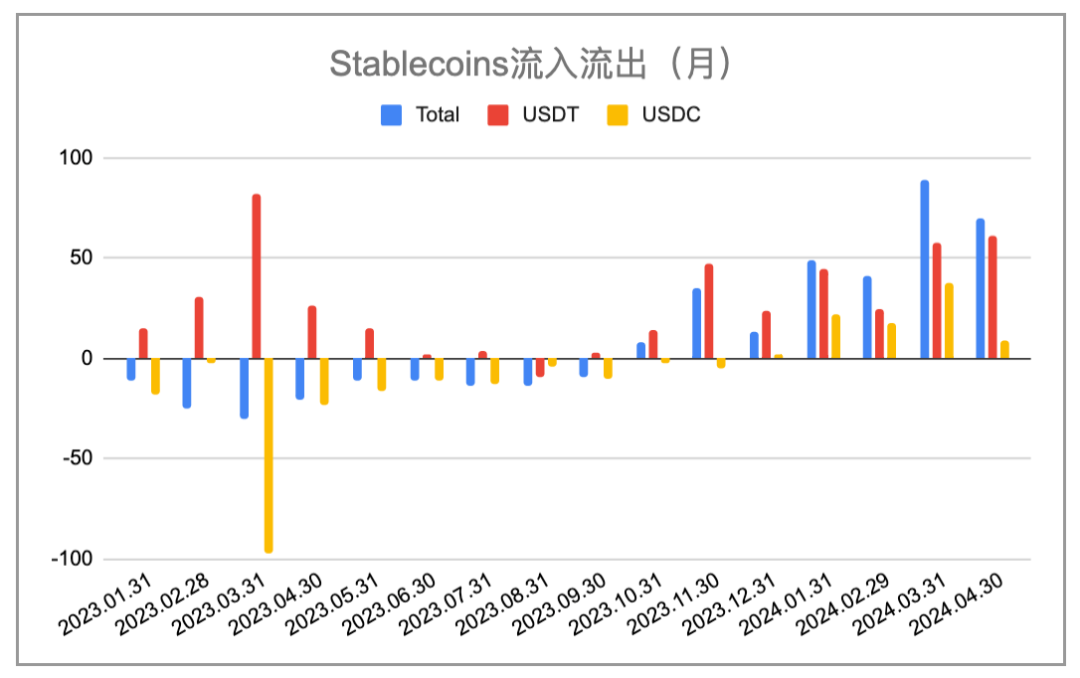
Changes in the supply of major stablecoins (EMC Labs chart)
Insights into the issuance data of stablecoins by EMC Labs revealed that in April, funds entering the market through stablecoins amounted to as high as $7 billion, with USDT accounting for $6.1 billion and USDC $900 million. According to eMerge Engine, BTC entered a recovery phase of the current cycle in 2023, and net inflows were first achieved in October. Since then, stablecoins have been in a state of continuous issuance, with a $7 billion inflow in April, ranking second in terms of inflow volume.
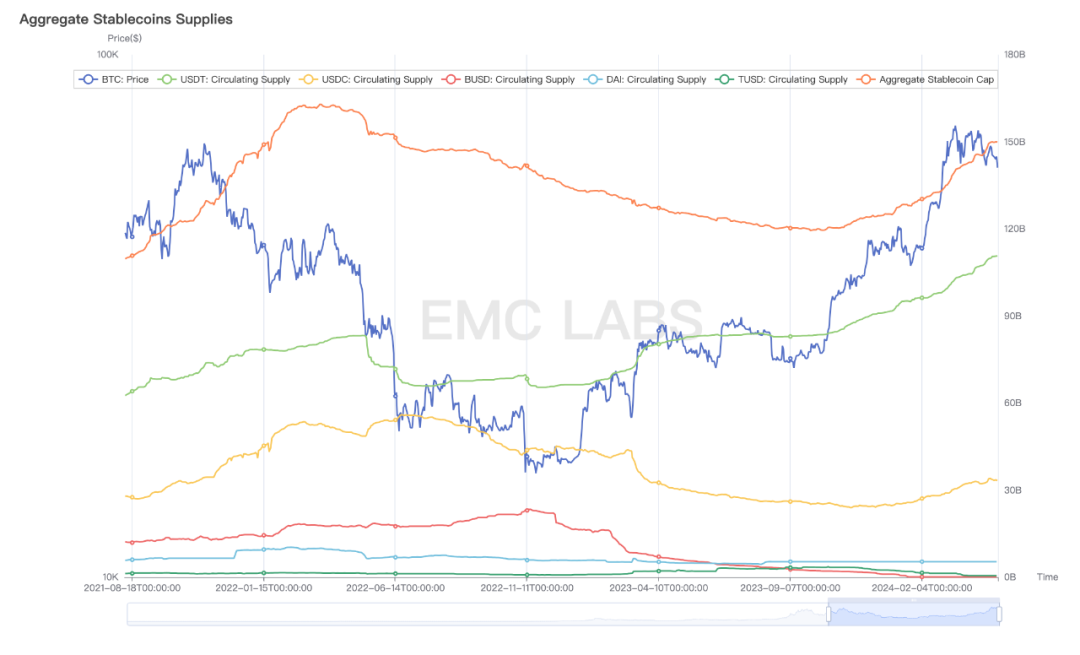
Scale of issuance of major stablecoins
As of April 30, the total issuance of stablecoins has increased to around $149.9 billion, an increase of approximately $30 billion since the low point, but still not reaching the peak of the previous cycle.
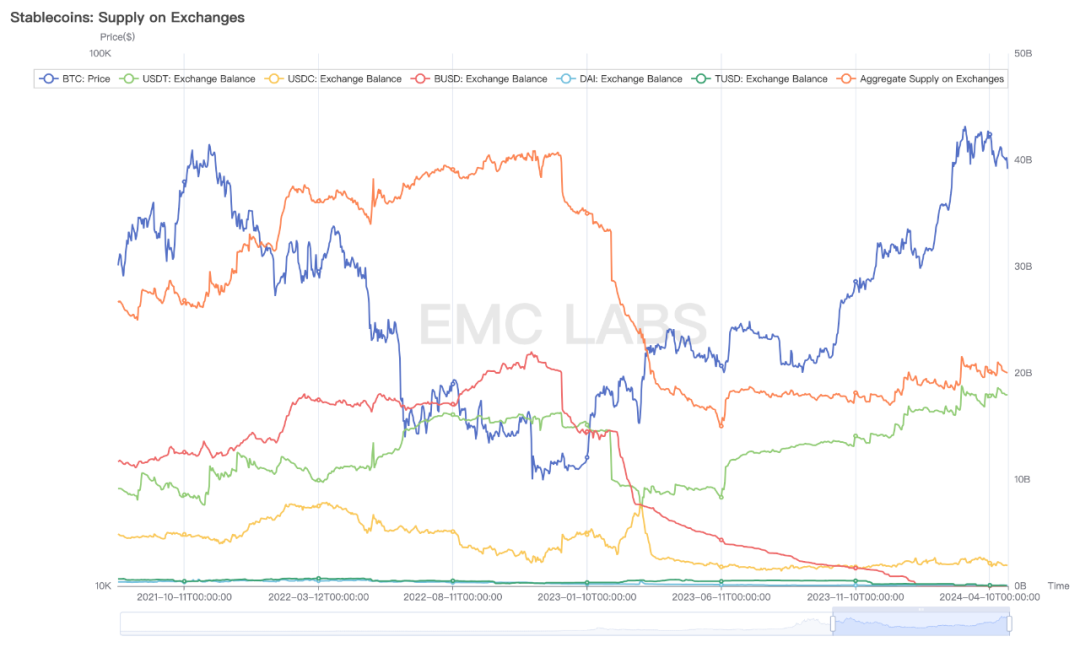
Furthermore, an examination of the stockpile of stablecoins on centralized exchanges has also remained at a high level. However, these funds do not seem eager to convert into purchasing power. It is worth noting that the main body of newly accumulated stablecoins on centralized exchanges is USDT, while the use of USDC in the U.S. has seen almost no new accumulation.
On the BTC ETF channel, the flow of funds exhibits a clear trend of chasing highs and selling lows. Since the mid-March price stopped rising, there has been a continuous outflow.
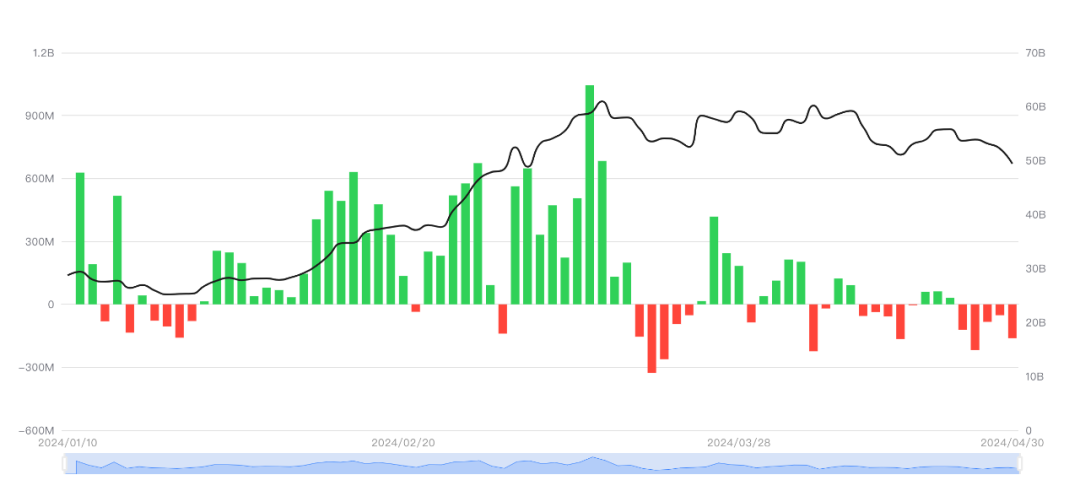
Inflow and outflow statistics of 11 BTC ETFs (SosoValue chart)
Based on its fund characteristics and volume, we believe that the funds in the BTC ETF channel are currently neither the main cause of the BTC price decline nor capable of independently reversing the situation.
Supply Pressure and Cycle
All things flourish and decline, and cycles continue.
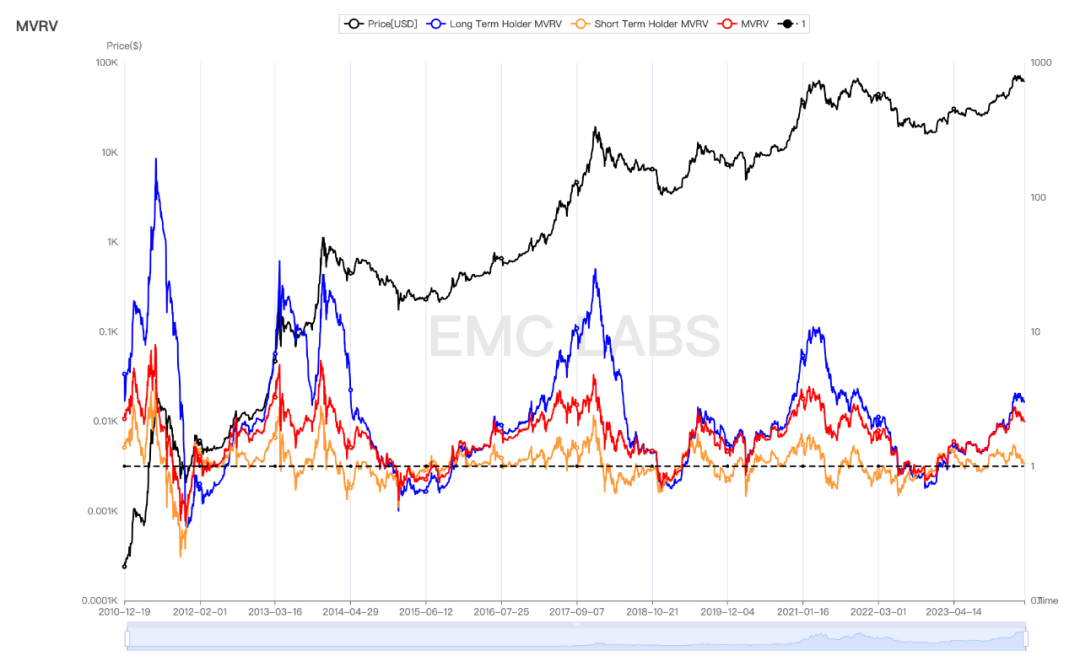
Long and short positions and the overall market's unrealized profit and loss ratio
During a bull market, there will always be accompanied by significant adjustments. These adjustments objectively serve to clear out speculative positions.
One indicator worth paying attention to is the short-term MVRV (unrealized profit and loss ratio). During the recovery and upward phases, as the price rises, holders' unrealized profits increase. At this time, the market needs to use a decline to clear out the chips of short-term holders who have recently entered and the chips of long-term holders who have made significant profits. Historically, this kind of clearing often requires the price to drop to a point where the MVRV of the short-term holder group is close to 1 to stop. Since last year, this kind of clearing has occurred twice, in June and in August to October. In January, it dropped to a low of 1.03, and as of April 30, this round of clearing has reached 1.02 (on May 1, MVRV dropped to 0.98). It is worth noting that historically, after BTC prices undergo this severe test, they often experience a significant increase.
Another frightening speculation is that this cycle is ahead of schedule, having reached a new high before the halving, and the peak of the bull market has already passed. One piece of evidence for this is the VDD destruction indicator.
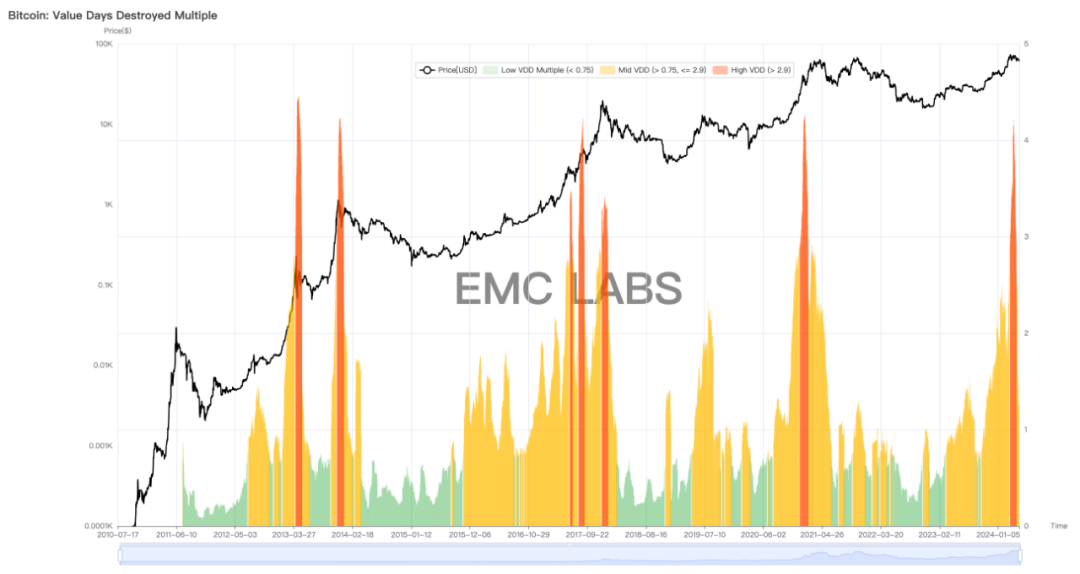
BTC VDD destruction data
The VDD destruction indicator not only considers the realization of value but also takes into account the holding factors of long and short positions within the realized value, making it of great reference value.
The speculation of reaching the peak is more similar to the previous bull market (2021). Based on this data, another speculation is that the bull market has passed the halfway point, and once or twice (similar to 2013 or 2017) there is a large-scale VDD destruction, the bull market will come to an end.
One major interference factor in this round of VDD data is the redemption of Grayscale Trust holdings after conversion to GBTC. This interference data can also affect the judgment of the scale of long position sell-offs.
Conclusion
Combining fundamental, capital, policy, market cycle, and industry cycle judgments, EMC Labs believes that the decline of BTC in April, after a large sell-off by some investors in July, has left both buyers and sellers in a weak balance. New entrants are choosing to cautiously observe, and the results are driven by traders who trade based on macro financial data and technical indicators, resulting in an adjustment magnitude comparable to the pullback scale of previous bull markets.
From the inflow volume of stablecoins (the second highest since last year), it is evident that the market's bullish sentiment has not extinguished. The current adjustment is due to macro financial and economic data exceeding expectations, leading to a wait-and-see approach by incoming funds. Therefore, macro financial data, especially the Fed's stance on interest rate cuts and changes in core economic data such as non-farm employment rates, will dominate the market's attitude towards funds in the near future, thereby determining the price trend of BTC.
Currently, Bitcoin's on-chain activity has significantly declined to near bear market levels, with user activity shifting to Solana and Ethereum, keeping the user data of these two networks in a rising phase. What is worrying is that the market now expects interest rate cuts to be postponed until after September. Therefore, over the next four months, what information will determine the trading decisions of funds and short positions in the market? The current balance is very fragile, and the decisions of both parties will either disrupt the balance and drive the market into a sharp upward or downward movement.
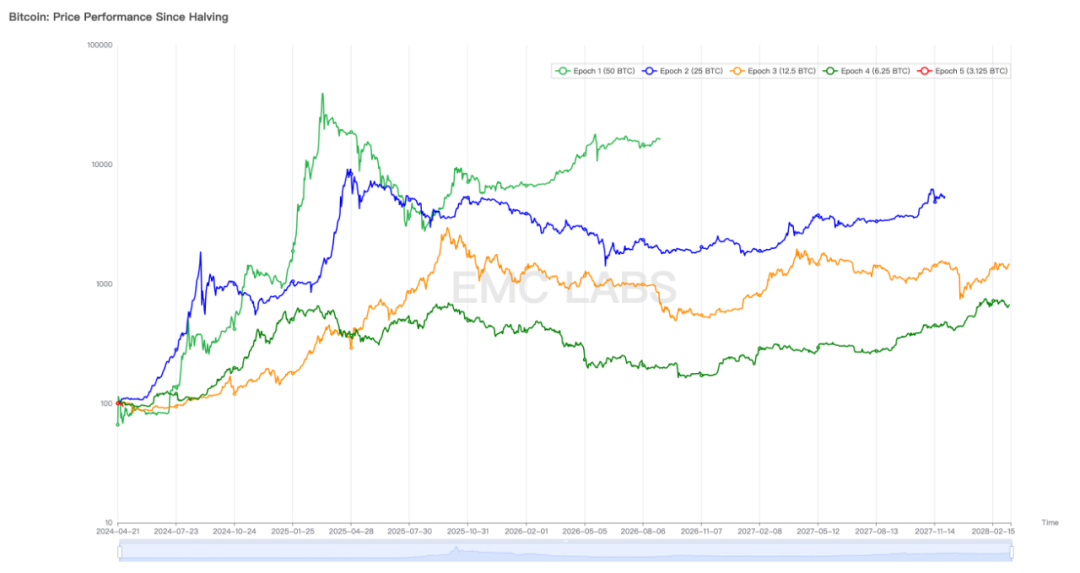
Price trend of BTC after each halving
If it goes up, it will most likely initiate the second phase of the bull market and welcome the Altcoin Season.
If it goes down, holders' confidence will collapse, leading to a chain reaction, and the already halved Altcoins may once again break through their previous lows.
This is a highly unlikely but worst-case scenario.
免责声明:本文章仅代表作者个人观点,不代表本平台的立场和观点。本文章仅供信息分享,不构成对任何人的任何投资建议。用户与作者之间的任何争议,与本平台无关。如网页中刊载的文章或图片涉及侵权,请提供相关的权利证明和身份证明发送邮件到support@aicoin.com,本平台相关工作人员将会进行核查。


