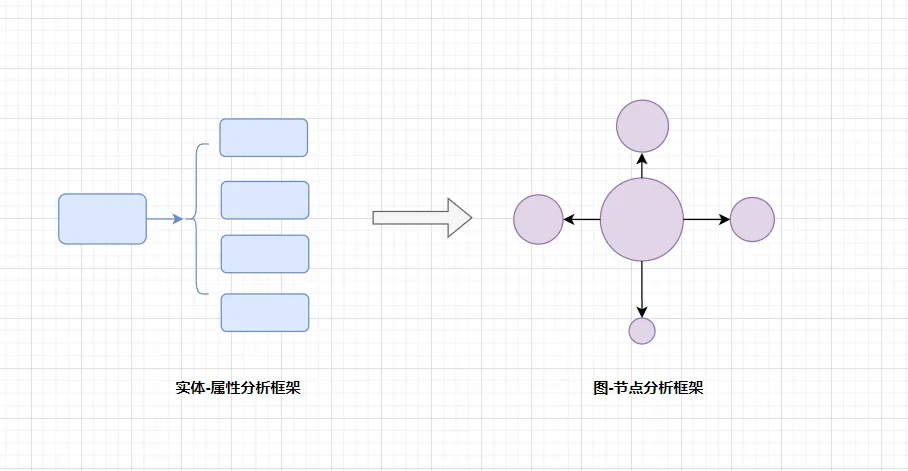
1. From Metaphysical Analysis of Entity-Attribute to Graph Theory Analysis of Node-Edge
After undergoing extensive and long-term metaphysical (here referring to the conceptualization of knowledge taught in schools) training in the modern school system, we have developed a serious dependence on the analysis framework of entity-attribute, treating entity-attribute as the essence of things, and forgetting that entity-attribute ≠ the thing itself.
Taking the project rating reports popular in the currency circle in 2018 and 2019 as an example, those reports generally adopted the entity-attribute analysis framework:
→ Entity: Project A
→ Attributes: Project positioning, market space, vision, technology stack, product architecture, team, roadmap
This analysis framework is the easiest to be disseminated and understood by ordinary investors, but the conclusions drawn from using this framework were almost completely refuted in the last bull market.
This is because the entity-attribute abstracts a specific project as an isolated existence, ignoring the fact that the value of a single project comes from its connection to the entire web3 network.
Therefore, this year I started learning to use the node-edge analysis framework of graph theory to analyze the value of web3 projects. This gave me a sense of enlightenment, and many confusions were resolved.
For example, why did EOS, with its leading technology/product, underperform the market in the last bull market?
Under the original entity-attribute analysis framework, EOS scored much higher than Solana/Avalanche/Polygon.
But under the node-edge analysis framework, EOS, due to its lack of connection to the Ethereum ecosystem and lack of connection to US capital, is an isolated node, and its score is much lower than Solana/Avalanche/Polygon.
The performance in the last bull market precisely validated the correctness of the node-edge analysis framework.
Node-edge (graph theory) analysis is a serious mathematical discipline. I won't go into detail here, and interested students can learn on YouTube or Bilibili.
Here, I will only demonstrate the centrality analysis in the node-edge analysis framework, applied to evaluating the value of web3 projects.
Centrality analysis is a method used to measure the importance of nodes in a network. It attempts to determine which nodes are more central in the network, playing crucial roles in information dissemination, influence propagation, connectivity, and so on. Here are several common centrality indicators:
Degree Centrality
Degree centrality refers to the number of connections a node has, i.e., the number of its edges. The higher the degree centrality of a node, the more connections it has with other nodes.
When evaluating a web3 project, the more it is connected to other web3 projects, the higher its degree centrality.
Currently in the crypto world, the projects with the highest degree centrality are Bitcoin, followed by Ethereum, then Binance, Coinbase, OKX, and other CEX, and then stablecoin issuers like USDT.
Closeness Centrality
Closeness centrality measures the average distance from a node to other nodes. Nodes with a lower average distance are closer to the center of the network because they can propagate information to other nodes more quickly.
When evaluating a web3 project, the shorter the average distance to other web3 projects, the higher its closeness centrality.
Currently in the crypto world, the projects with the highest closeness centrality are Ethereum, followed by Binance, Coinbase, OKX, then LayerZero, Orbiter, and other cross-chain bridges.
Betweenness Centrality
Betweenness centrality measures the frequency with which a node acts as an intermediary in all shortest paths.
Currently in the crypto world, the projects with the highest betweenness centrality are LayerZero, Orbiter, and other cross-chain bridges.
Eigenvector Centrality
Eigenvector centrality considers the centrality of a node and the nodes it is connected to, i.e., the sum of the centralities of the nodes connected to it.
Currently in the crypto world, the projects with the highest eigenvector centrality are Arbitrum, Optimistim, Starknet, Zksync, Scroll, Taiko, and other L2 projects.
Through the above centrality analysis, we can easily evaluate the position and importance of a web3 project in the entire web3 value network.
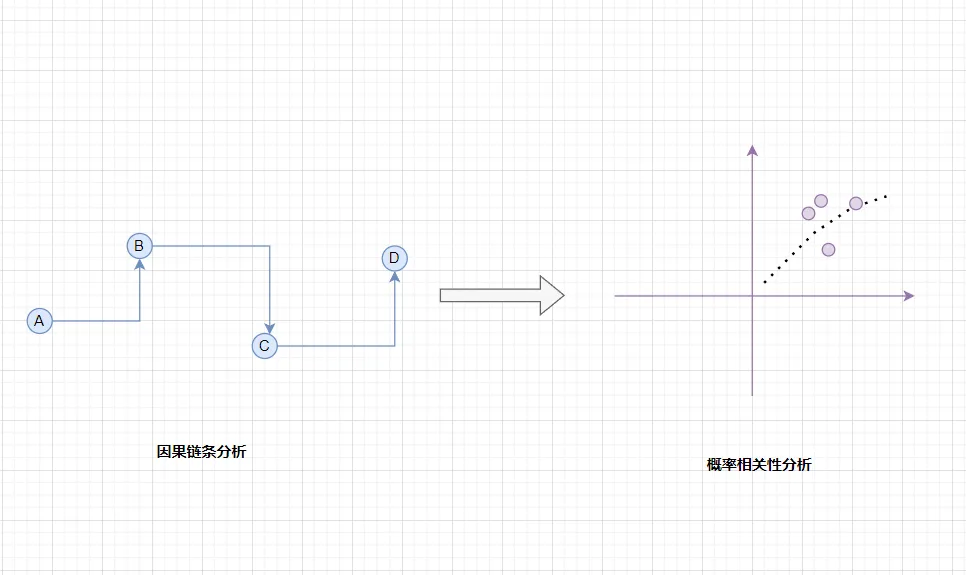
2. From Causal Chain Analysis to Probability Correlation Analysis
If the metaphysical analysis framework of entity-attribute is the ideological imprint placed in our minds by modern school education, then the causal chain analysis framework of A-B-C-D is rooted in the physiological structure and functioning of our brains.
Simply put, the physiological structure and functioning of our brains are very similar to the architecture and functioning of AI, so AI is also known as artificial neural networks.
Algorithms, computing power, and data are the three elements of AI learning, as well as the three elements of our brain learning.
The difference is that the computing power of AI is N times that of our brains. In order to ensure the usability of learning, the brain constantly seeks energy-saving and efficient algorithms in interaction with the environment, and causal chain analysis is one of them.
Causal chain analysis is already quite useful in daily life and can help individuals handle various affairs in life and work very well.
However, being obsessed with causal chain analysis in financial market trading can lead to major problems.
After every market surge or plunge, the media/traders habitually attribute it to one or more reasons. For example, the recent plunge in the A-share market is attributed to the outflow of northbound funds, and the recent plunge in the cryptocurrency market is attributed to Elon Musk's SpaceX company liquidating Bitcoin.
Then, they go to great lengths to find the causal relationship between a certain event and market trends, attempting to grasp the causality to arbitrage, which is a behavior of seeking fish in a tree in terms of trading mindset.
When trading in the financial market, we as individuals are facing the uncertainty of the real world, and we should use the method of probability correlation analysis to understand it.
Financial time series methods are also a serious discipline, and interested students can learn on YouTube or Bilibili.
The entry-level financial time series methods include AR and MR, which I have detailed in previous posts, so I won't elaborate on them here.
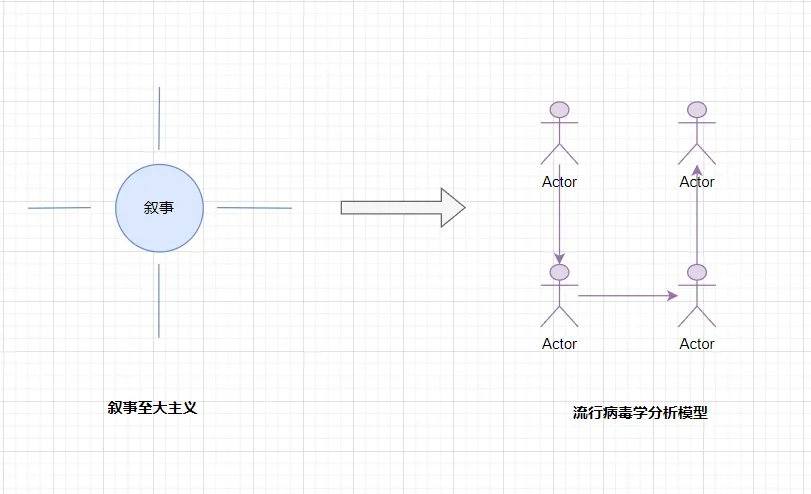
3. From Narrative to Ideology Analysis to Epidemiological Analysis
The cryptocurrency industry is deeply influenced by the two best-selling books "Animal Spirits" and "Narrative Economics," and generally believes in narrative to ideology, and I am one of them.
Every time I see narratives such as decentralization, web3, paradigm revolution, new lingua franca, layering, fairness, etc., in whitepapers, I can't help but feel excited in my mind, with a sense of honor and sacredness of participating in a great historical process, and then begin to equate the narrative of the project with its value.
Web3 projects from India are very good at using this point, such as Polygon's "Internet Value Layer" narrative, and ZkSync's "ZK Great Charter" narrative. They are very good at manipulating the collective unconsciousness of the cryptocurrency industry to initiate a valuation growth flywheel.
The drawback of narrative to ideology in the cryptocurrency industry is that it views things statically and in isolation, and advocates for an irrational and poetic power.
Believing in narrative to ideology can easily be exploited by some large but impractical projects, such as modular public chains, ZK shared security, and so on.
So we need to complement it with epidemiological analysis, and in fact, the book "Narrative Economics" also spends a lot of space analyzing how narratives drive the economy using epidemiological analysis.
Epidemiological analysis is also a serious discipline, and interested students can learn on YouTube or Bilibili.
For analyzing the cryptocurrency industry, we only need to understand the SIR model.
The SIR model is an epidemiological model used to describe the spread of infectious diseases in a population. This model divides the population into three main categories: susceptible, infectious, and recovered.
These categories represent different states in the population, and over time, individuals may transition from susceptible to infectious, and then to recovered.
The following is an explanation of the three main categories in the SIR model:
- Susceptible: Individuals in the population who have not yet been infected with the disease. They have the potential risk of being infected after contact with an infectious individual.
- Infectious: Individuals who have already been infected with the disease and can spread the disease to susceptible individuals. Infectious individuals may spread the disease for a period of time and then transition to the recovered state.
- Recovered: Individuals who have recovered and are no longer capable of spreading the disease. Once individuals recover, they usually gain immunity to the disease, depending on the nature of the specific disease.
The basic differential equations of the SIR model describe the changing trends between susceptible, infectious, and recovered individuals.
When using the SIR model to analyze cryptocurrency investments, we only need to replace susceptible, infectious, and recovered with potential investors, invested investors, and exiting investors, respectively.
免责声明:本文章仅代表作者个人观点,不代表本平台的立场和观点。本文章仅供信息分享,不构成对任何人的任何投资建议。用户与作者之间的任何争议,与本平台无关。如网页中刊载的文章或图片涉及侵权,请提供相关的权利证明和身份证明发送邮件到support@aicoin.com,本平台相关工作人员将会进行核查。


