Author: Lars, Director of Research at The Block
Translation: Jordan, PANews
In March, the cryptocurrency market continued to show growth, with the vast majority of industry indicators hitting historic highs. This article will use 12 charts to analyze the cryptocurrency market over the past month.
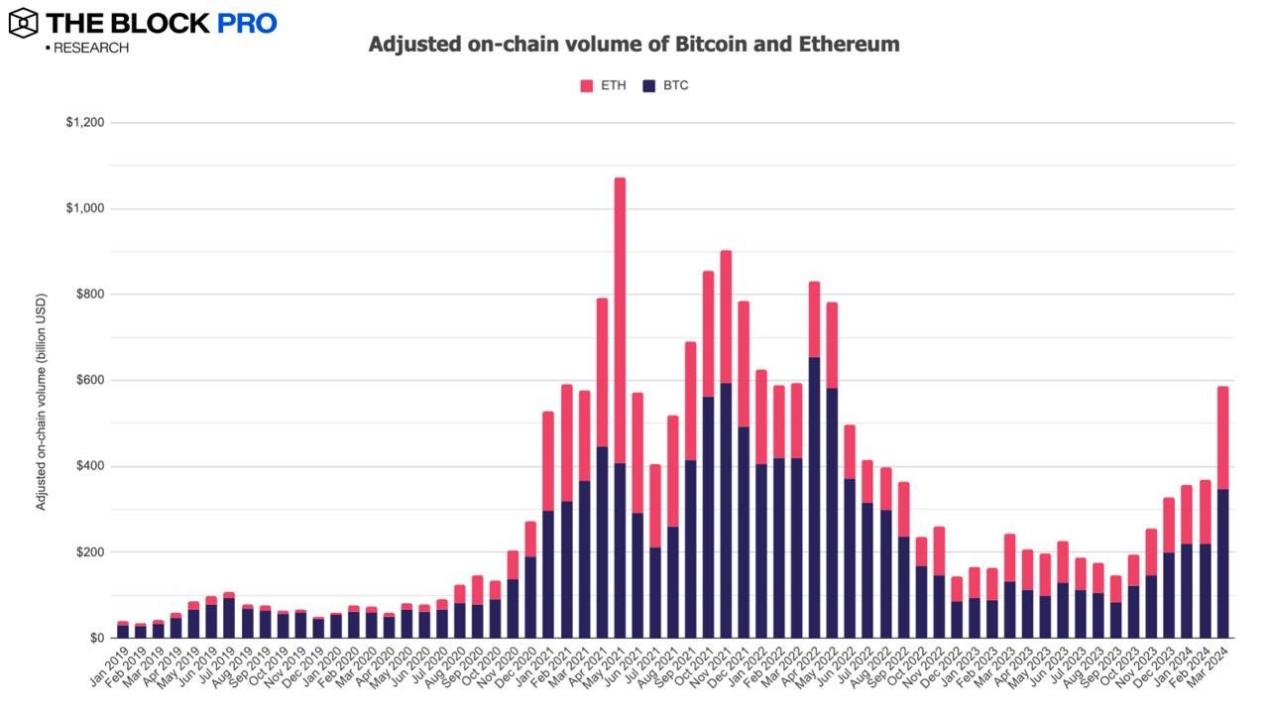
- In March, the overall on-chain transaction volume of Bitcoin and Ethereum increased by 59.3% to reach $587 billion after adjustments. The on-chain transaction volume of Bitcoin increased by 59.5% after adjustments, while Ethereum's on-chain transaction volume saw a 59.1% increase.
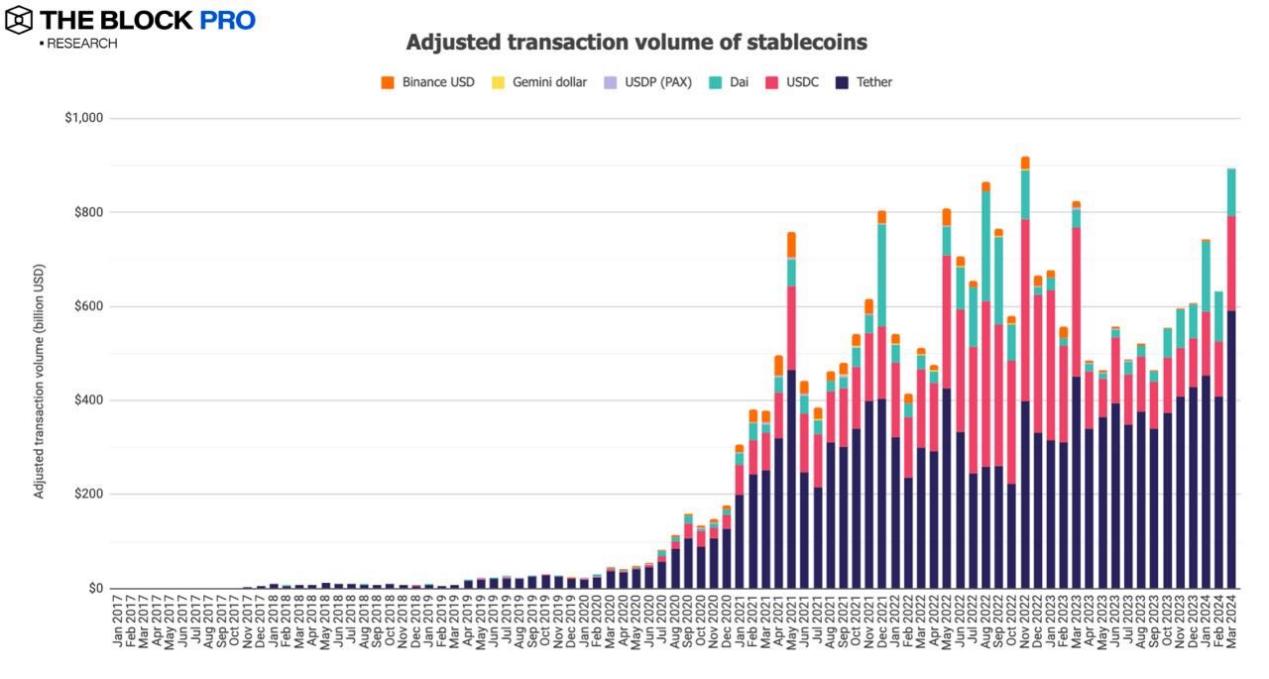
- The adjusted on-chain transaction volume of stablecoins in March saw a significant increase, reaching $893.8 billion, a 41.3% increase. The supply of issued stablecoins also increased by 6.2% to reach $137.4 billion. Among them, the market share of the US dollar stablecoin USDT accounted for 76.3%, while USDC's market share slightly increased to 19.7%.
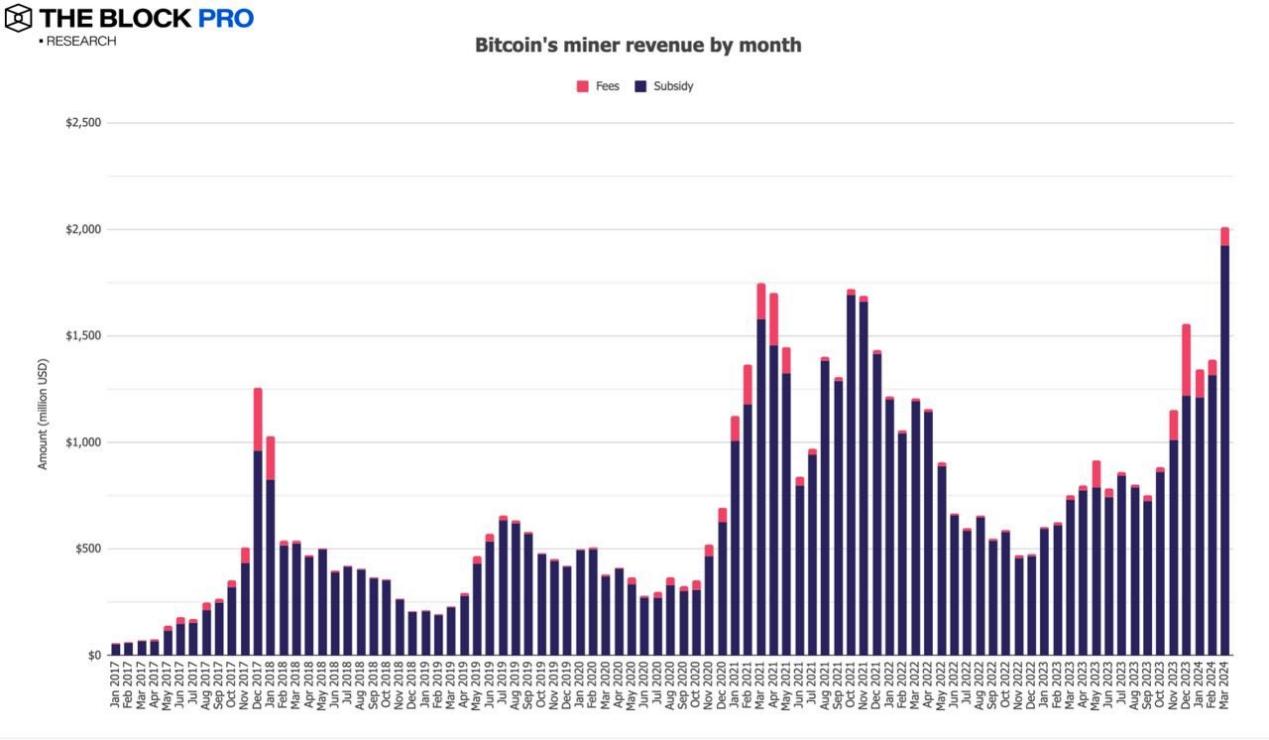
- Bitcoin miner revenue in March increased to $20.1 billion, reaching a historic high with a growth rate of 44.9%. In addition, Ethereum staking income saw a significant increase of approximately 44.5%, reaching $3.093 billion.
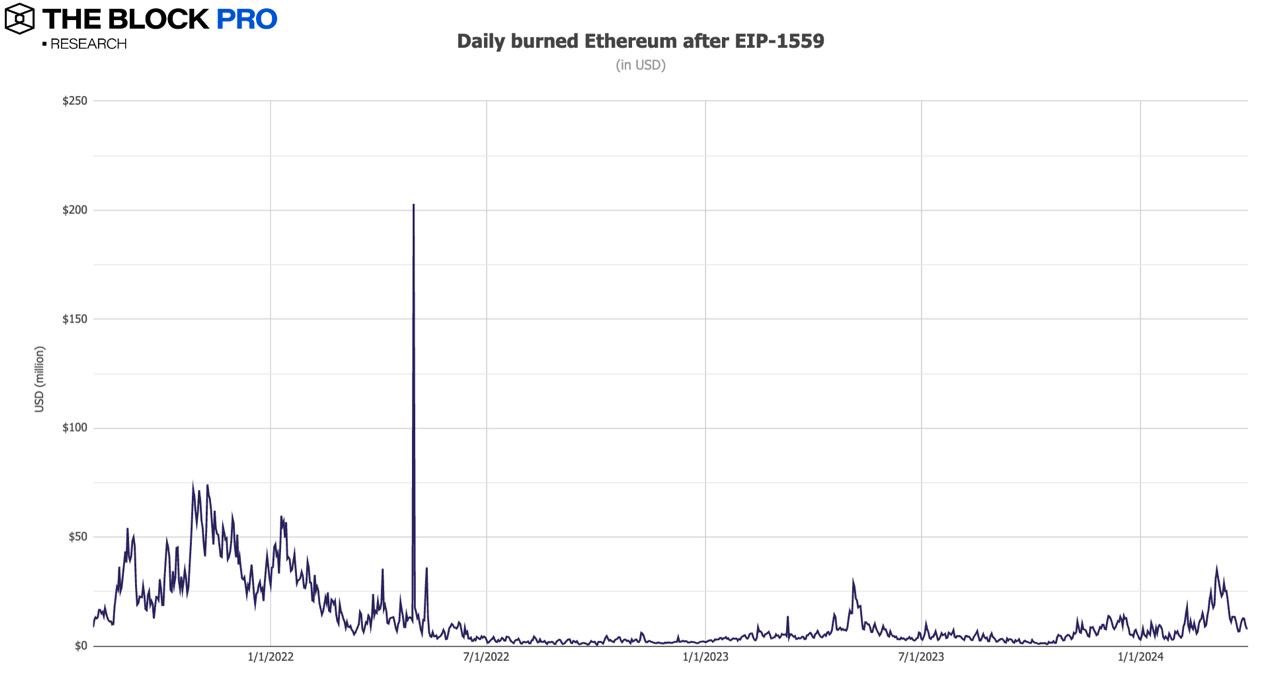
- In March, the Ethereum network burned a total of 147,620 ETH, equivalent to $5.43 billion. Data shows that since the implementation of EIP-1559 in early August 2021, Ethereum has burned approximately 4.23 million ETH, valued at around $11.84 billion.
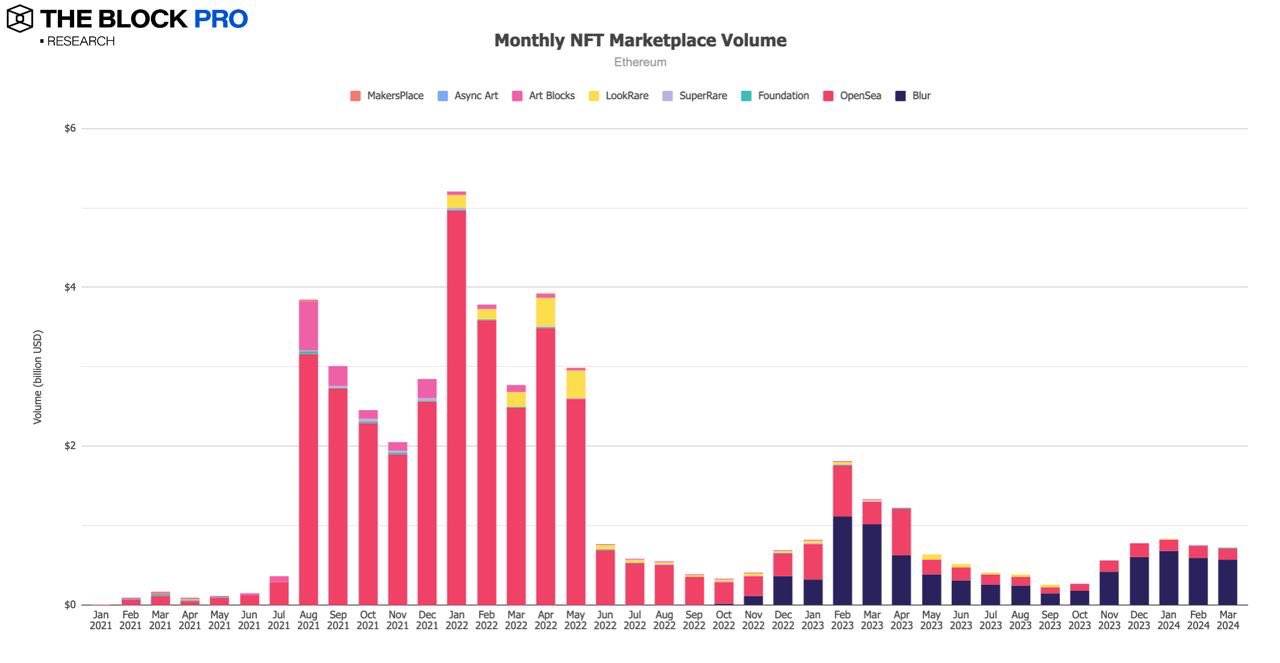
- The on-chain NFT market transaction volume on the Ethereum network in March decreased by 3.6% to approximately $726 million.
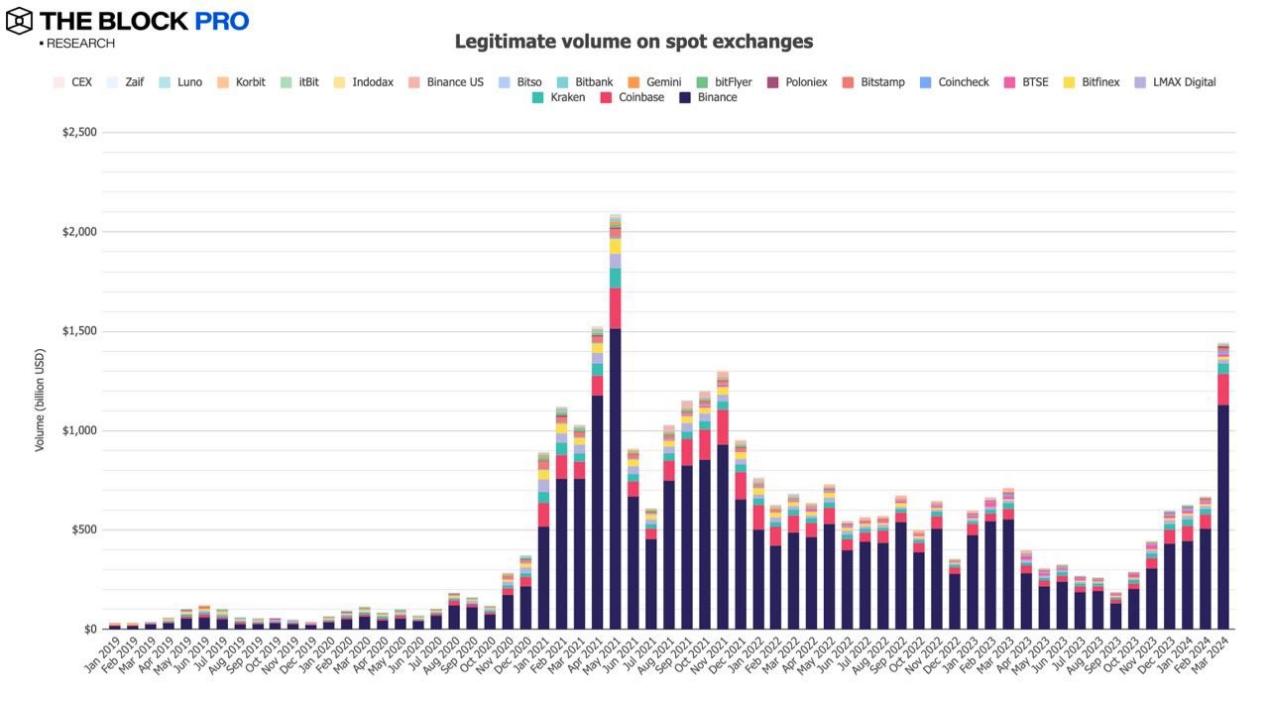
- The spot trading volume of compliant centralized exchanges (CEX) continued to show an upward trend in March, increasing by a staggering 115.8% to reach $14.4 trillion.
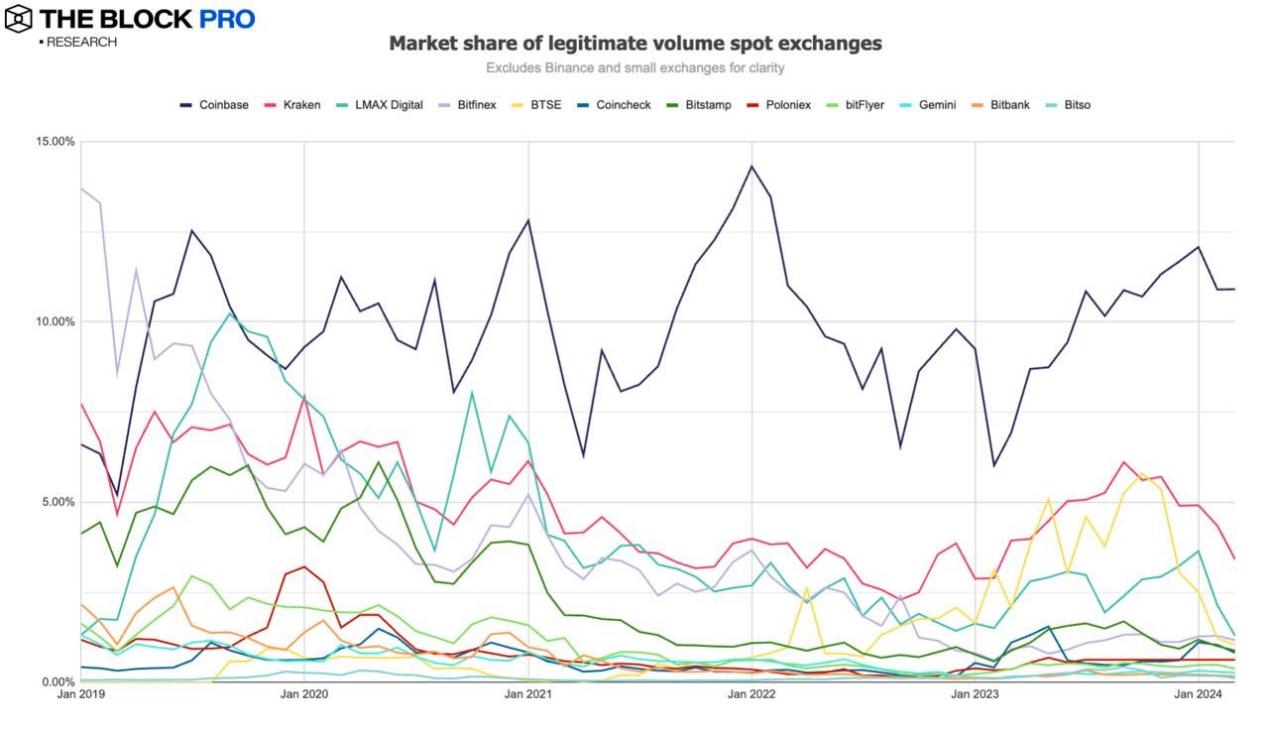
- The market share rankings of major cryptocurrency exchanges in the spot market in March are as follows: Binance at 78.5% (an increase from January and February), Coinbase at 10.9%, Kraken at 3.4%, and LMAX Digital at 1.3%.
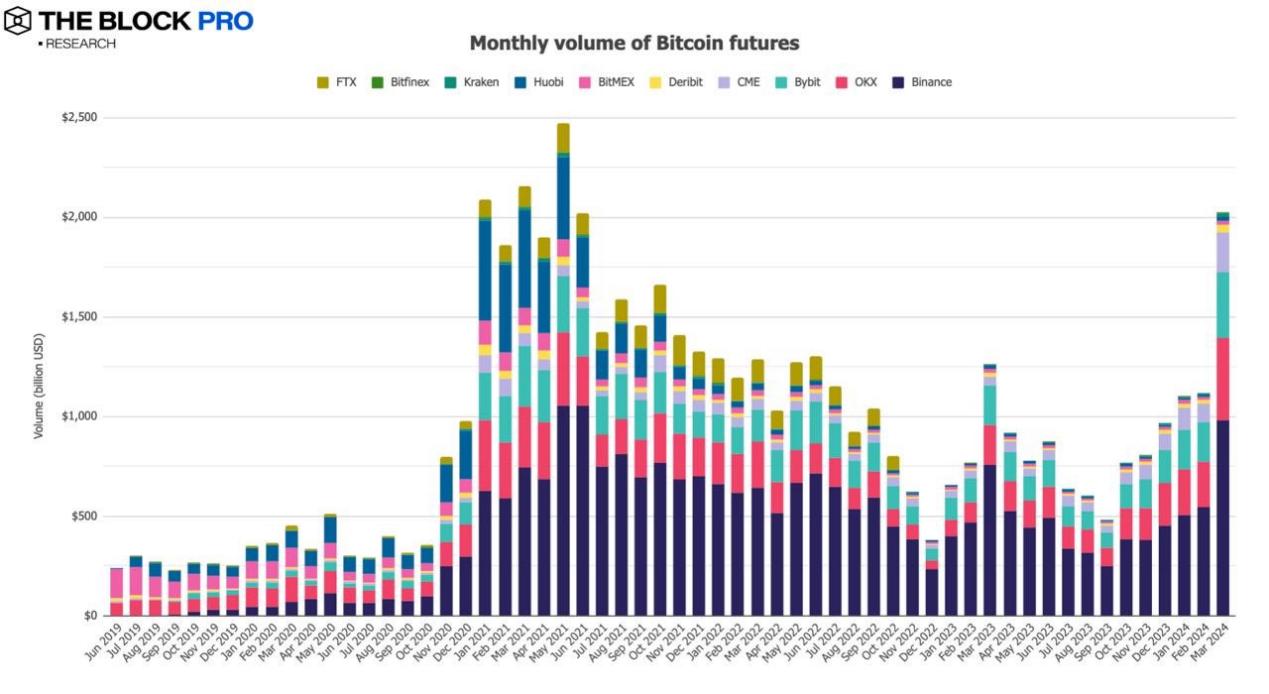
- In terms of cryptocurrency futures, the open interest for Bitcoin futures increased by 33.2% in March, while Ethereum futures open interest rose by 18.6%. In terms of futures trading volume, Bitcoin futures trading volume increased by 80.8% in March, reaching $20.2 trillion.
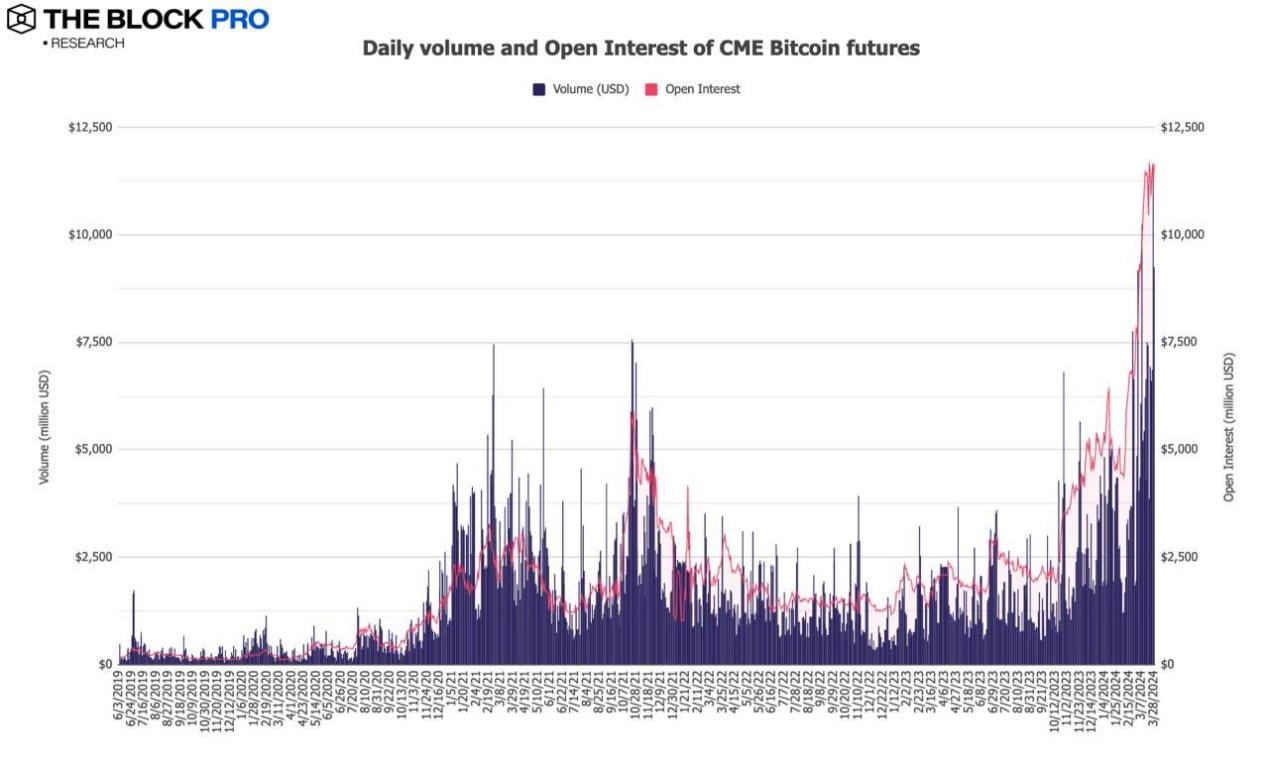
- The CME Bitcoin futures open interest grew by 49.5% in March, reaching $11.7 billion, setting a new record. The daily average volume also increased by 114.8% to approximately $6.8 billion, also reaching a historic high.
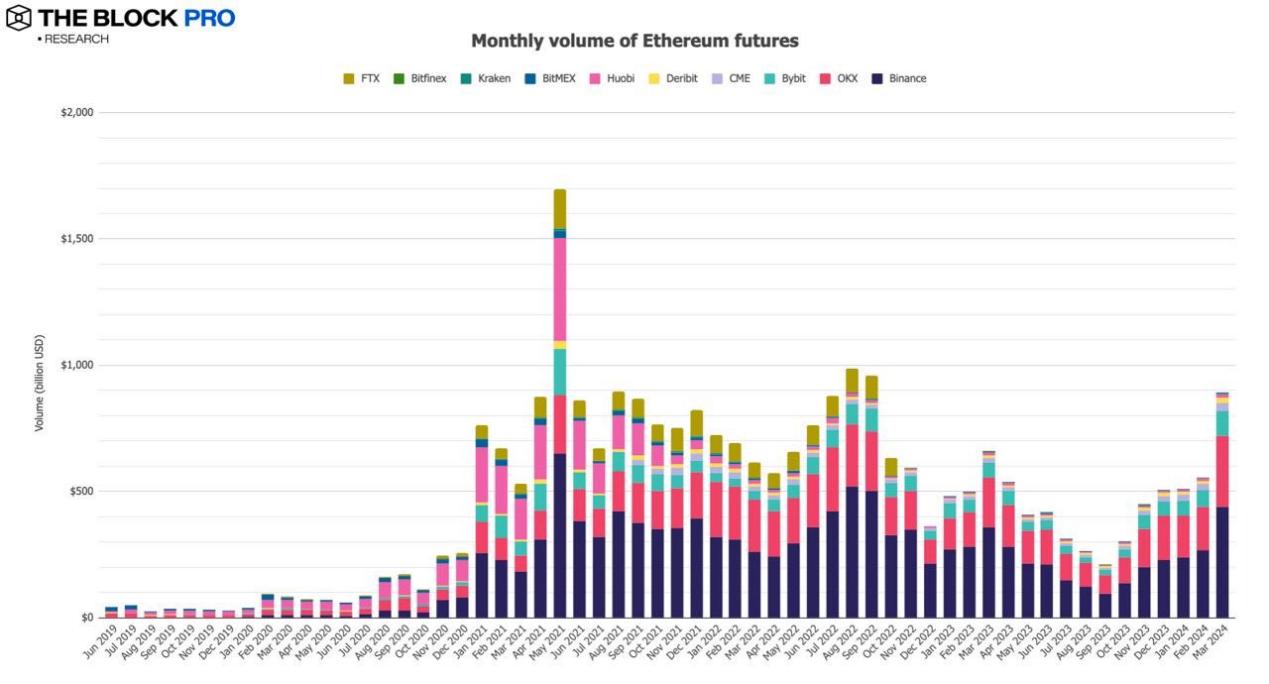
- The average monthly trading volume of Ethereum futures in March increased to $893.8 billion, with a growth rate of 60.9%.
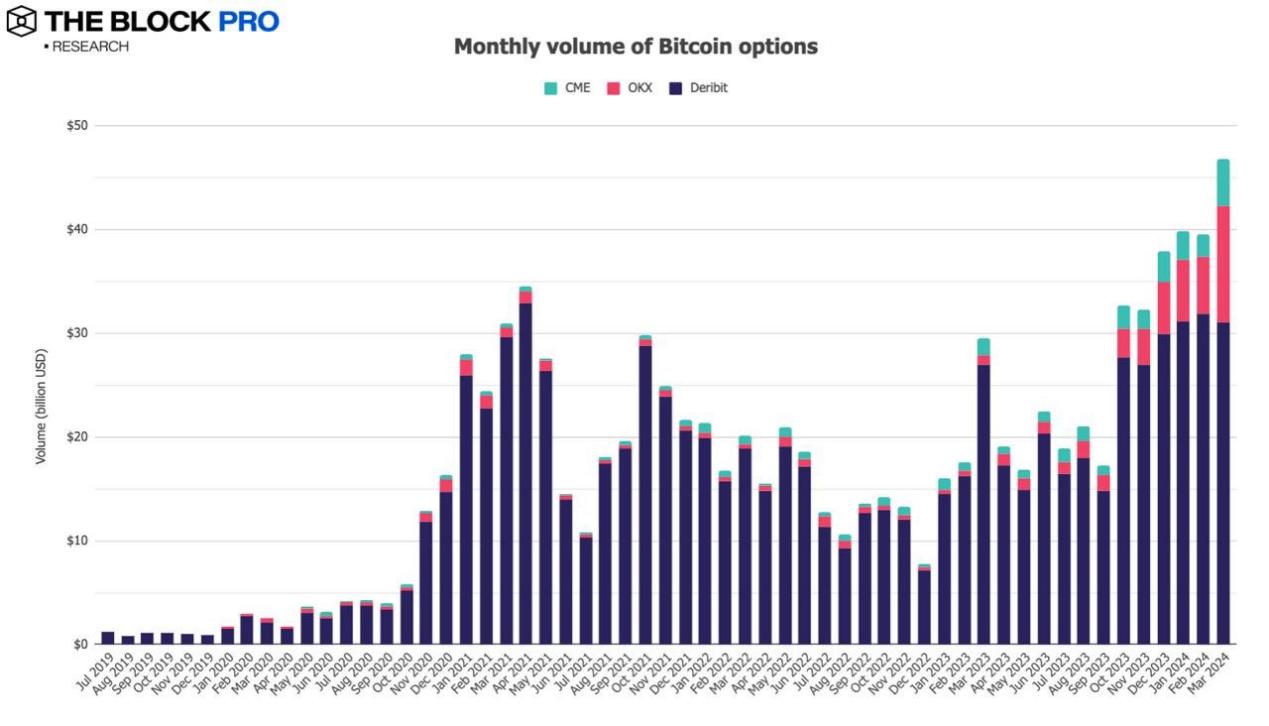
- In terms of cryptocurrency options, the open interest for Bitcoin options decreased by 1.9% in March, while Ethereum's open interest also declined by 6.6%. Additionally, both Bitcoin and Ethereum options trading volumes reached historic highs on March 29th, with Bitcoin options trading volume reaching a new high of $46.75 billion, an 18.5% increase, and Ethereum options trading volume reaching a new high of $20.99 billion, a 23.6% increase.
免责声明:本文章仅代表作者个人观点,不代表本平台的立场和观点。本文章仅供信息分享,不构成对任何人的任何投资建议。用户与作者之间的任何争议,与本平台无关。如网页中刊载的文章或图片涉及侵权,请提供相关的权利证明和身份证明发送邮件到support@aicoin.com,本平台相关工作人员将会进行核查。


