On the evening of March 19th, AICoin researchers conducted a live graphic and text sharing session titled "AI Writes Indicators: Construct Your Exclusive EMA Strategy from Scratch (Free Membership)" in AICoin PC End-Group Chat-Live. Below is a summary of the live content.
I. DCA Tool
The version has been updated, and the DCA strategy is in the position shown in the image below.
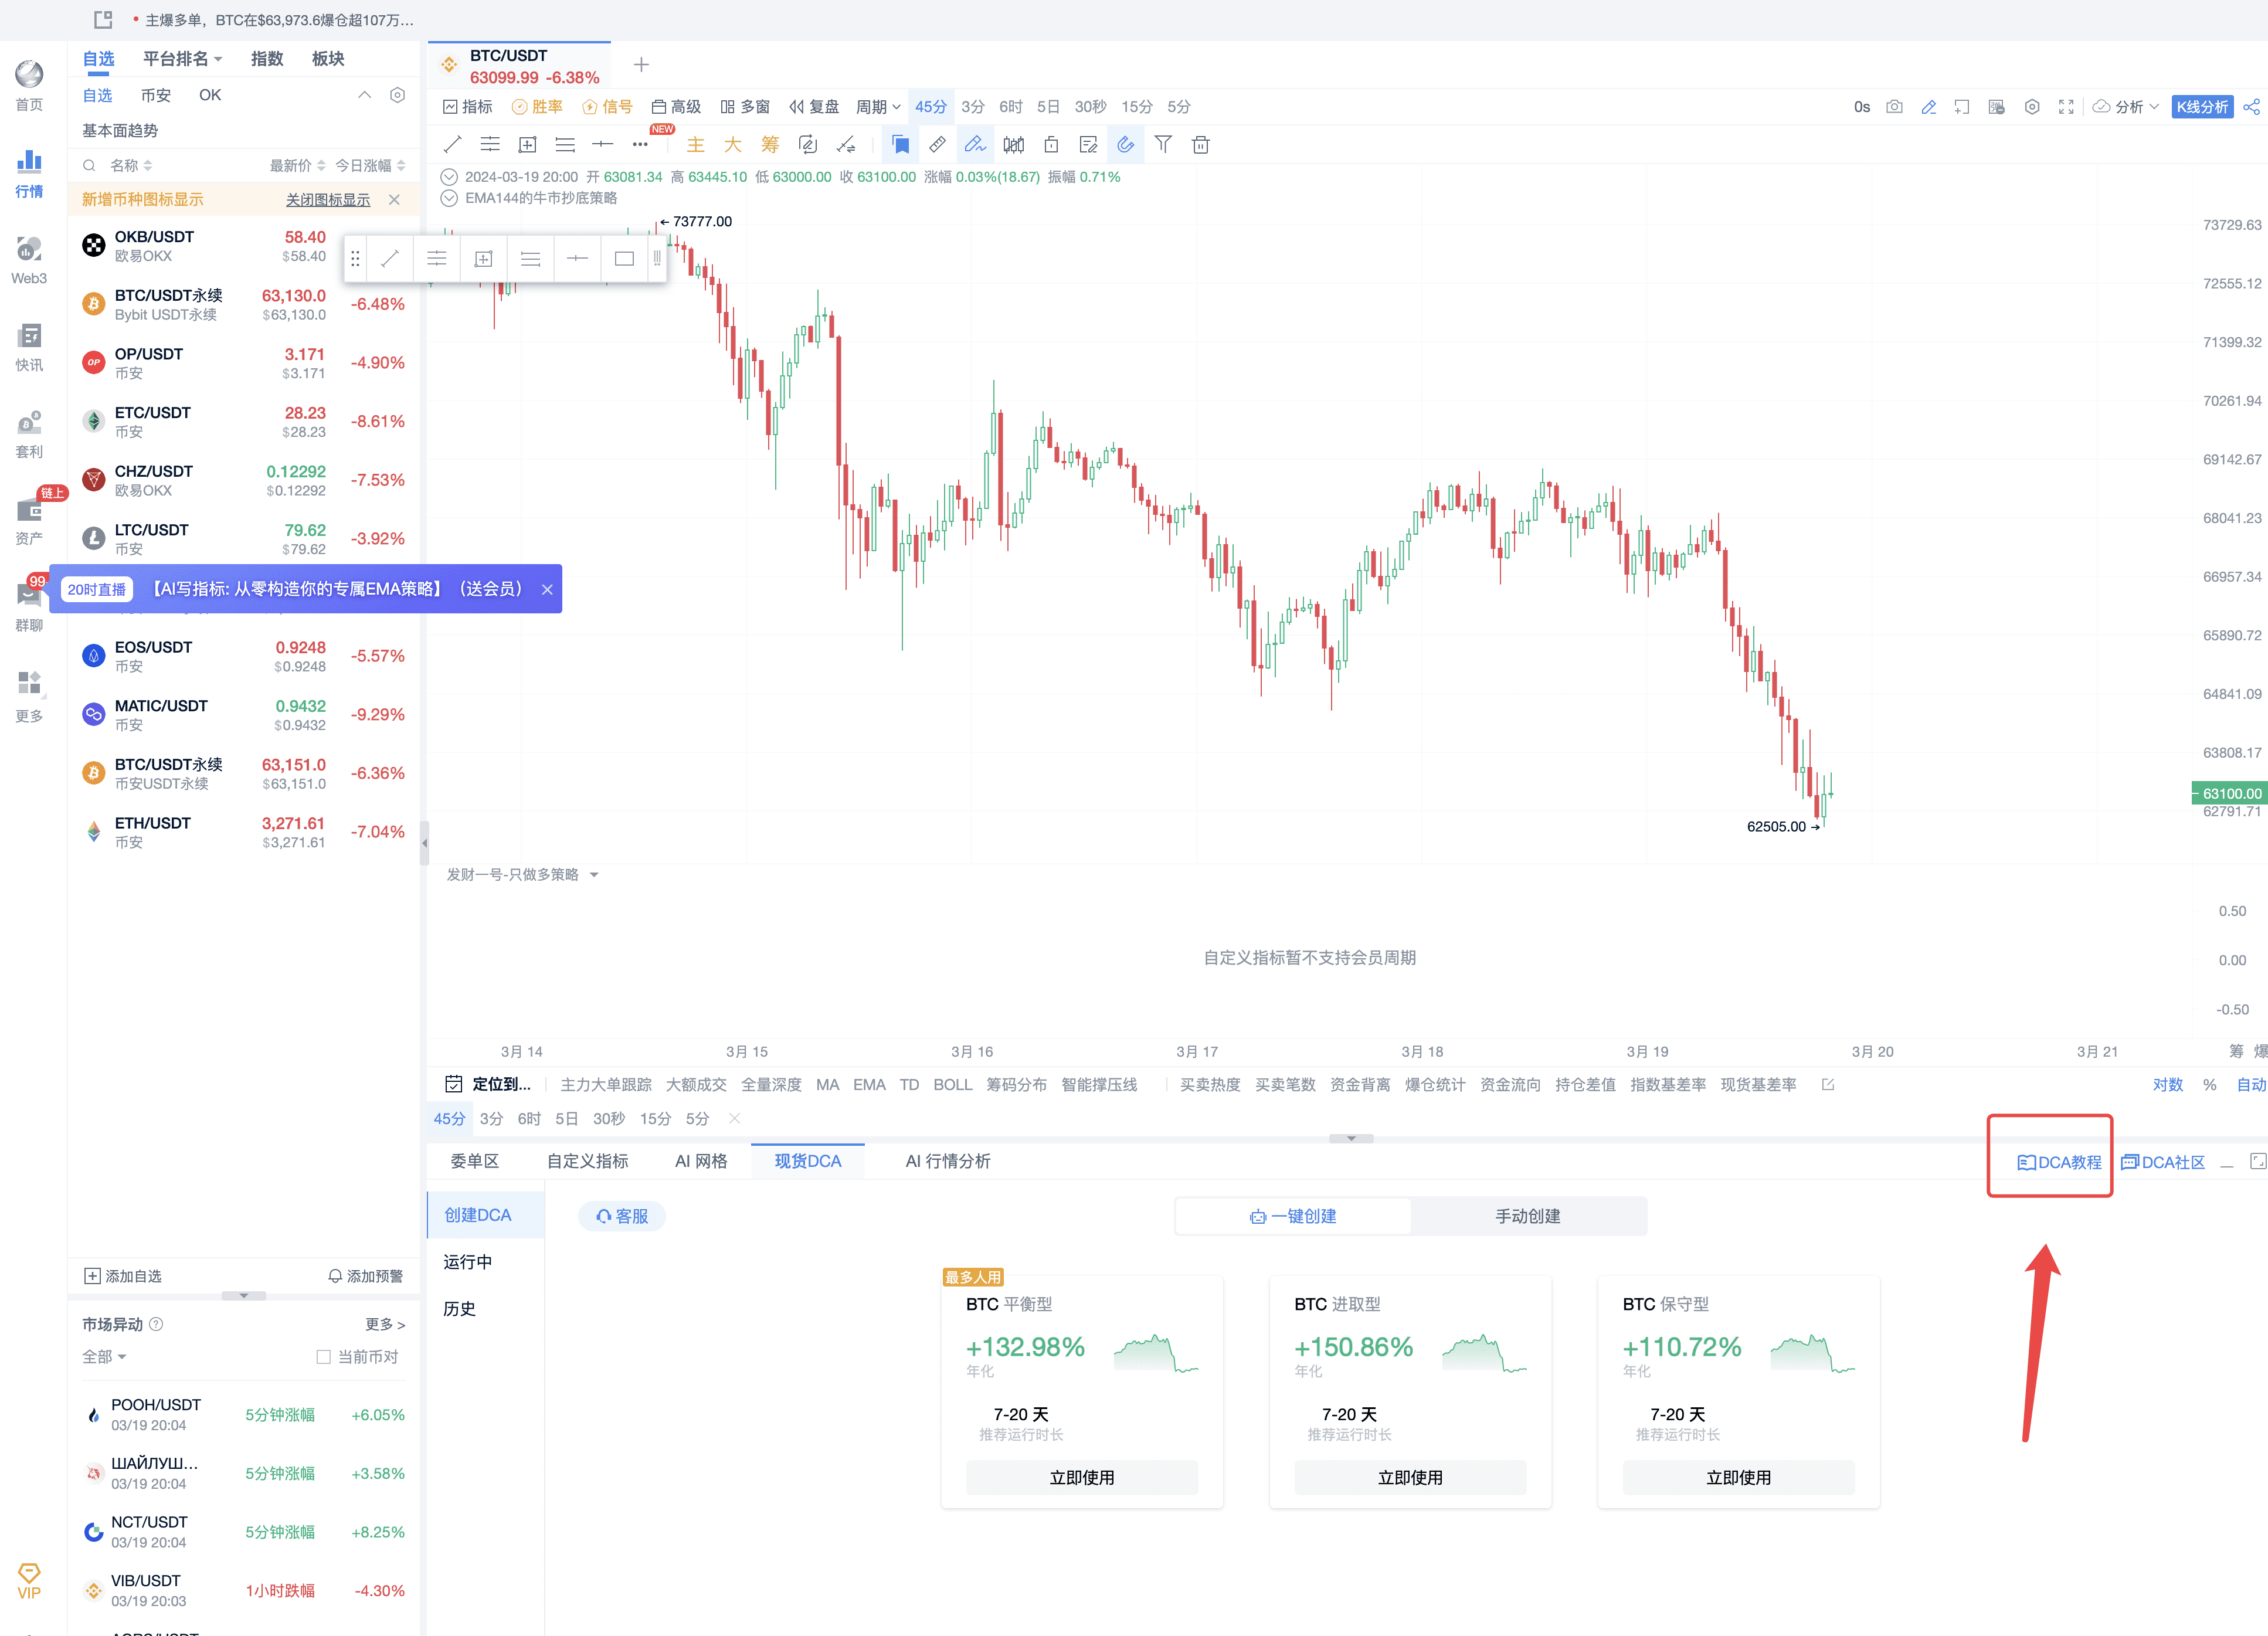
Feel free to download the latest version and experience it on AICoin PC End.
II. Constructing EMA Signal Indicator Alerts
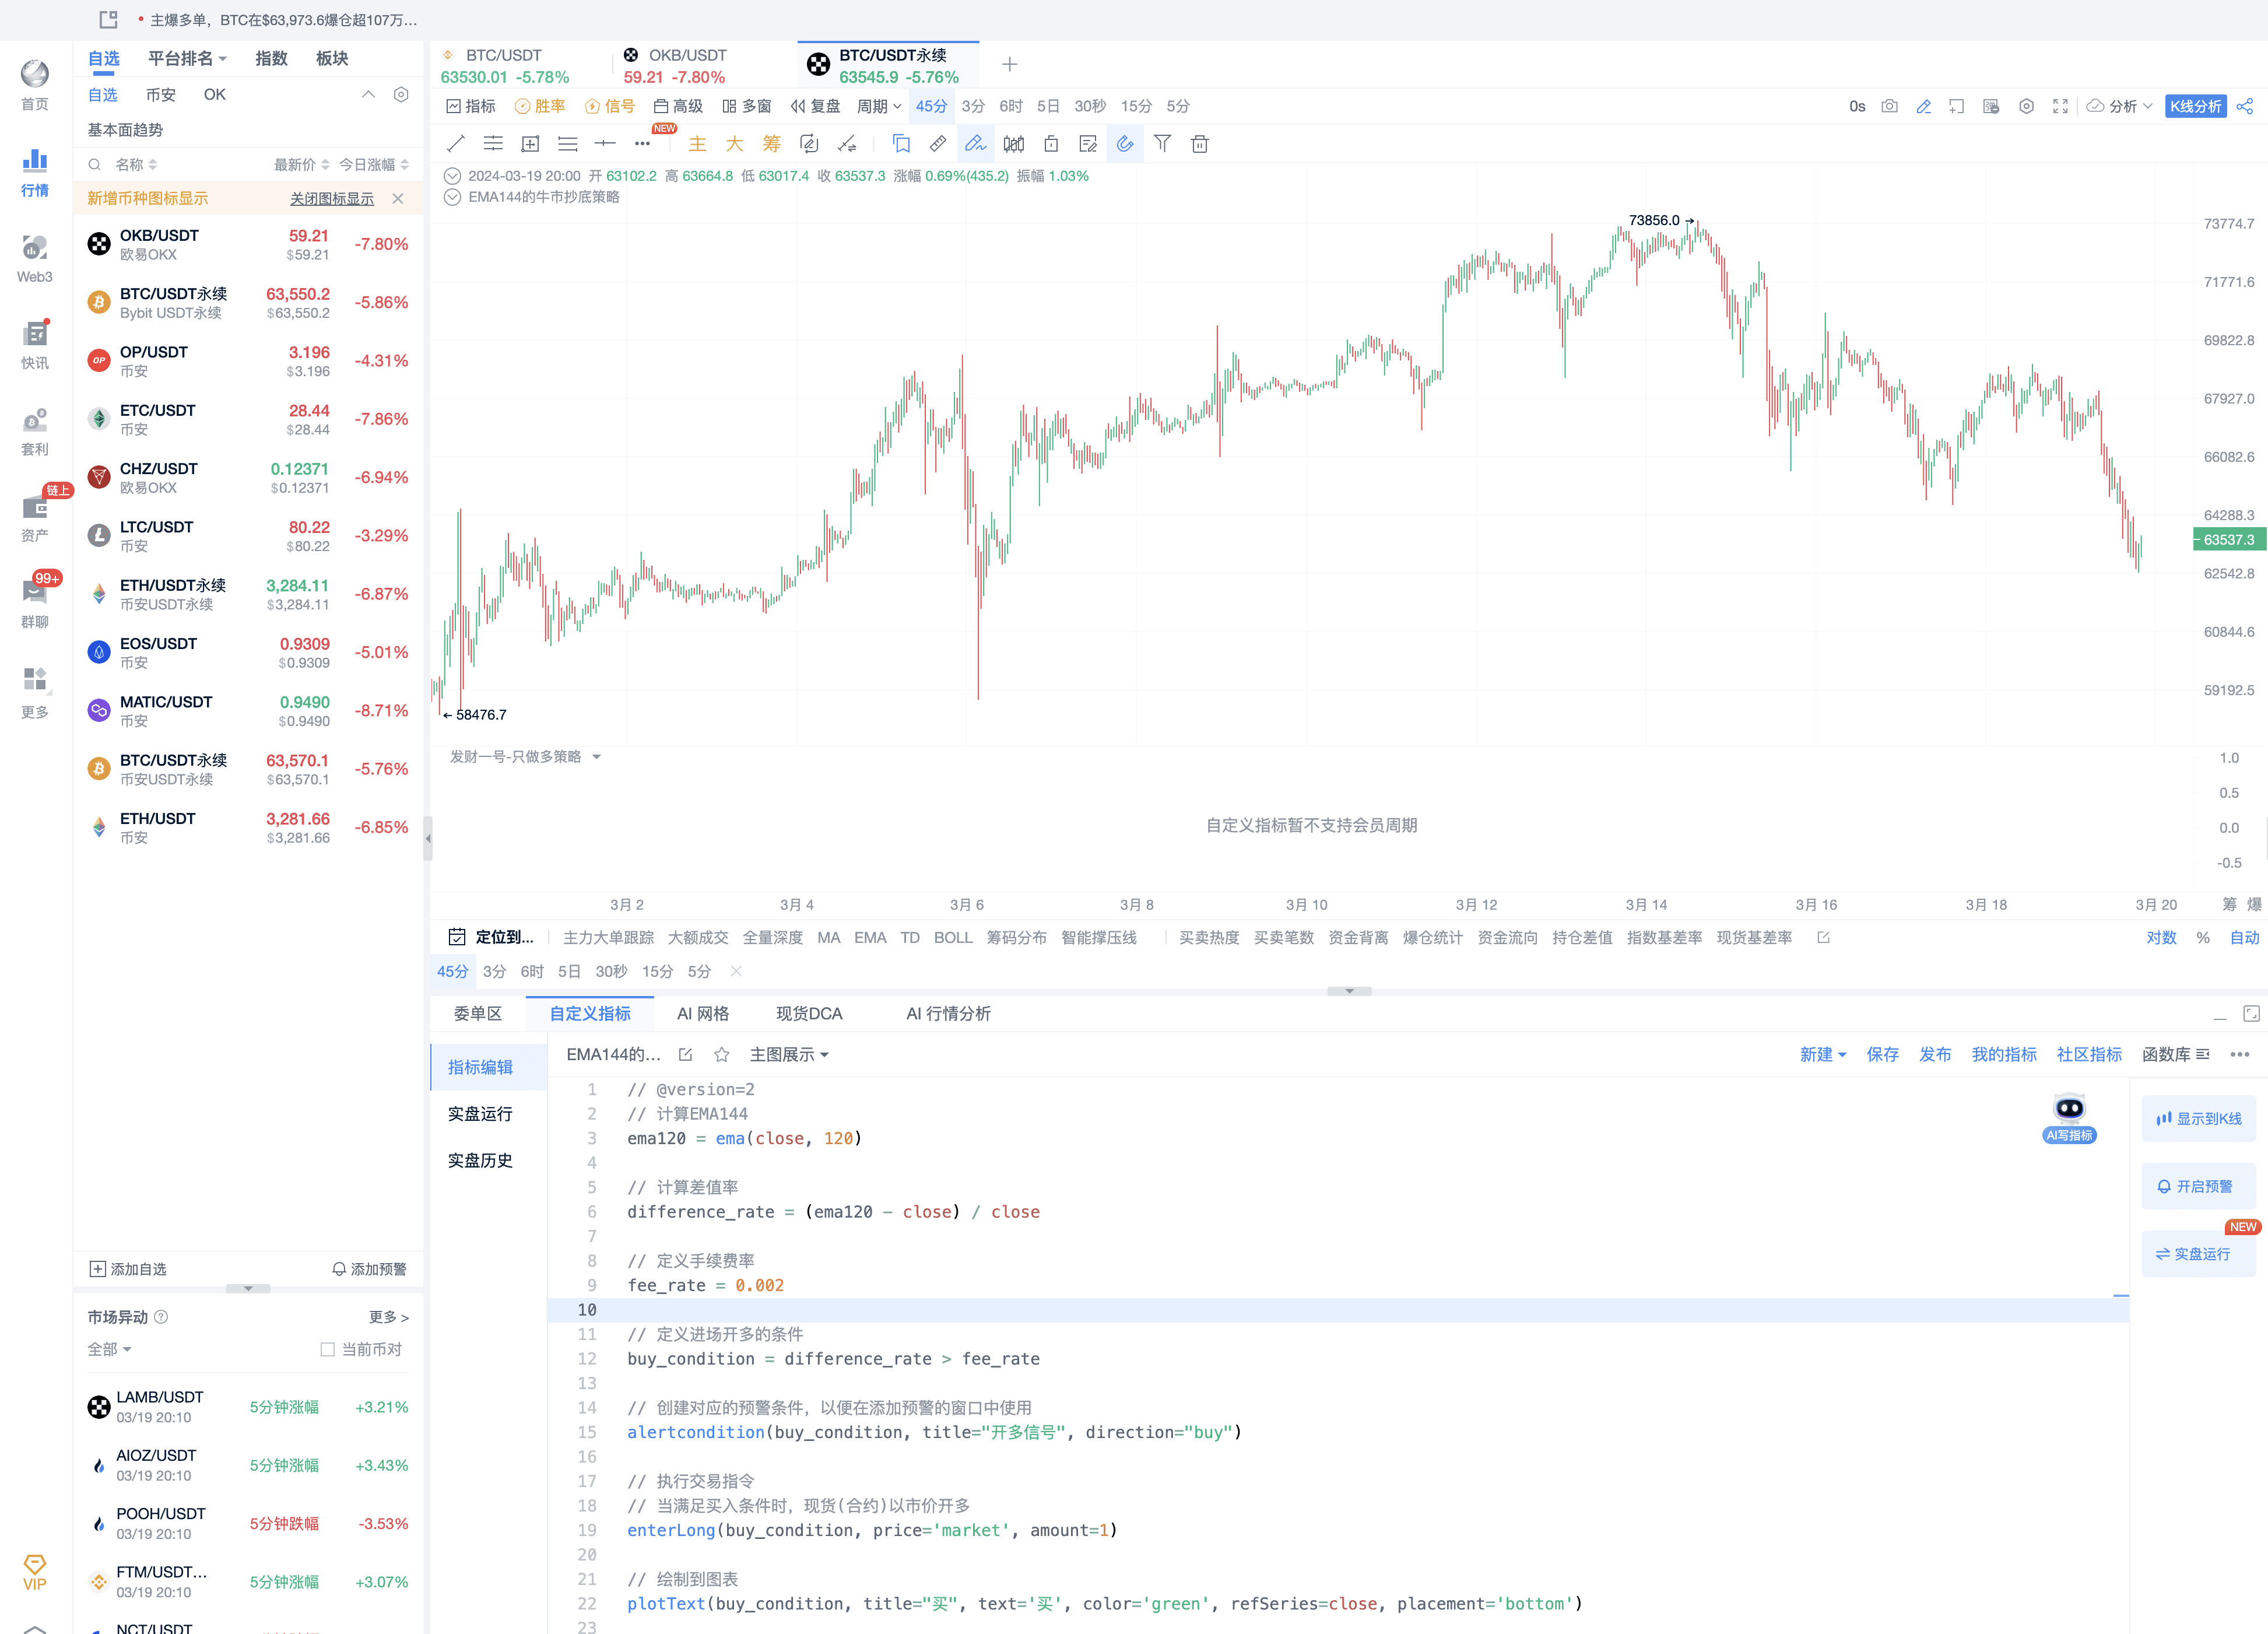
- Open the perpetual contract for BTCUSDT on the OKX platform as shown in the image below.
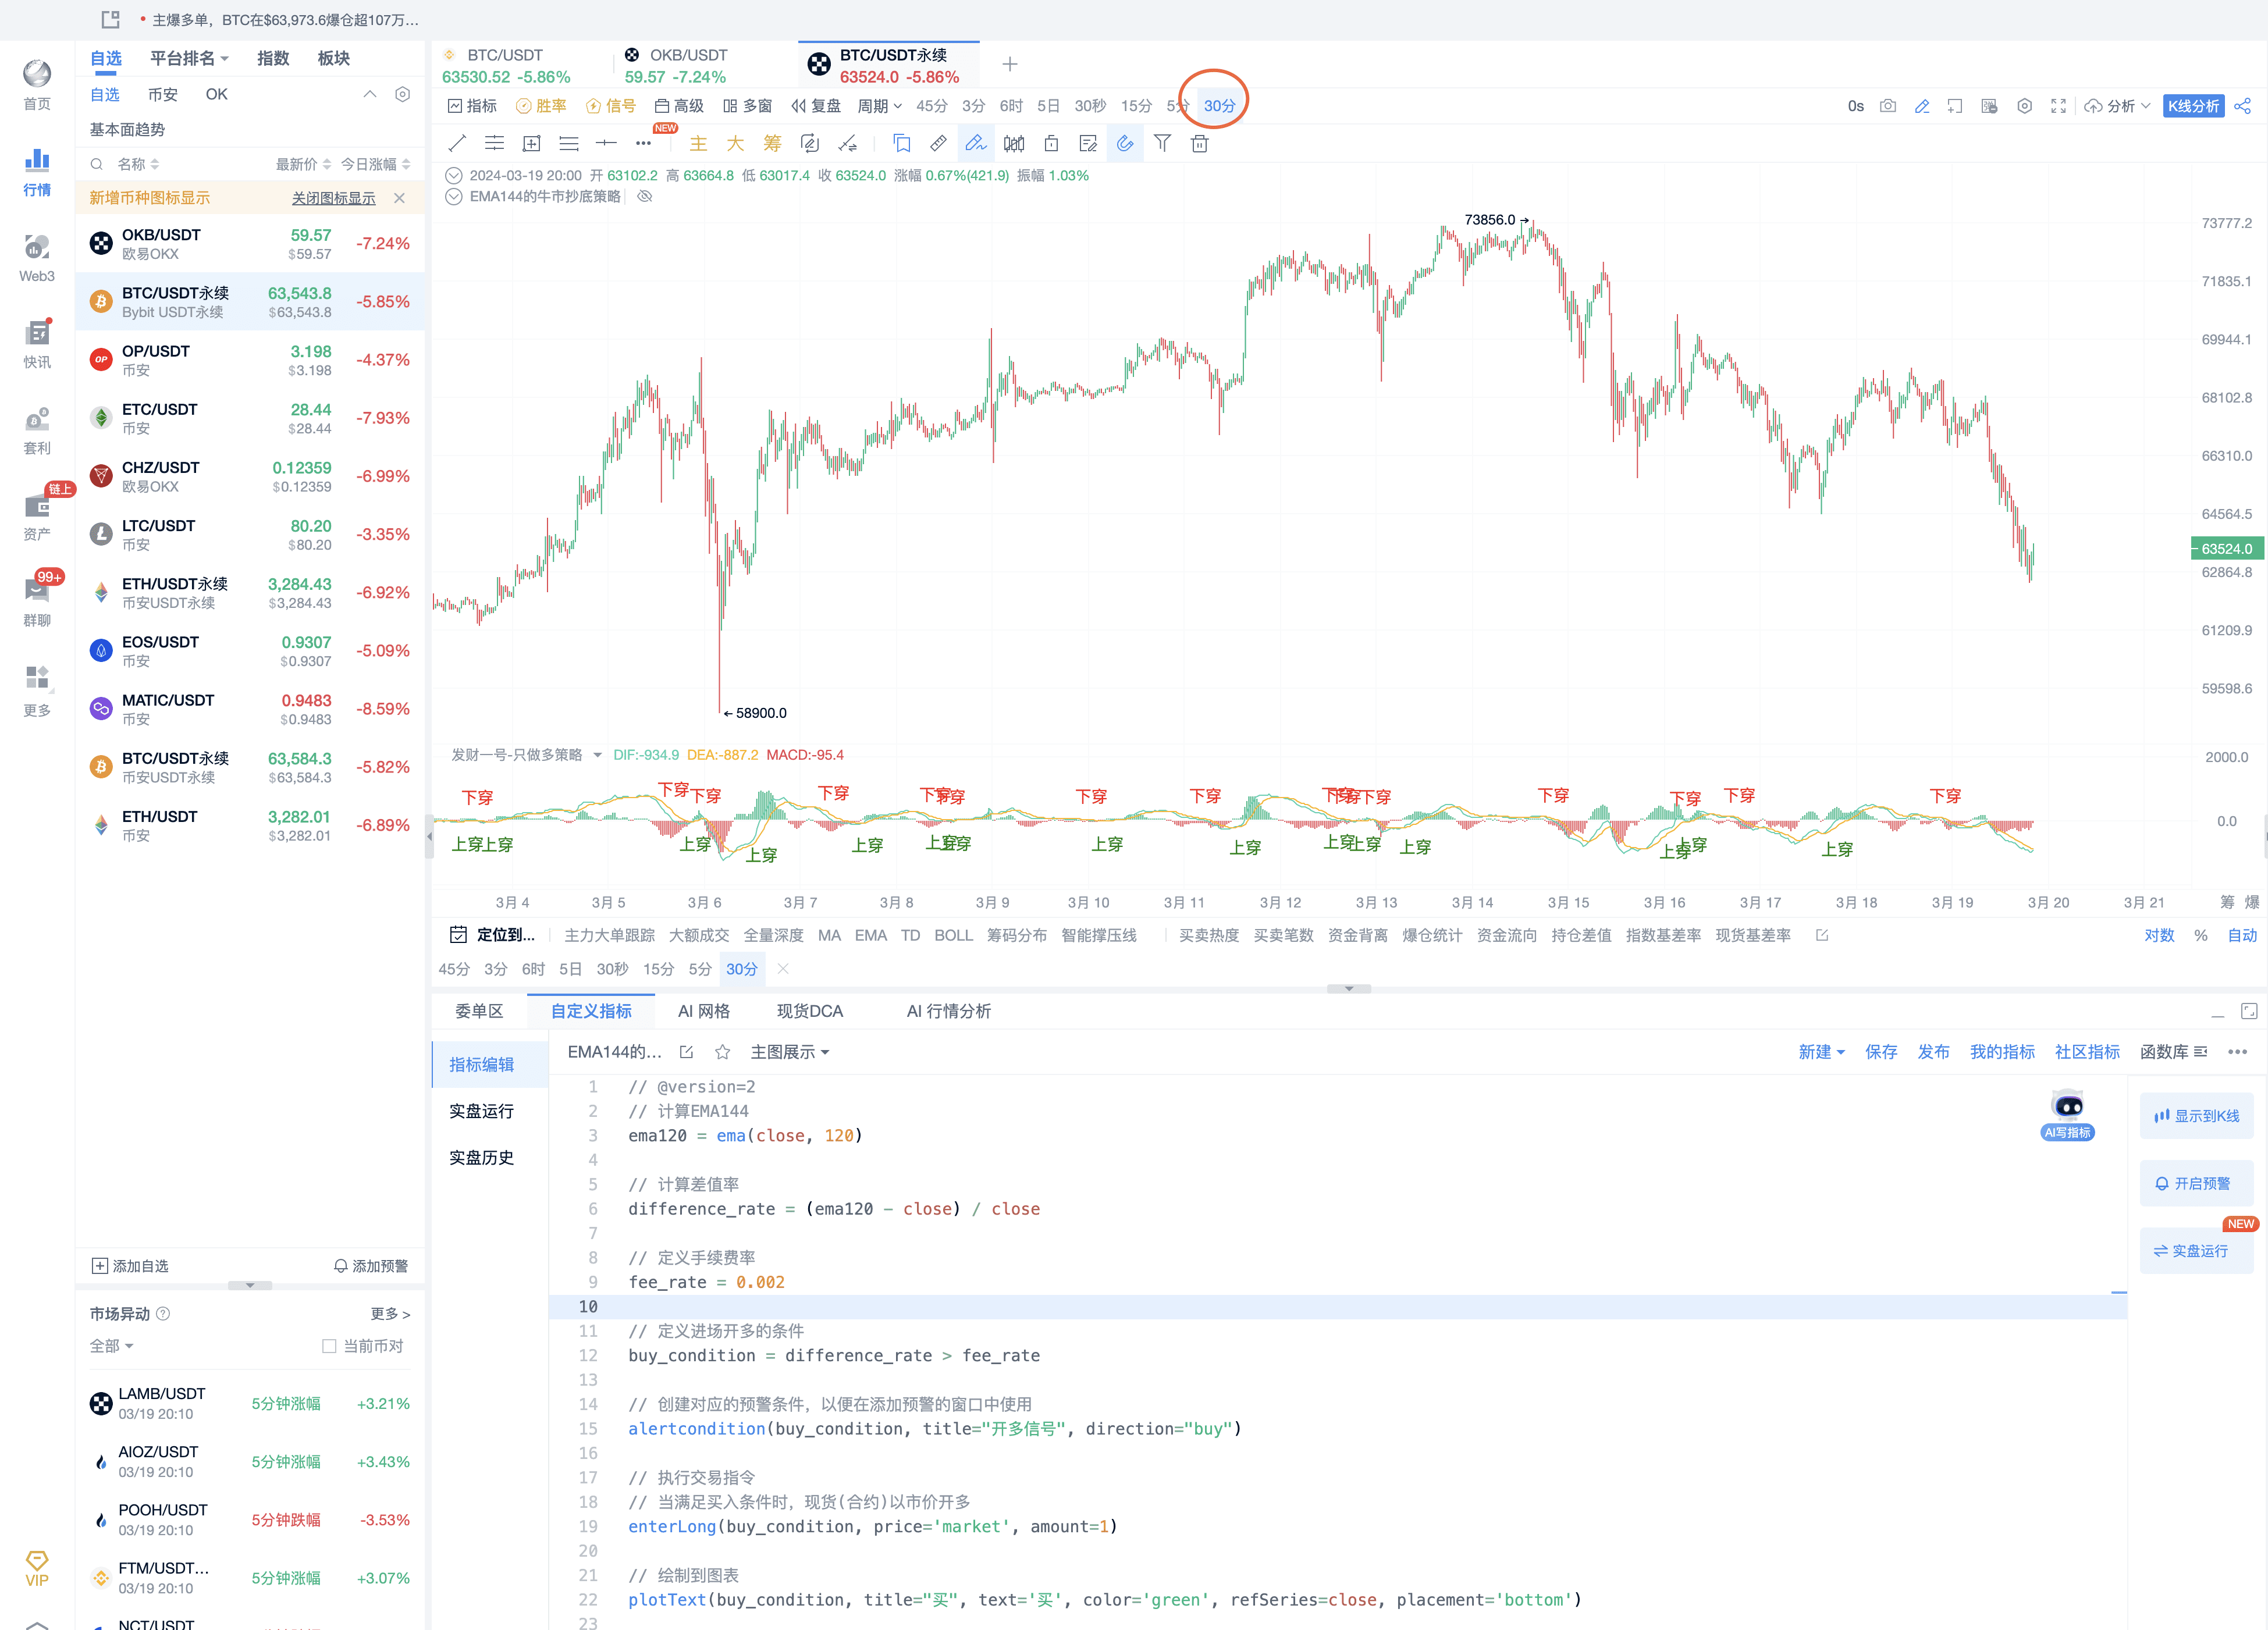
- Select a 30-minute period as shown in the image below.
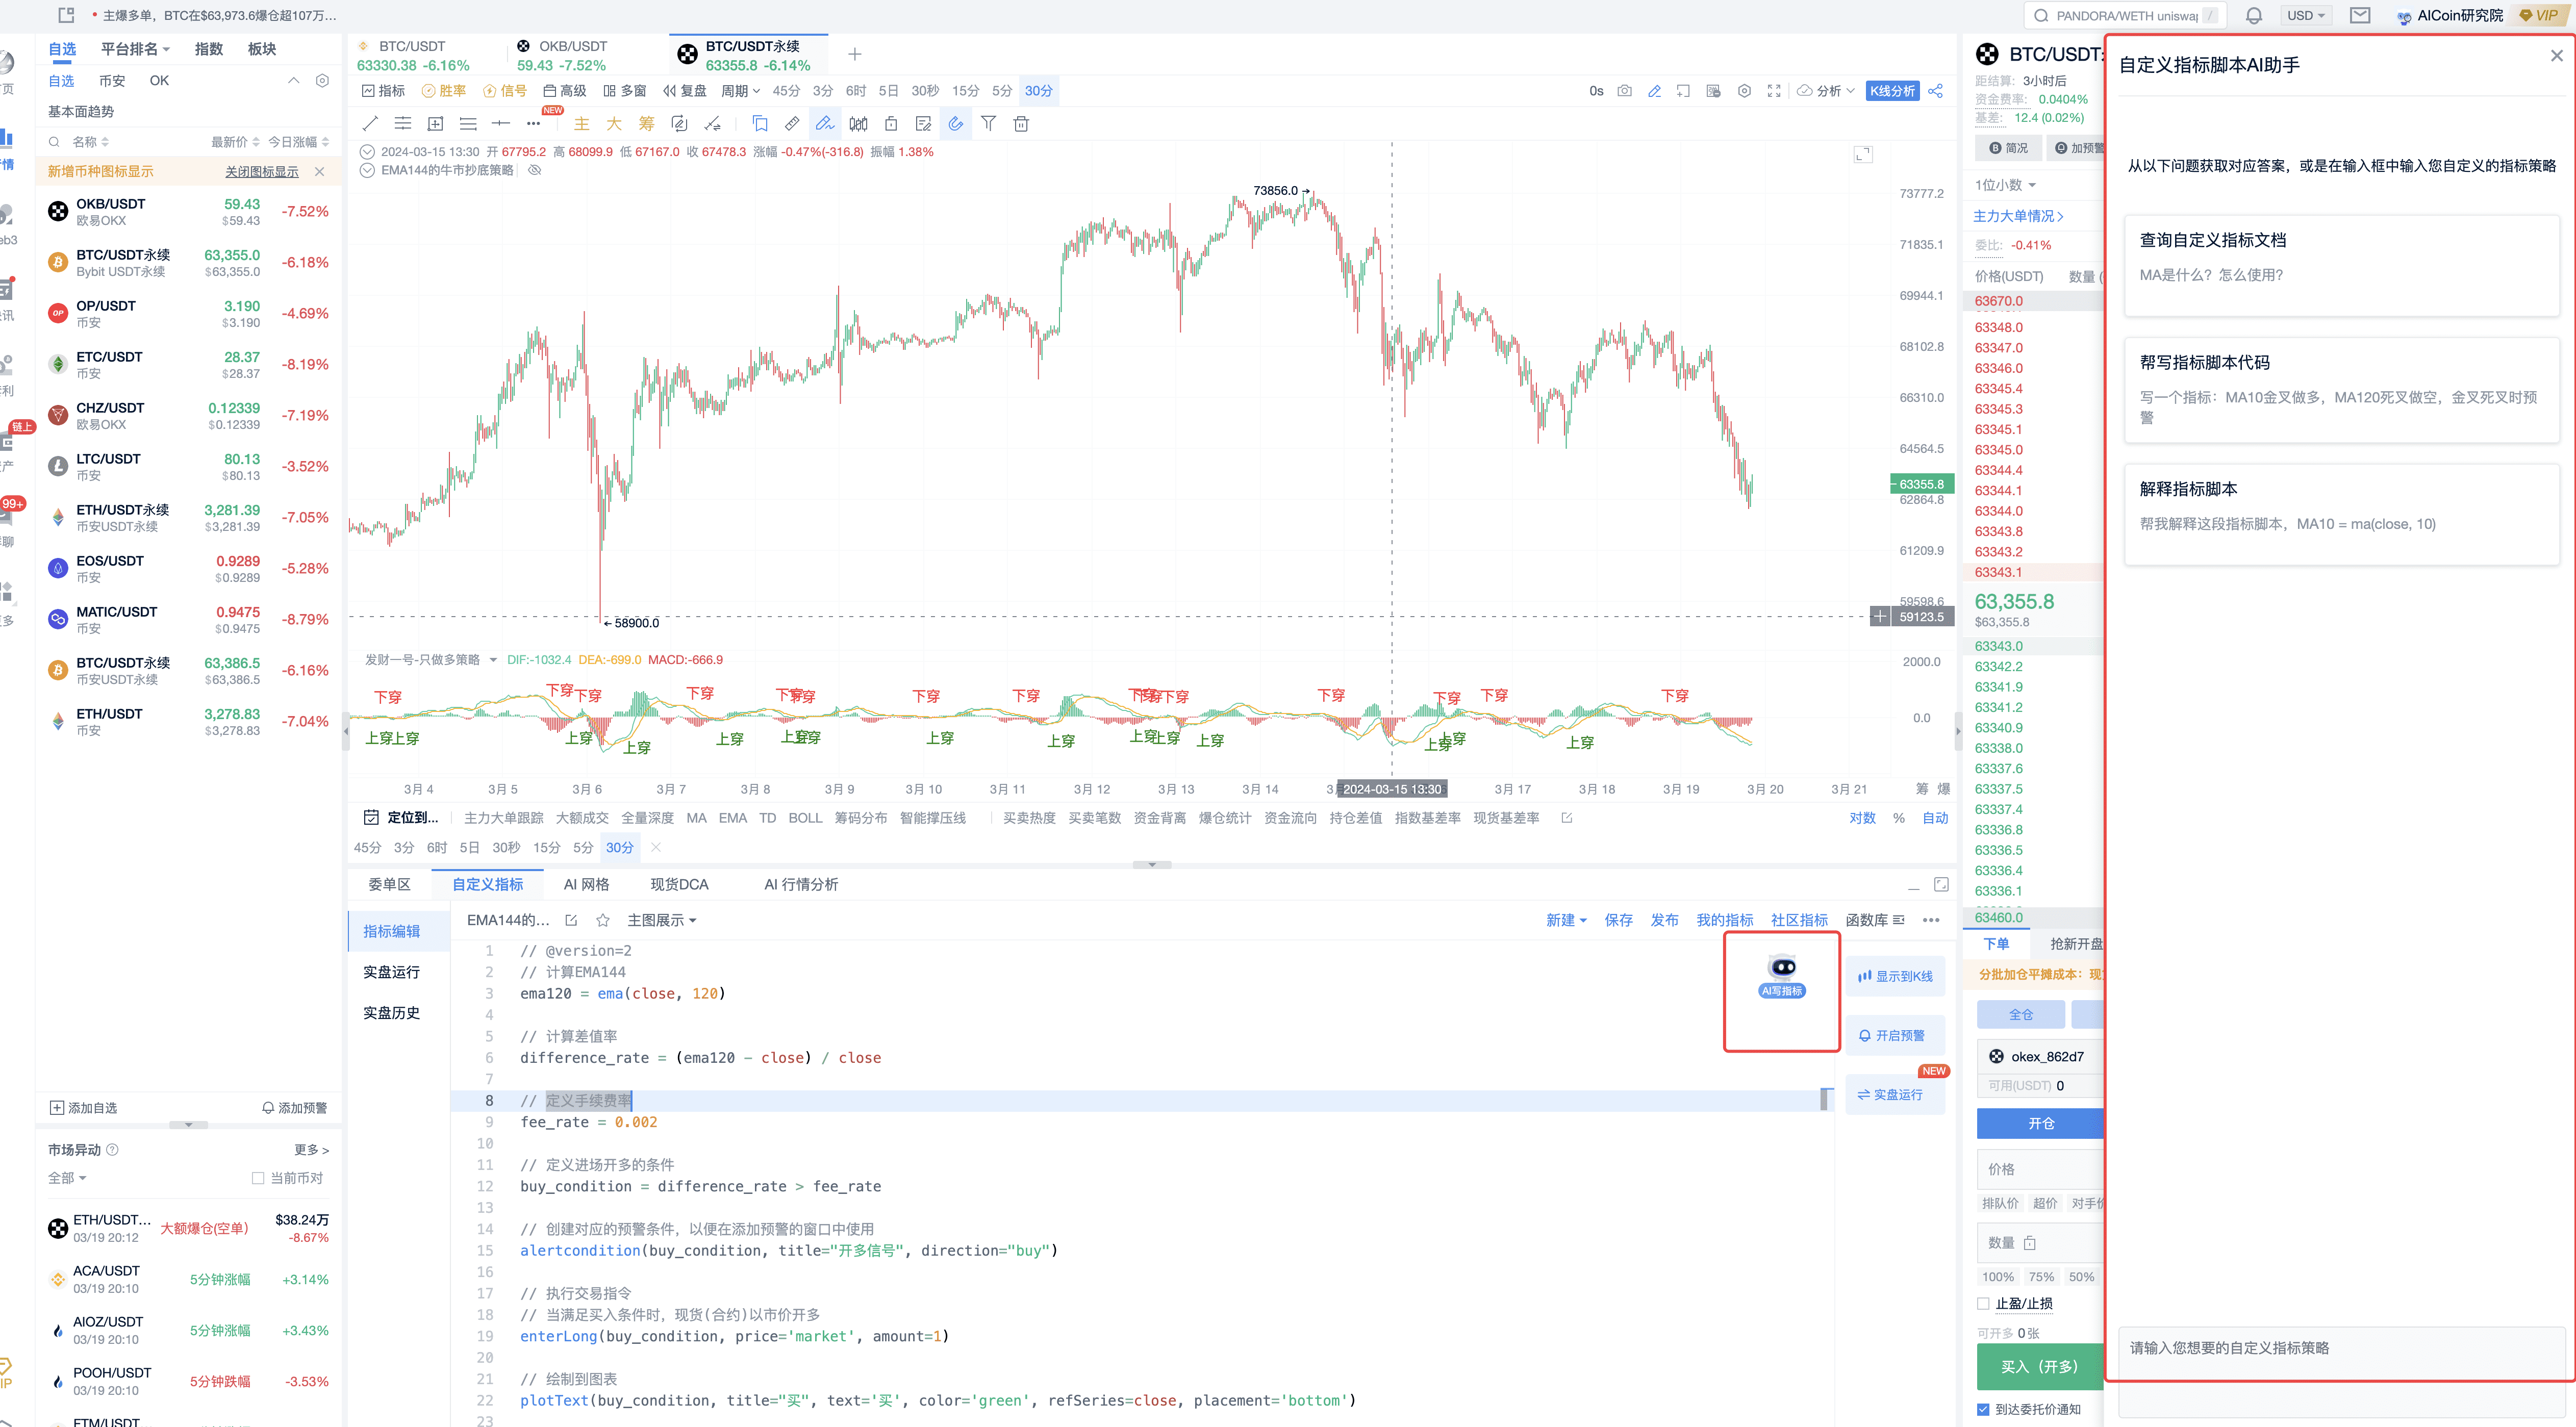
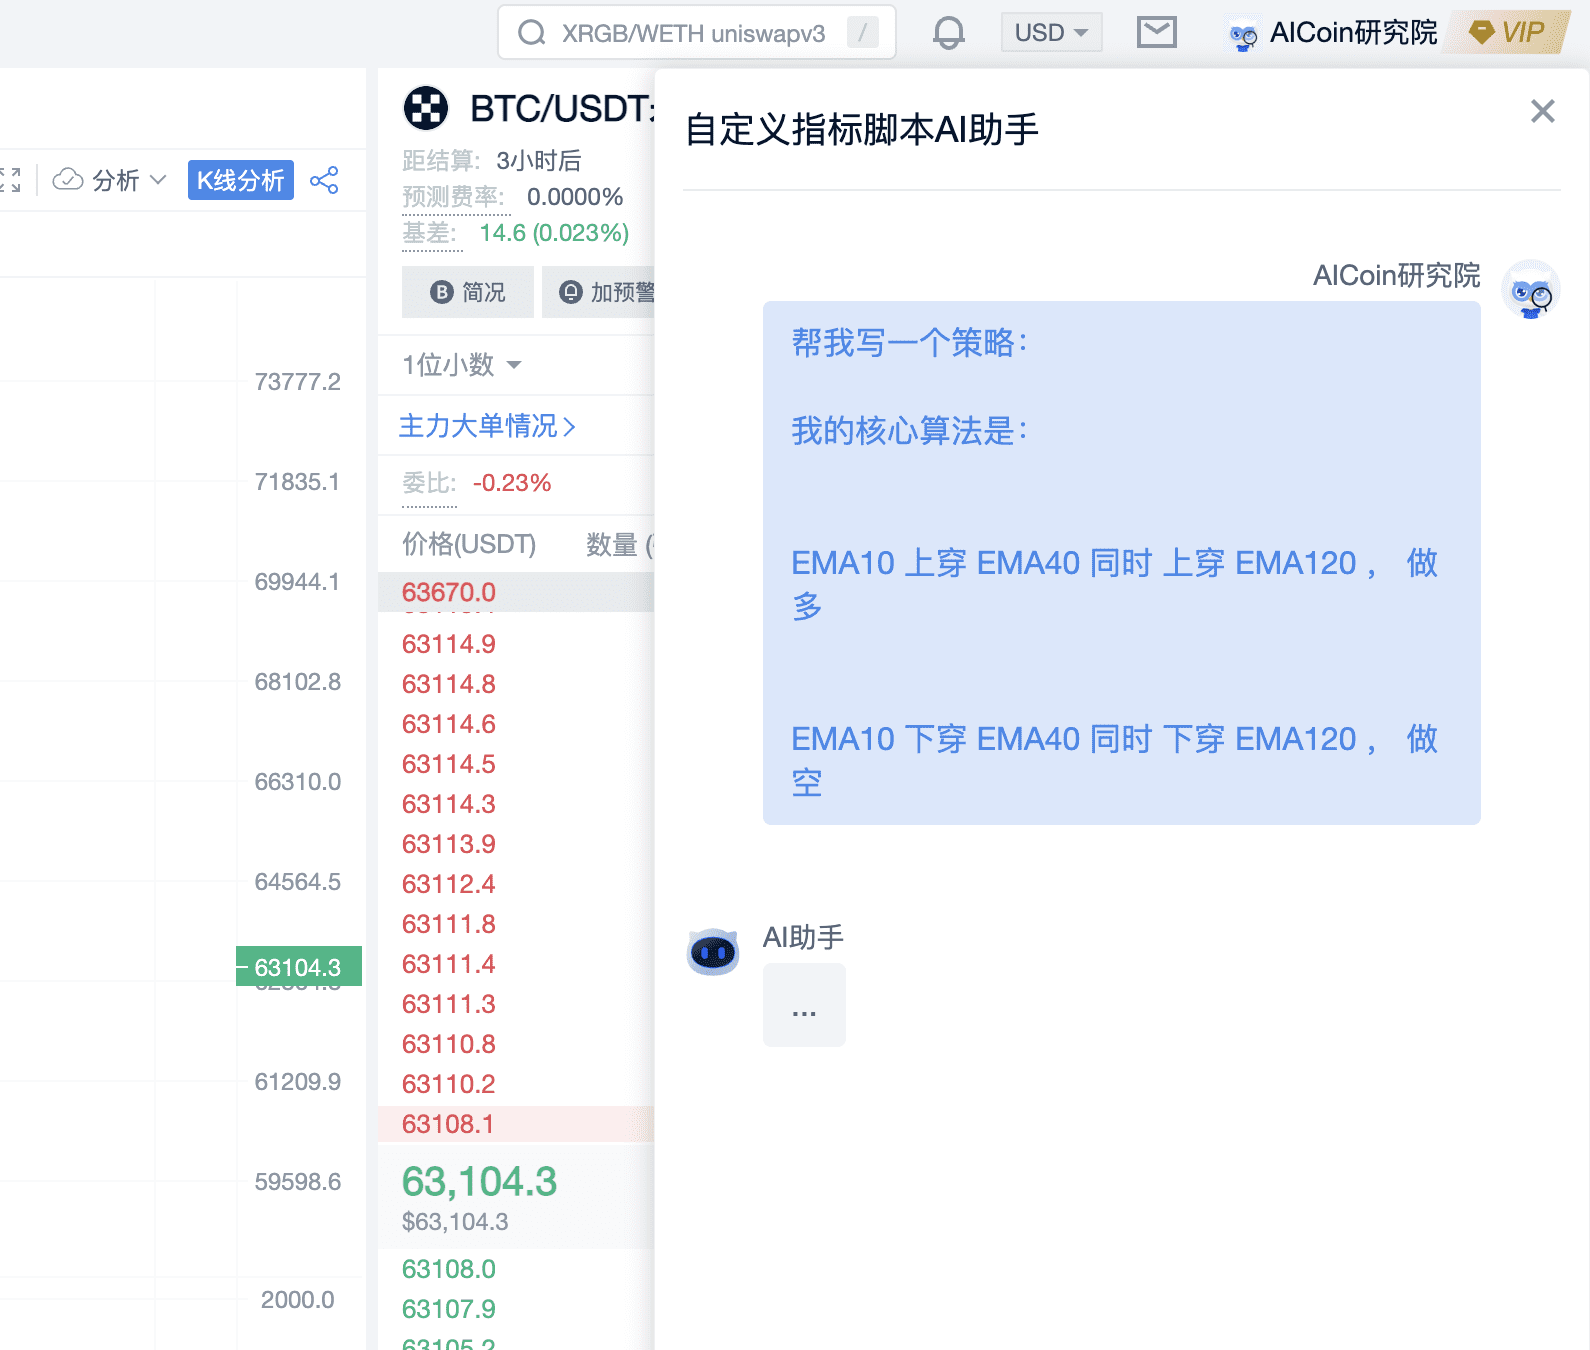
- Click on "Use AI" at the position shown in the image below.
- Tell AI your core algorithm: When EMA10 crosses above EMA40 and simultaneously crosses above EMA120, go long; when EMA10 crosses below EMA40 and simultaneously crosses below EMA120, go short.
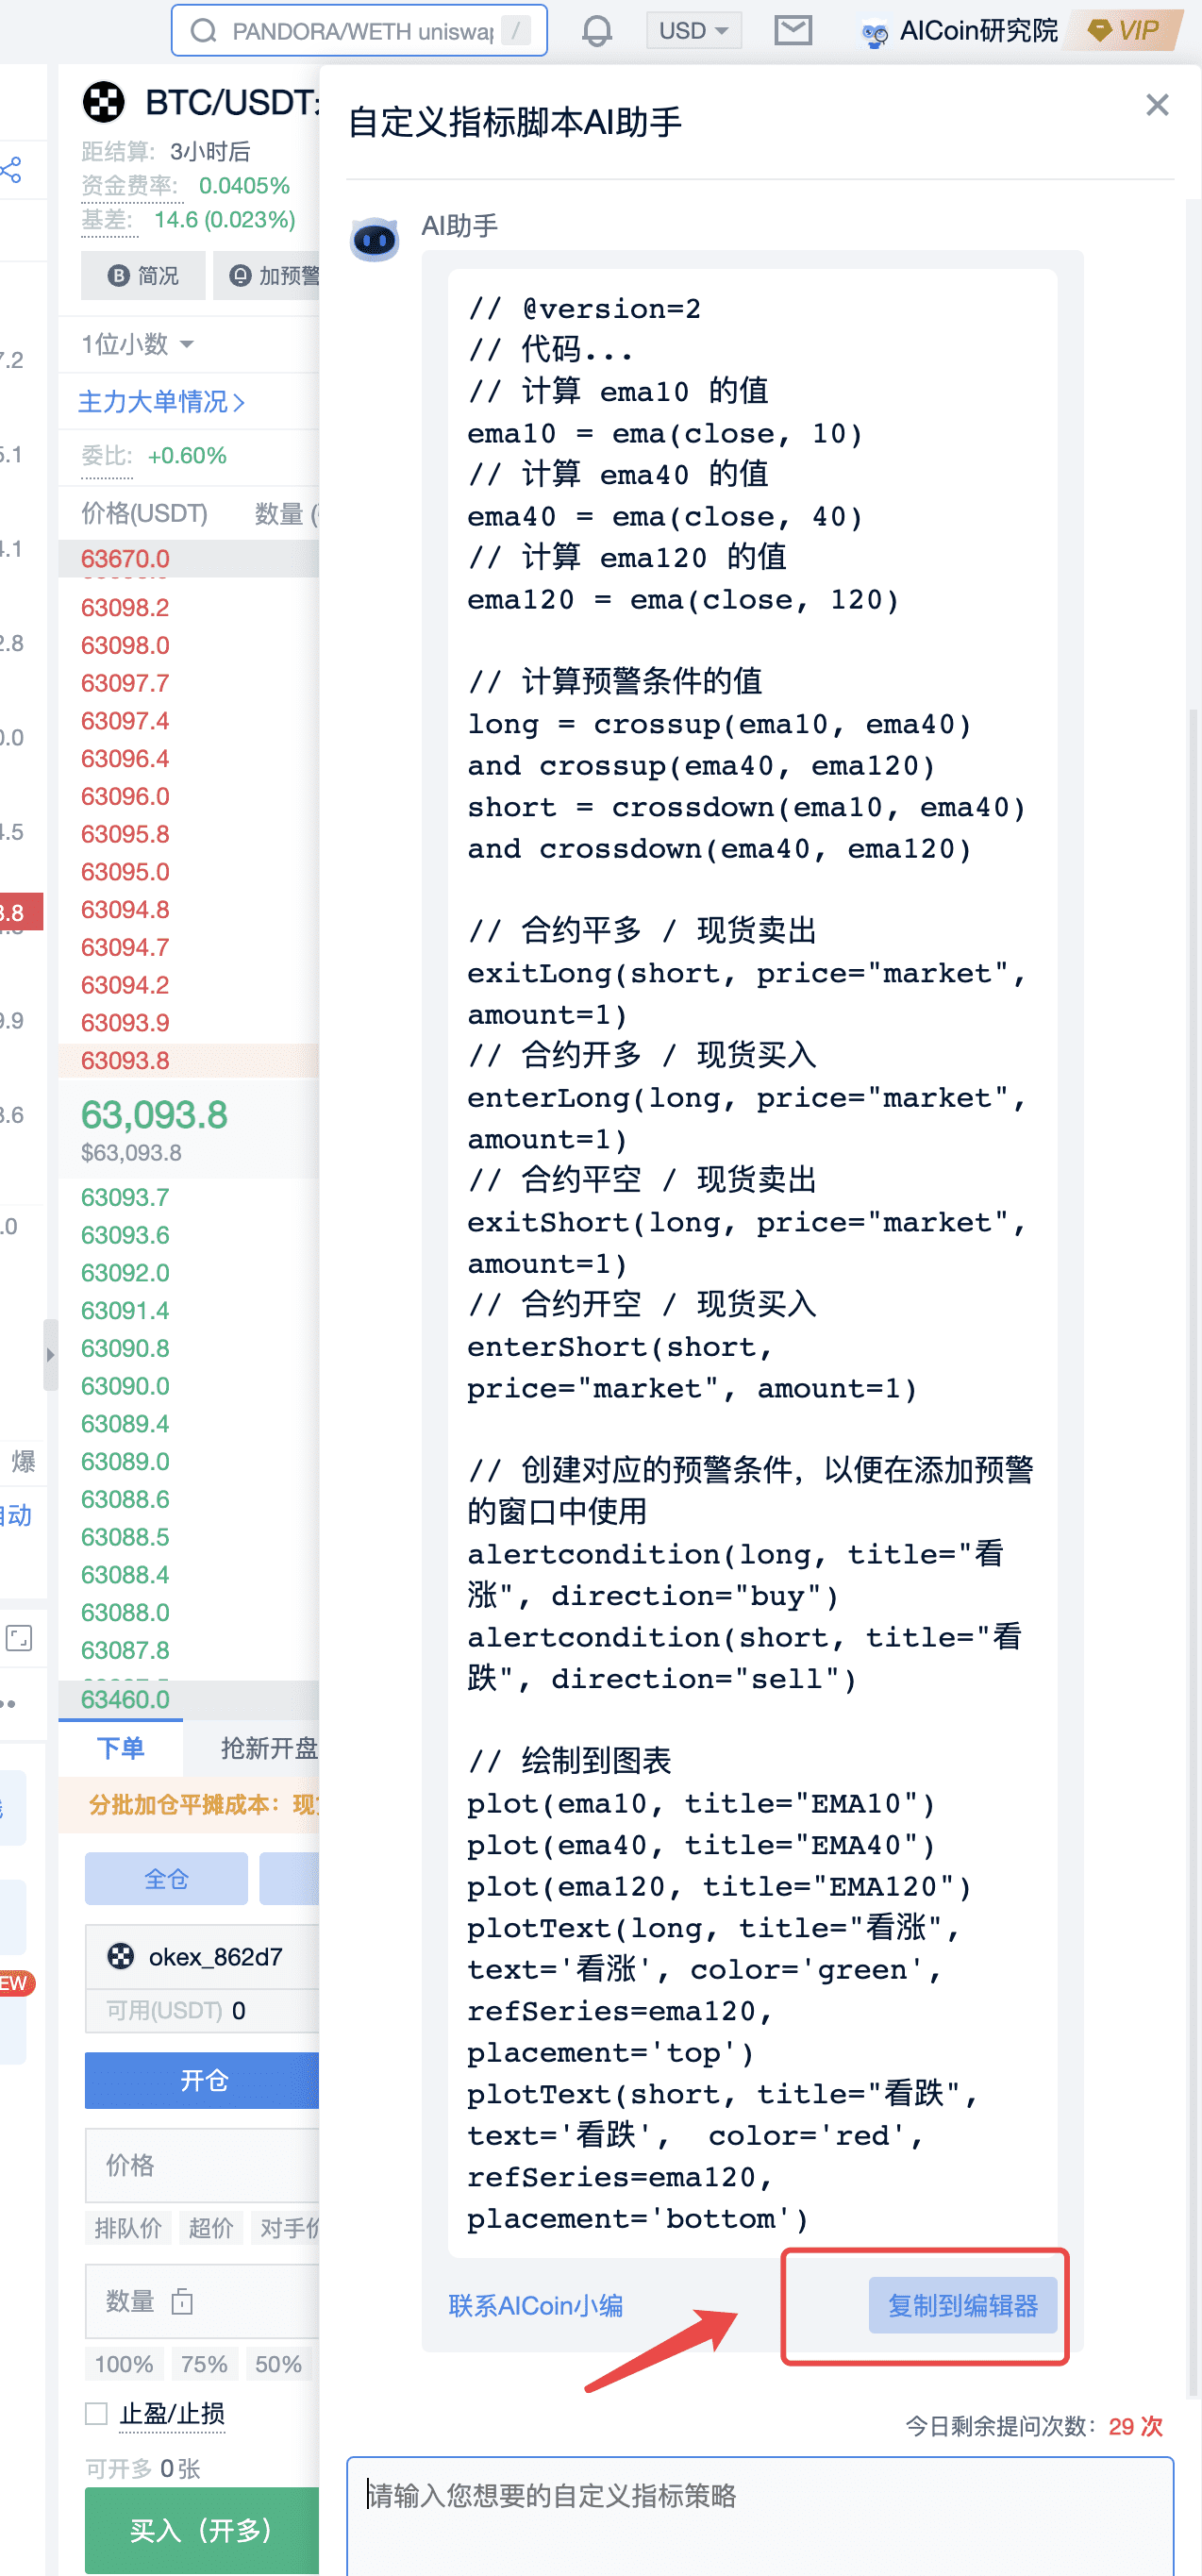
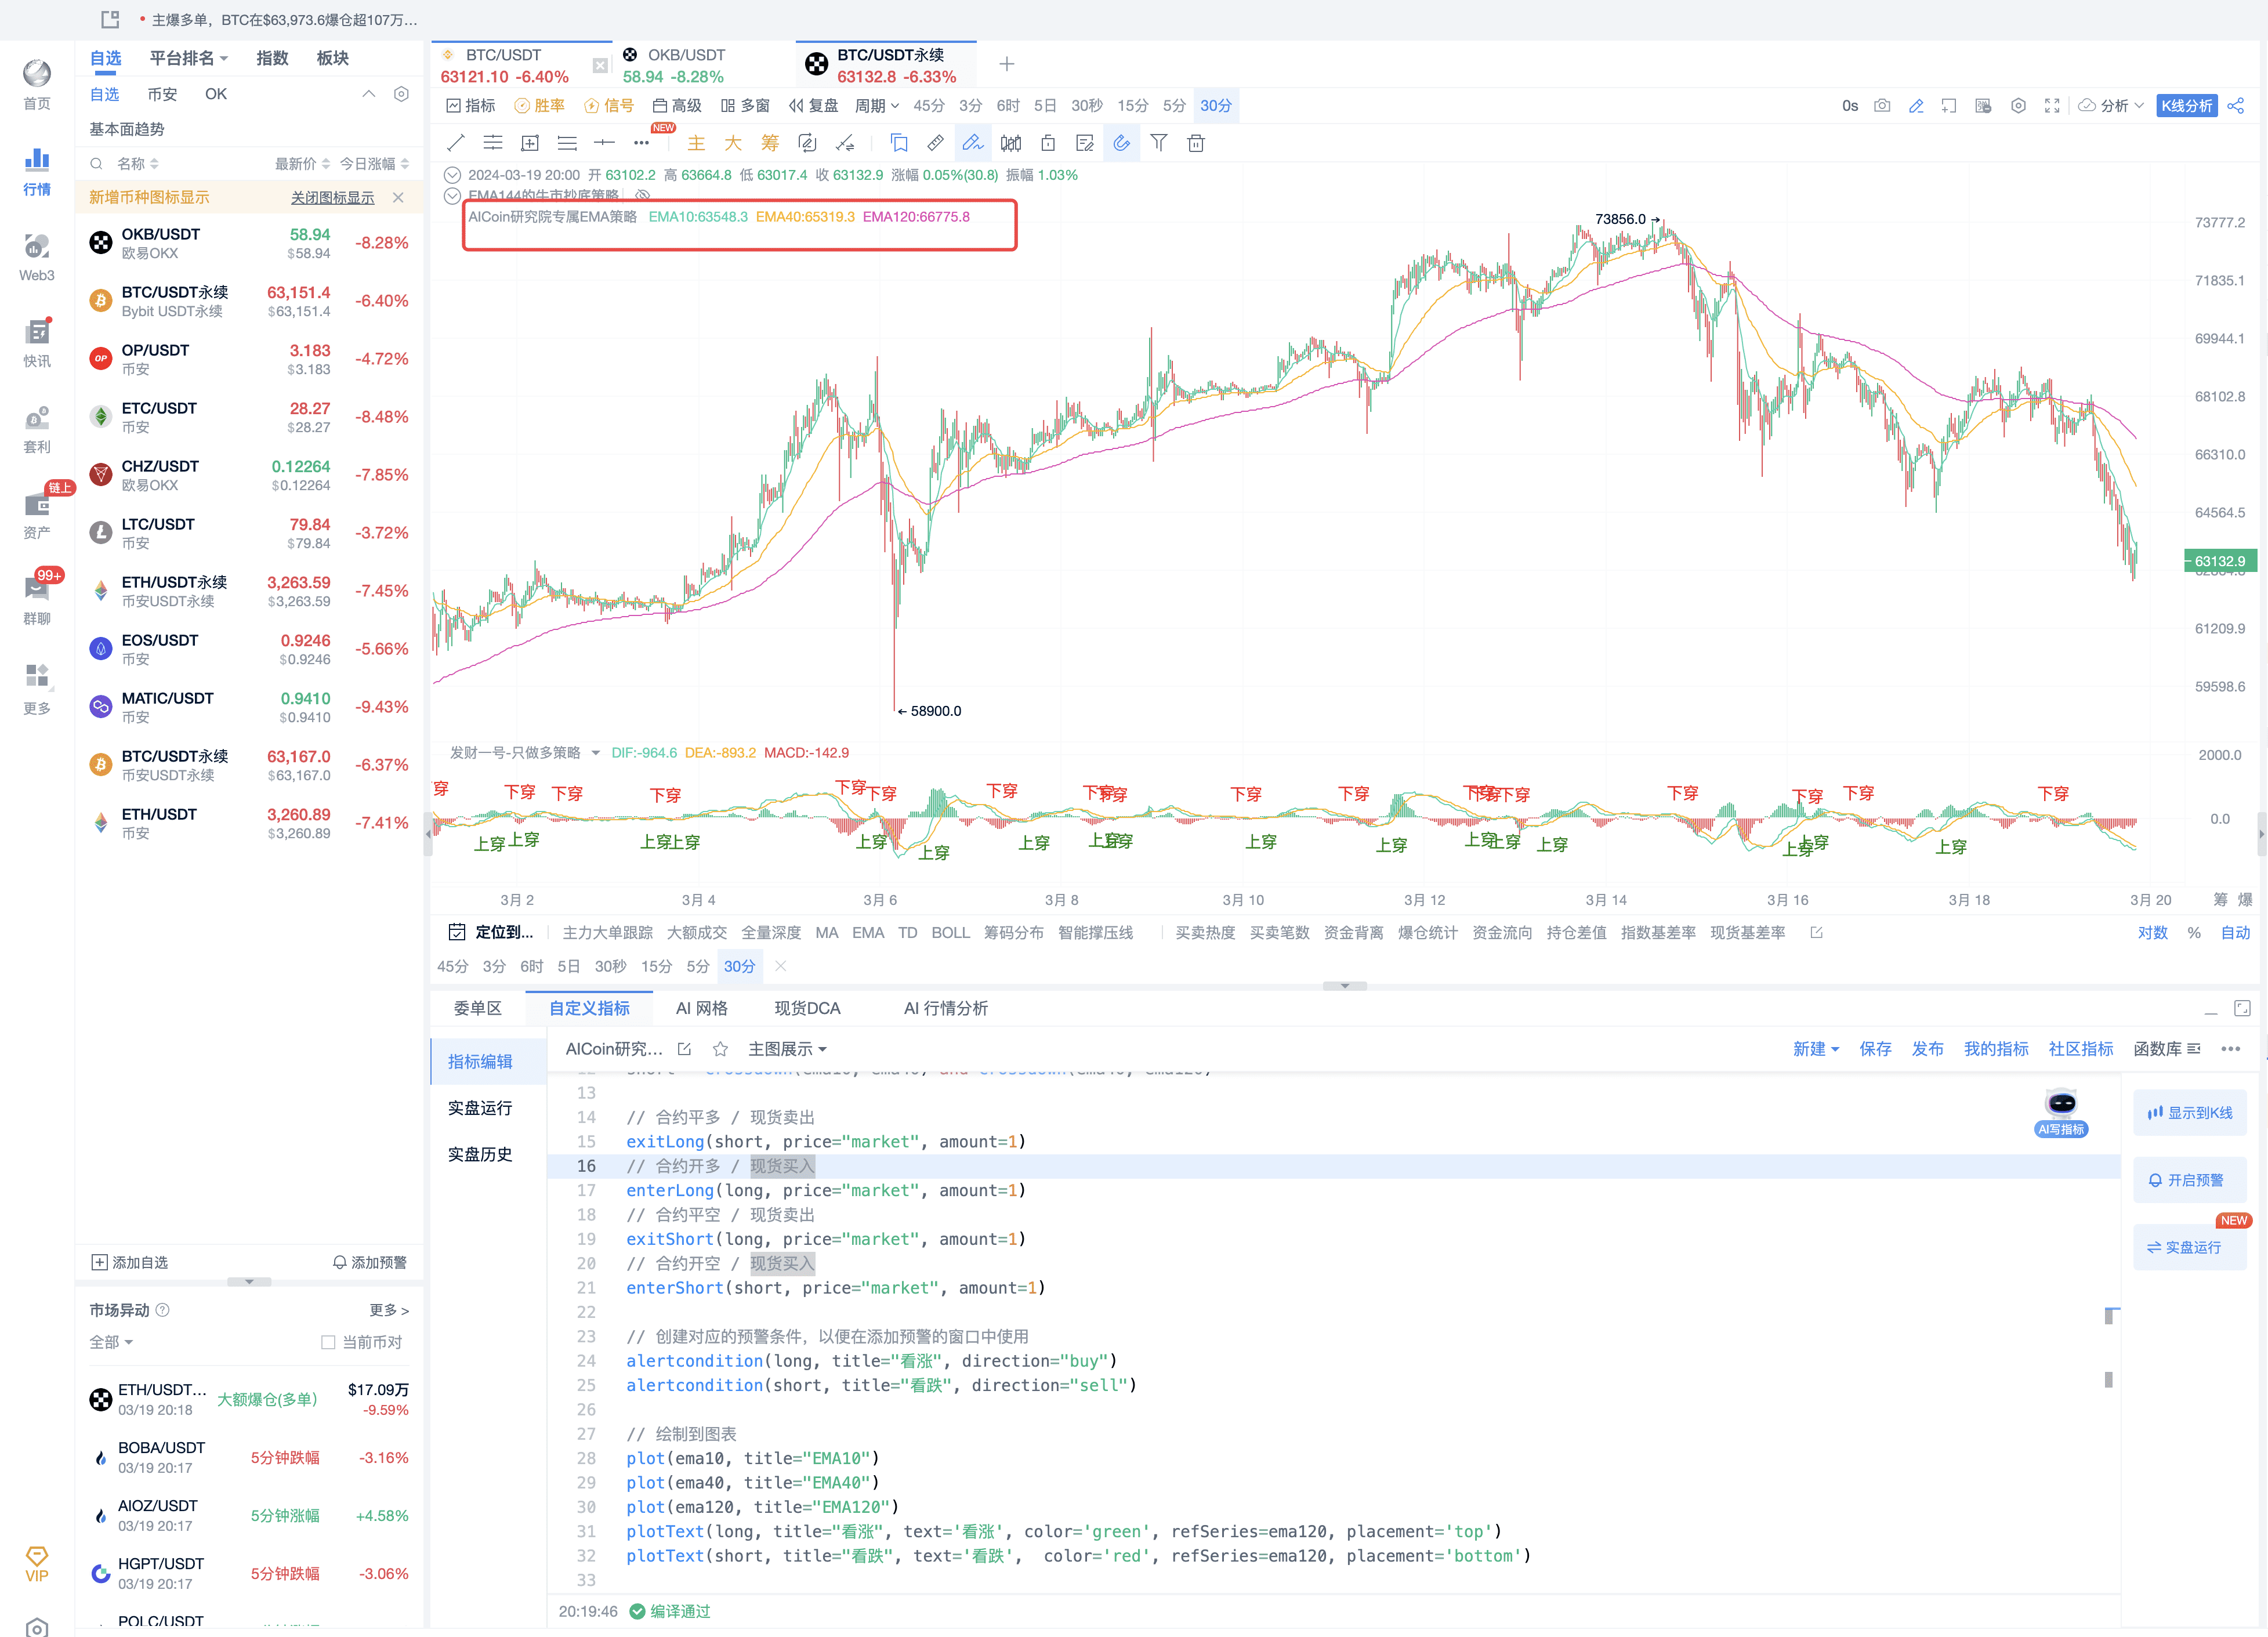
- AI provides a complete strategy, copy the strategy to the custom indicator.
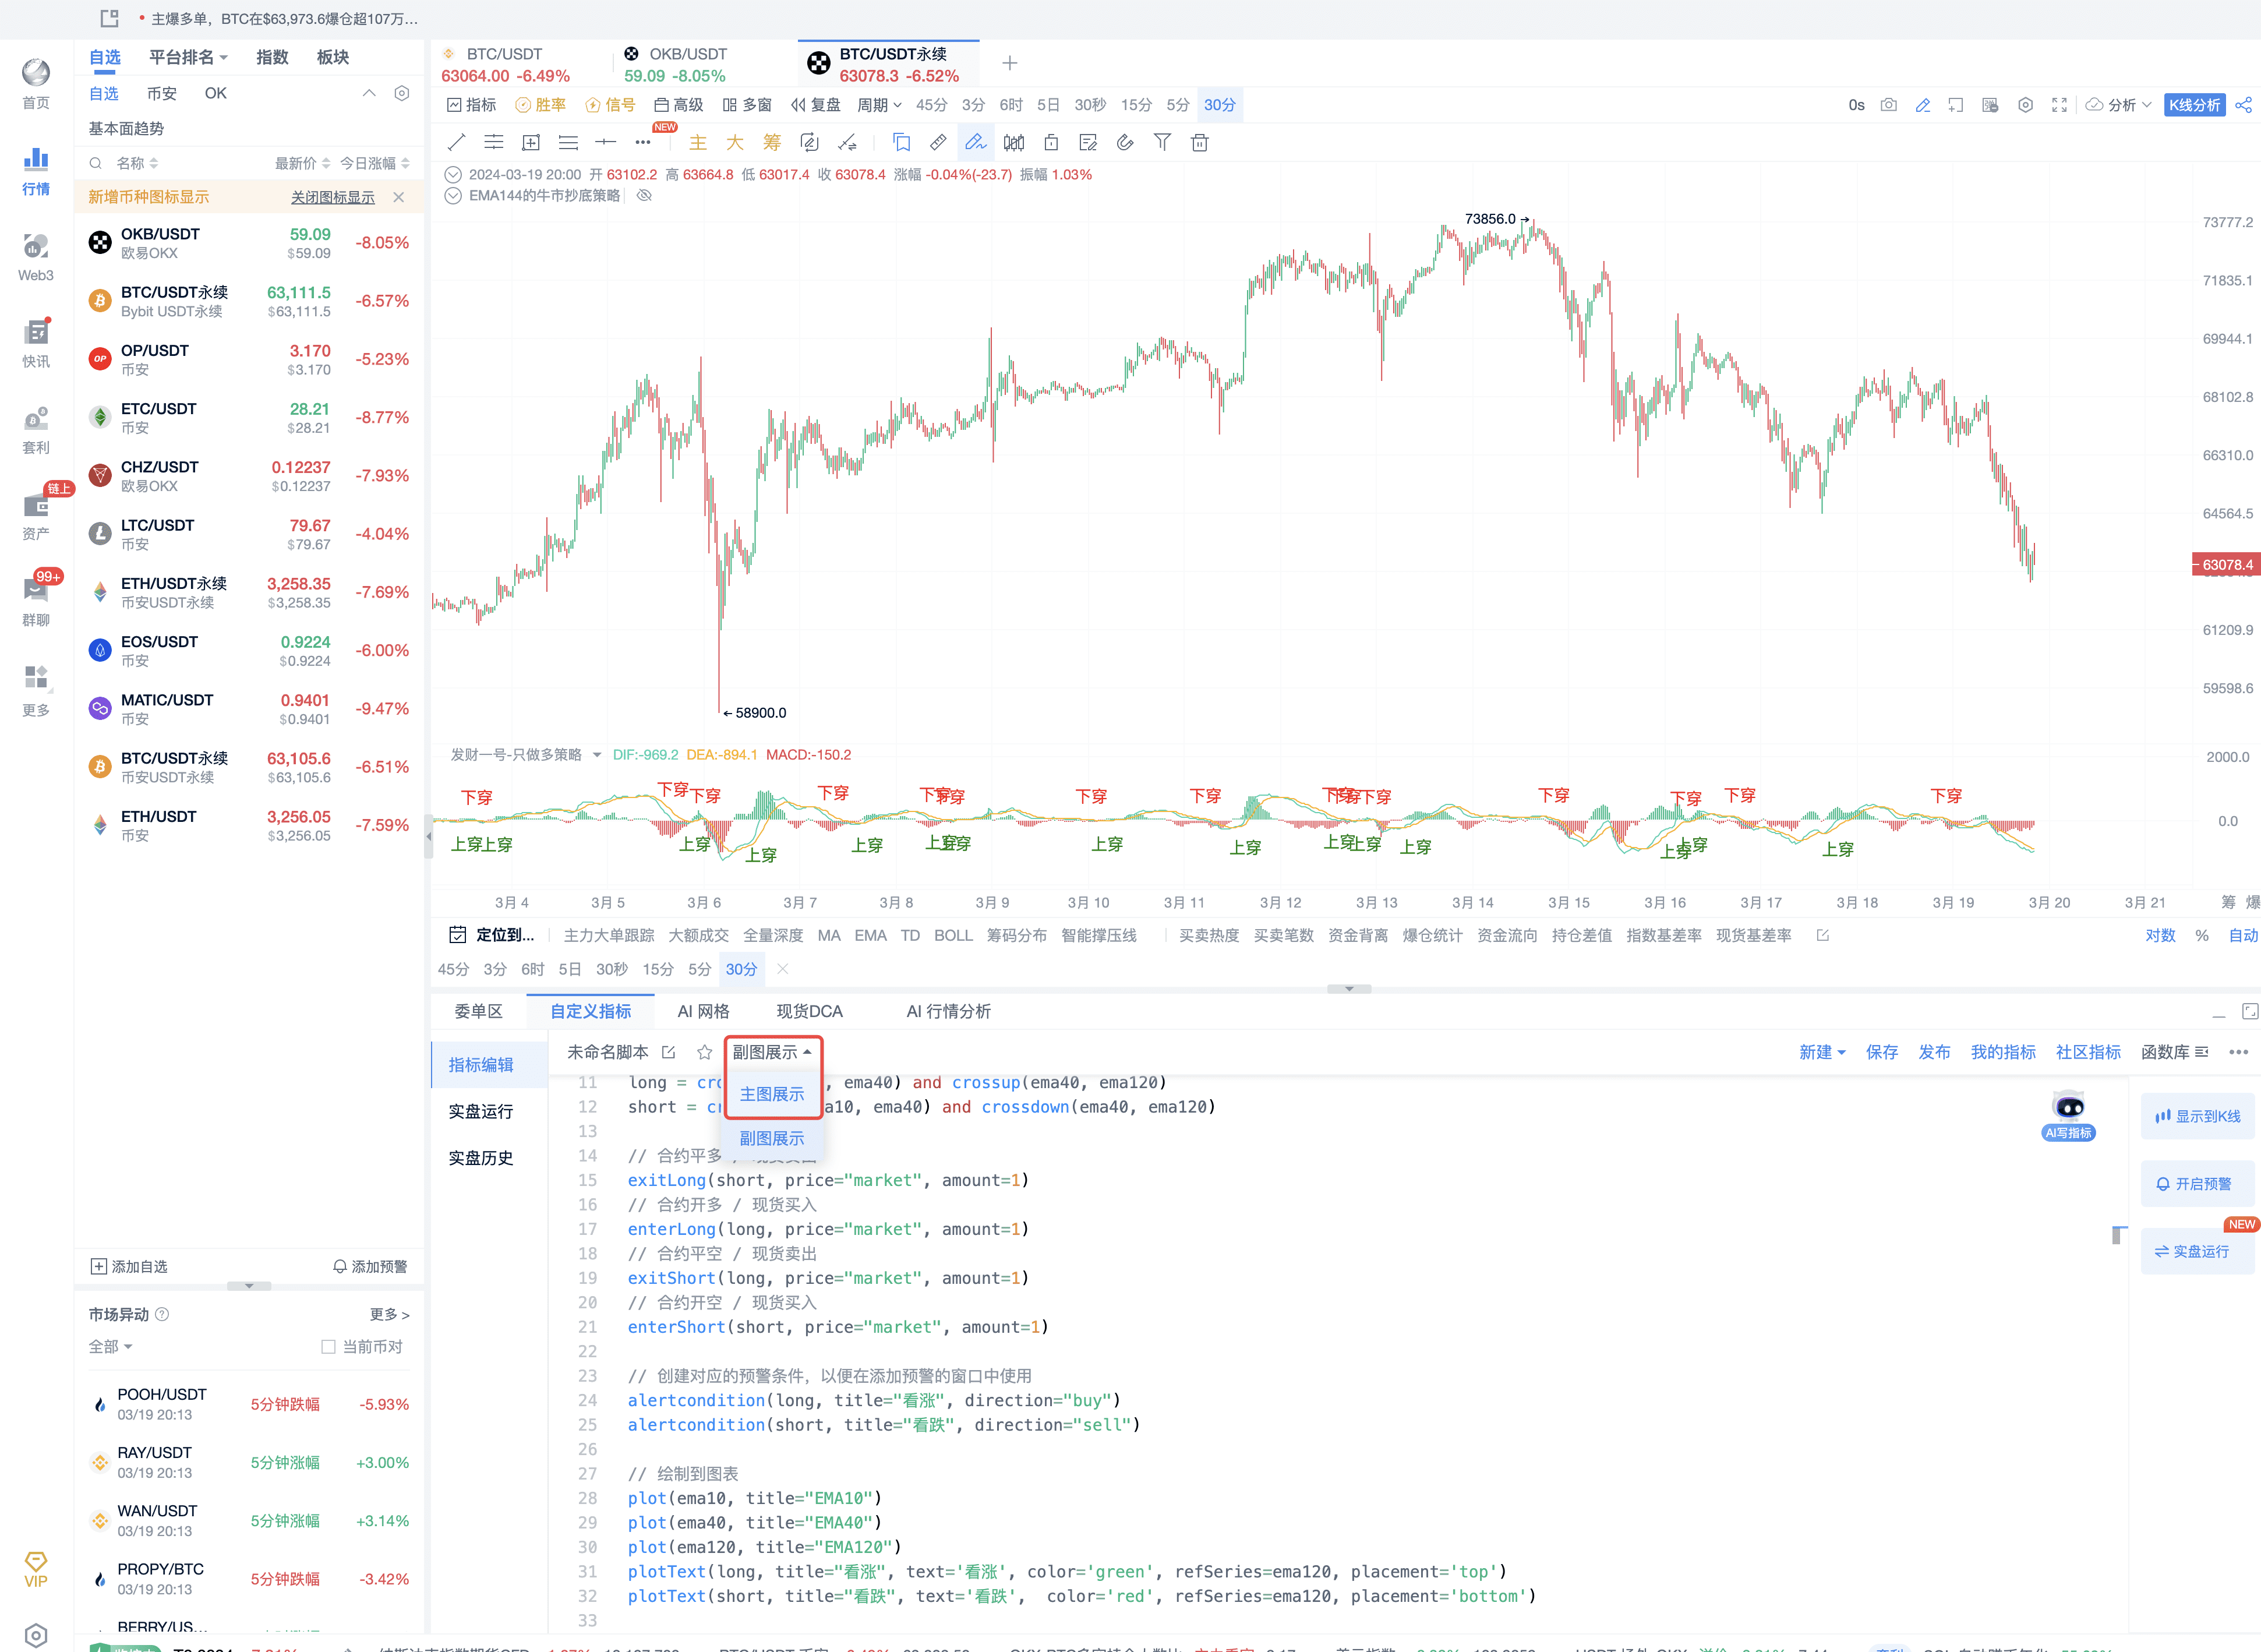
- Click to adjust to display on the main chart as shown in the image below.
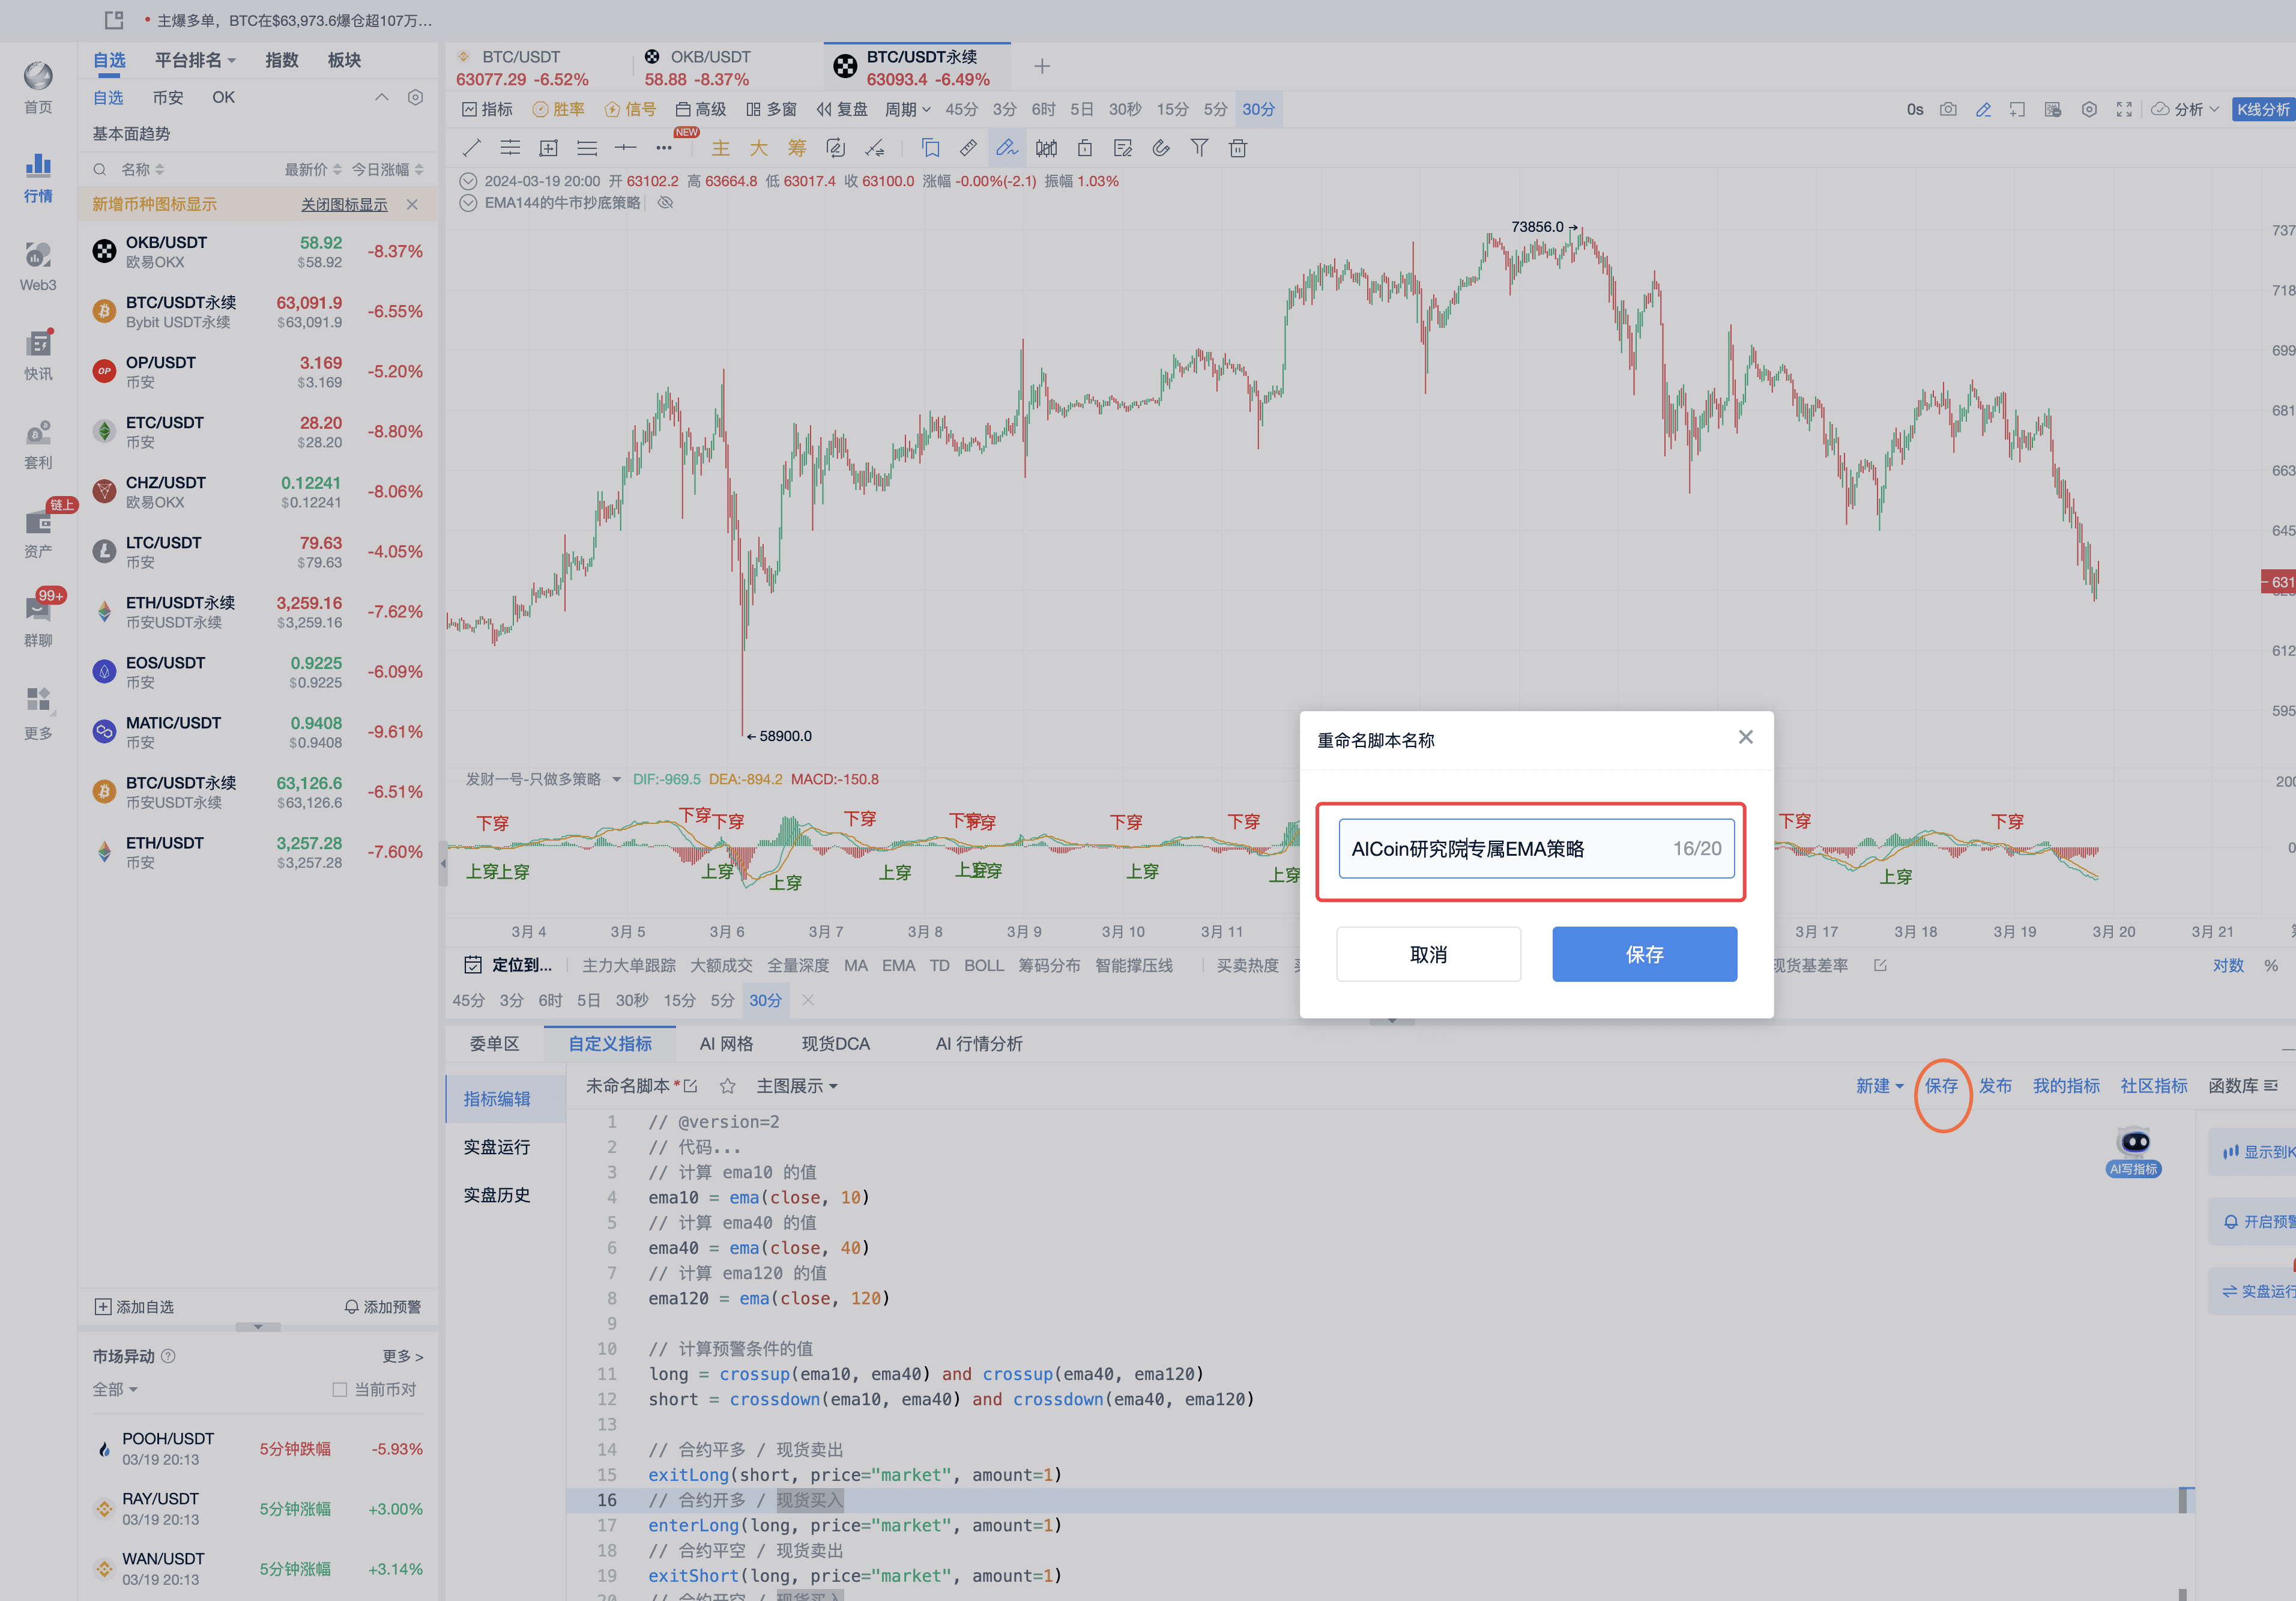
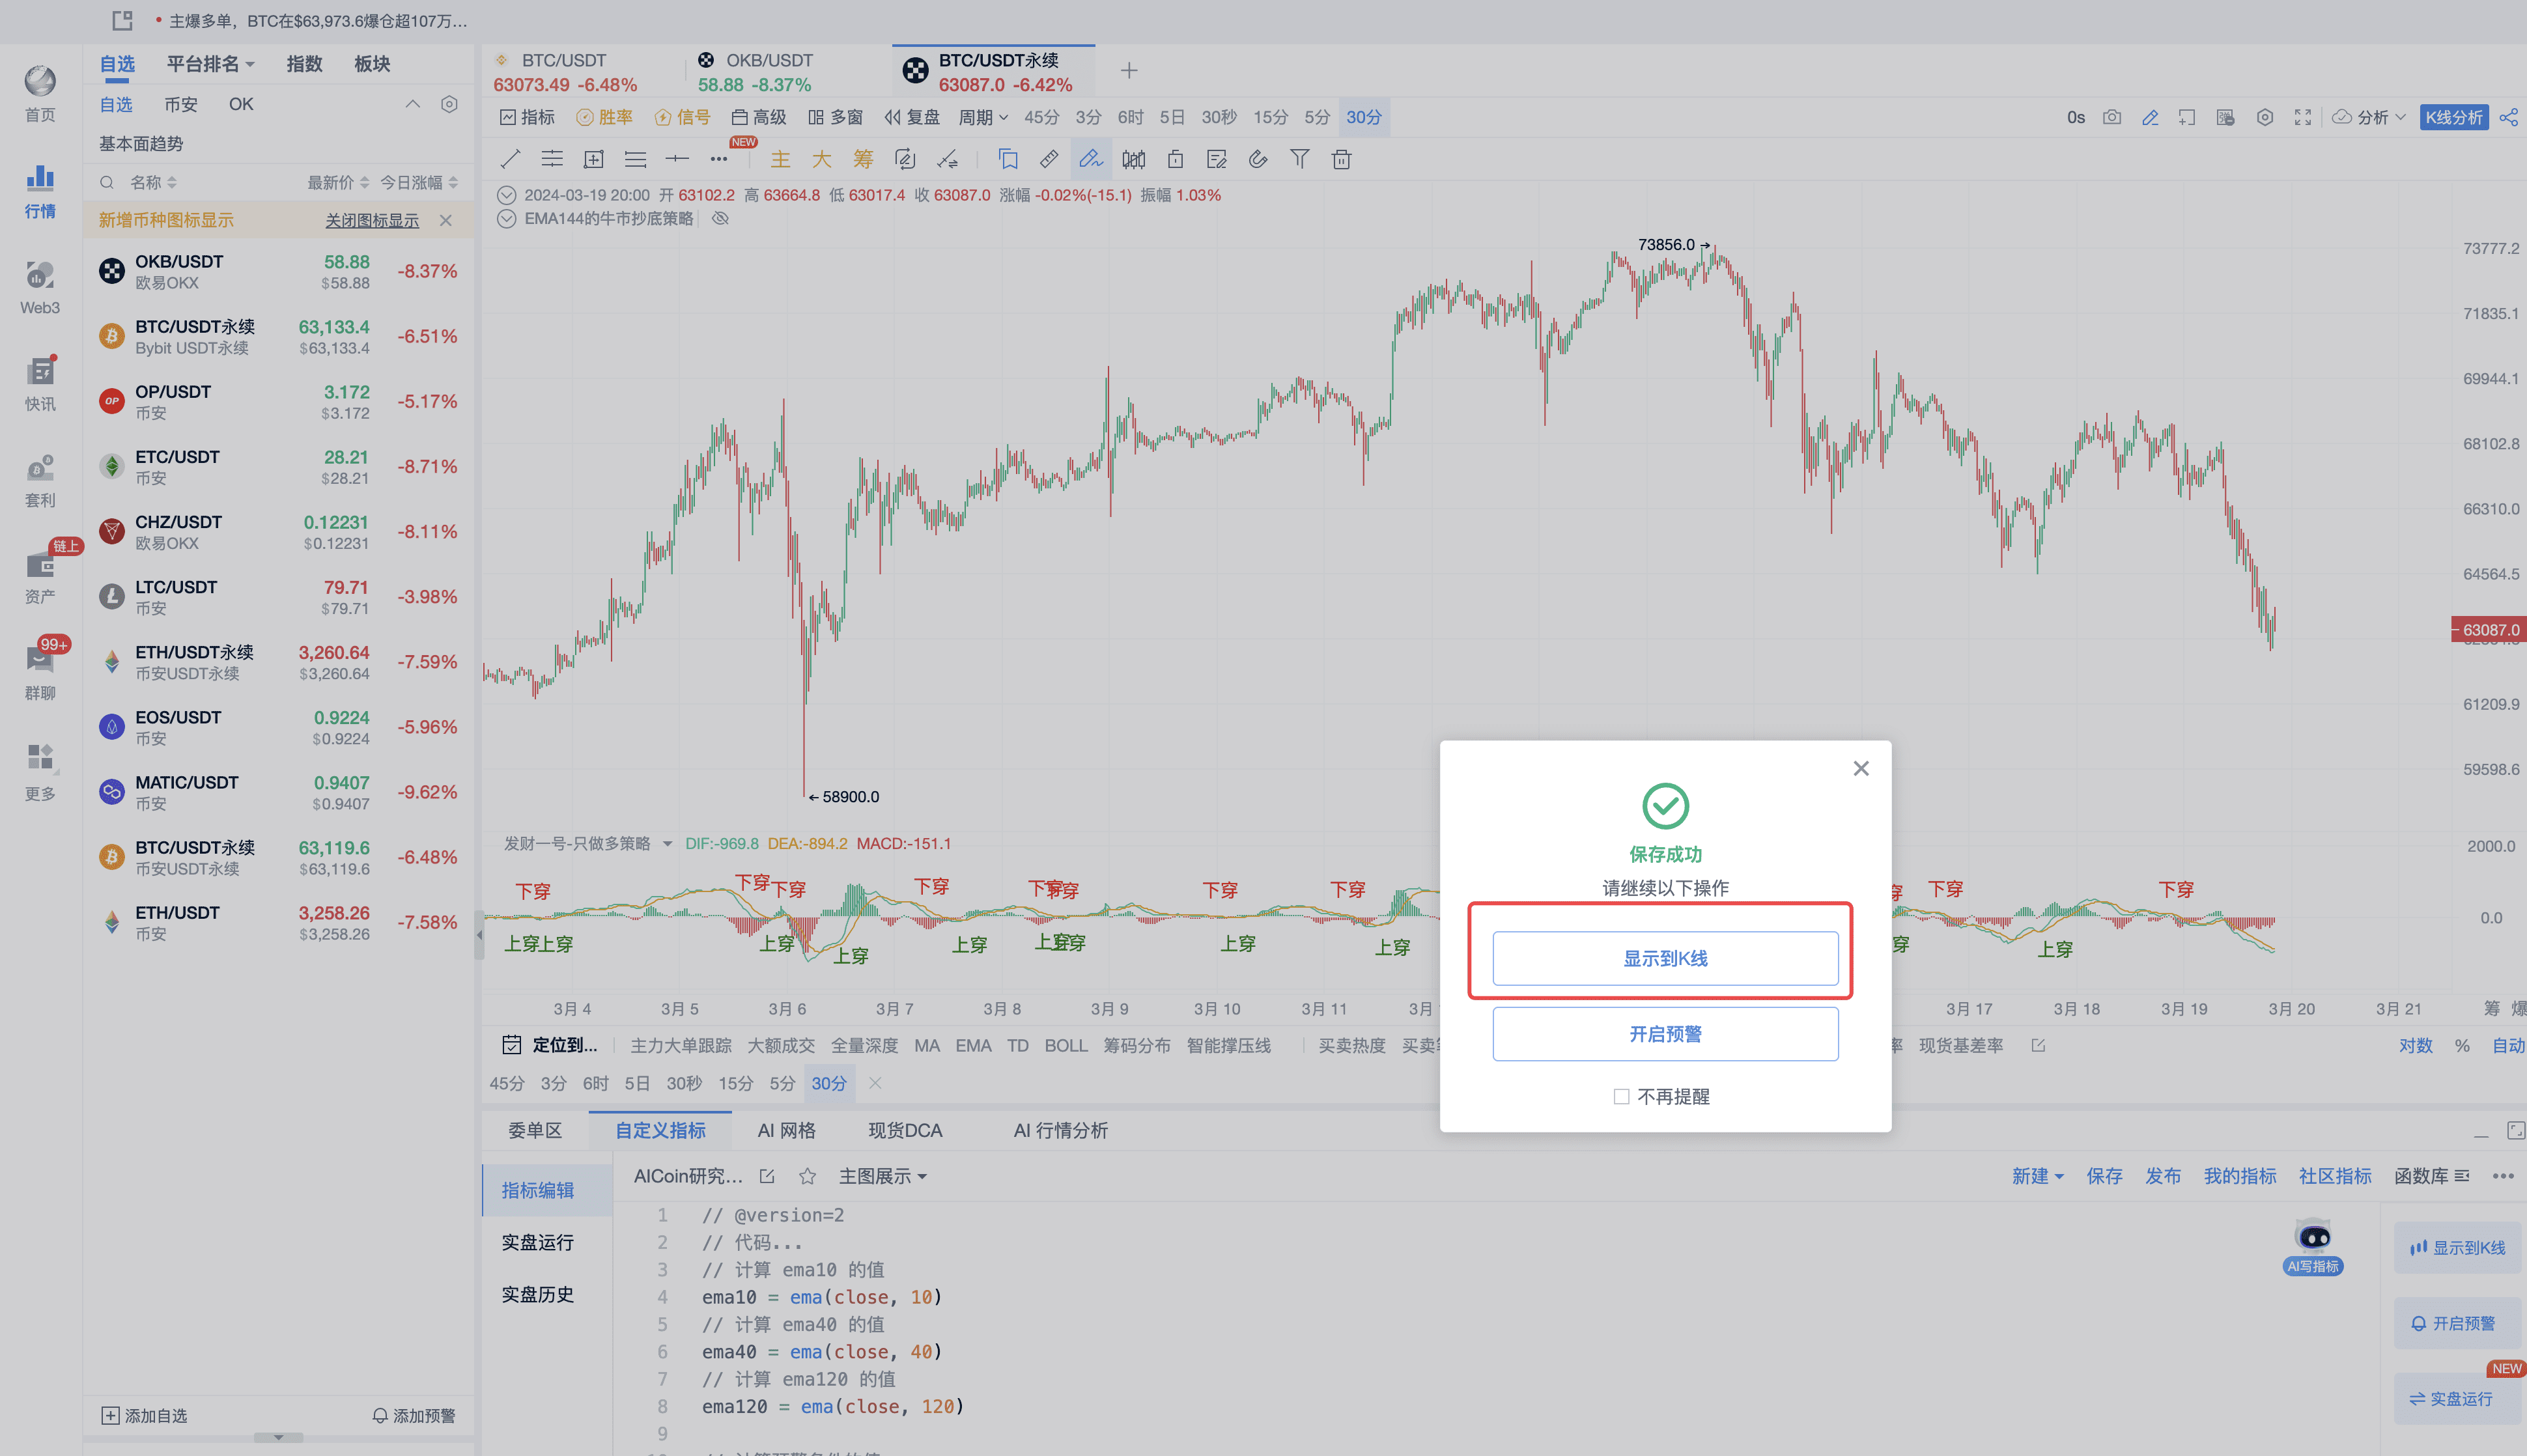
- Rename and save it as shown in the image below.
- Click to display on the candlestick chart.
Show the displayed effect.
III. EMA Signal Display Signal Optimization
Continue to let AI optimize and display the signal.
- Operations that do not meet the criteria. Ask AI to write a strategy based on the core algorithm: When EMA10 crosses above EMA40 and simultaneously crosses above EMA120, go long, and mark the long signal in green on the candlestick chart; when EMA10 crosses below EMA40 and simultaneously crosses below EMA120, go short and mark the short signal in red on the candlestick chart. AI replies that the displayed effect clearly does not meet our strategy.
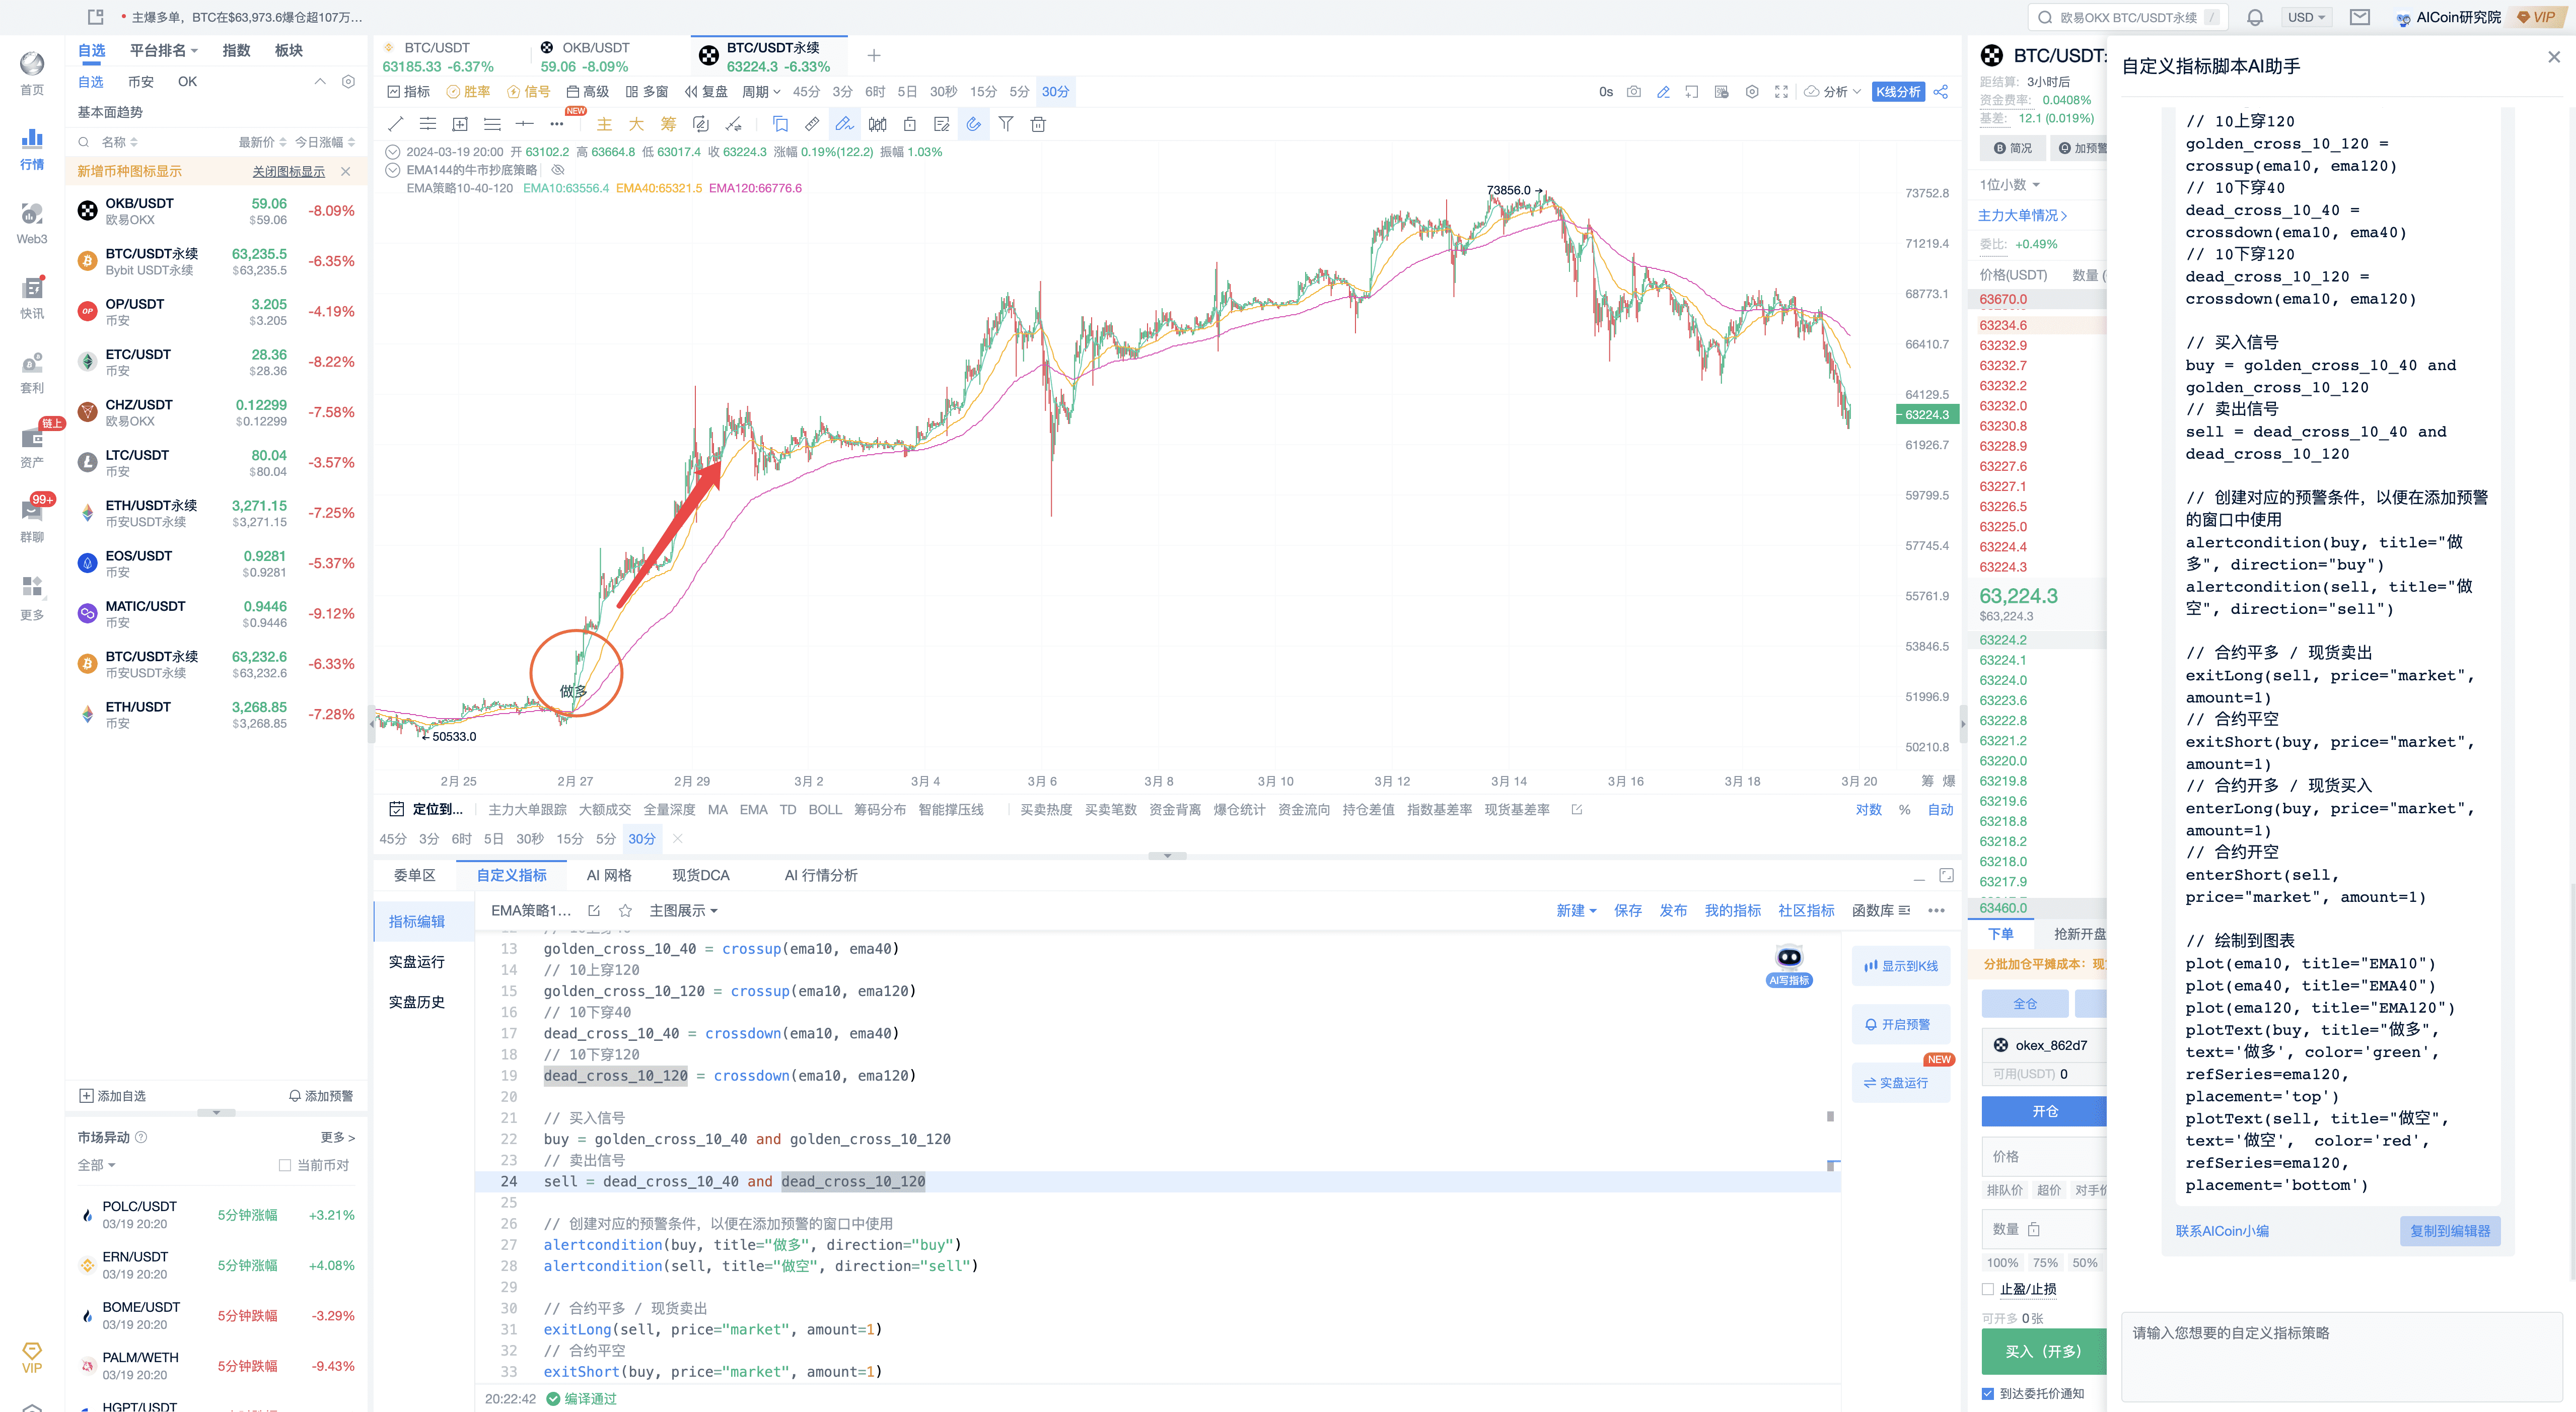
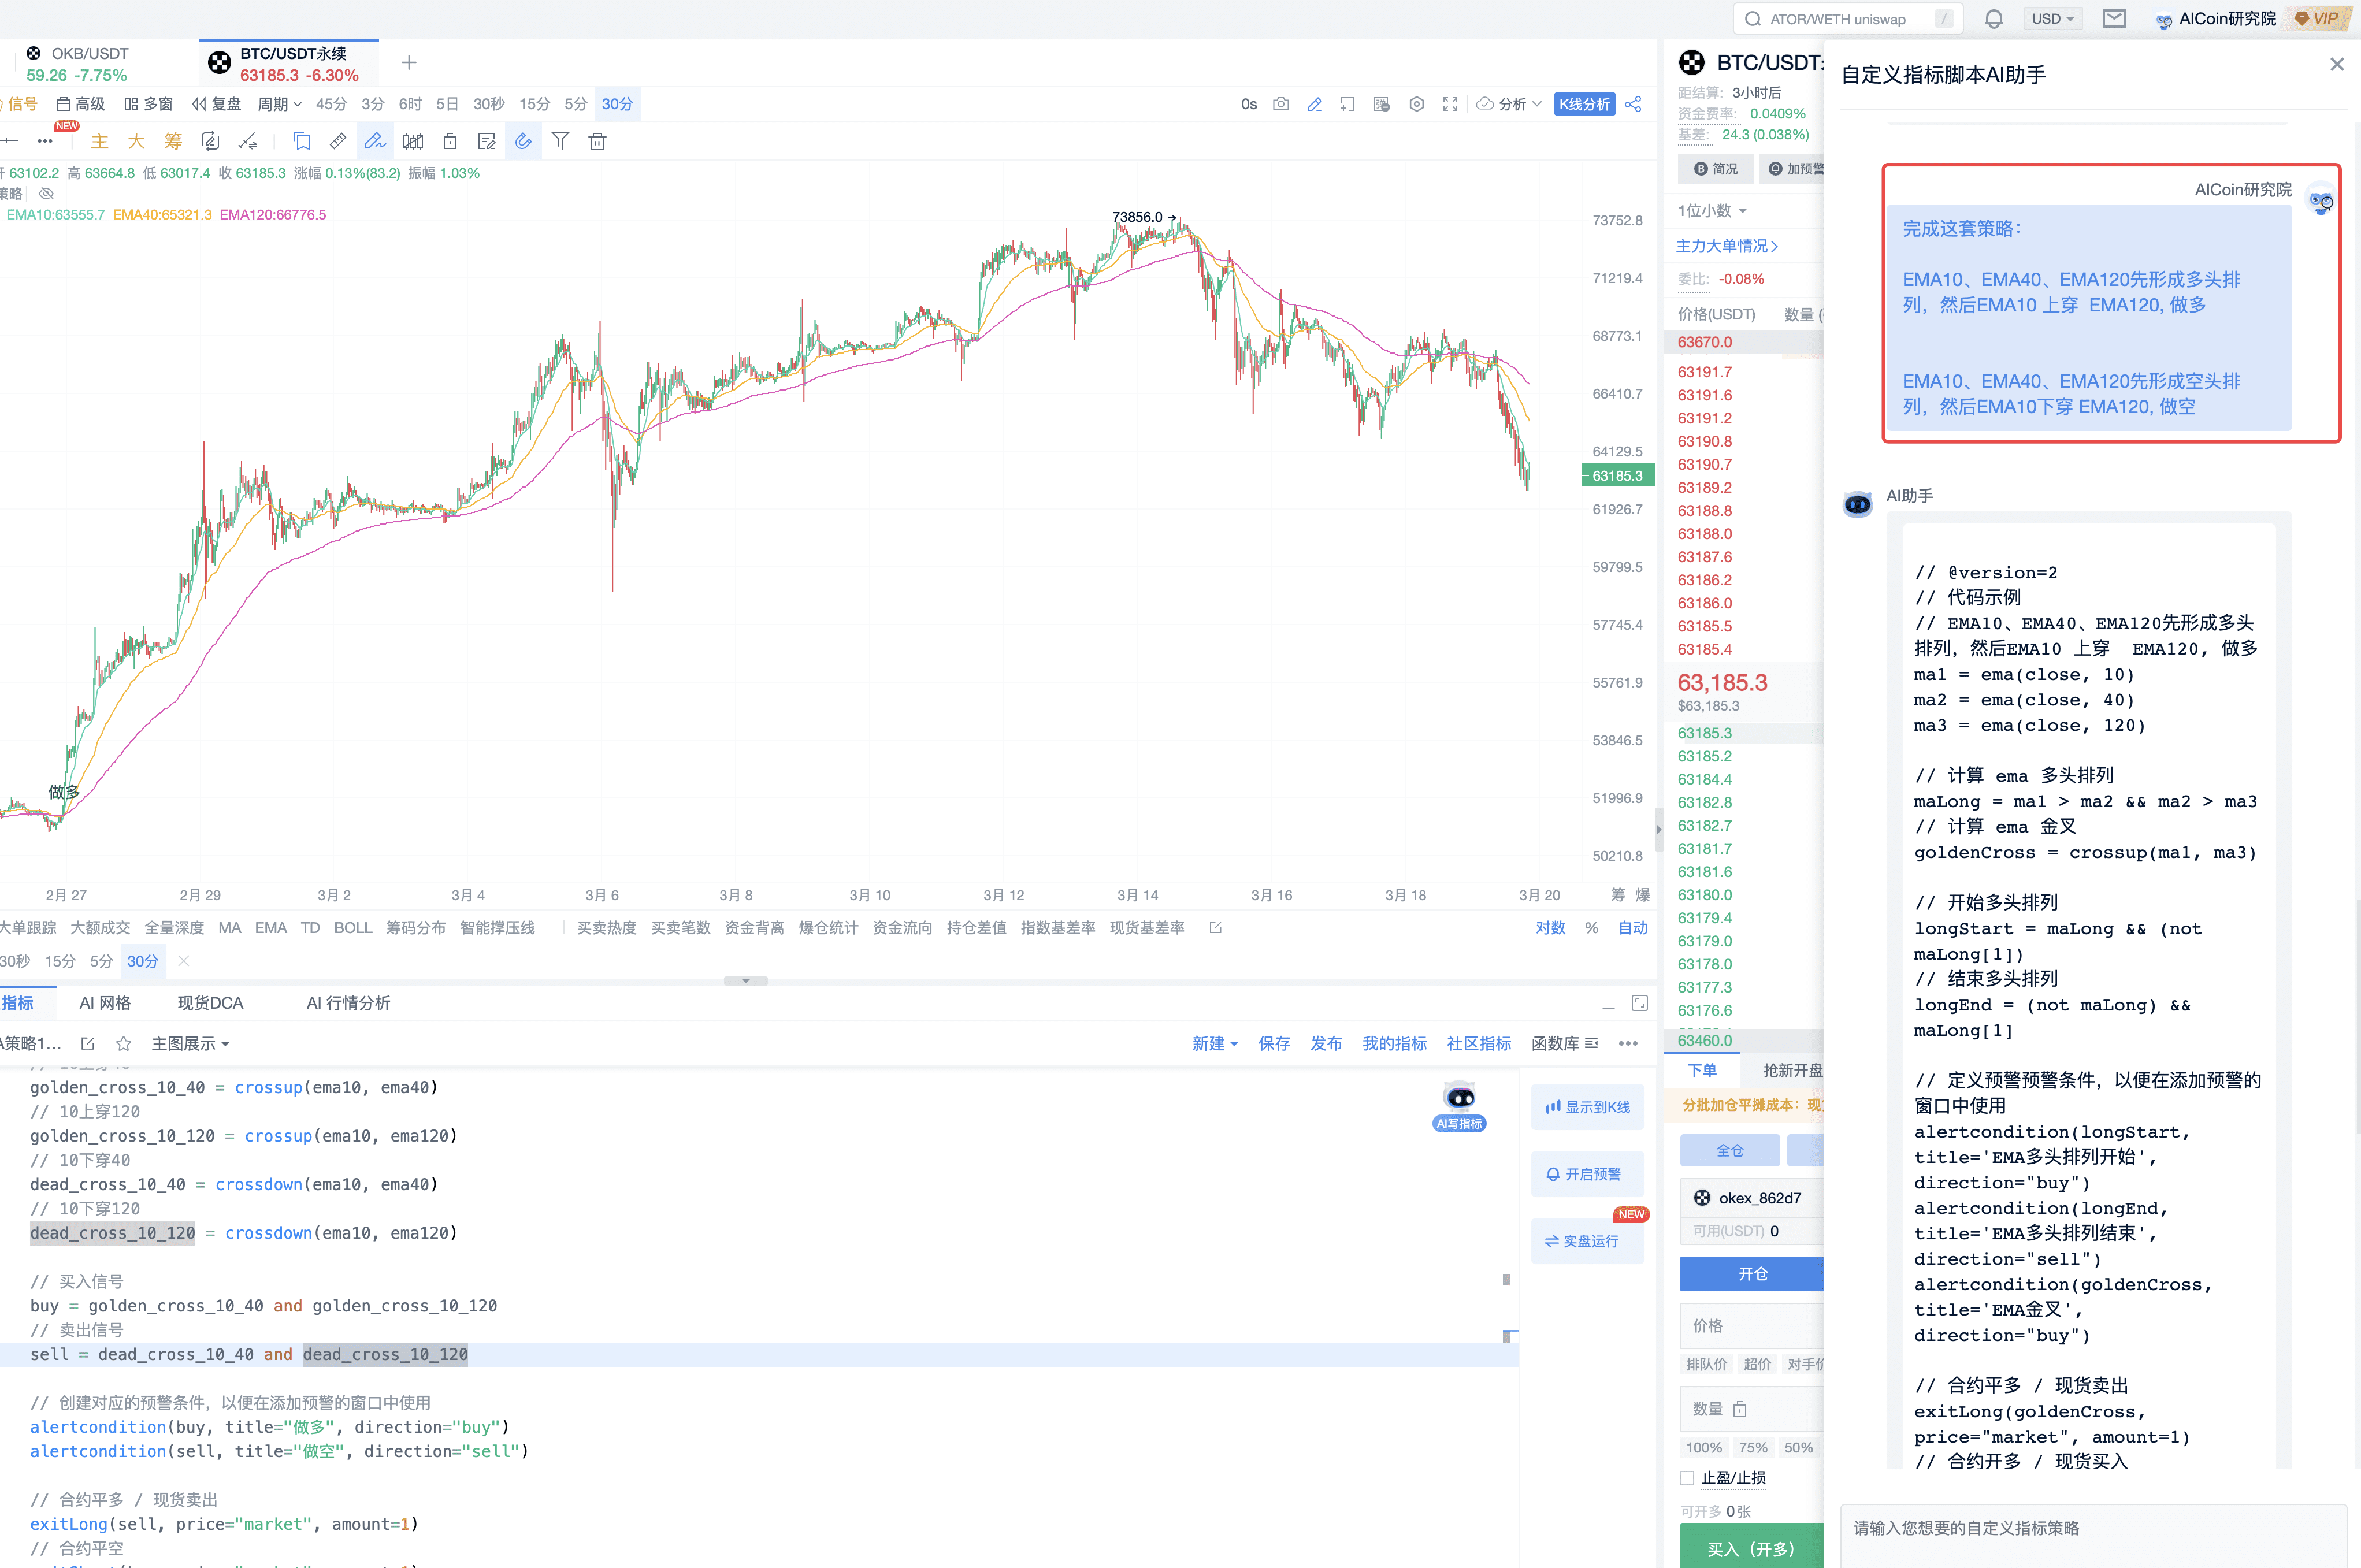
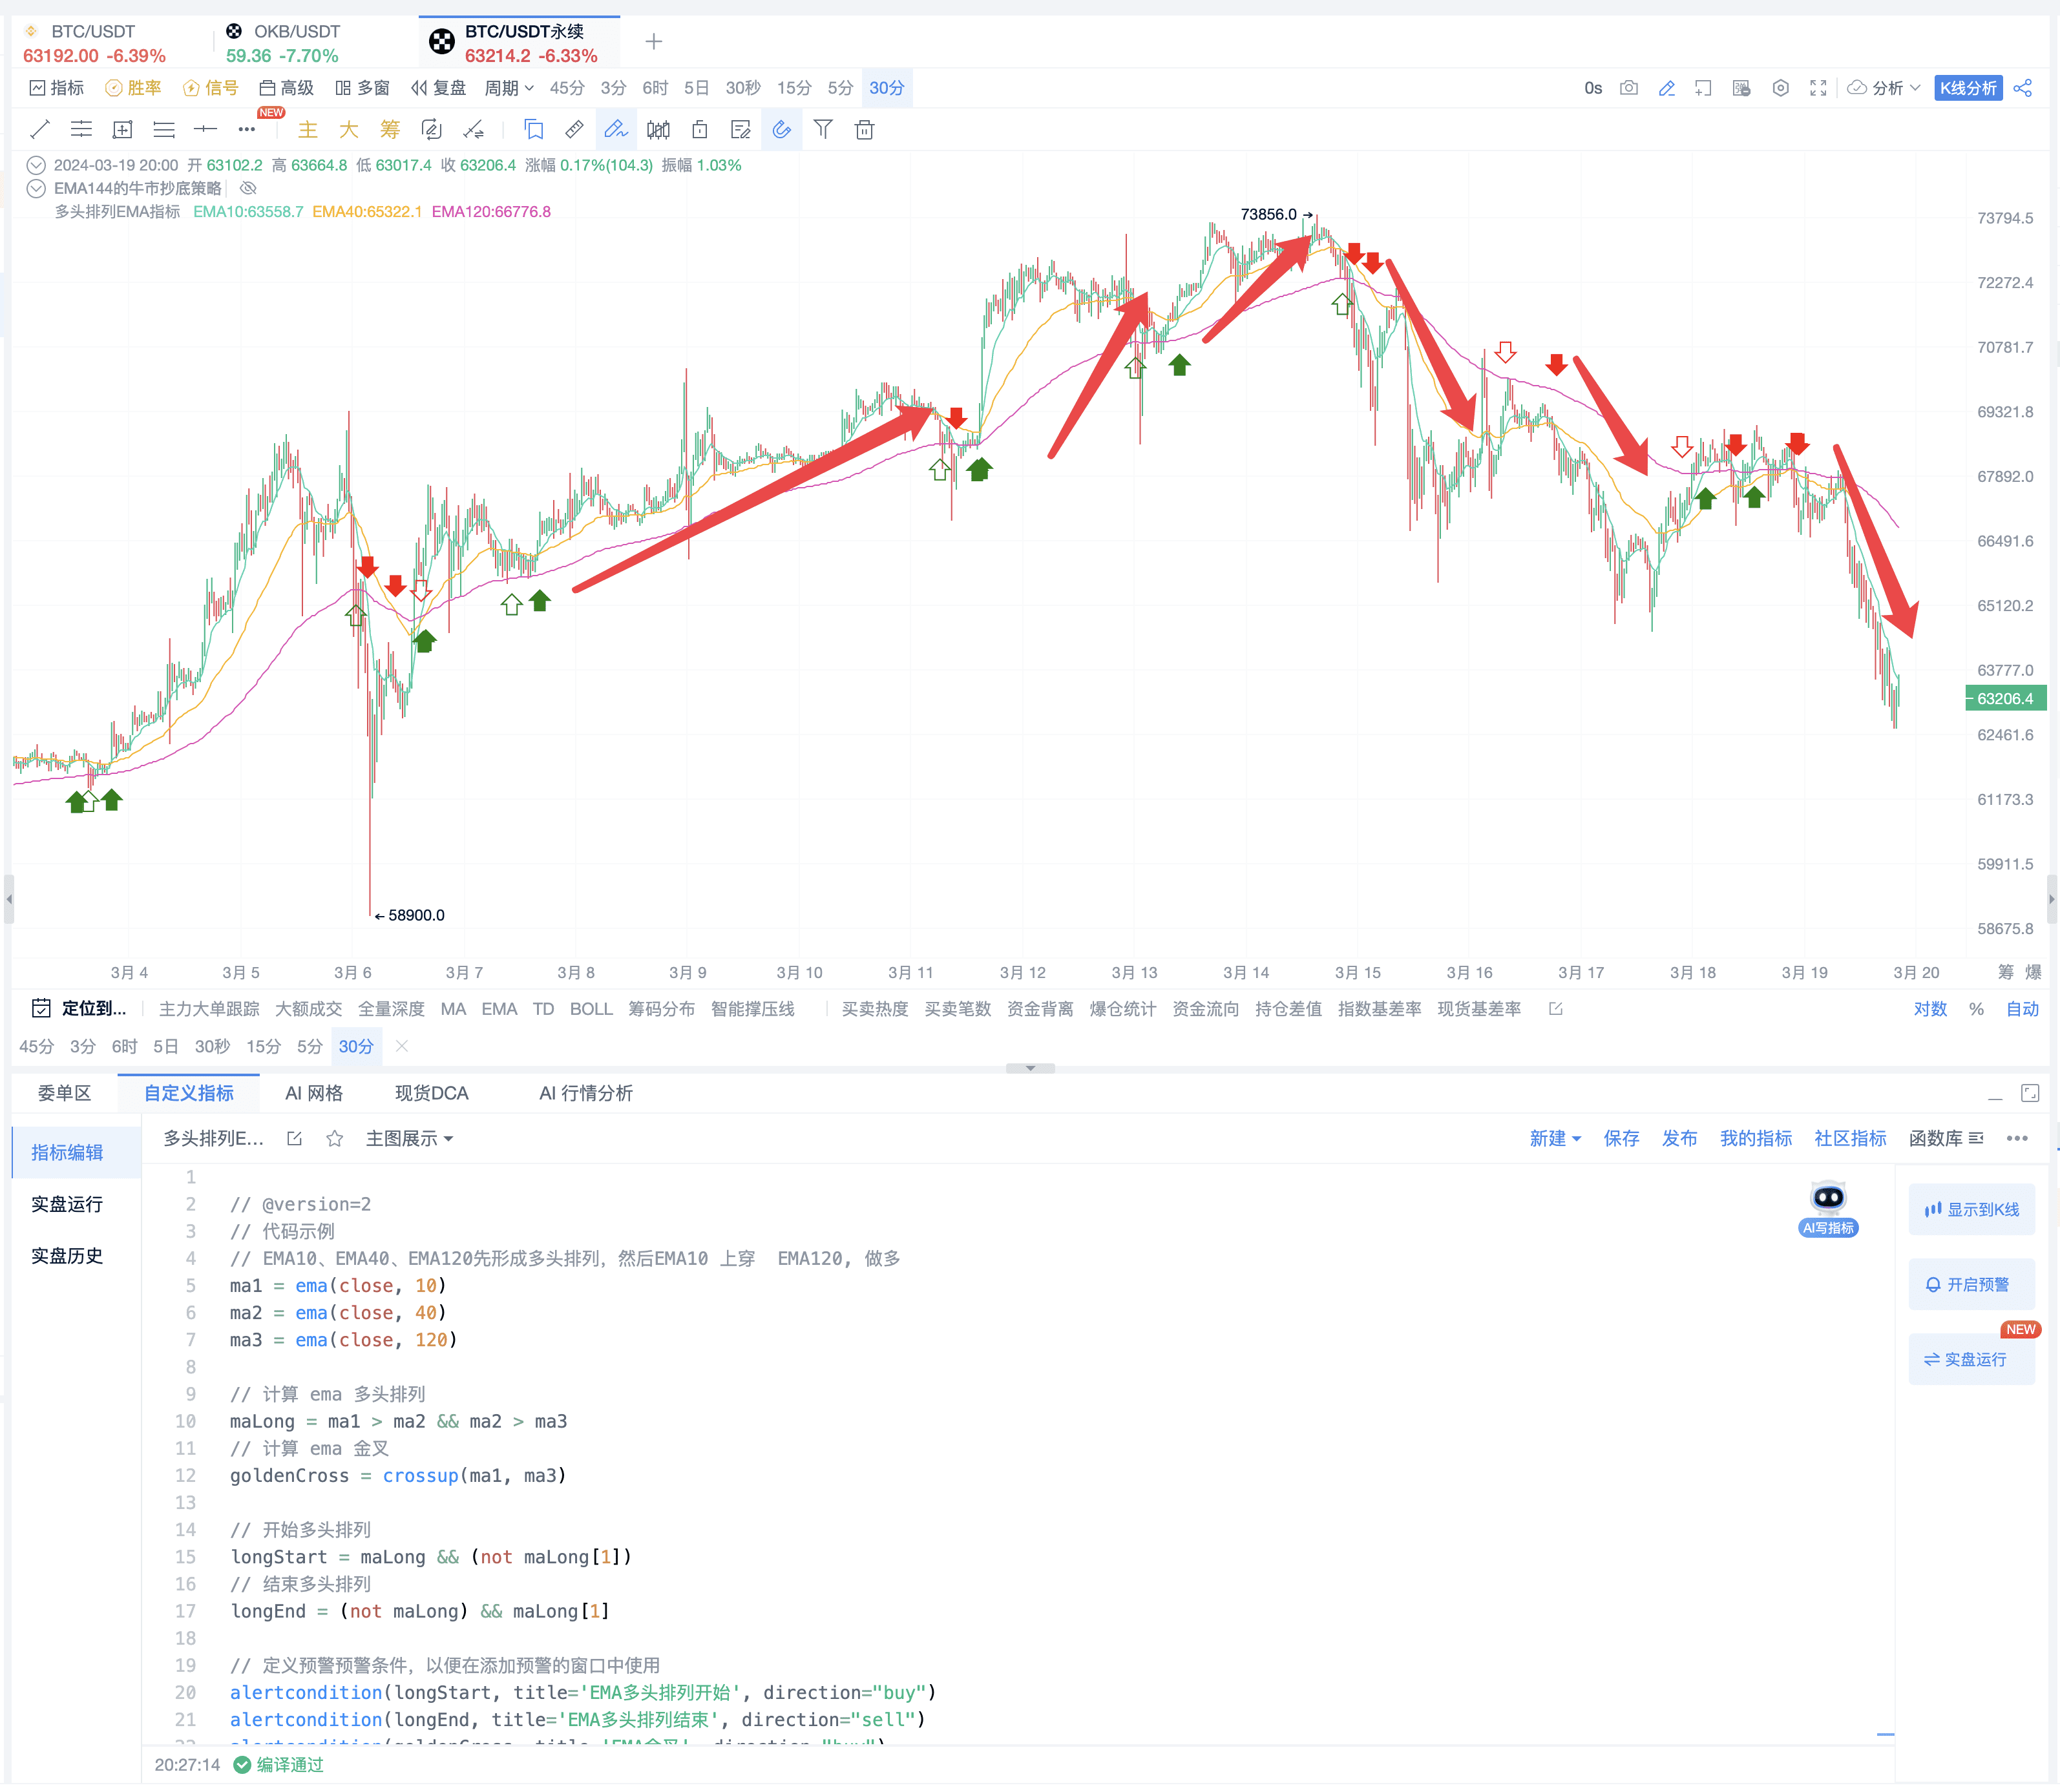
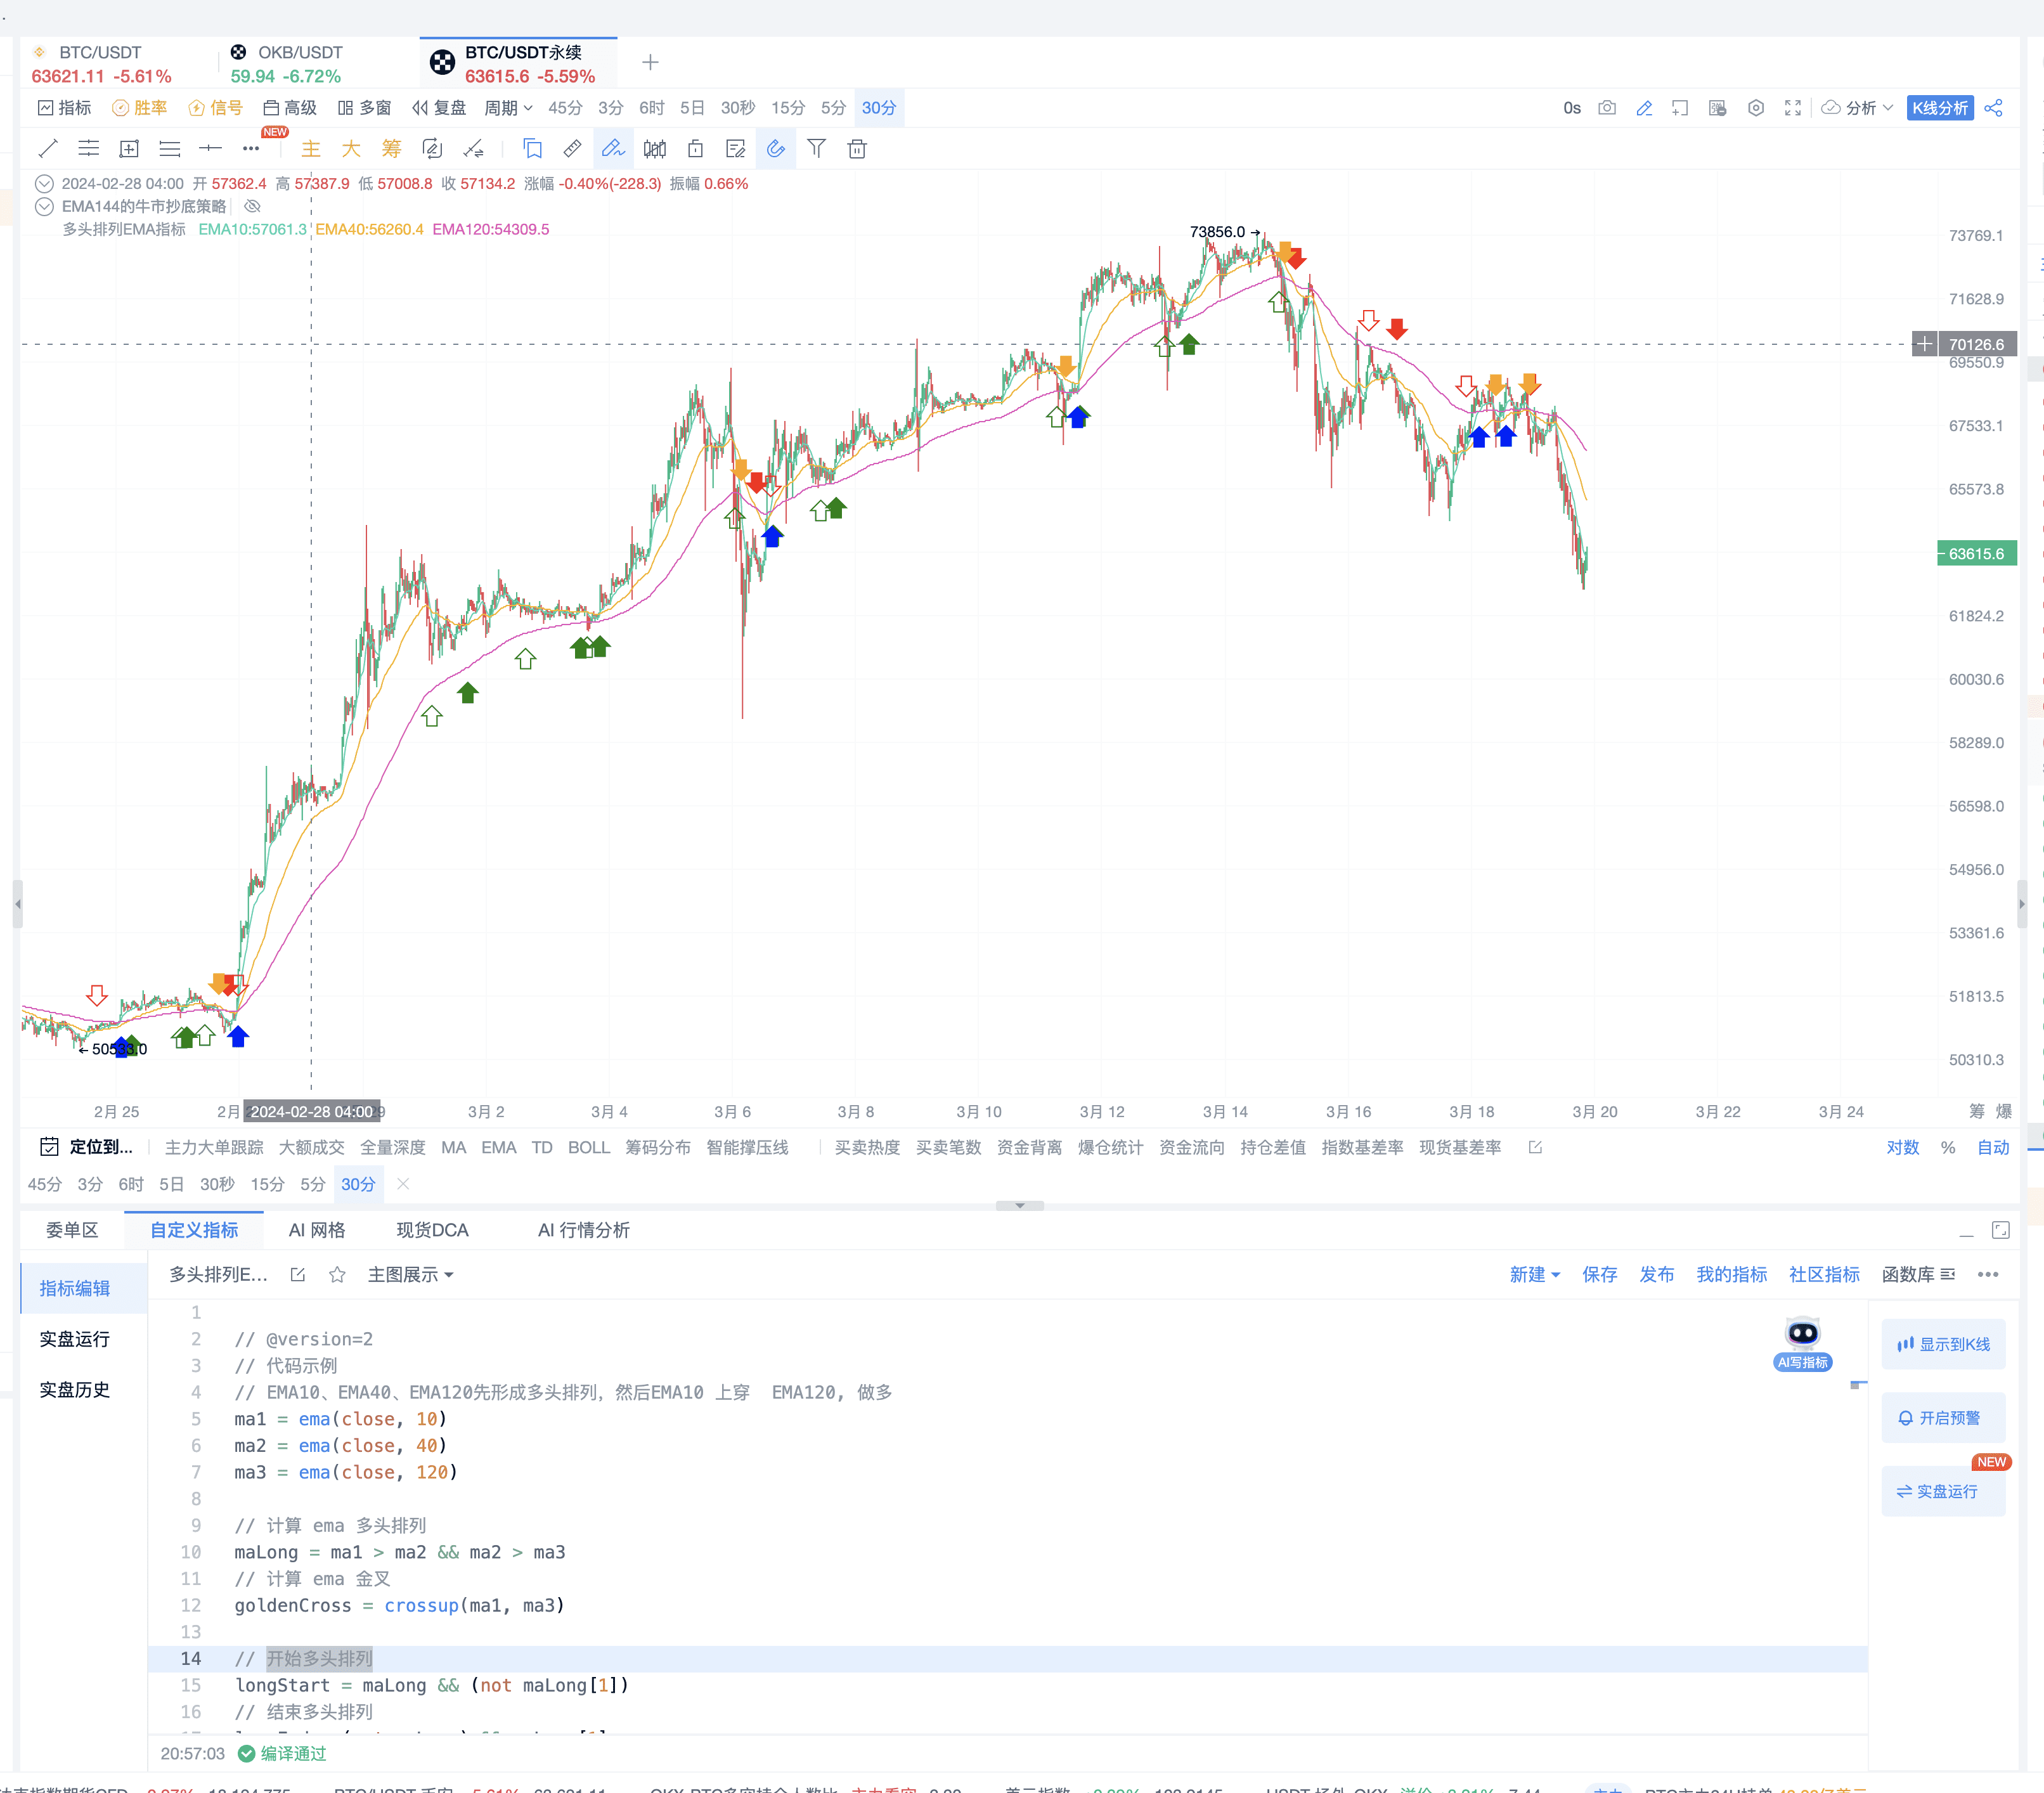
- Normal display effect optimization. Ask AI to write a strategy based on the core algorithm: When EMA10, EMA40, and EMA120 form a bullish arrangement first, then EMA10 crosses above EMA120, go long; when EMA10, EMA40, and EMA120 form a bearish arrangement first, then EMA10 crosses below EMA120, go short. AI replies with the effect shown in the image below.
This strategy's effect has started off well and can capture many major trends.
IV. EMA Strategy Implementation for Automated Trading
- The AI assistant implements the end of the bullish arrangement, considering where the bullish arrangement ends.
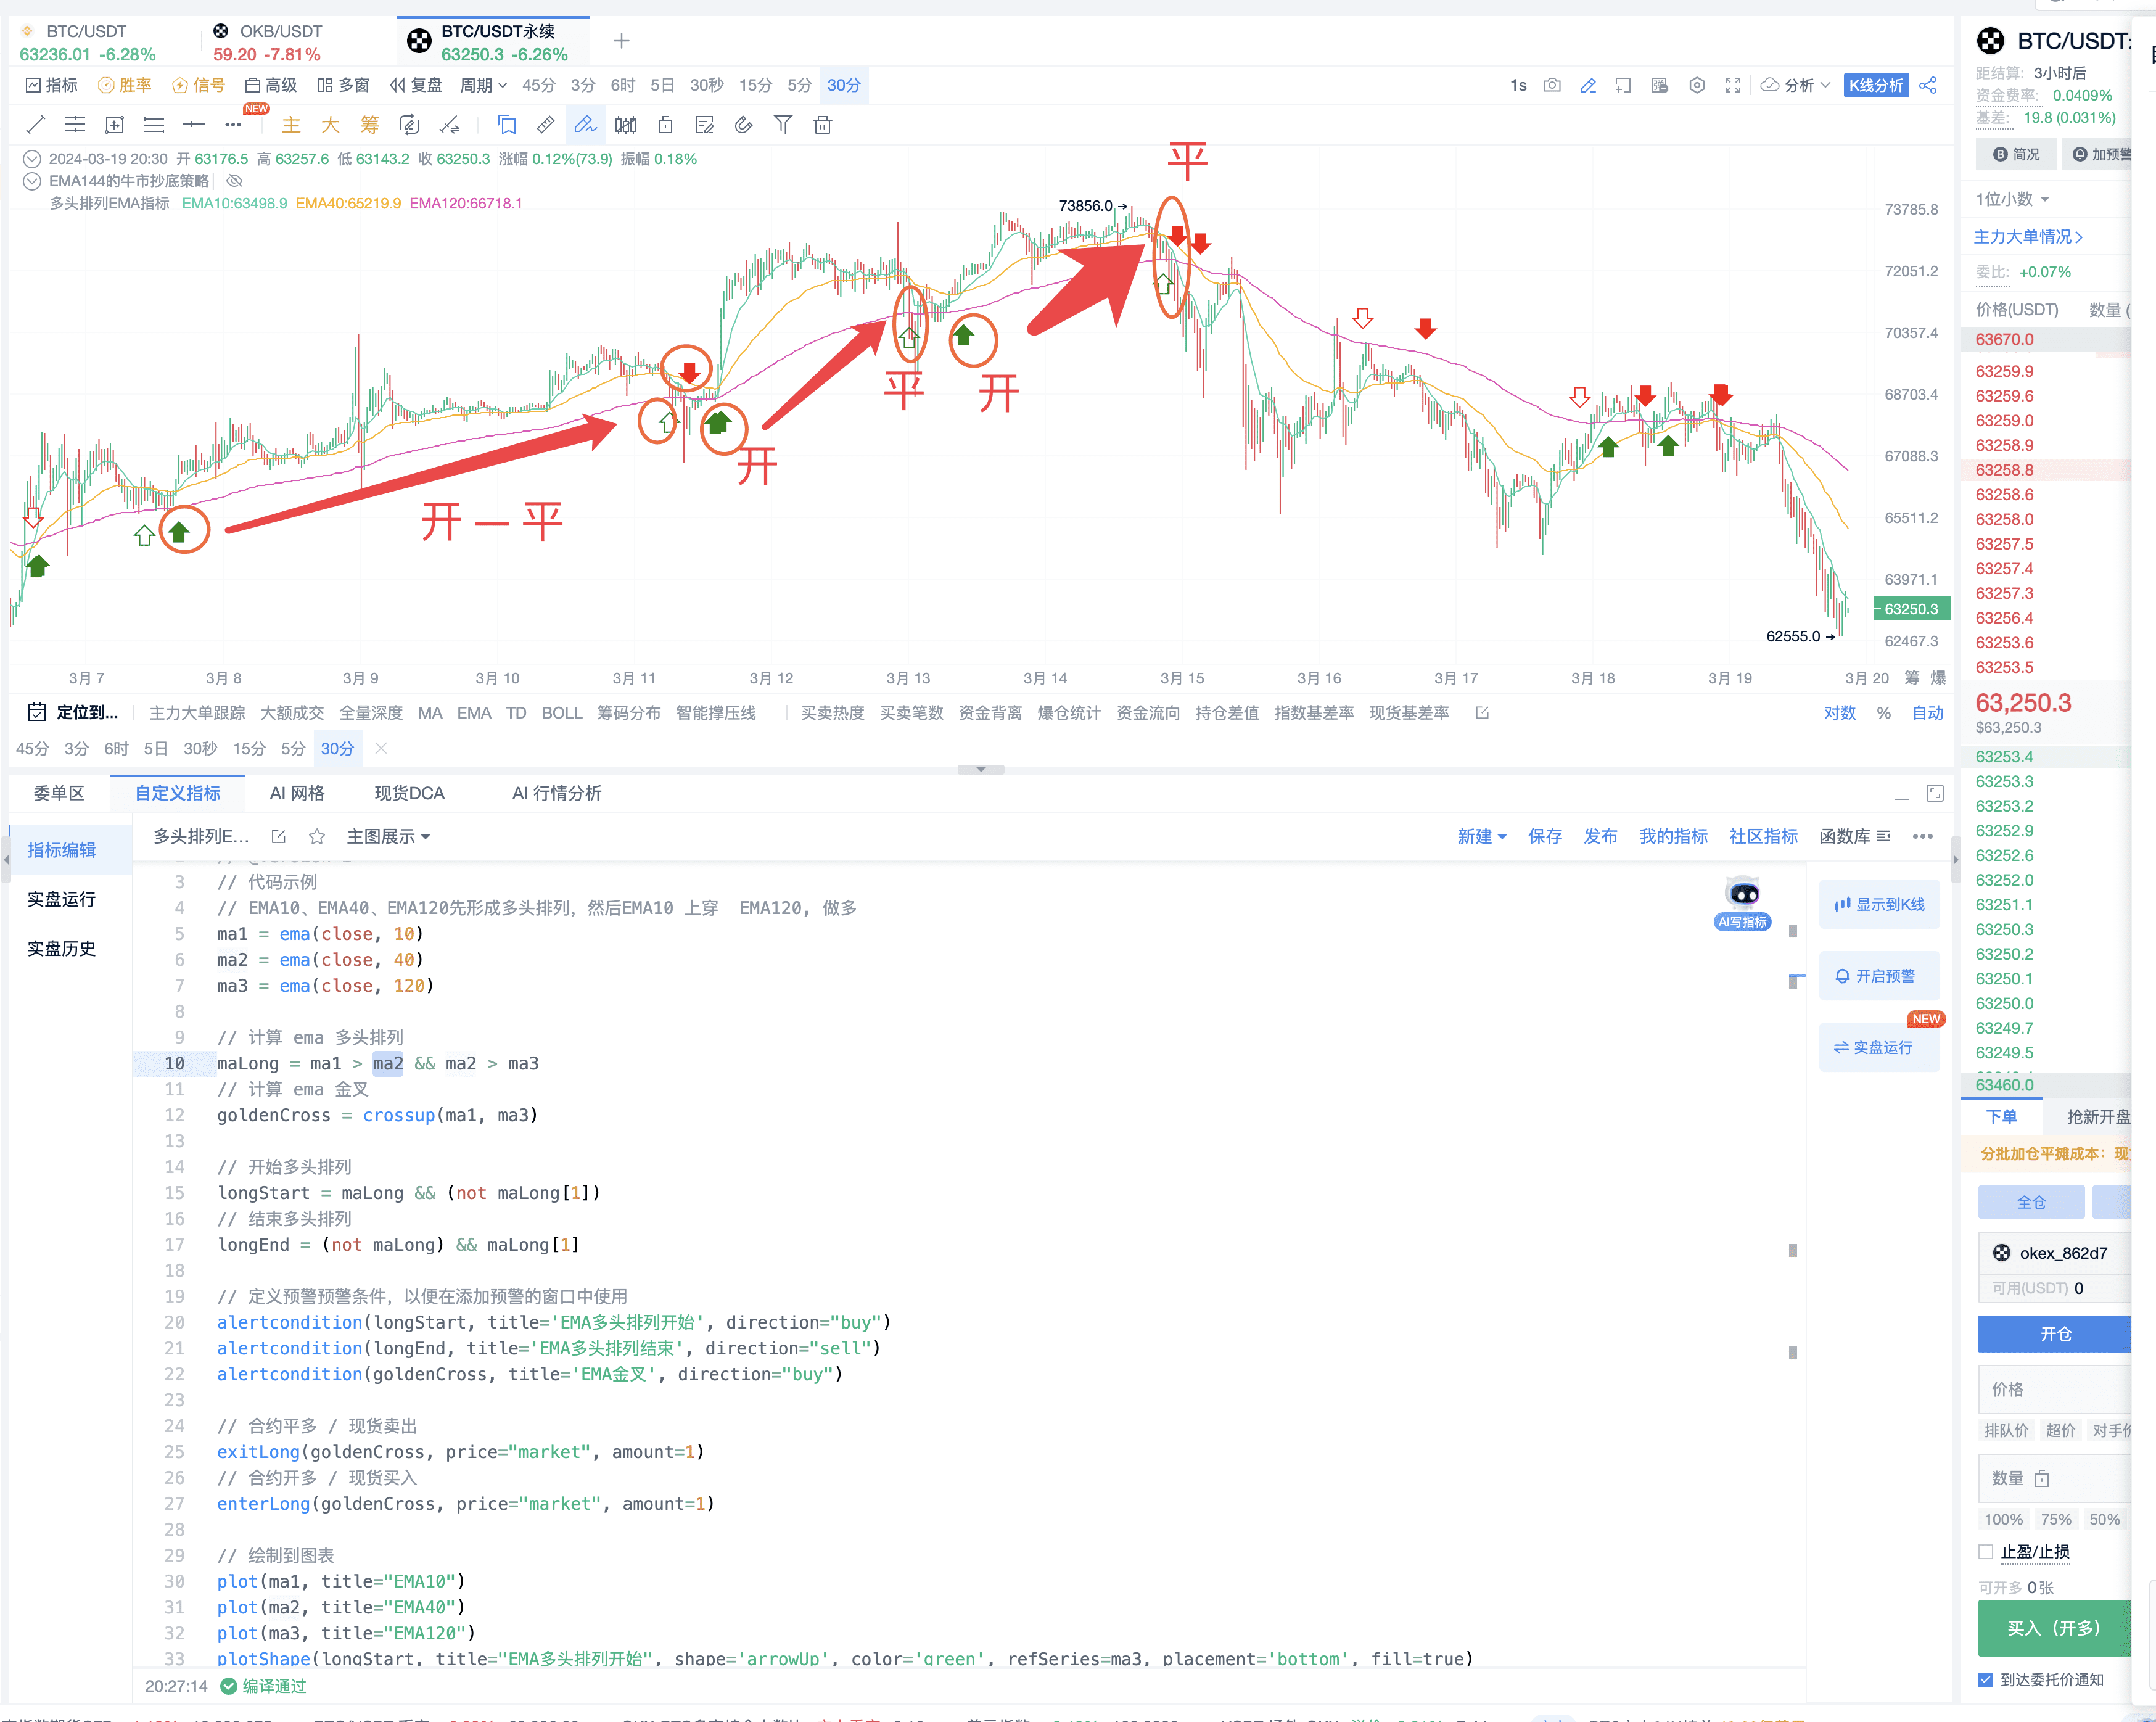
- Check the opening and closing logic of this strategy as shown in the image below.
We can make some optimizations based on what AI provides. According to this strategy, our strategy can be optimized as follows: After a bullish arrangement, if the trend is bullish, we can enter long positions. If the bullish arrangement ends, it is considered that the trend has ended and is suitable for closing positions. However, it does not represent any direction; after a bearish arrangement, if the trend is bearish, we can enter short positions. If the bearish arrangement ends, it is considered that the trend has ended and is suitable for closing positions. However, it does not represent any direction.
To distinguish easily, mark the golden cross in blue and the death cross in orange.
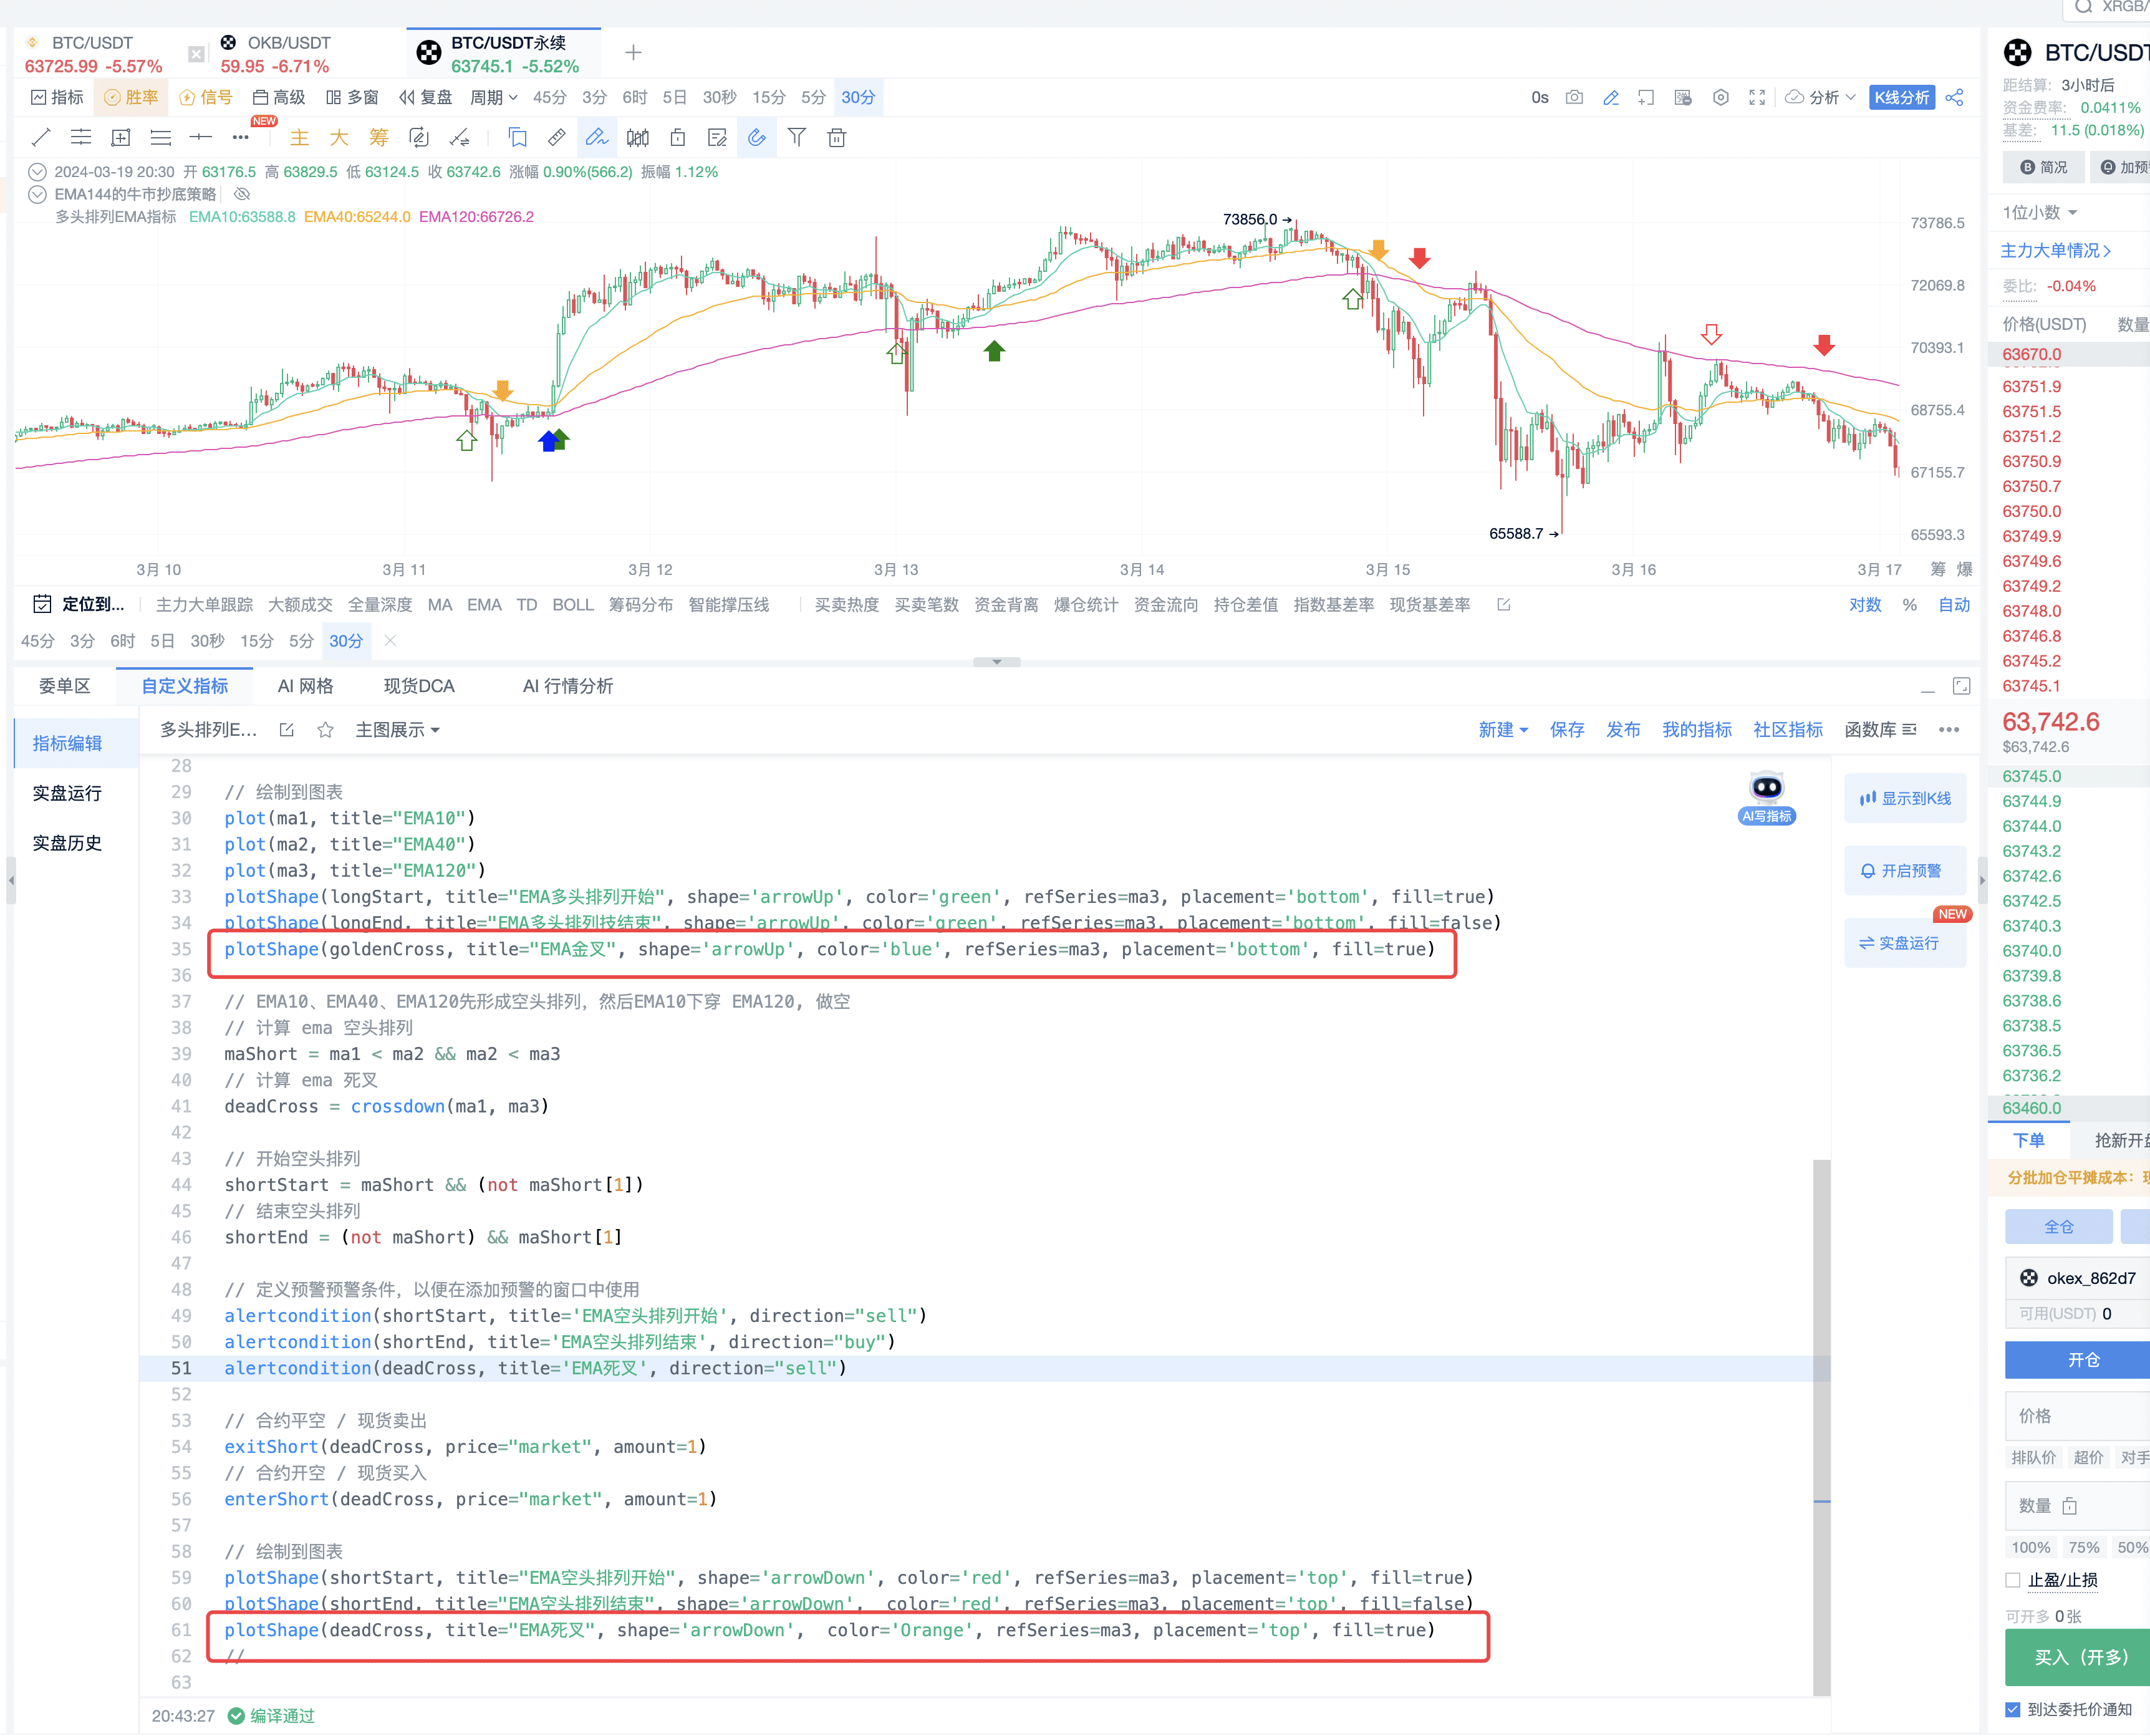
- Organize the trading code logic to complete the display effect.
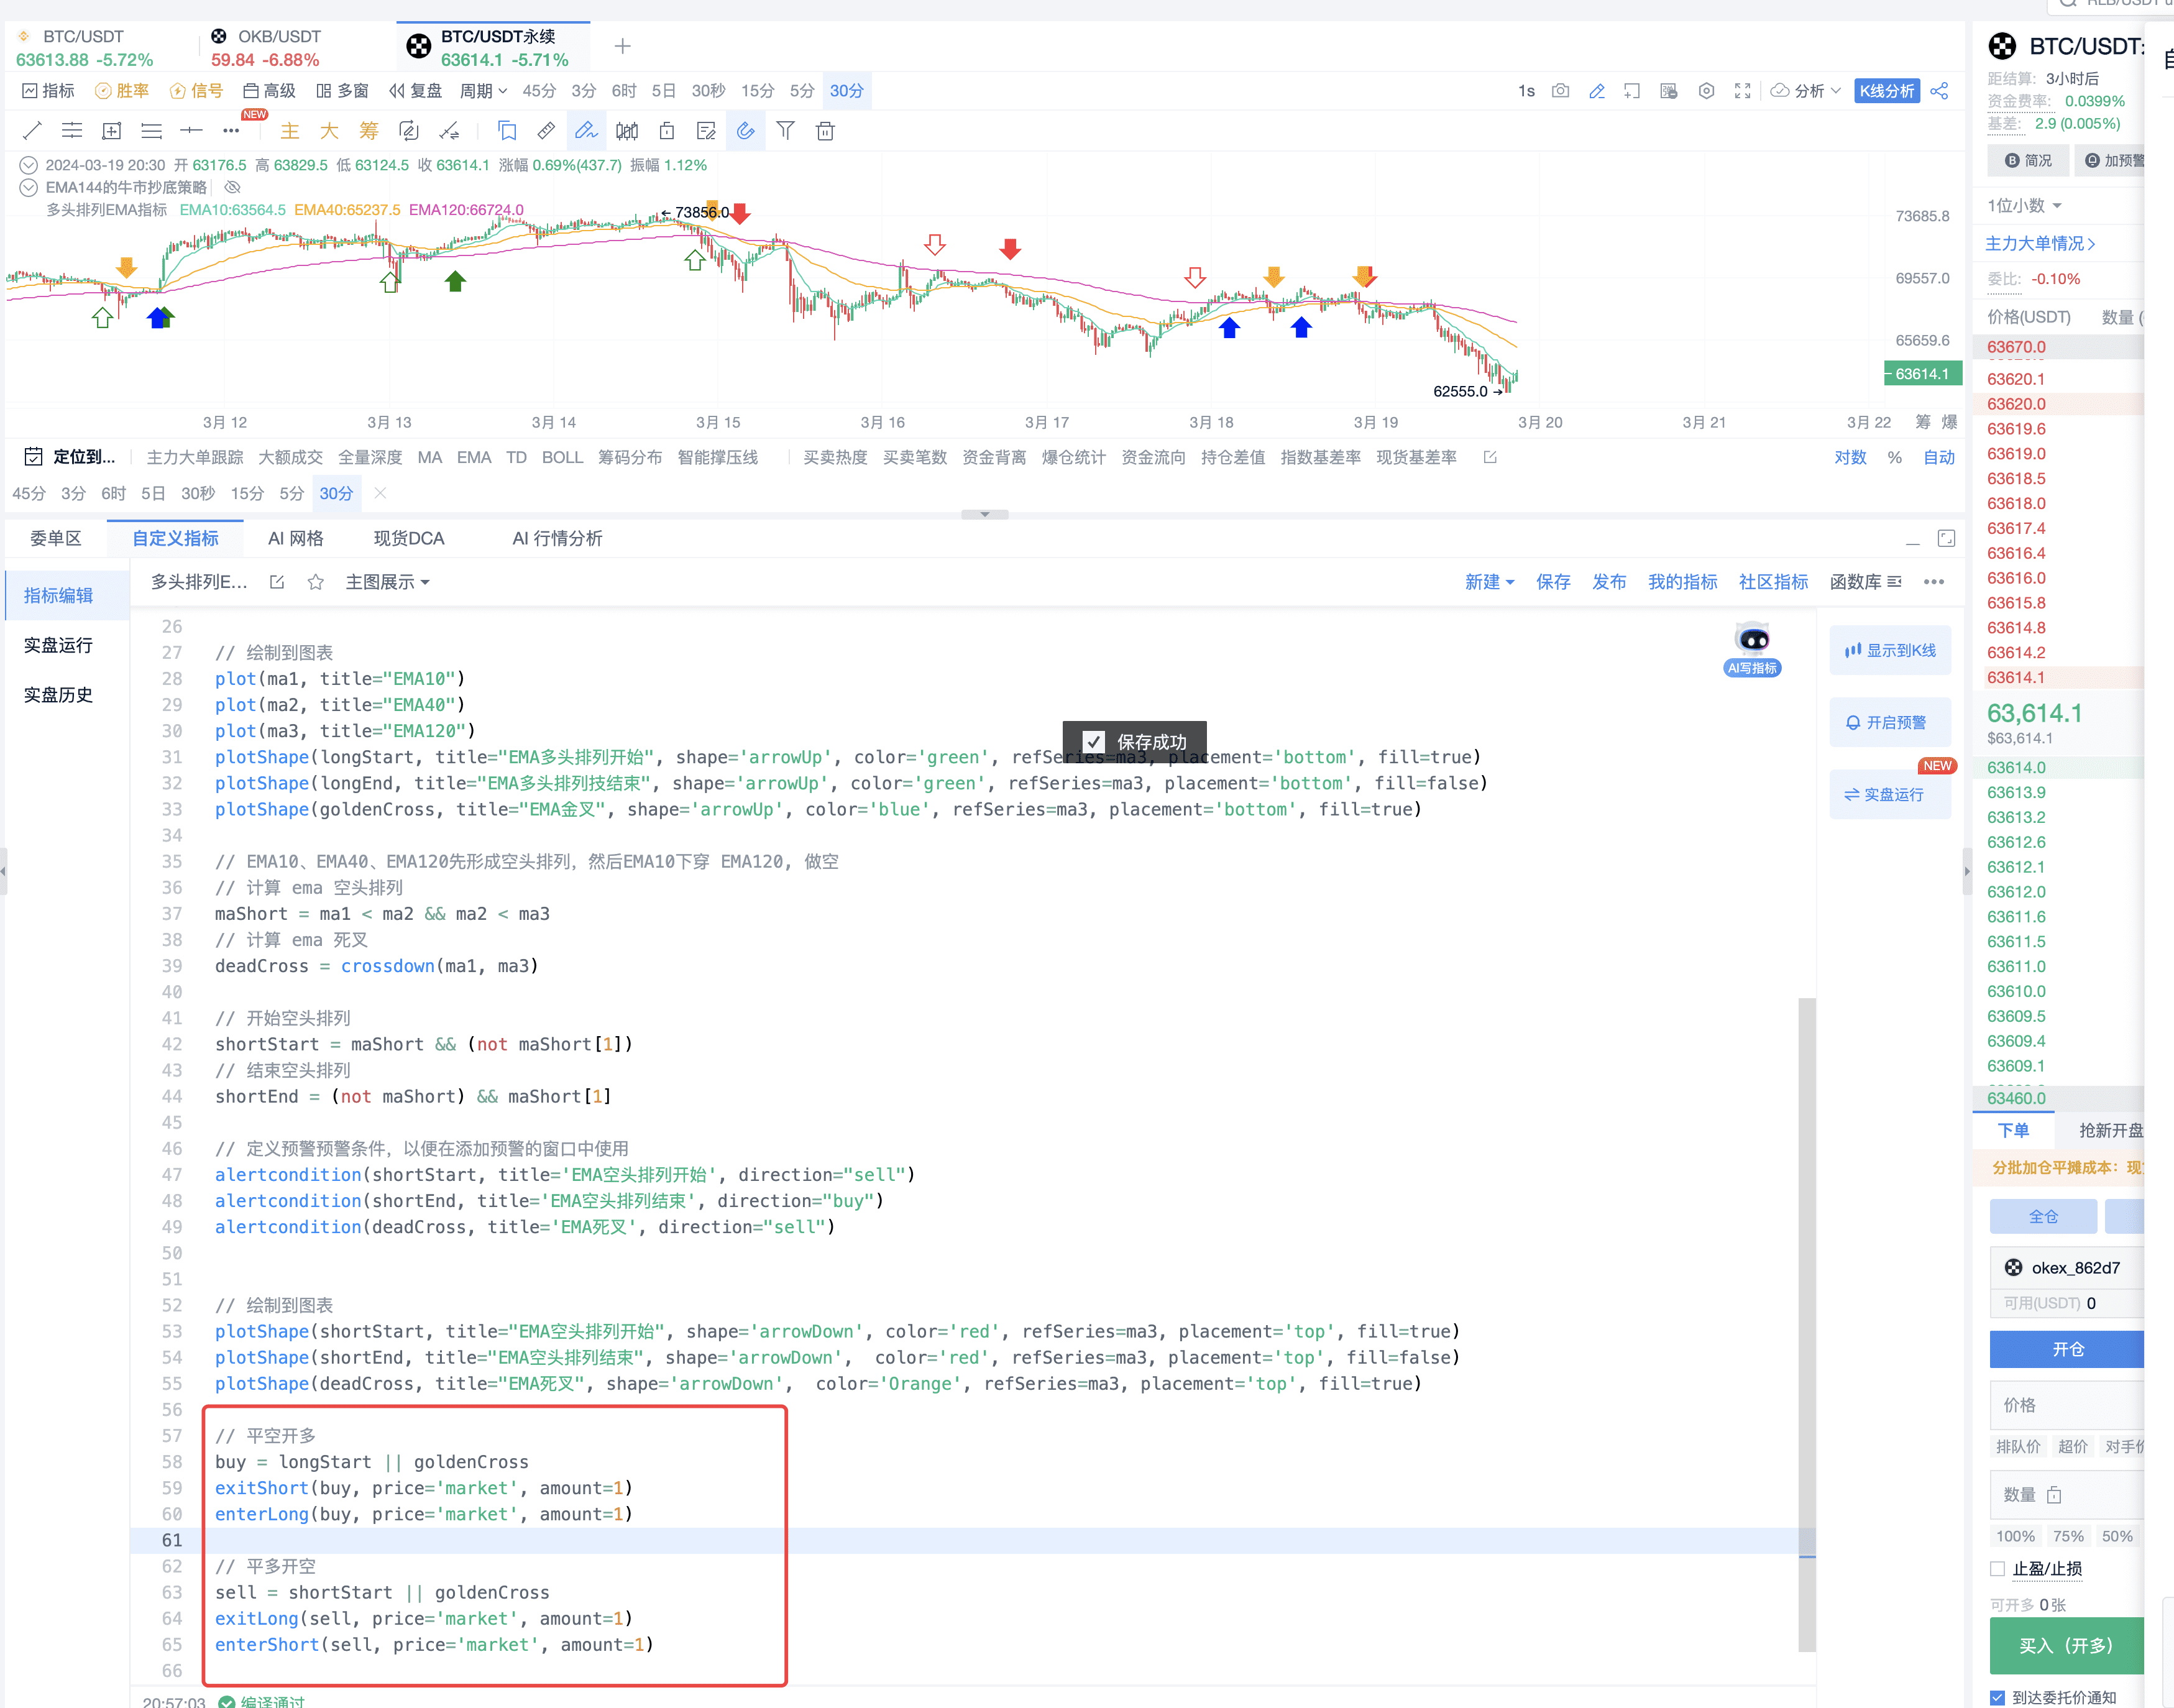
6. Complete EMA Strategy Specific Code: Can Implement Indicator Viewing + Alerts + Automated Trading
// @version=2
// Code Example
// EMA10, EMA40, EMA120 first form a bullish arrangement, then EMA10 crosses above EMA120, go long
ma1 = ema(close, 10)
ma2 = ema(close, 40)
ma3 = ema(close, 120)
// Calculate EMA bullish arrangement
maLong = ma1 > ma2 && ma2 > ma3
// Calculate EMA golden cross
goldenCross = crossup(ma1, ma3)
// Start of bullish arrangement
longStart = maLong && (not maLong[1])
// End of bullish arrangement
longEnd = (not maLong) && maLong[1]
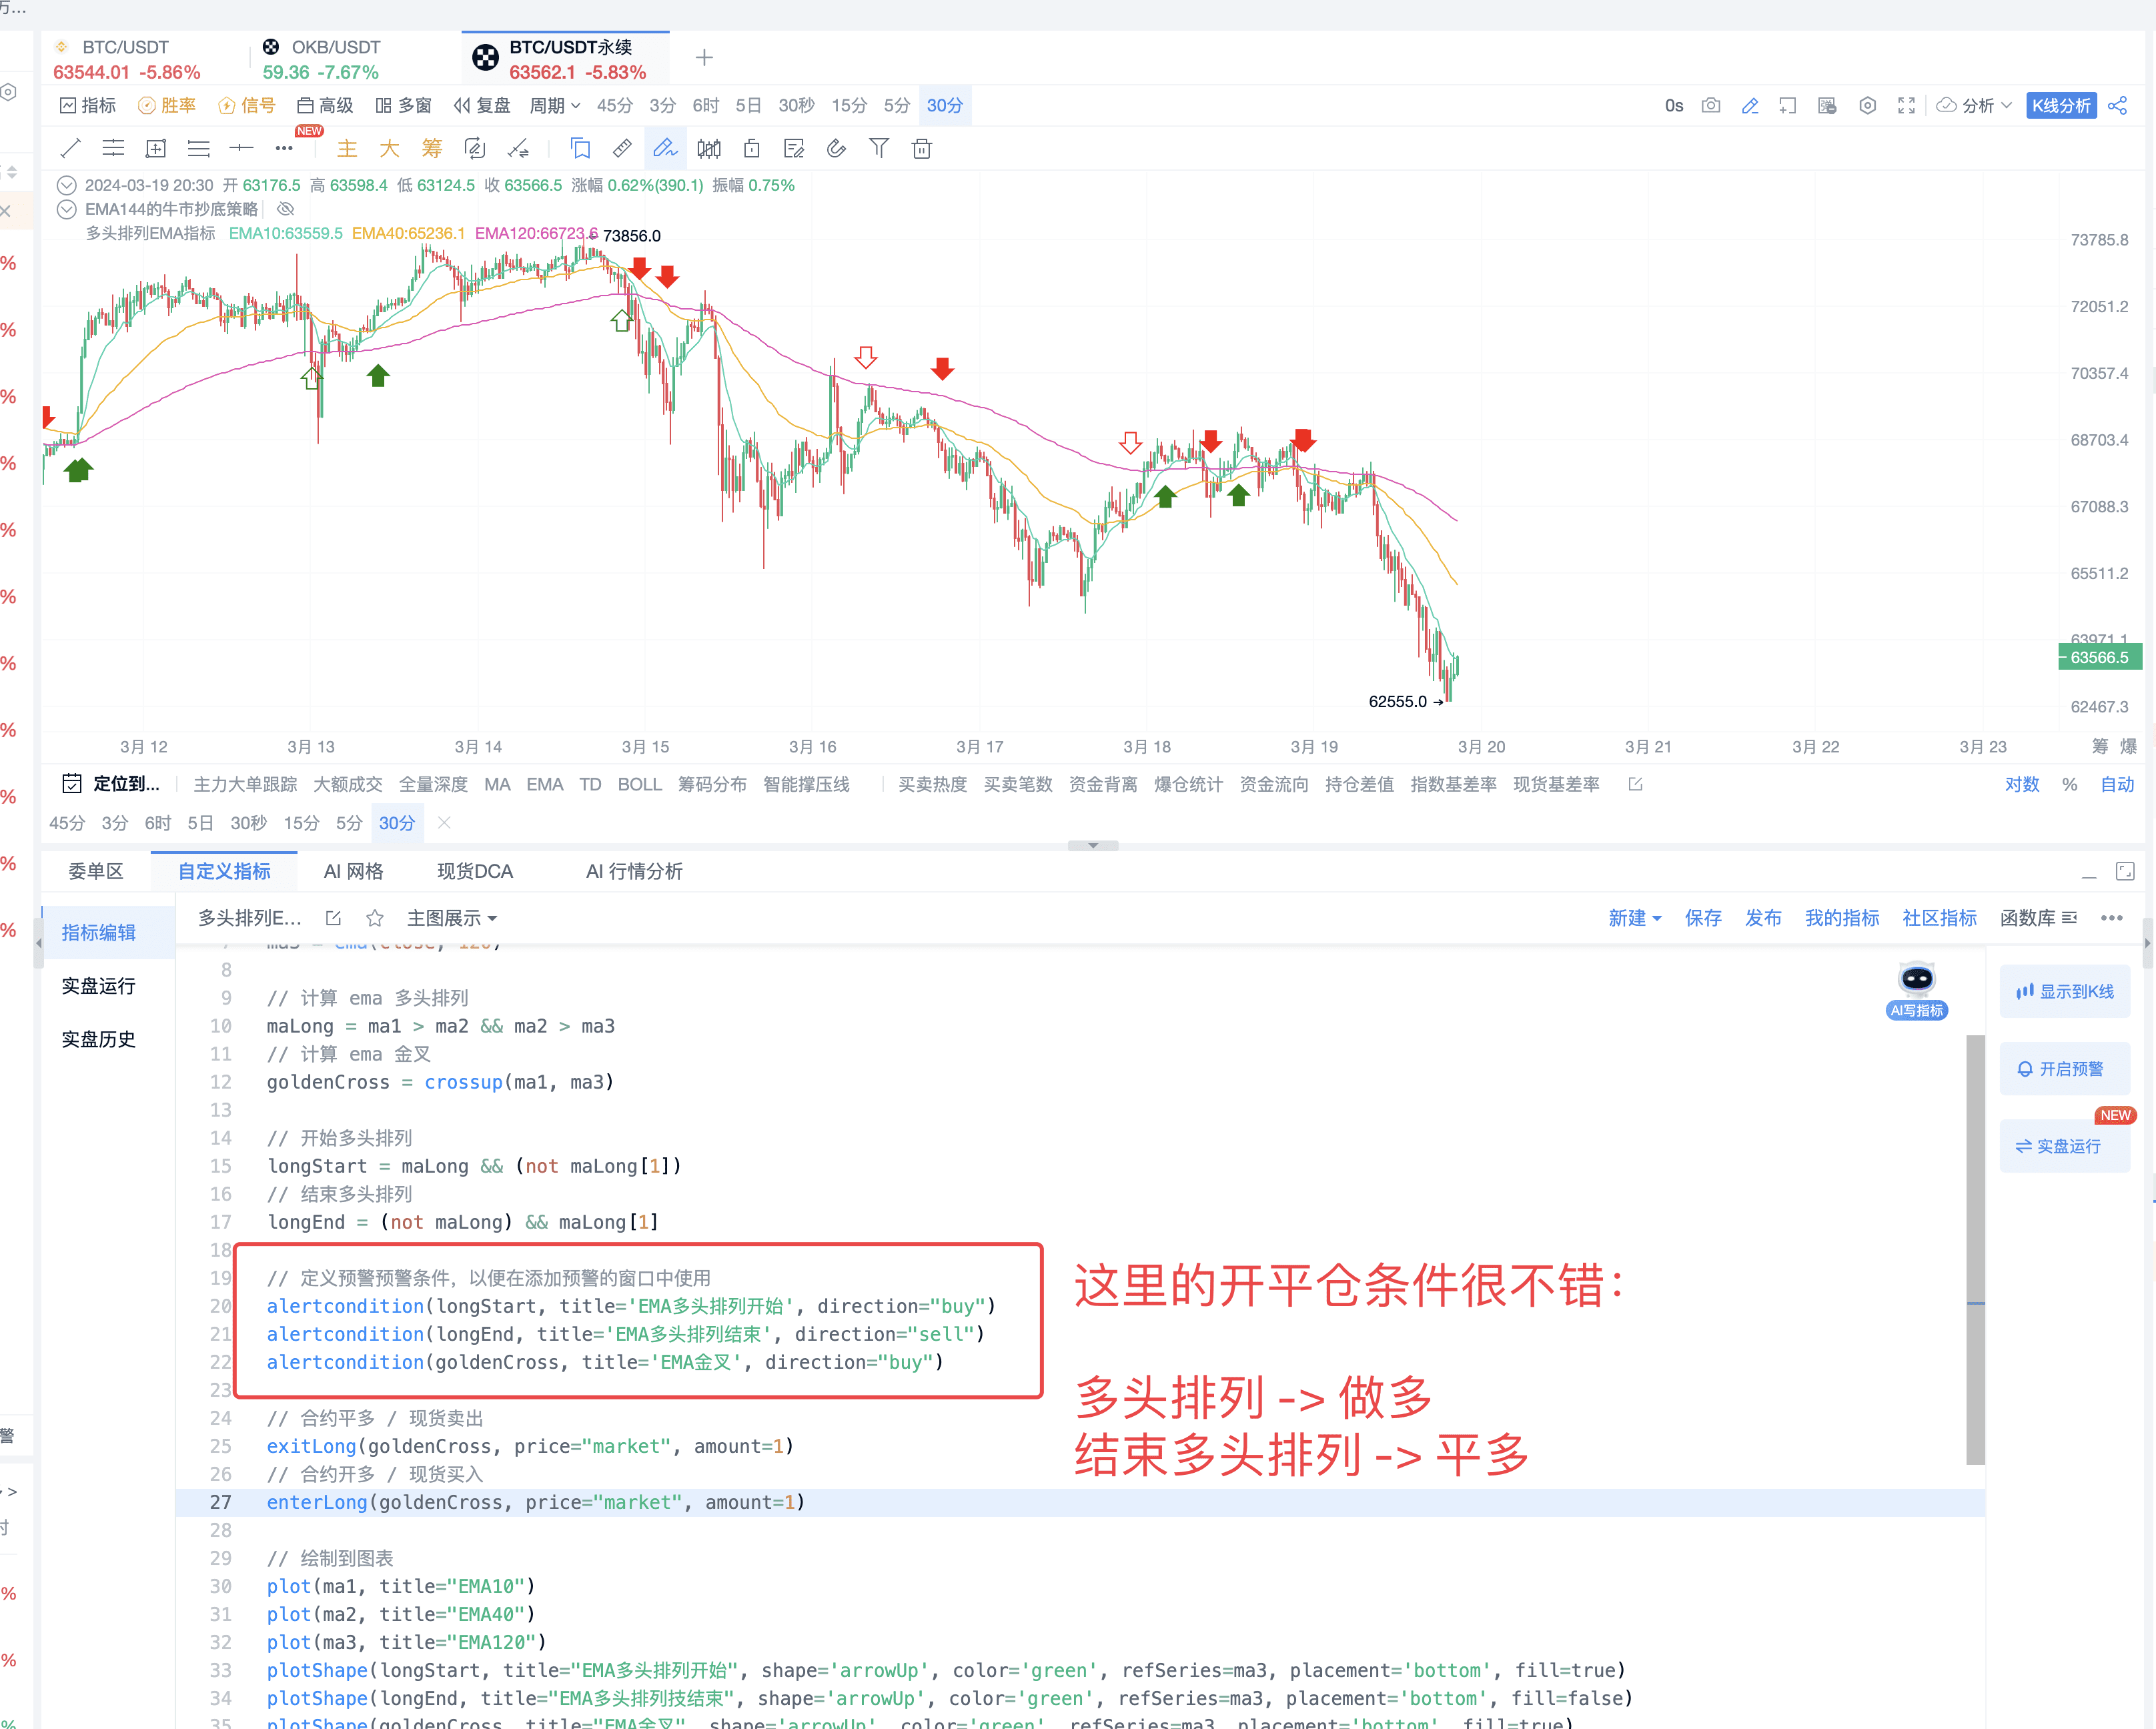
// Define alert conditions for use in the alert adding window
alertcondition(longStart, title='EMA Bullish Arrangement Start', direction="buy")
alertcondition(longEnd, title='EMA Bullish Arrangement End', direction="sell")
alertcondition(goldenCross, title='EMA Golden Cross', direction="buy")
// Draw on the chart
plot(ma1, title="EMA10")
plot(ma2, title="EMA40")
plot(ma3, title="EMA120")
plotShape(longStart, title="EMA Bullish Arrangement Start", shape='arrowUp', color='green', refSeries=ma3, placement='bottom', fill=true)
plotShape(longEnd, title="EMA Bullish Arrangement End", shape='arrowUp', color='green', refSeries=ma3, placement='bottom', fill=false)
plotShape(goldenCross, title="EMA Golden Cross", shape='arrowUp', color='blue', refSeries=ma3, placement='bottom', fill=true)
// EMA10, EMA40, EMA120 first form a bearish arrangement, then EMA10 crosses below EMA120, go short
// Calculate EMA bearish arrangement
maShort = ma1 < ma2 && ma2 < ma3
// Calculate EMA death cross
deadCross = crossdown(ma1, ma3)
// Start of bearish arrangement
shortStart = maShort && (not maShort[1])
// End of bearish arrangement
shortEnd = (not maShort) && maShort[1]
// Define alert conditions for use in the alert adding window
alertcondition(shortStart, title='EMA Bearish Arrangement Start', direction="sell")
alertcondition(shortEnd, title='EMA Bearish Arrangement End', direction="buy")
alertcondition(deadCross, title='EMA Death Cross', direction="sell")
// Draw on the chart
plotShape(shortStart, title="EMA Bearish Arrangement Start", shape='arrowDown', color='red', refSeries=ma3, placement='top', fill=true)
plotShape(shortEnd, title="EMA Bearish Arrangement End", shape='arrowDown', color='red', refSeries=ma3, placement='top', fill=false)
plotShape(deadCross, title="EMA Death Cross", shape='arrowDown', color='Orange', refSeries=ma3, placement='top', fill=true)
// Close short and open long
buy = longStart || goldenCross
exitShort(buy, price='market', amount=1)
enterLong(buy, price='market', amount=1)
// Close long and open short
sell = shortStart || goldenCross
exitLong(sell, price='market', amount=1)
enterShort(sell, price='market', amount=1)
- To see the specific historical performance of this strategy, it basically captures this major trend.
Both long and short positions can be perfectly captured.

- Of course, there may not be much profit potential during oscillations, similar to when the moving averages are entangled.
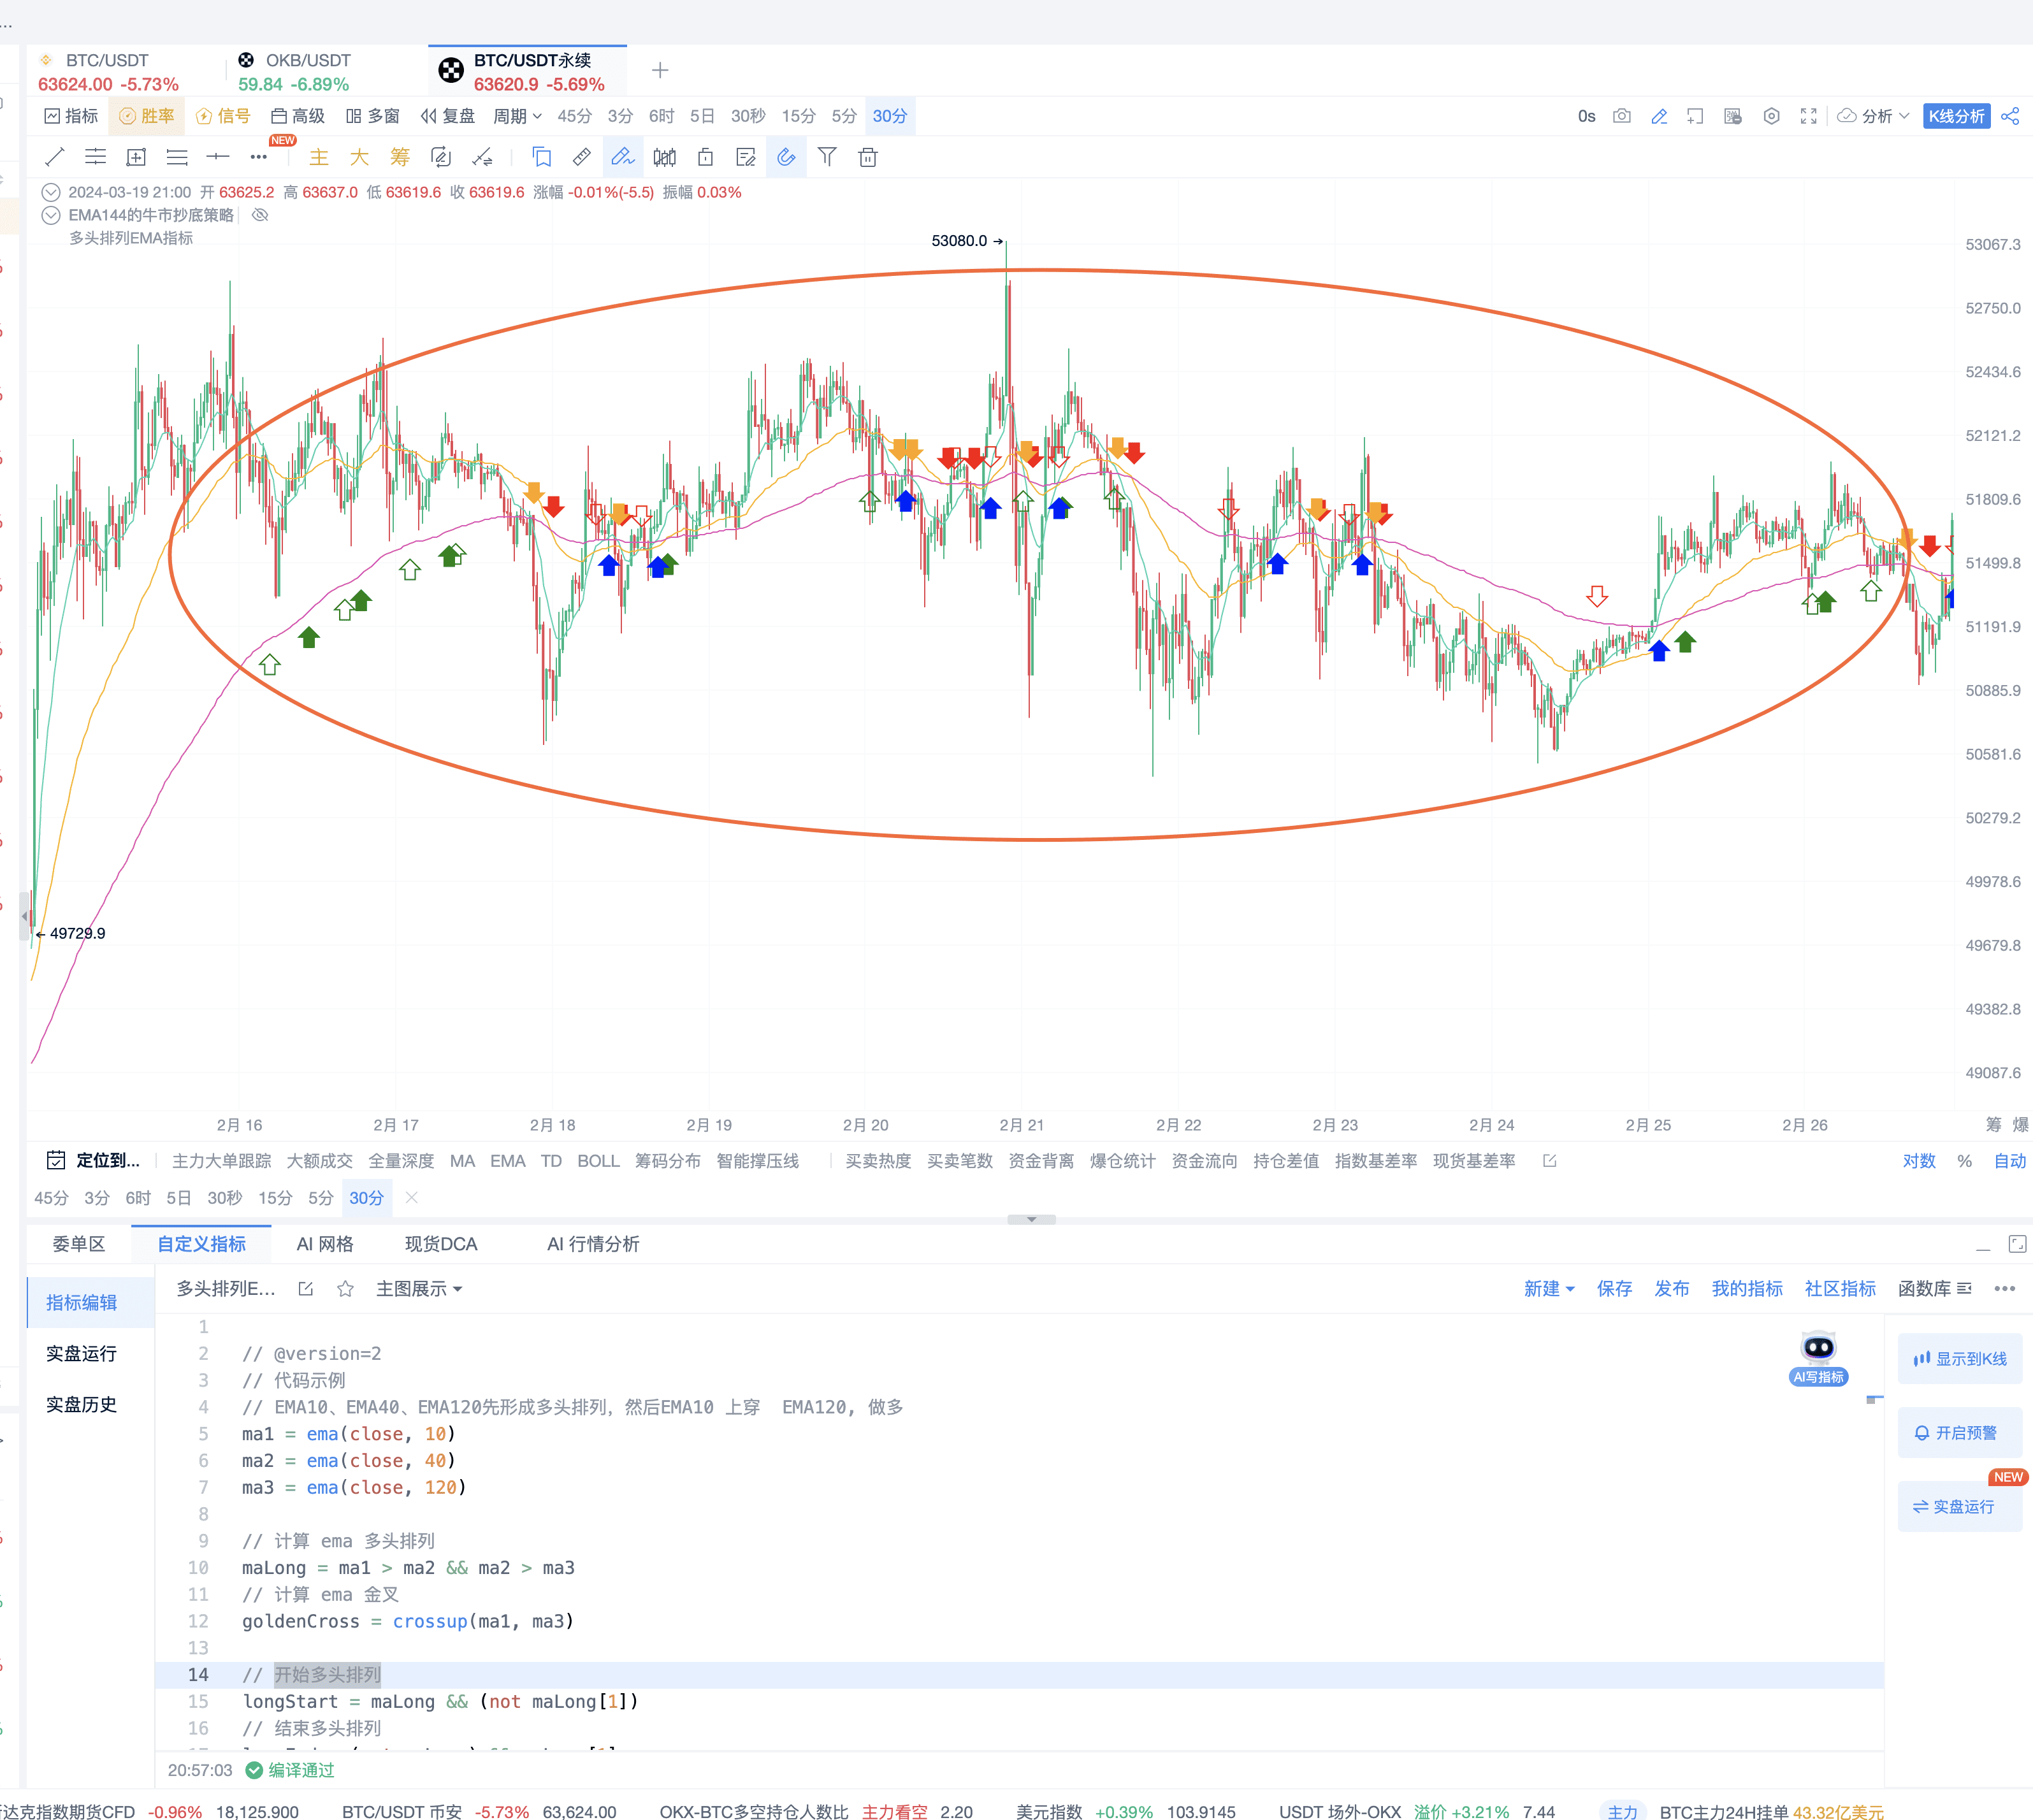
The AI assistant can meet many conditions, as long as you provide your ideas to AI. Our AI tools and custom indicator tools will provide more support to members. If you are interested in AI indicator writing and want to build your own trading strategy, feel free to open Signal Alerts/PRO K-line/Indicator Win Rate memberships, any of which can be experienced for free for a limited time.
Click the link below to open and experience: https://aicoin.app/zh-CN/vip/chartpro
V. Q&A
- Can you please explain what the "solid green arrow and hollow green arrow, solid red arrow and hollow red arrow" mean?
Solid green arrow: Start of bullish arrangement; Hollow green arrow: End of bullish arrangement.
- What is the suitable period for all EMA trend strategies?
If you encounter a period where similar entanglement of moving averages begins, you can go to the next level of the period, usually a multiple of 5, such as daily - 4 hours - 30 minutes - 5 minutes - 1 minute.
- What do the arrows mean?
Solid green: Bullish arrangement signal, Hollow green: End of bullish arrangement signal, Blue: Golden cross signal; Solid red: Bearish arrangement signal, Hollow red: End of bearish arrangement signal, Orange: Death cross signal.
Recommended Reading
AI Writes Indicators, Automated Trading, Easily Start a New Mode of Making Money by Bottom Fishing
MACD Automated Trading Strategy: The Secret to Capturing Market Opportunities Steadily
EMA Indicator Automated Trading: A Guide to Maximizing Returns
For more live content, please follow AICoin's "News/Information-Live Review" section, and feel free to download AICoin PC End.
免责声明:本文章仅代表作者个人观点,不代表本平台的立场和观点。本文章仅供信息分享,不构成对任何人的任何投资建议。用户与作者之间的任何争议,与本平台无关。如网页中刊载的文章或图片涉及侵权,请提供相关的权利证明和身份证明发送邮件到support@aicoin.com,本平台相关工作人员将会进行核查。


