Produced by | OKEx Cloud Chain Research Institute
Author | HedyBi
The views in this article are purely based on the analysis of on-chain data by the author and do not constitute recommendations or opinions on any potential investment targets, nor should they be considered as investment advice.
At the beginning of March, the Federal Reserve (FED) released its semi-annual monetary policy report. With the market's increasing expectations of a rate cut in June, the price of gold reached its highest level in 2024. Just a day later, BTC also reached a new market value high. The approval of the Bitcoin spot ETF can be seen as a watershed moment. Two months later, the driving force of finance is accelerating the maturity of the cryptocurrency market, making this market more complex.
However, as an "honest" indicator reflecting the true market situation, on-chain data shows an increasingly polarized trend among investors. As the OKEx Cloud Chain Research Institute mentioned in the previous article "Countdown to the approval of the Bitcoin spot ETF application: the United States will not easily let go!", "The new market is gathering momentum, and the original market is becoming more determined." This article combines on-chain data from OKLink, CryptoQuant, and Glassnode to analyze the BTC market from the perspective of supply and demand and market distribution:
I. Analysis of the current supply and demand of BTC from on-chain data
From the supply side, according to the data from CryptoQuant as of the time of publication, more than 30 centralized exchange platforms currently have a total of approximately 71,934 BTC in outflow.
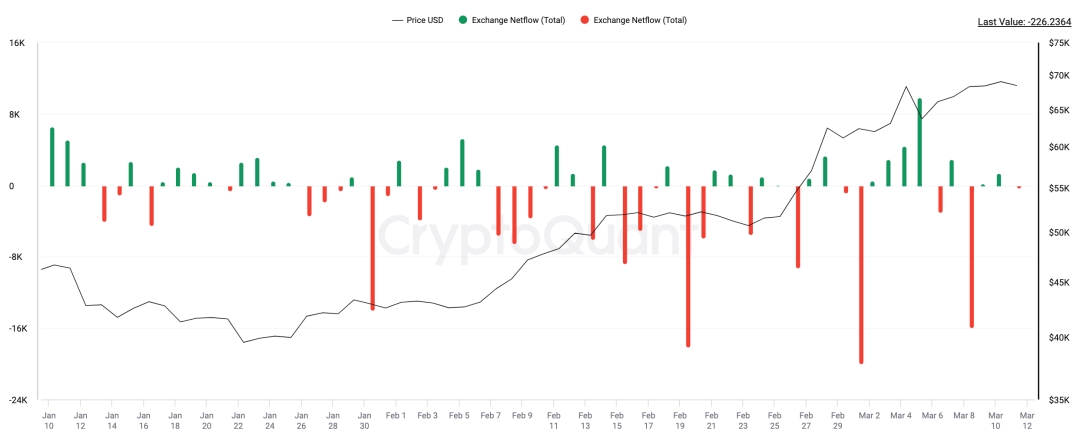 Figure Net inflow/outflow of BTC from centralized exchange platforms from January 11, 2024 to the present (complete data as of March 10) (unit: BTC)
Data source: CryptoQuant
In addition, we can also see that miners are continuing to sell off BTC, mainly to liquidate before the next halving. The next mining halving will reduce the mining reward from 6.25 BTC to 3.125 BTC. As of the time of publication, the net outflow of BTC from wallets associated with cryptocurrency miners during the period from the approval of the ETF to the present is approximately 8,530 BTC. In other words, the total reduction in BTC from the two major supply sources, exchanges and miners, is approximately 80,464 BTC. Here, we have calculated based on the net outflow quantity, as the net outflow data includes the difference between the miners' demand for hoarding coins and the actual mined BTC.
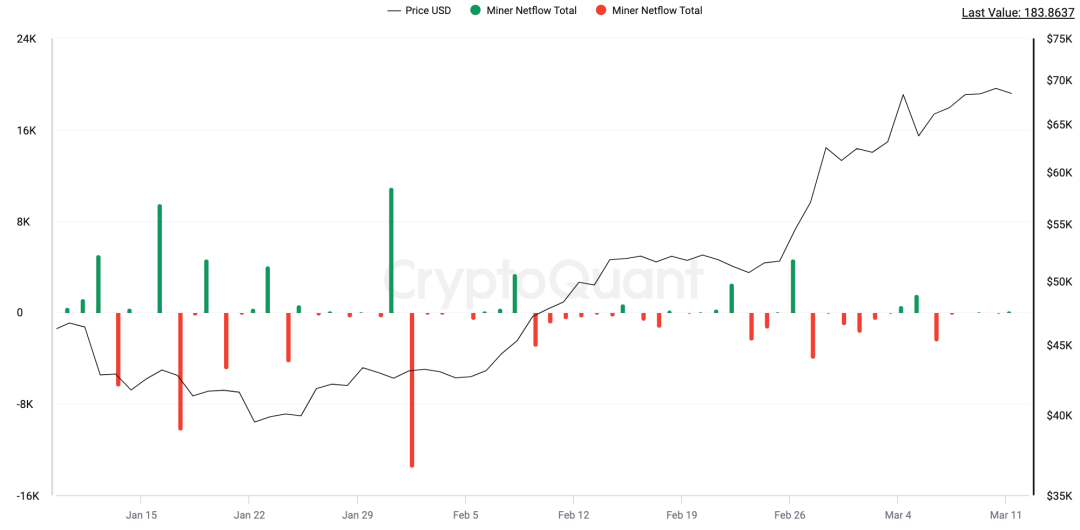 Figure Net inflow/outflow of BTC from miner wallet addresses from January 11, 2024 to the present (unit: BTC)
Data source: CryptoQuant
On the demand side, despite the ongoing discussions in the market about Grayscale's continuous selling of BTC, due to discrepancies in statistics from various data sources and the timing of various institutions updating the spot ETF, a comprehensive estimate based on CryptoQuant and Farside data shows that the cumulative capital inflow into the market through the BTC spot ETF channel has reached $9.594 billion. Compared to when the BTC spot ETF was allowed to trade, as of the local closing time on March 8, the net inflow total was approximately 176,396 BTC. Through just one channel, the BTC spot ETF has created a supply shortage in the market, which currently amounts to over 95,000 BTC. However, the true source of BTC supply is the miners. Although there are other channels such as outflows from exchanges, these are not sustainable supply sources.
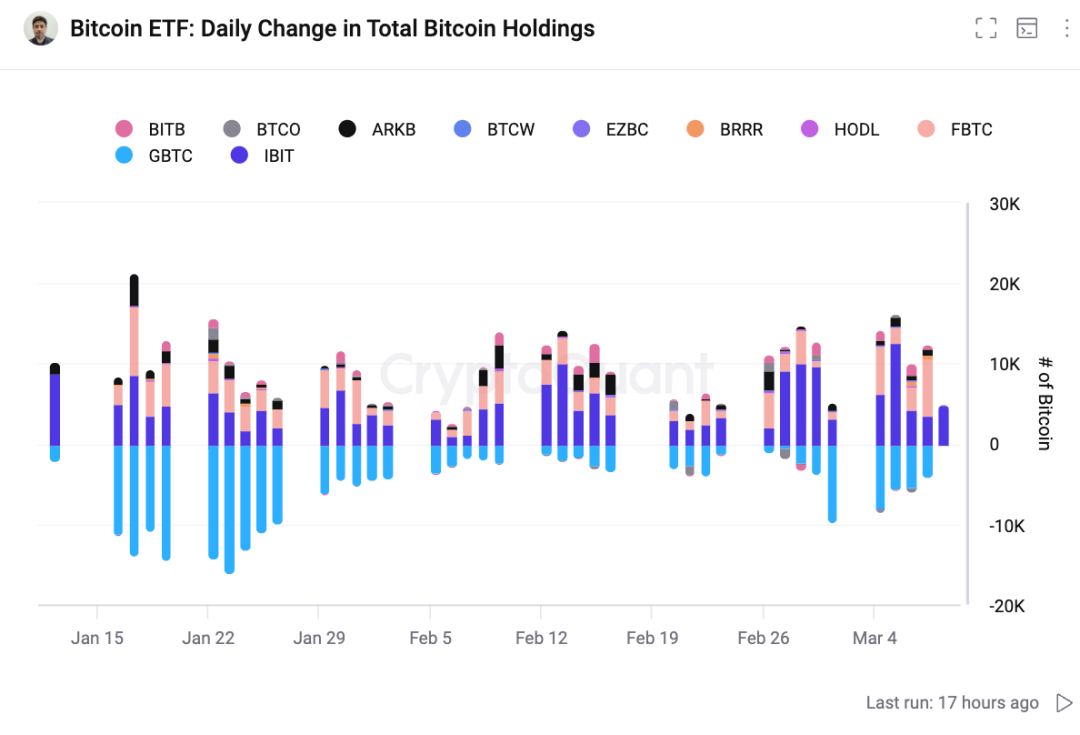 Figure Net inflow/outflow of Bitcoin Spot ETF from January 11, 2024 to the present (unit: BTC)
Data source: CryptoQuant
In about 40 days, the halving of BTC will halve the newly generated supply. According to BTC's design: the mining reward halves every 210,000 blocks, until the block reward reaches 0 in 2140, and the total issuance of BTC will be capped at 21 million.
Furthermore, unlike previous halvings, a groundbreaking innovation has emerged within the BTC ecosystem—Script, according to Dune's on-chain data statistics, the fees contributed to the BTC ecosystem from this innovation have already reached 6,290 BTC, contributing to a portion of the miners' income. In the future, as innovative applications within the BTC ecosystem and L2 solutions for scalability develop, miners' income will also increase, which will alleviate the actual pressure on miners to sell BTC to cover mining costs. This means that the situation on the supply side is different from previous halvings; the pressure to sell to the market has decreased, and miners are more willing to hoard coins rather than supply them to the market.
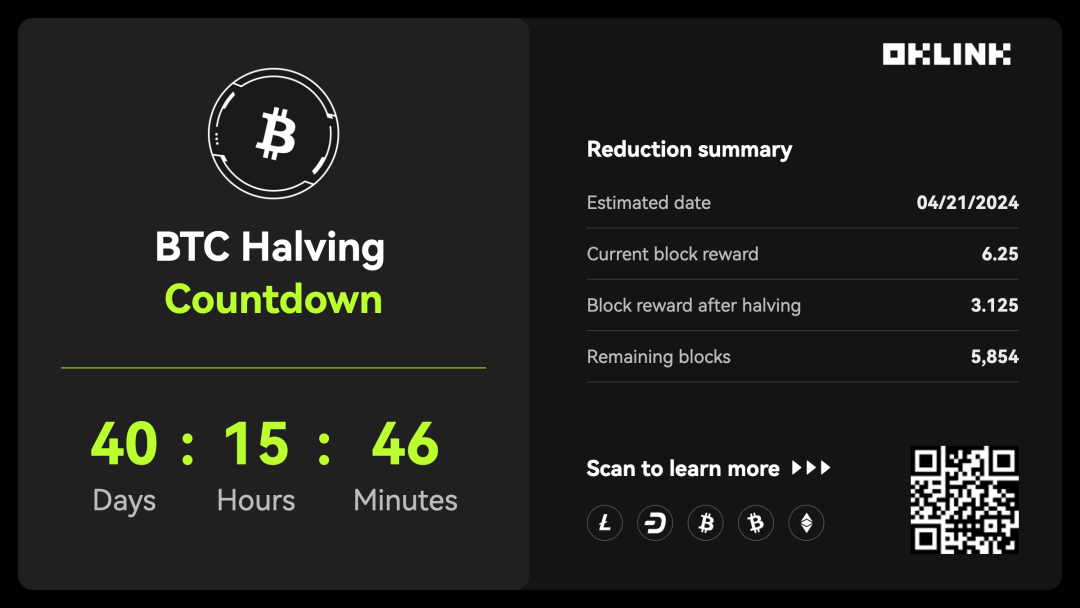 Figure Overview of BTC halving at 12:00 PM on March 11
Data source: OKLink
II. Distribution of the BTC market: Shifting to on-chain
If we assume that most new investors entered this market due to the BTC spot ETF, then on-chain non-zero addresses can be assumed to be primarily held by existing investors. According to OKLink data, the number of on-chain non-zero addresses has shown a clear upward trend, indicating an increase in the number of addresses holding assets, not just due to the addition of addresses for interaction, but also indicating signs of BTC transfers.
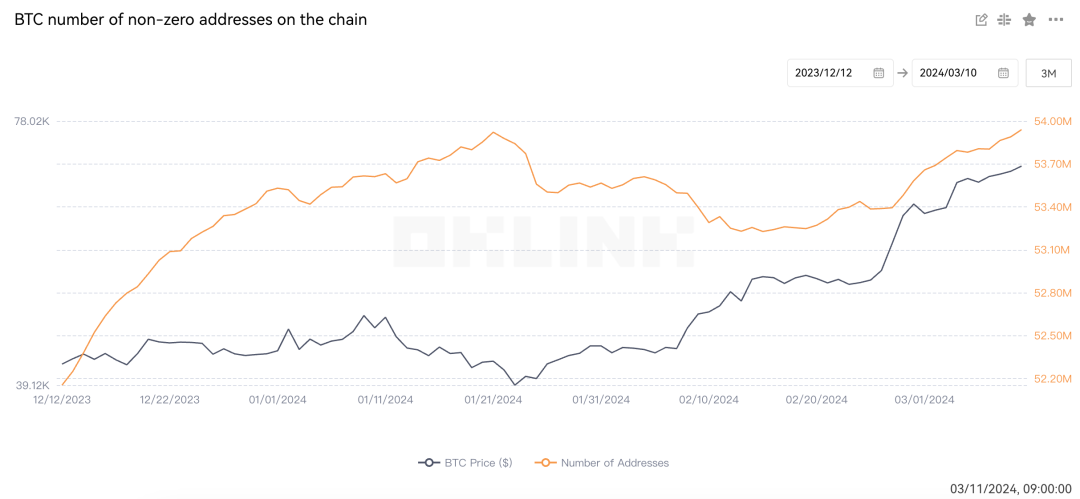 Figure Number of wallet addresses with non-zero BTC assets in the past 3 months
Data source: OKLink
More detailed and specific asset movement can also be viewed in real-time and large transfers on the blockchain explorer. According to OKLink data, the frequency of large transfers of BTC in recent days has been increasing.
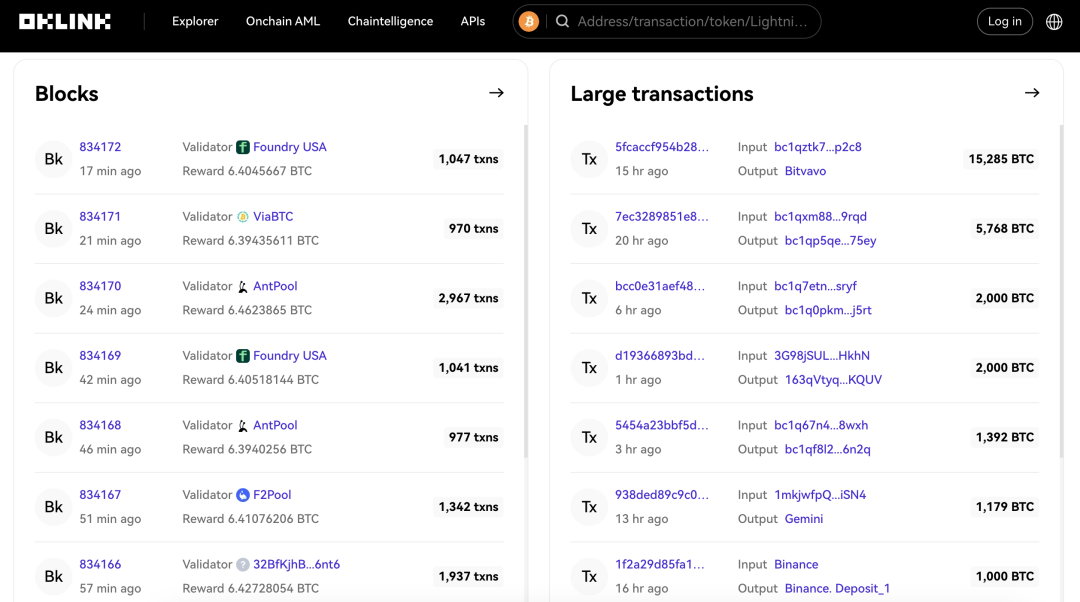 Figure Large asset transfers on the BTC blockchain explorer
Data source: OKLink
According to Glassnode's statistics, the amount of BTC transferred to long-term storage is increasing at a rate of 180,000 BTC per quarter, which is twice the amount of new BTC being mined. This shift of BTC as a long-term investment further tightens the supply of BTC and may strengthen the price foundation of BTC as the halving approaches.
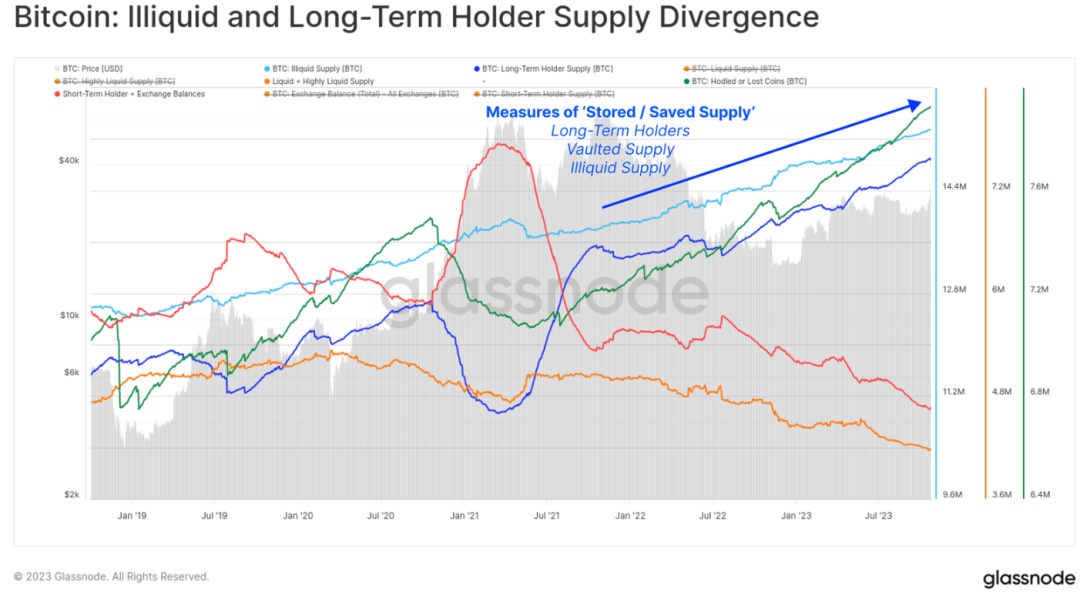 Figure Discrepancy between illiquidity and long-term holders' supply
Data source: Glassnode
Long-term holders are showing an expanding trend in both the number of addresses and the amount of funds transferred to on-chain. According to a recent report from Glassnode, the lock-up rate of BTC for long-term investment has exceeded 200% of the new supply. This means that, although new BTC is continuously being mined, more BTC is being held by investors rather than being sold or traded.
III. Compared to Gold ETF? Let's Look at Scarcity
In addition to on-chain data showing that BTC is currently in a state of supply shortage, the scarcity of BTC also continues this trend. Unlike fiat currency supply, which depends on central banks, and the supply of precious metal assets such as gold being naturally limited, the issuance speed and total supply of 21 million BTC have been determined by its underlying protocol since its inception.
Speaking of scarcity, we cannot ignore gold. Often compared to BTC, gold is also considered a "supply shortage" asset due to its high mining cost and limited natural resources. Especially in response to inflation and conflicts, its scarcity advantage becomes more prominent, making it a classic example of fear trading. Therefore, the historical performance of the gold market is often used for comparison with the BTC market.
In terms of ETF performance, since the approval of the first gold spot ETF in 2004, the price of gold has continued to rise, with an increase of 346% in less than 10 years. However, gold took a considerable amount of time to be widely recognized. In comparison, it took only 15 years for BTC to go from its inception to the approval of the spot ETF in 2024. Despite the continuous market hype, we need to consider the important historical position of gold in the financial field. In 1717, the United Kingdom first adopted the gold standard, making gold an important part of the monetary system.
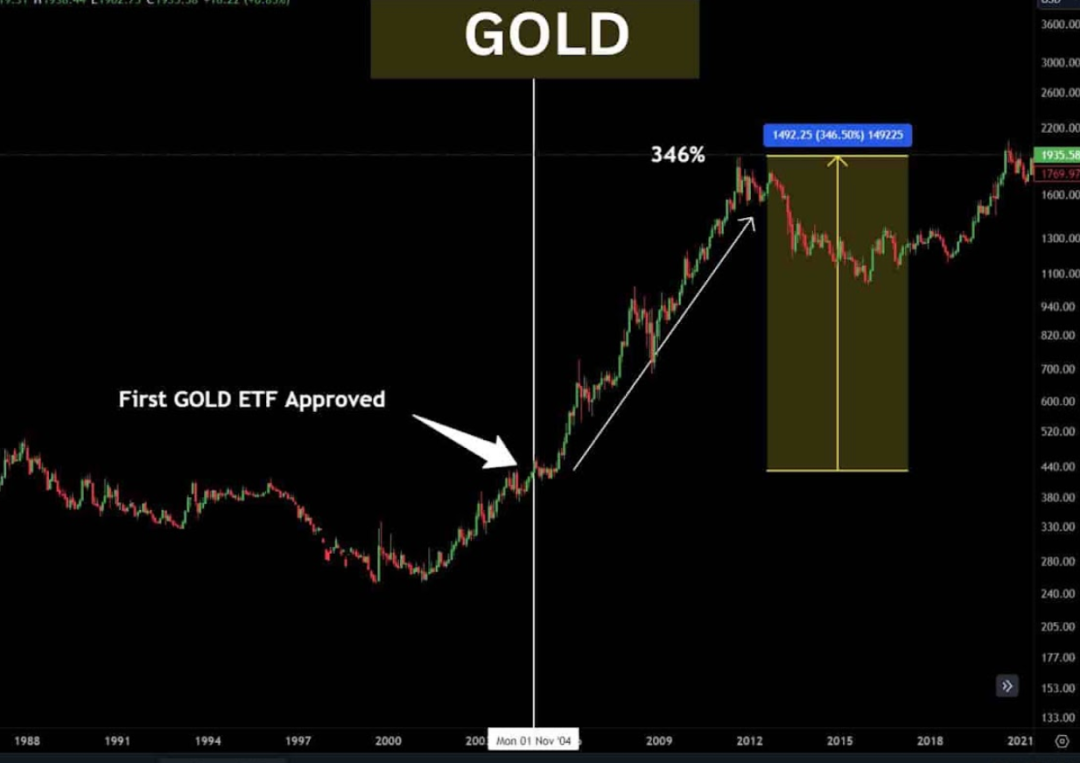
Figure Comparison of gold before and after the spot ETF
Data source: Ash Crypto
When discussing the uniqueness of BTC as "digital gold," in addition to its material scarcity, its uniqueness in the financial system is also worth noting. BTC's decentralized design allows it to be held outside the traditional financial system, while also providing an opportunity for billions of people without bank accounts to enter the global financial system.
As the BTC market develops, the decentralized nature of BTC allows for greater diversity of participants and deeper connections with traditional financial markets. The complexity of the market is closely related to the availability of data. In this context, the analysis and access to on-chain data are more convenient compared to traditional financial market data. On-chain data comes from nodes networks around the world, with the characteristic of a public ledger, allowing anyone to conduct real-time market analysis and statistics without relying on centralized institutions. This decentralized nature brings transparency and fairness to the data, effectively avoiding the risks of single point of failure and tampering.
In the increasingly mature and complex cryptocurrency market, the advantage of analyzing and accessing on-chain data is more accessible compared to other financial market data. The more complex the market, the more obvious the advantage of on-chain data. Due to its uniqueness, on-chain data will become the most unique presence that brings us closest to the truth of the market.
免责声明:本文章仅代表作者个人观点,不代表本平台的立场和观点。本文章仅供信息分享,不构成对任何人的任何投资建议。用户与作者之间的任何争议,与本平台无关。如网页中刊载的文章或图片涉及侵权,请提供相关的权利证明和身份证明发送邮件到support@aicoin.com,本平台相关工作人员将会进行核查。


