On the afternoon of March 7th, AICoin researchers conducted a live graphic and text sharing session titled "Buy at the Starting Point of Rise: Deciphering All K-Line Patterns (with Membership)" in AICoin PC End-Group Chat-Live. Here is a summary of the live content.
I. Handbook for Using Trend Lines
Trend lines are applicable across multiple timeframes. For day trading, focusing on short timeframes is sufficient, with periods below 15 minutes being deceptive, while one hour is more reliable.
1. Technique for Drawing Trend Lines
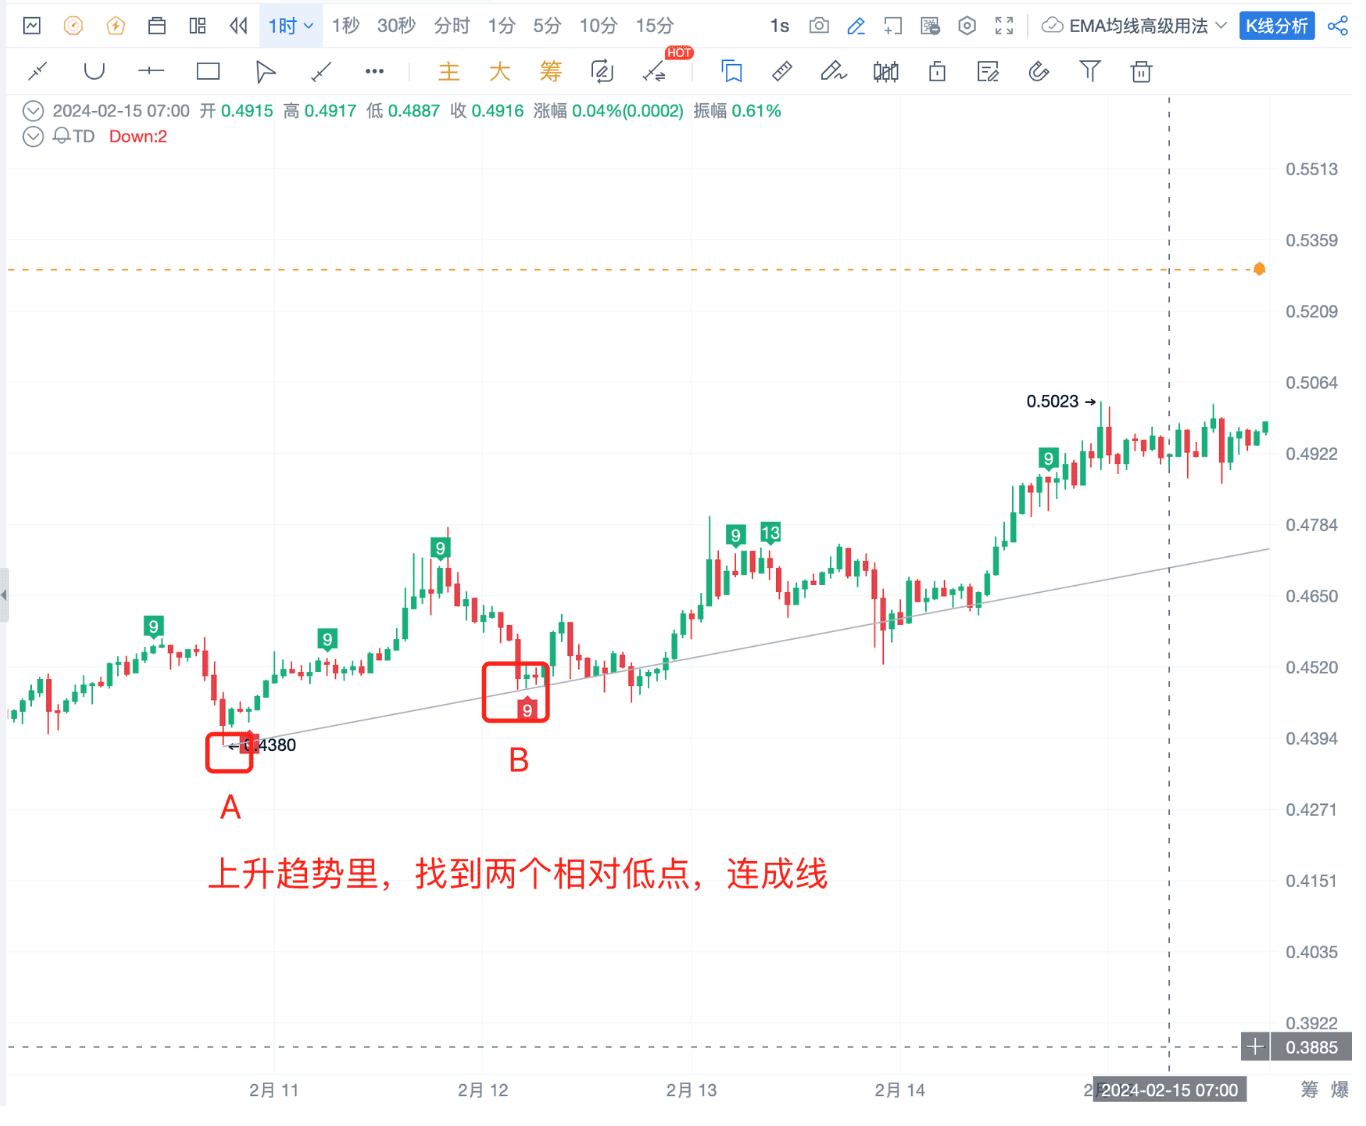
First, determine the trend—whether it's an uptrend or a downtrend—then start drawing the trend lines.
Technique: First find the trend! Then connect points A and B, which are relative lows.
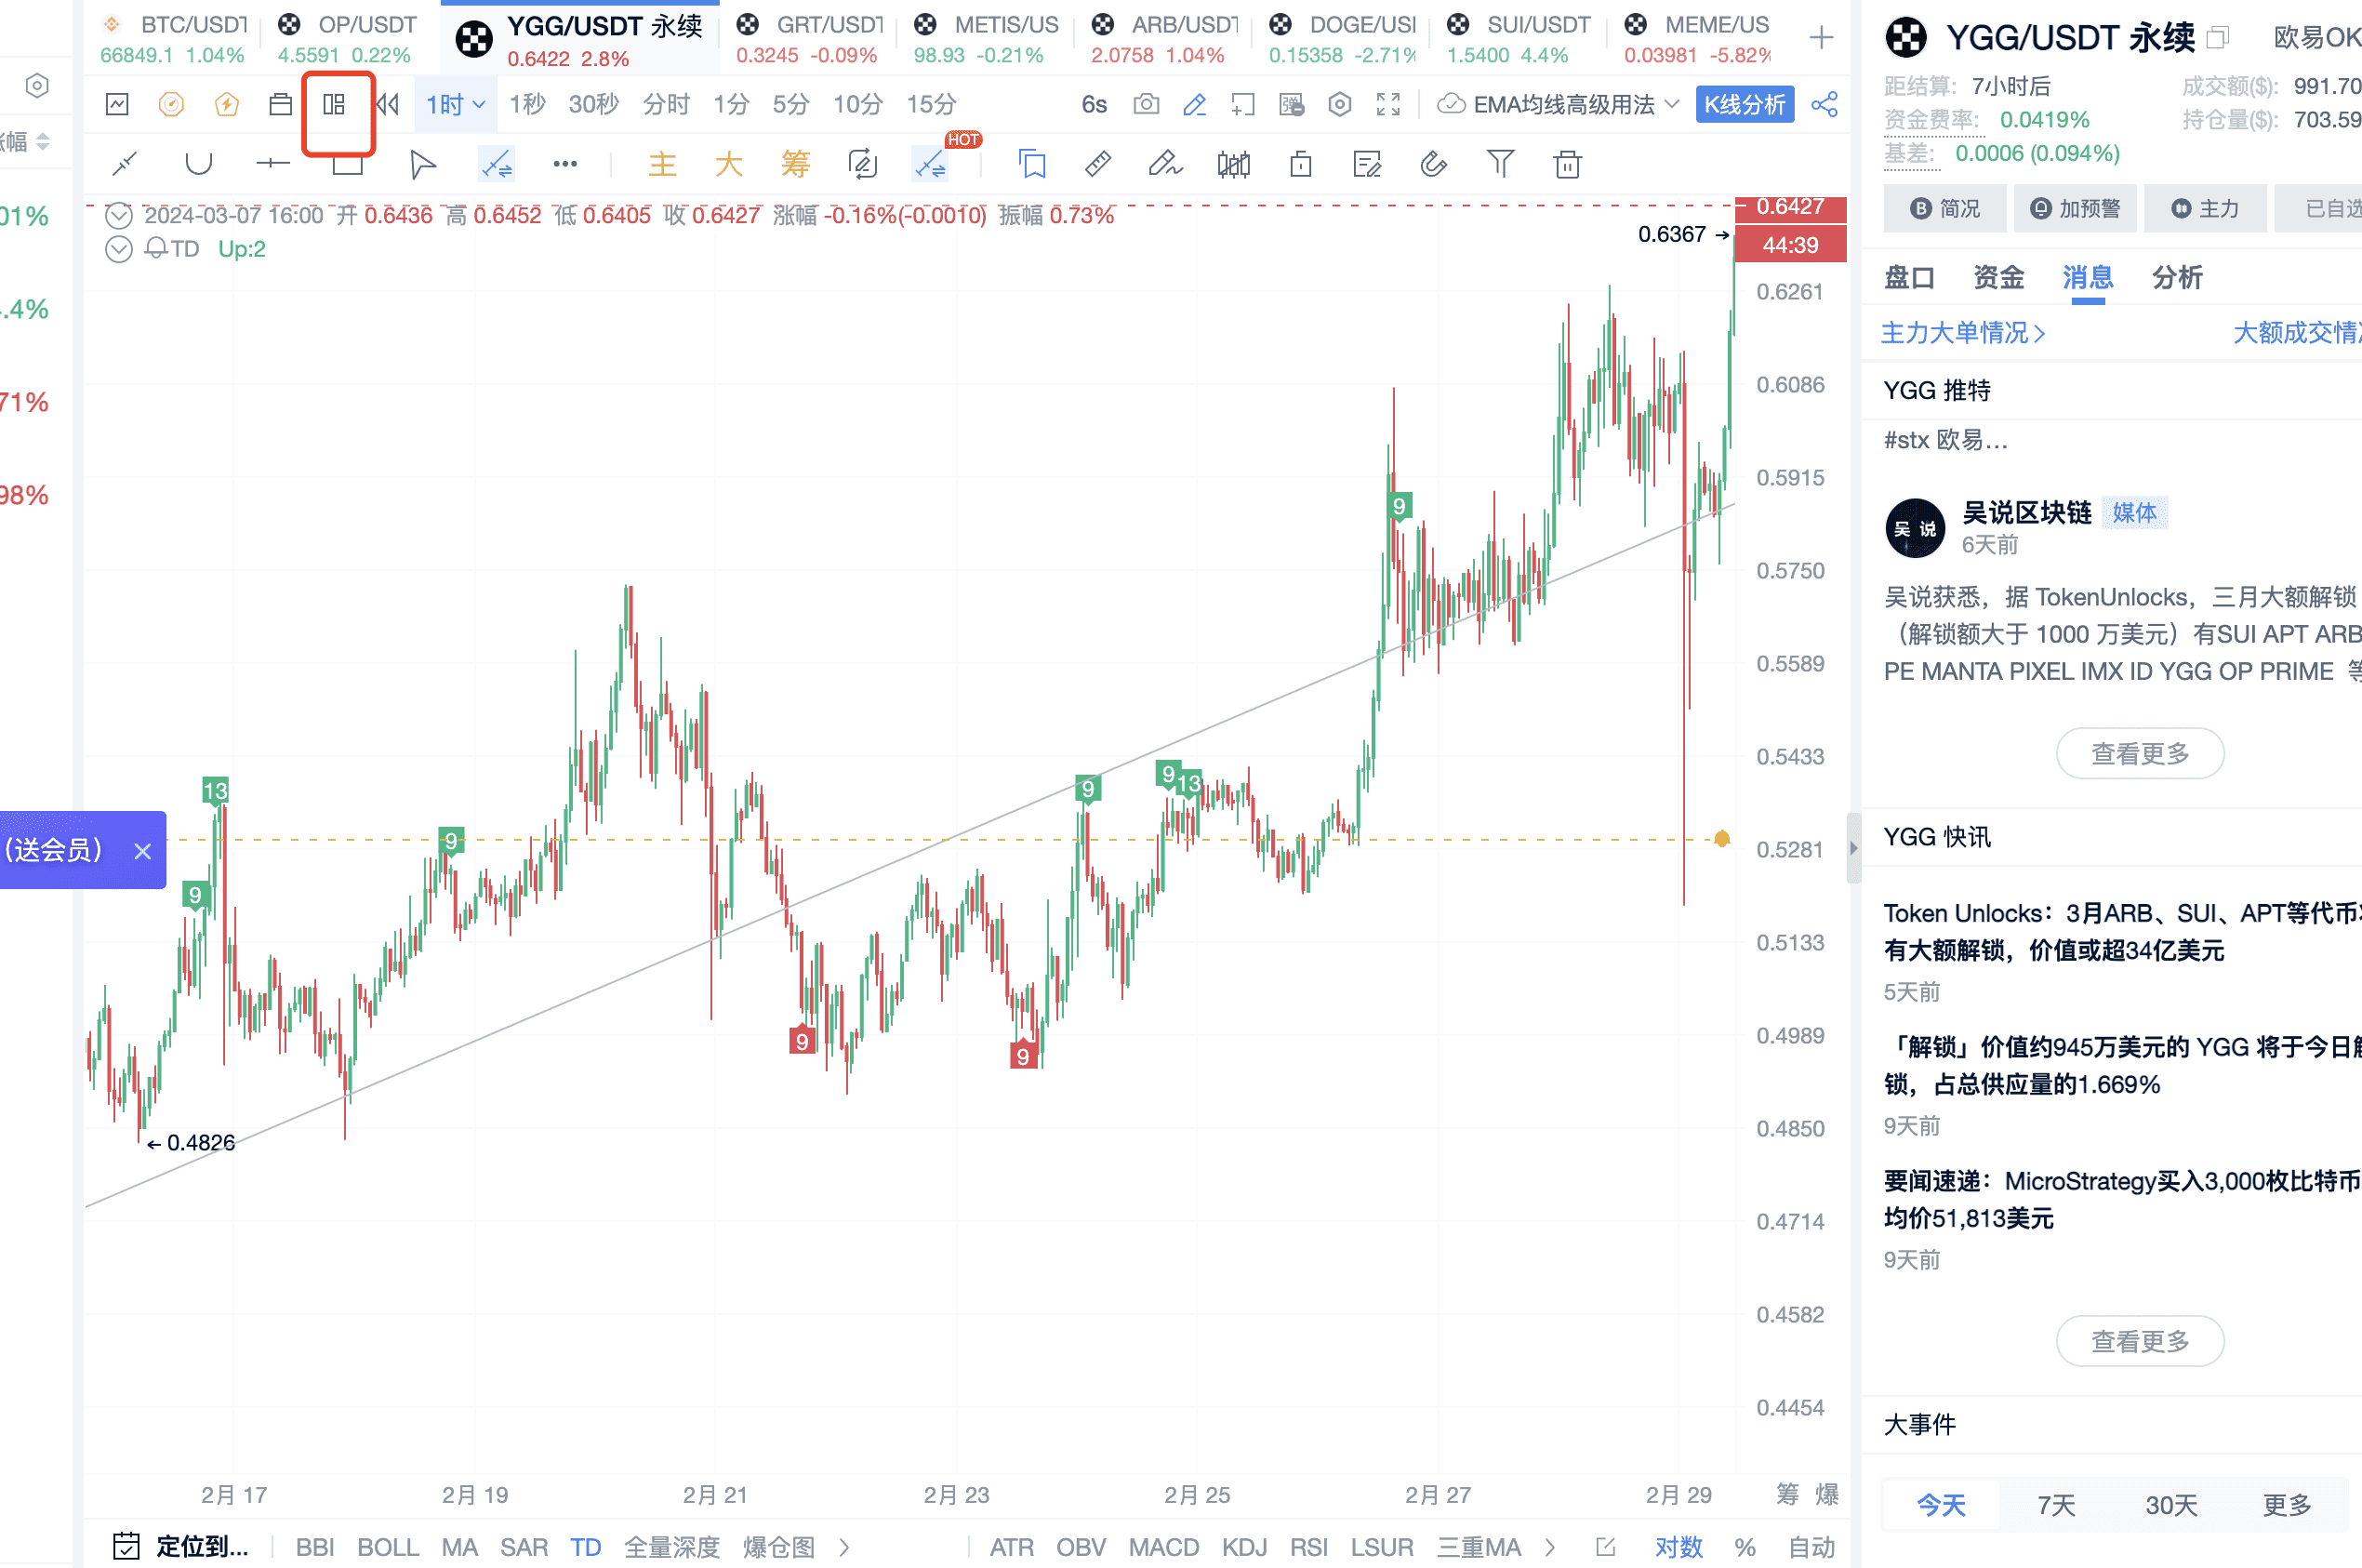
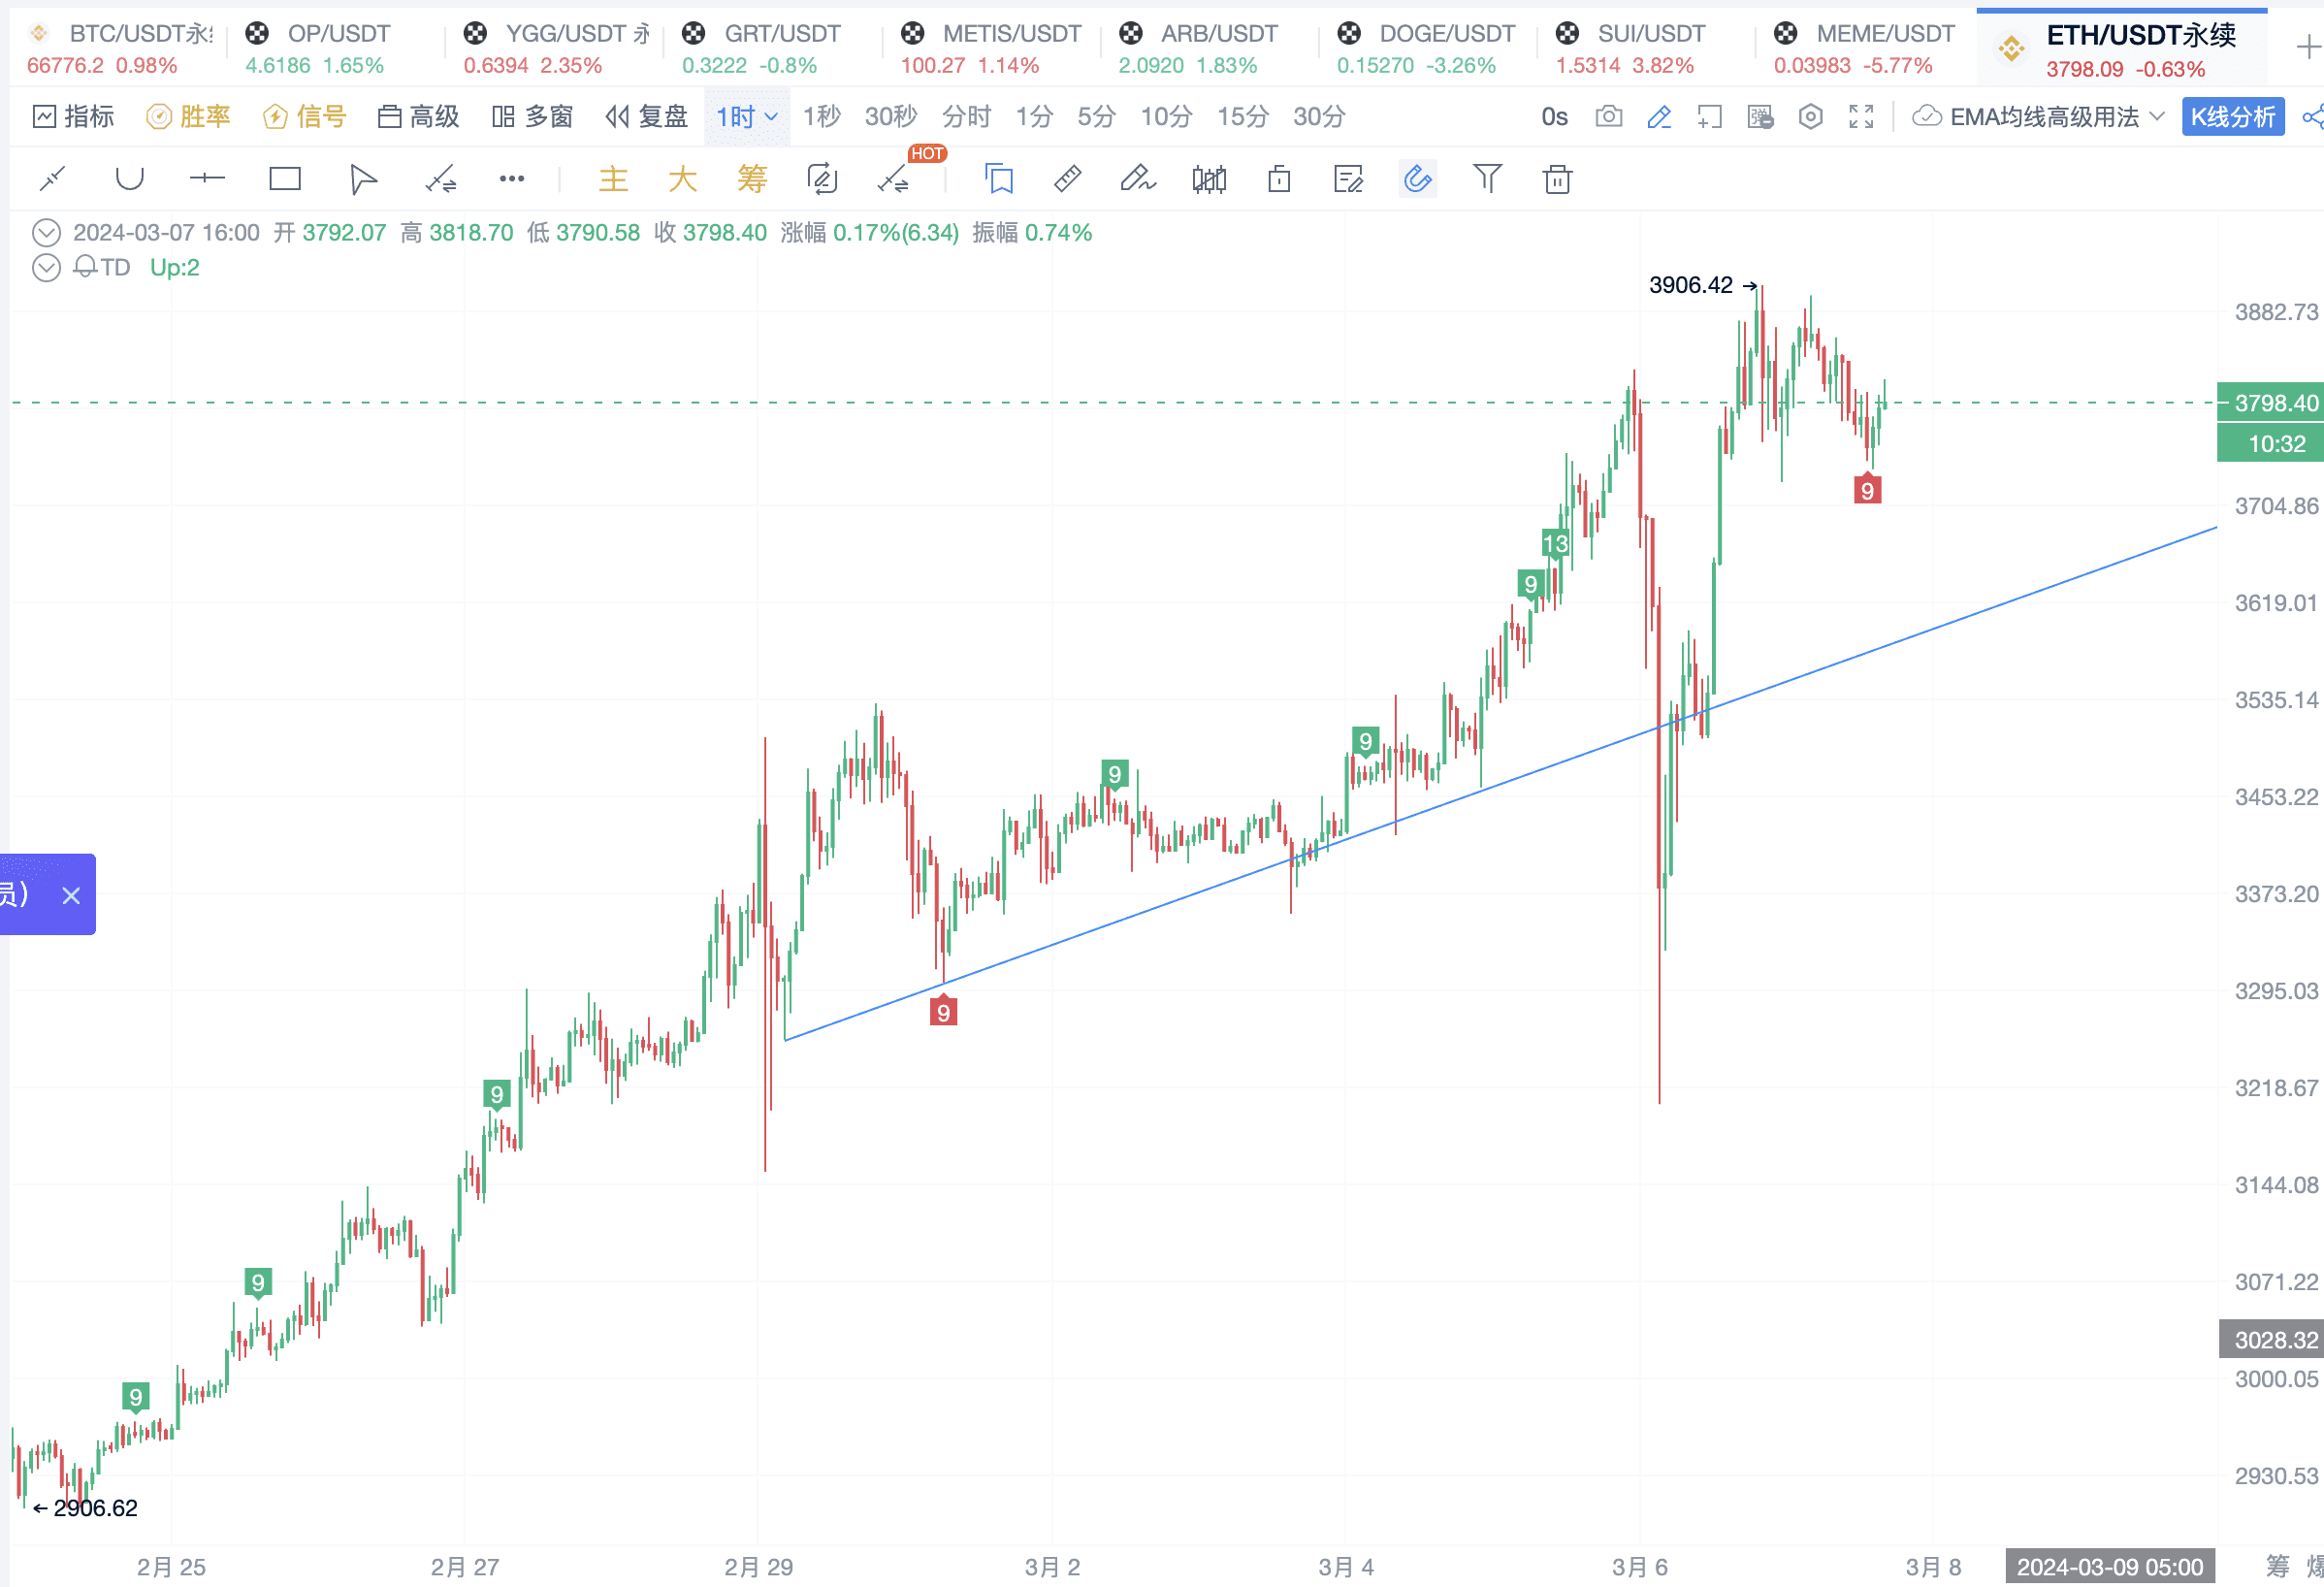
2. Example: Using YGG as an Example
Connect the two relative lows of the uptrend to draw the trend line.
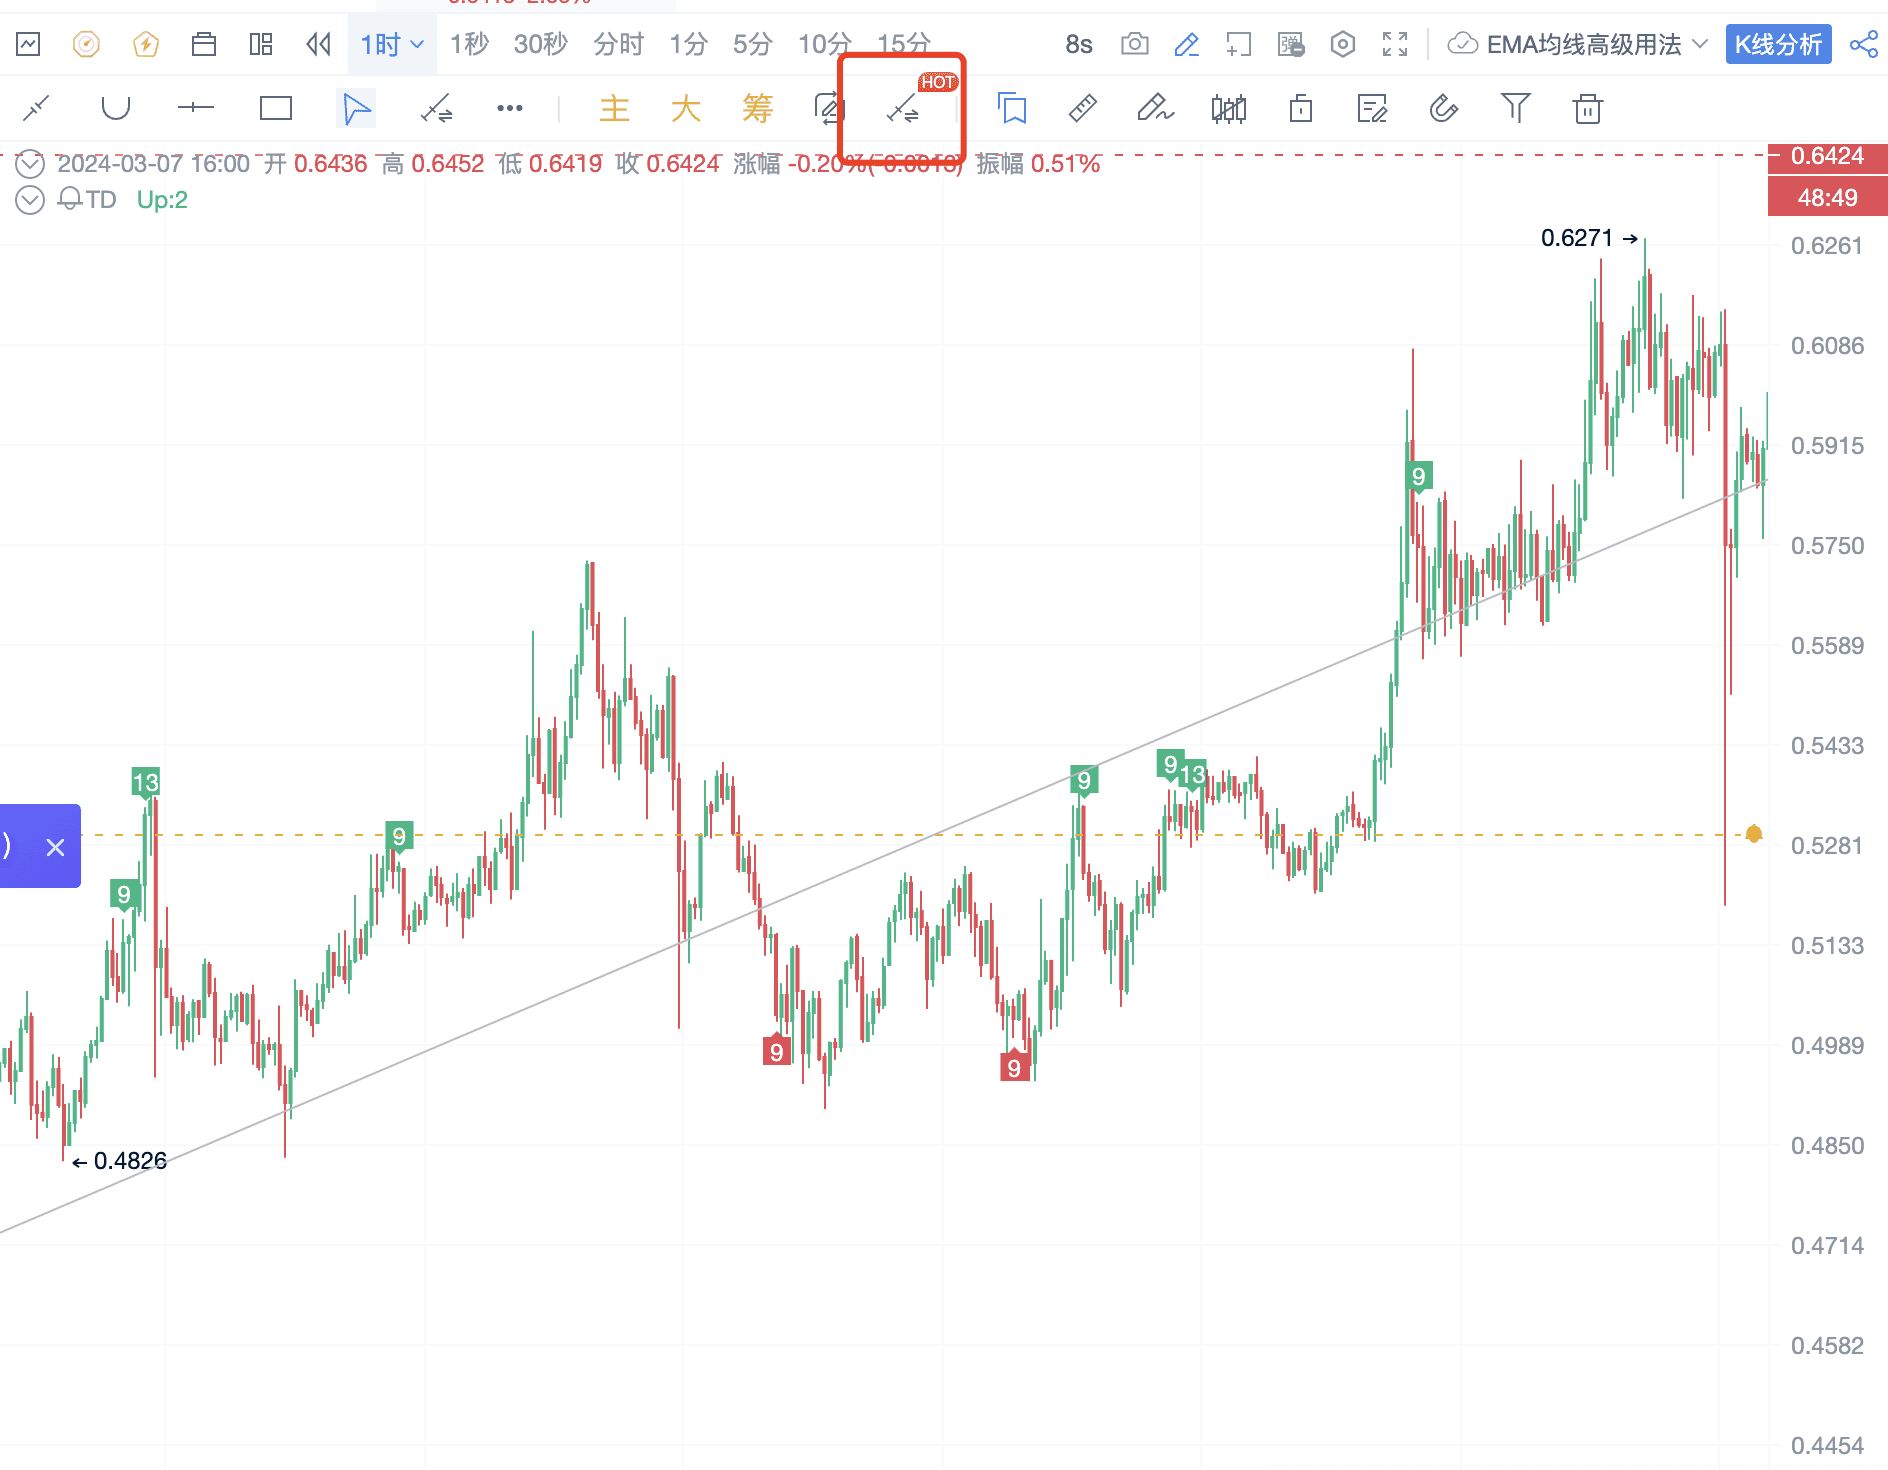
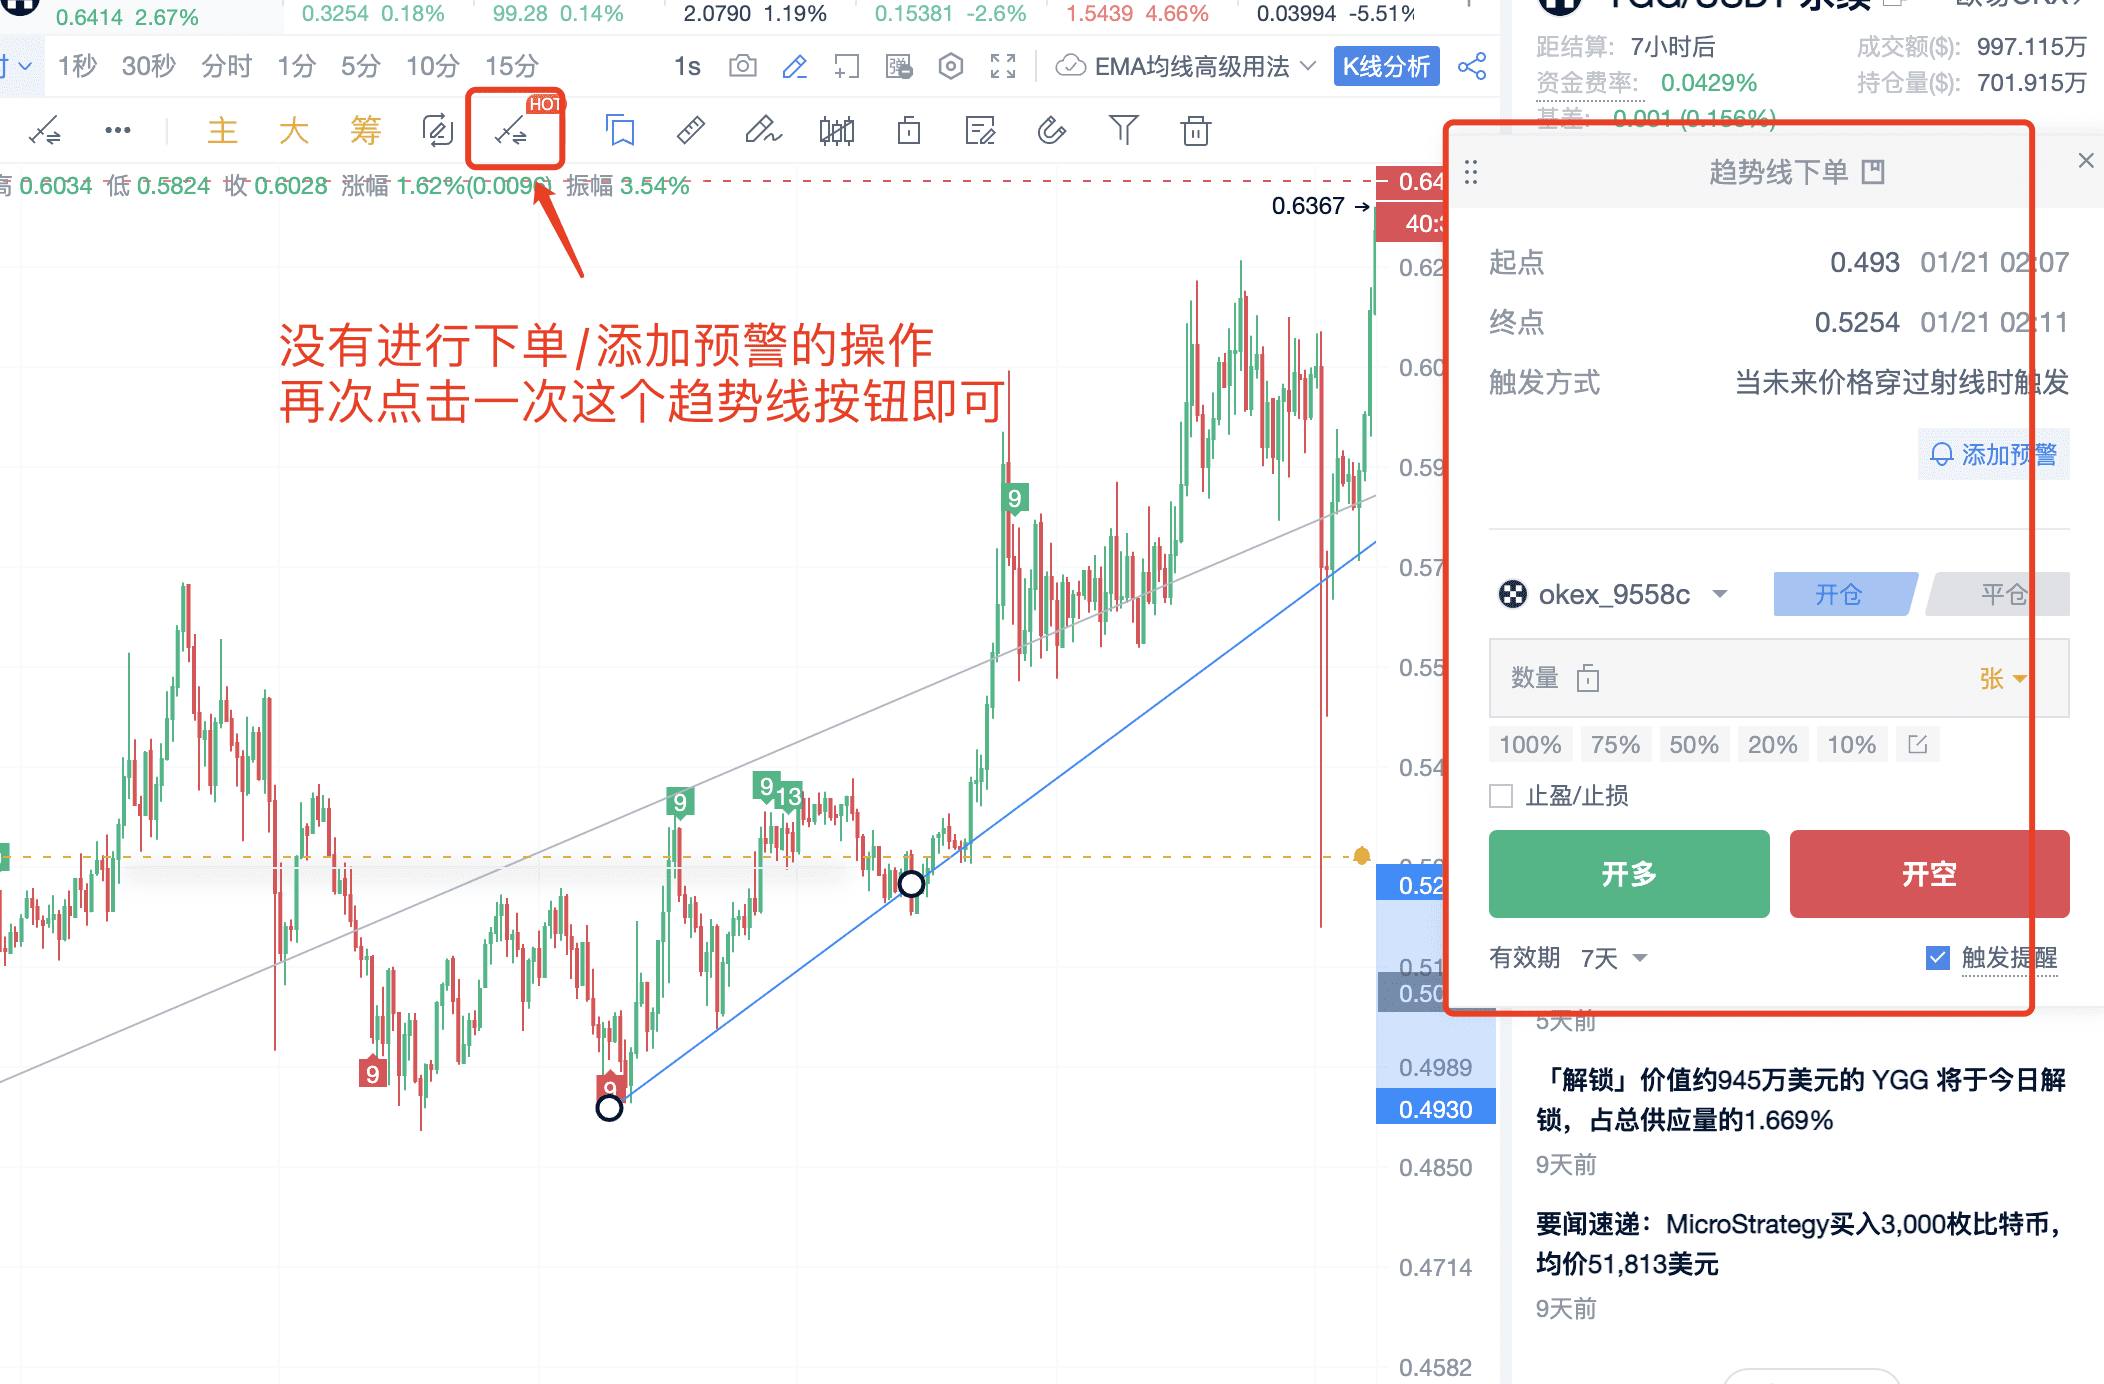
Additionally, trend lines can be used for placing orders and setting alerts.
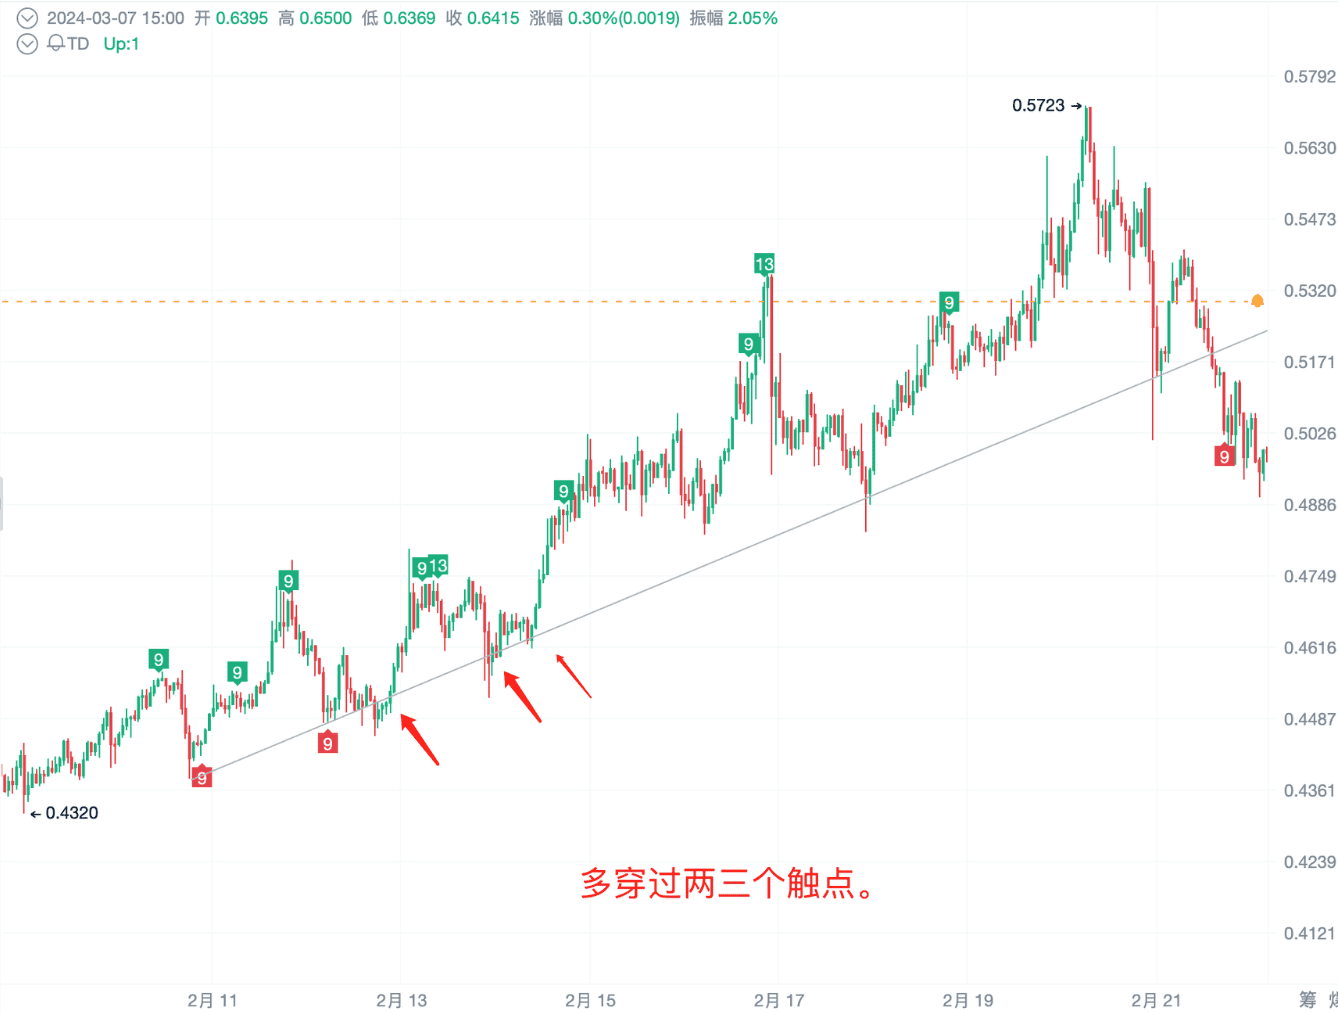
3. Two Principles of Trend Lines
(1) The longer the time, the more effective. (2) The more touchpoints, the more effective.
4. Drawing Trend Lines Across Multiple Timeframes
Because a 15-minute timeframe may produce false signals, it's best to combine multiple timeframes when analyzing trends. The images demonstrate using multiple windows to draw lines.
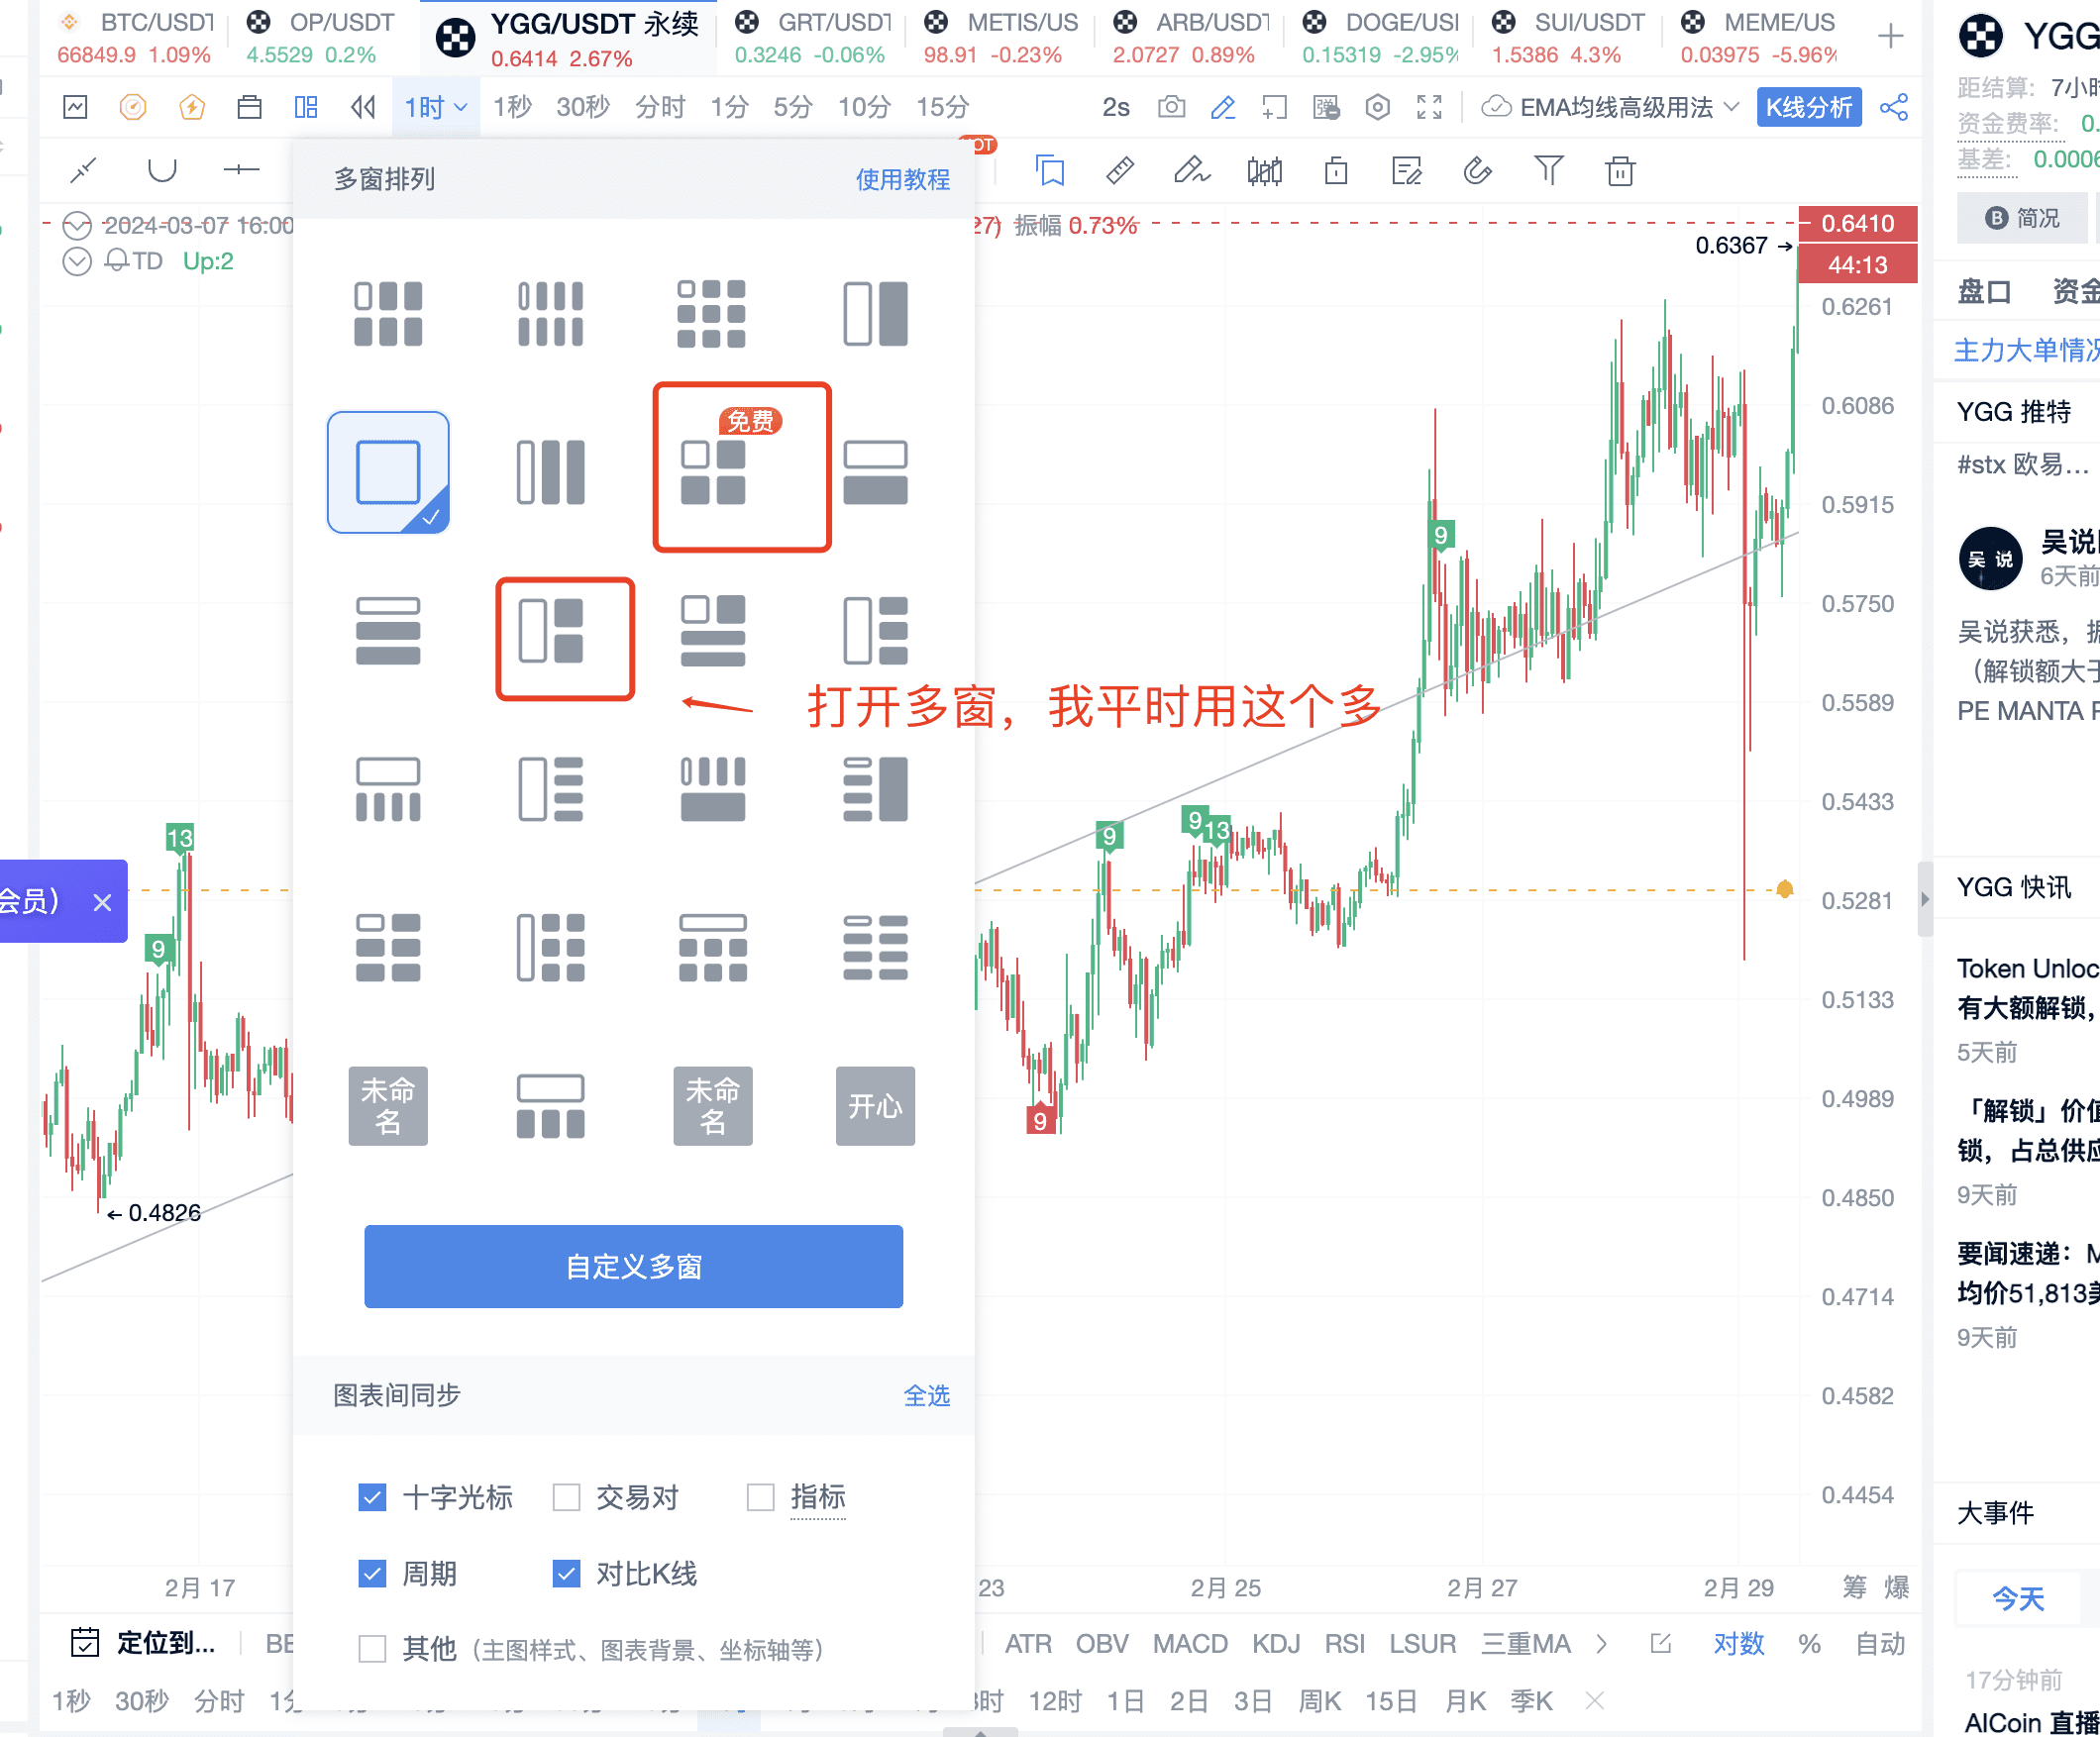
PRO members can customize, while regular users can use a four-grid layout, with lines visible only in the current timeframe. The multi-window display supports showing up to 9 candlestick charts simultaneously (non-PRO users can display 4 candlestick charts). Click here to immediately upgrade to the PRO version of the candlestick chart
II. Setting and Significance of K-Line Patterns
1. Reason for Combining Trend Lines with K-Line Patterns: Because market trends do not always follow trend lines, it's effective to combine trend lines with K-line patterns.
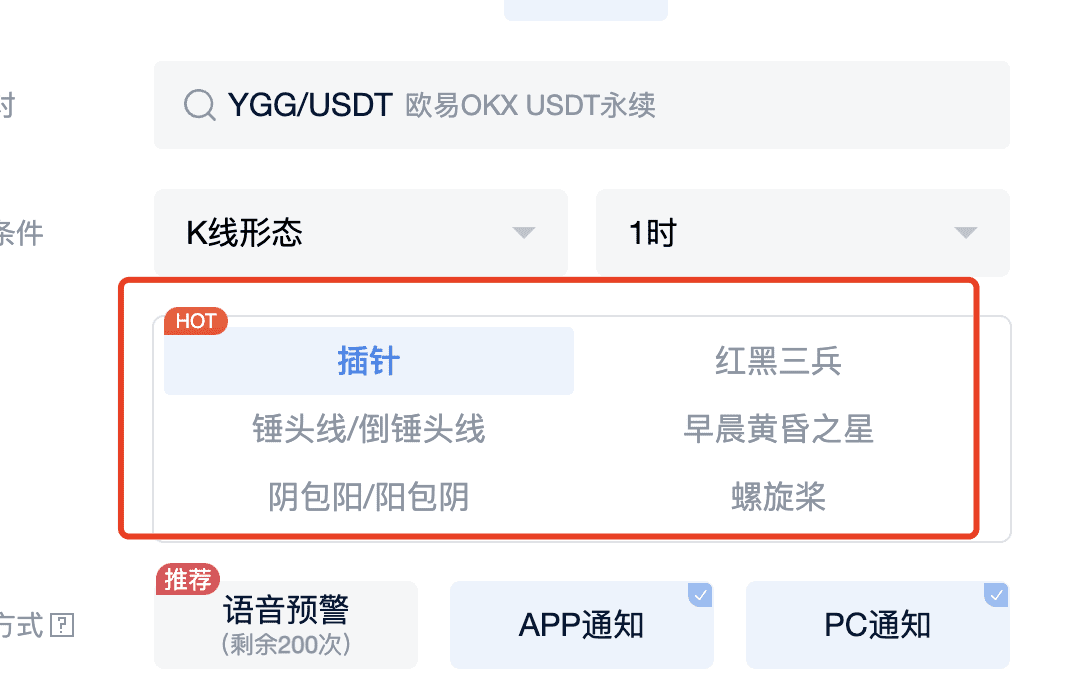
2. Types of K-Line Patterns
K-line patterns include pin bars, red-black three soldiers, hammer lines, evening stars, bearish engulfing, bullish engulfing, red-black three soldiers, and spinning tops. If the K-line pattern signal appears near the trend line, the success rate of opening positions will be higher.
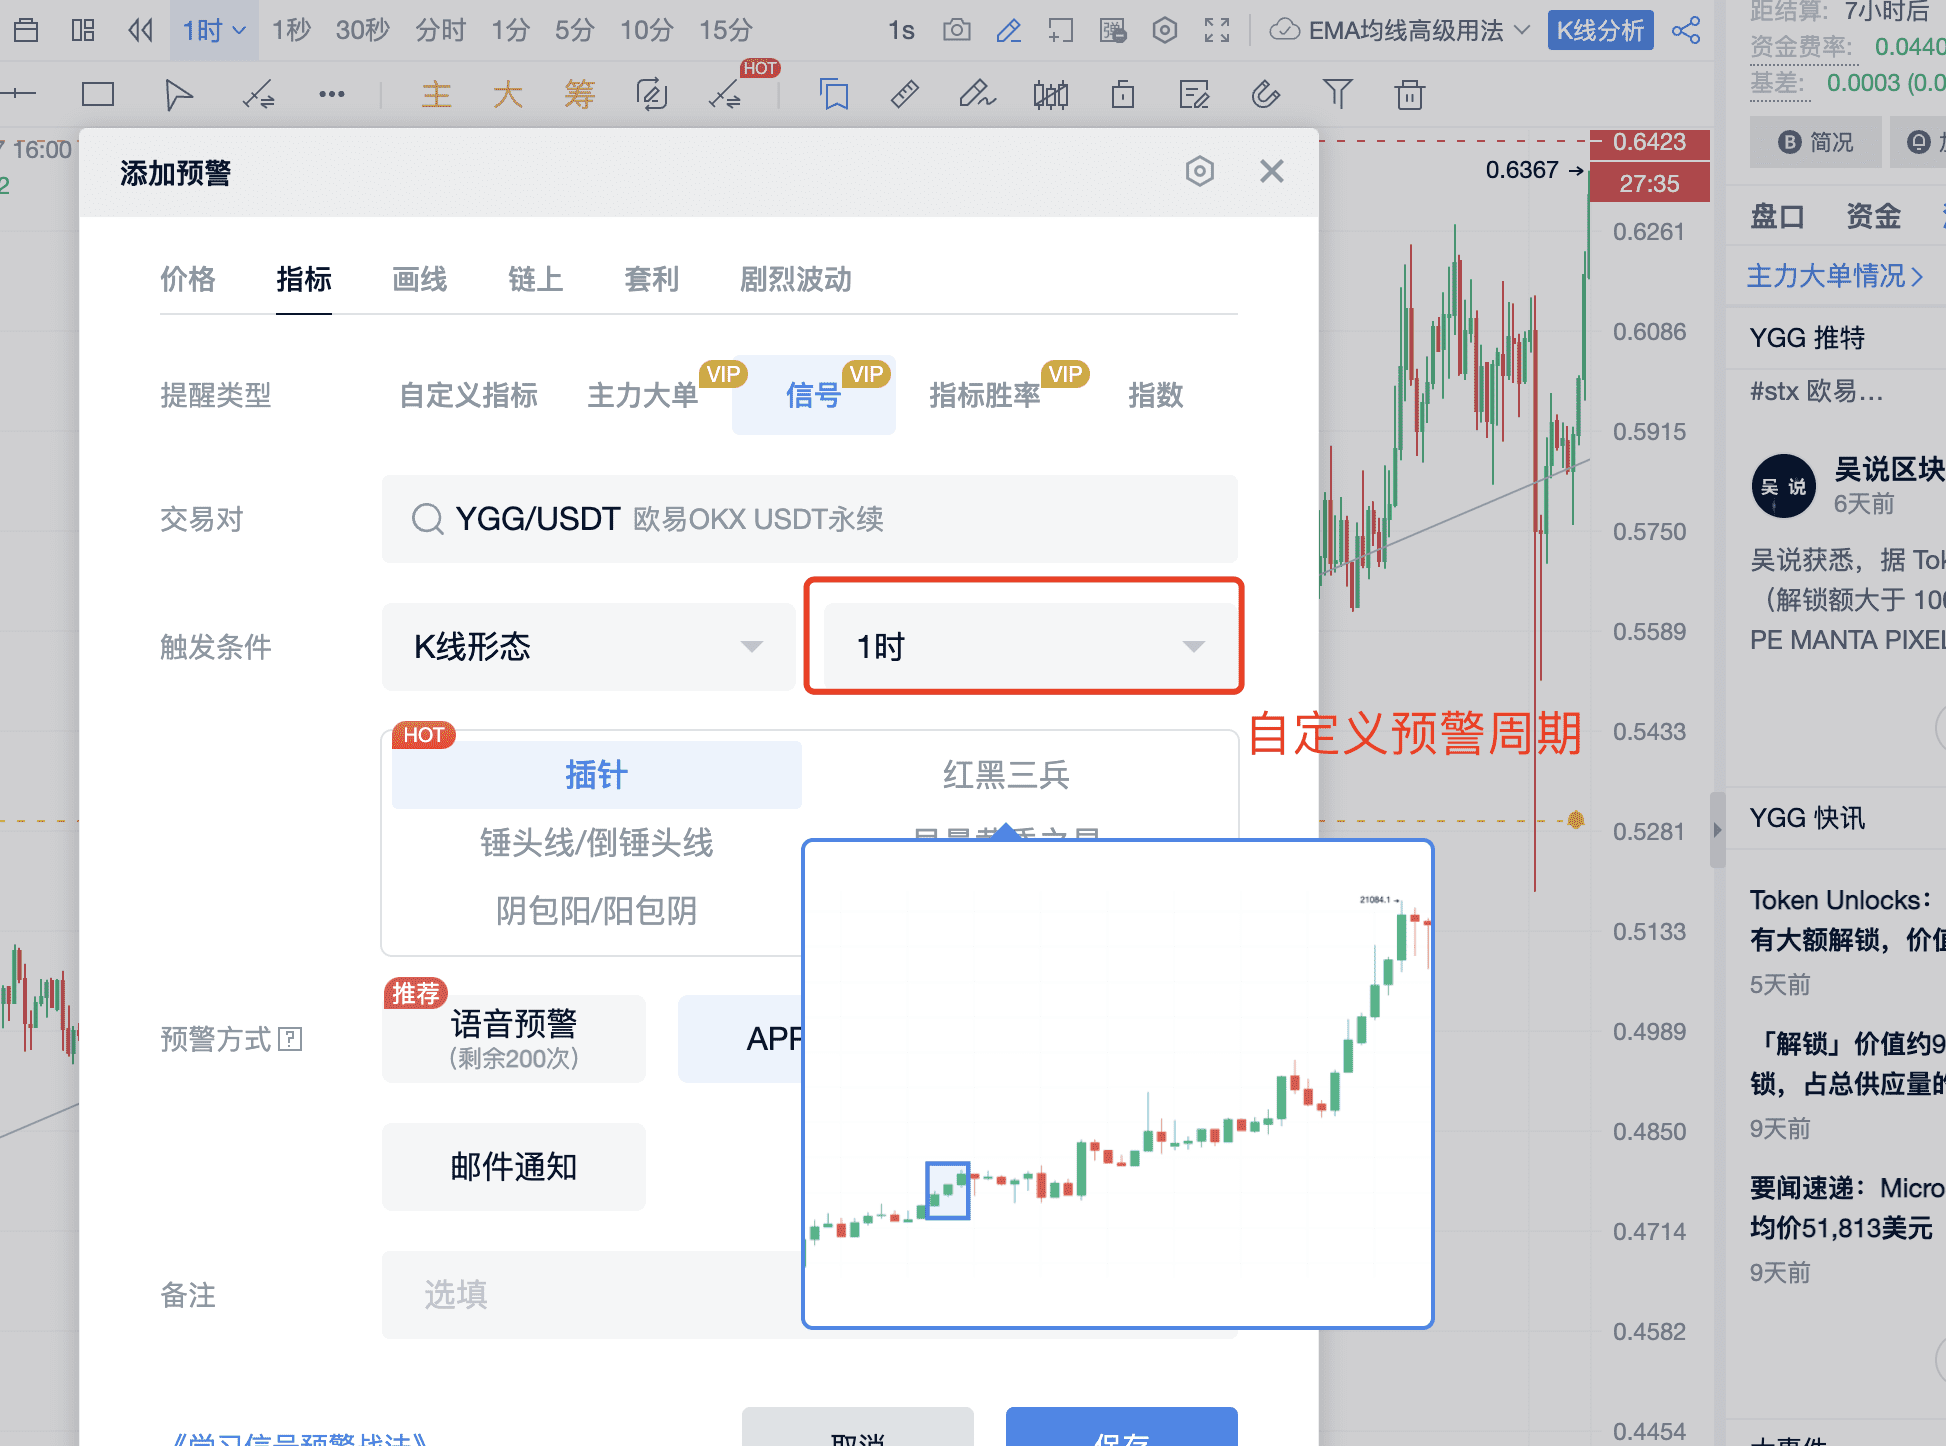
3. Specific Settings for K-Line Patterns
First, right-click to select signal alerts.
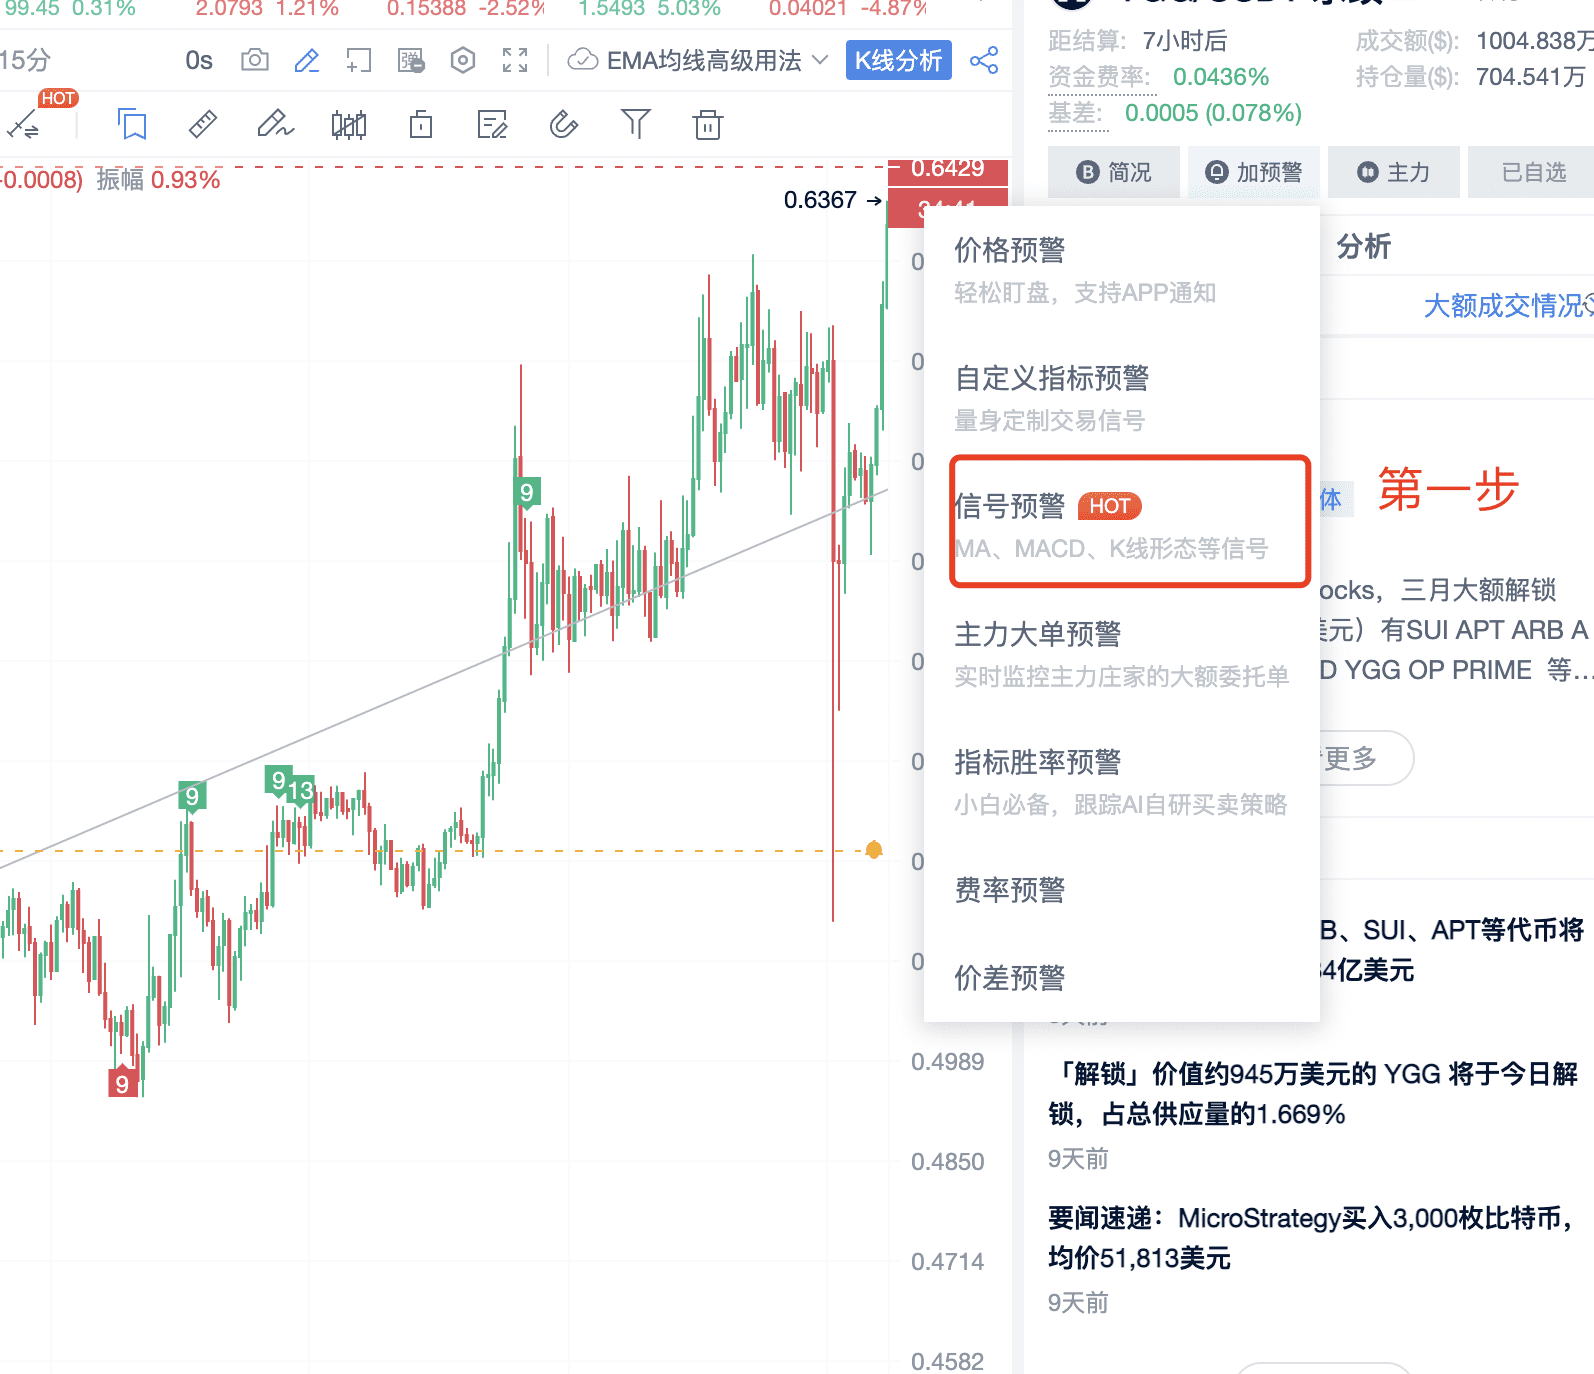
Second, find the indicator—signal.
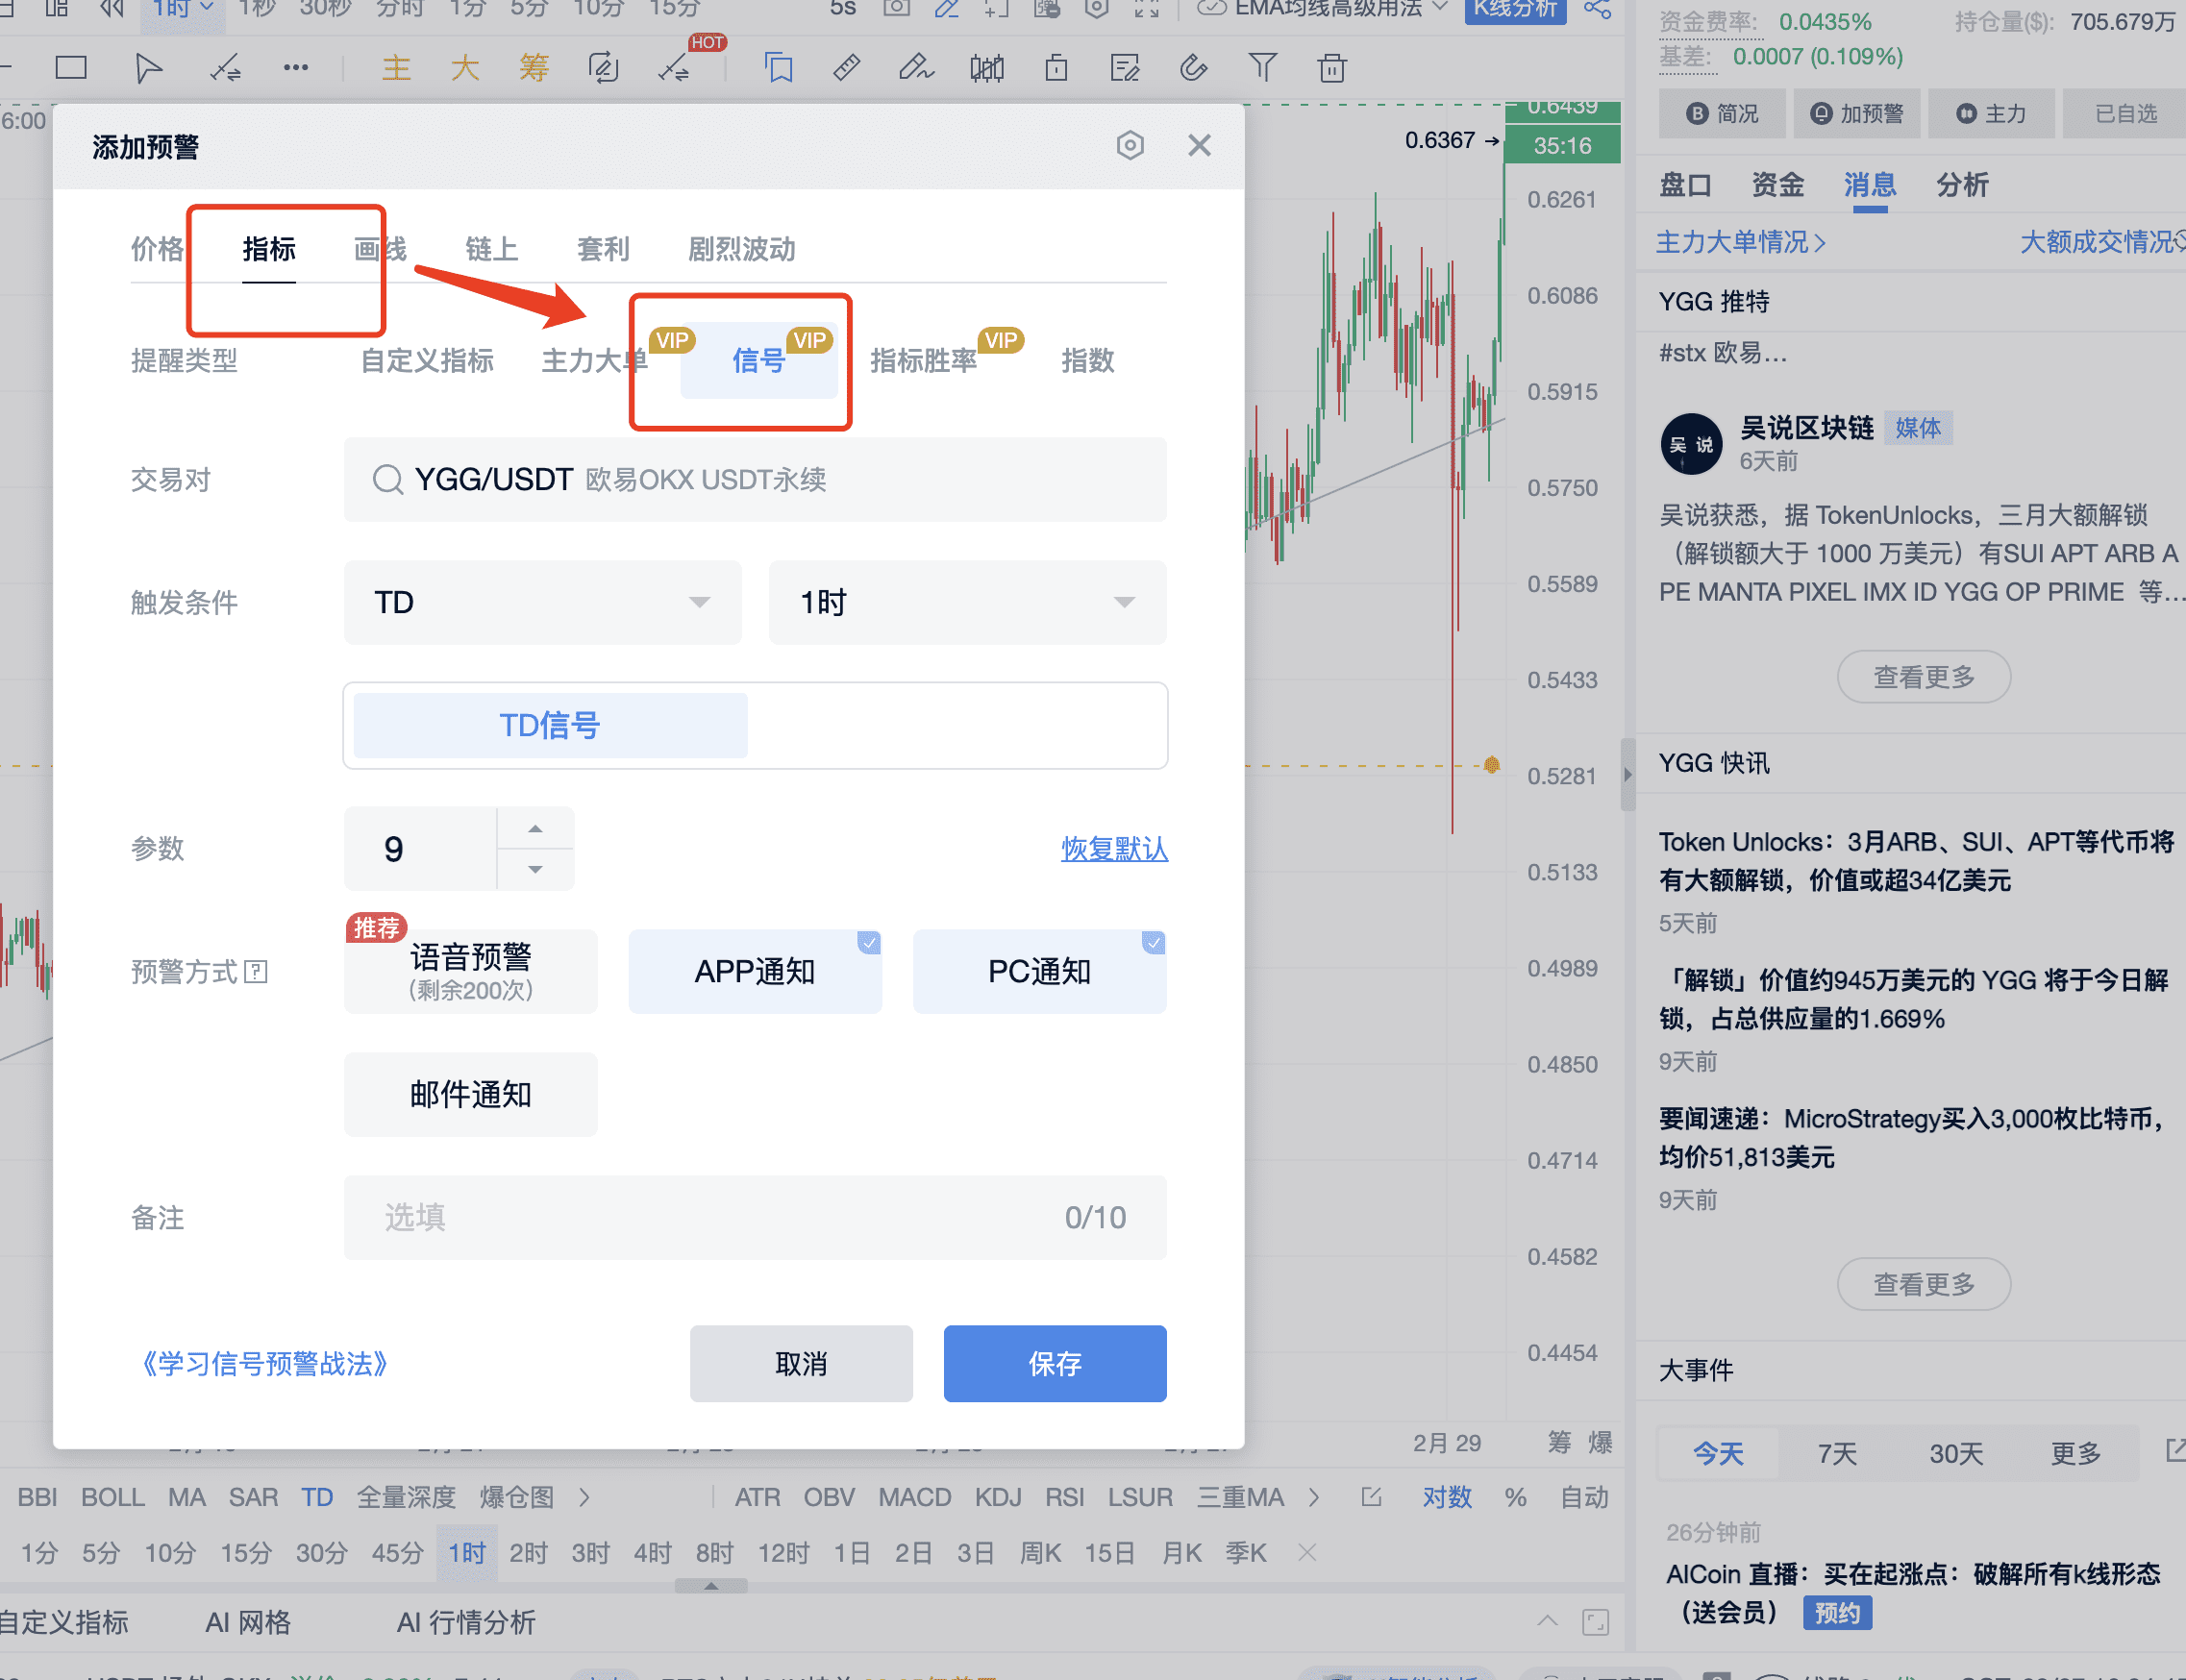
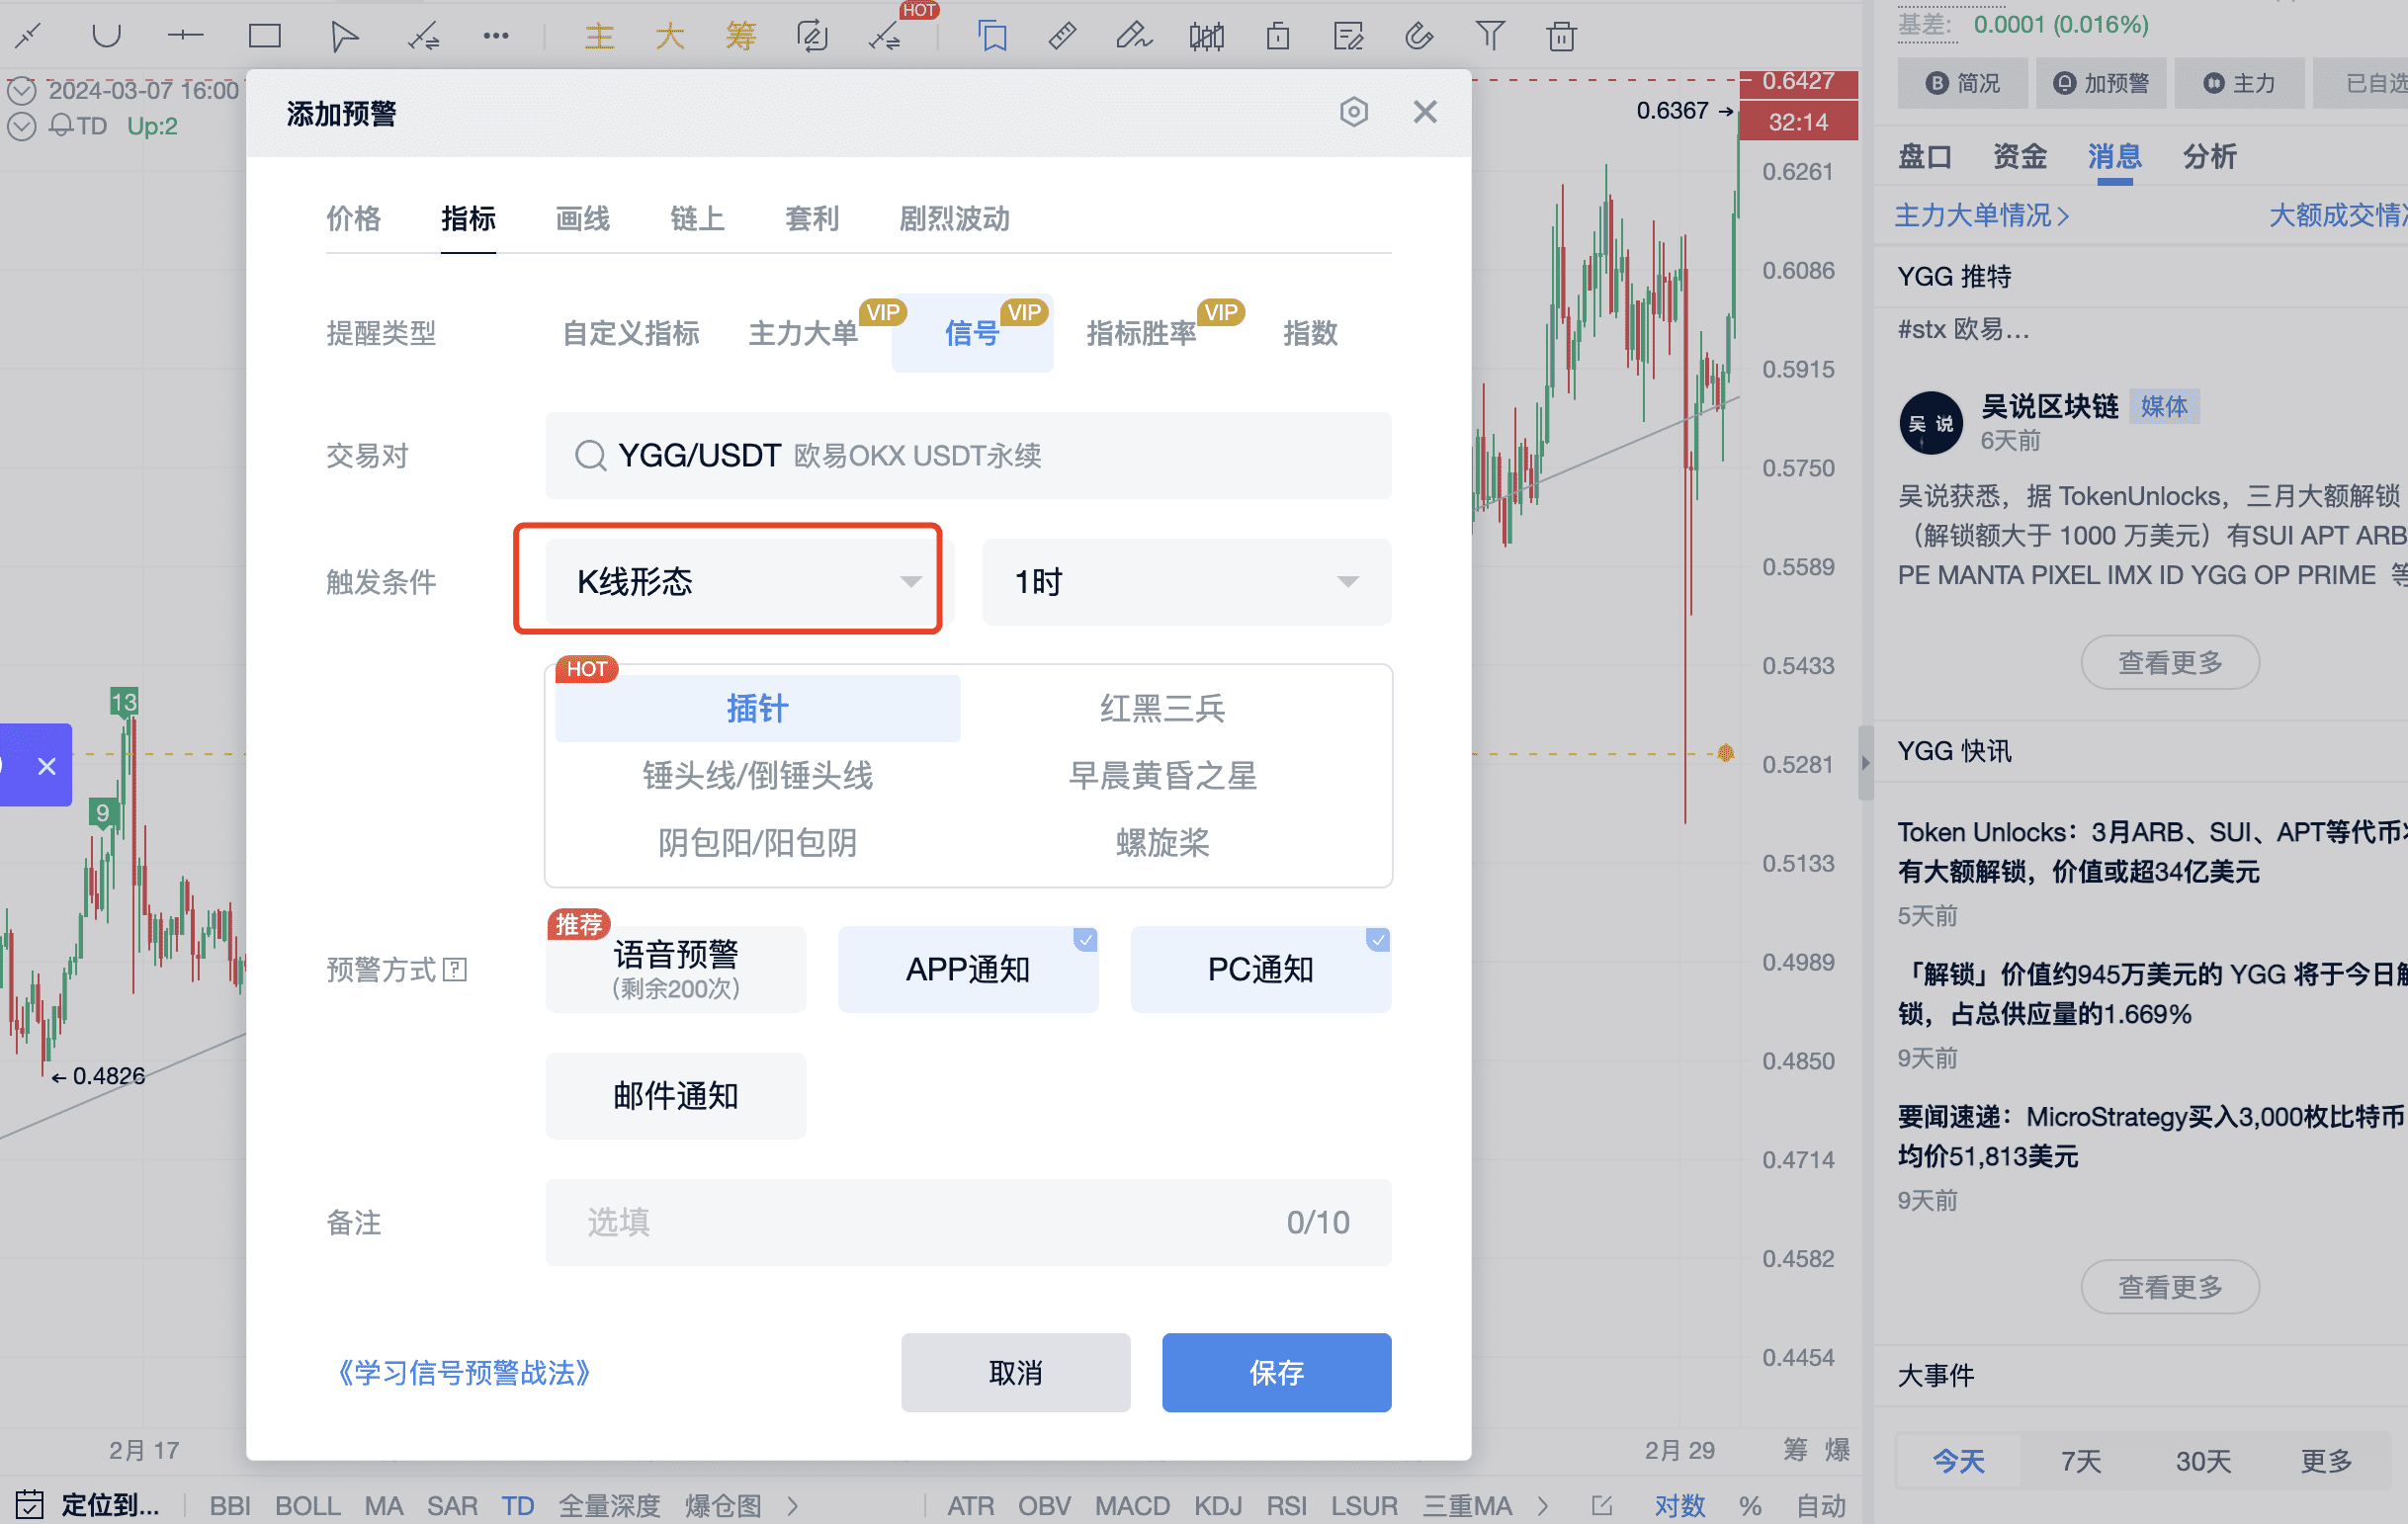
Third, select "K-Line Pattern" from the trigger condition dropdown.
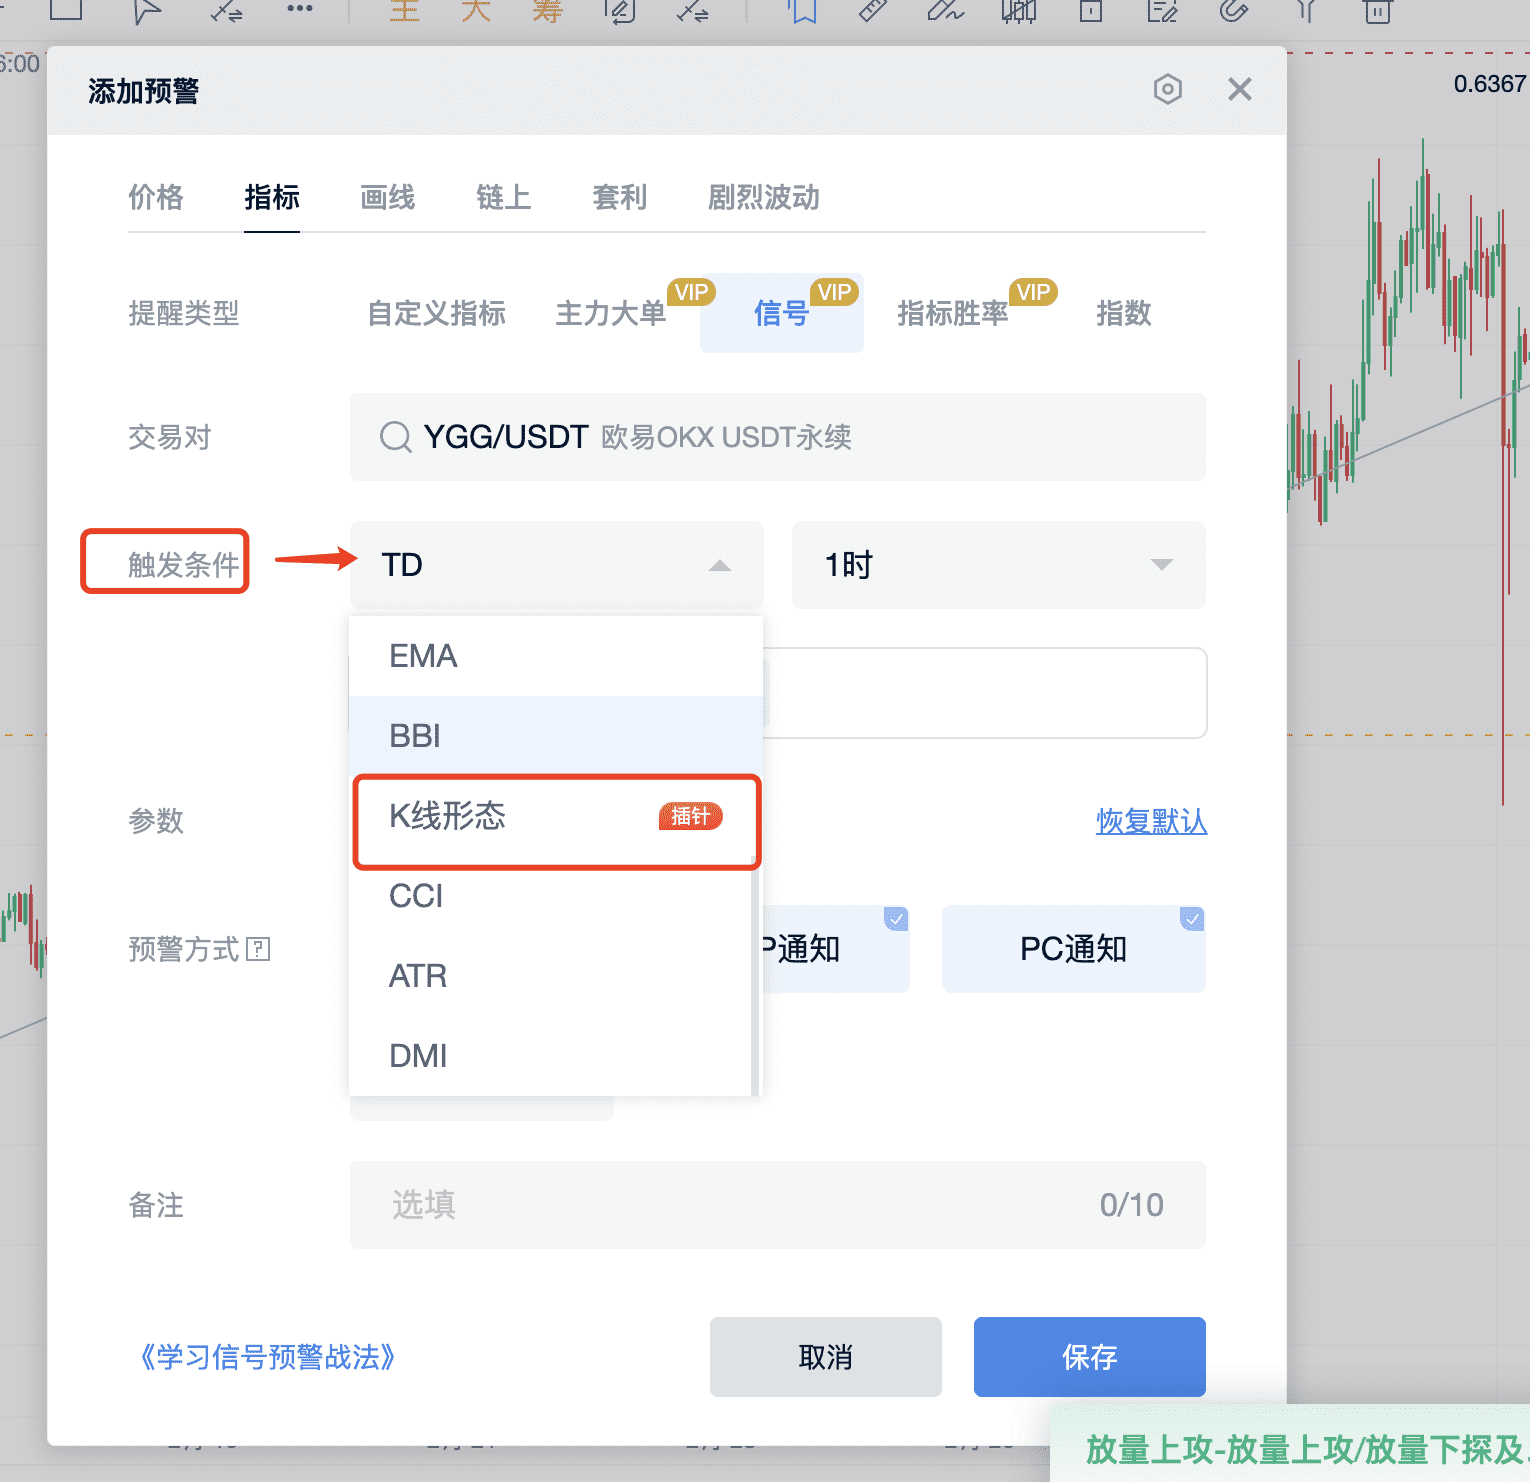
Open this interface to view K-line patterns.
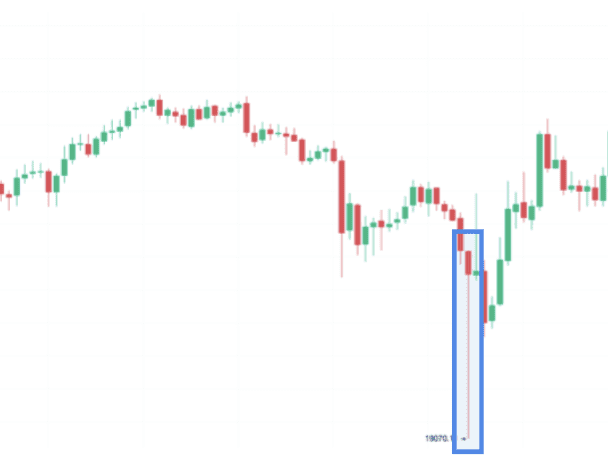
K-Line Pattern—Pin Bar, display effect.
K-Line Pattern—Red Three Soldiers, display effect.
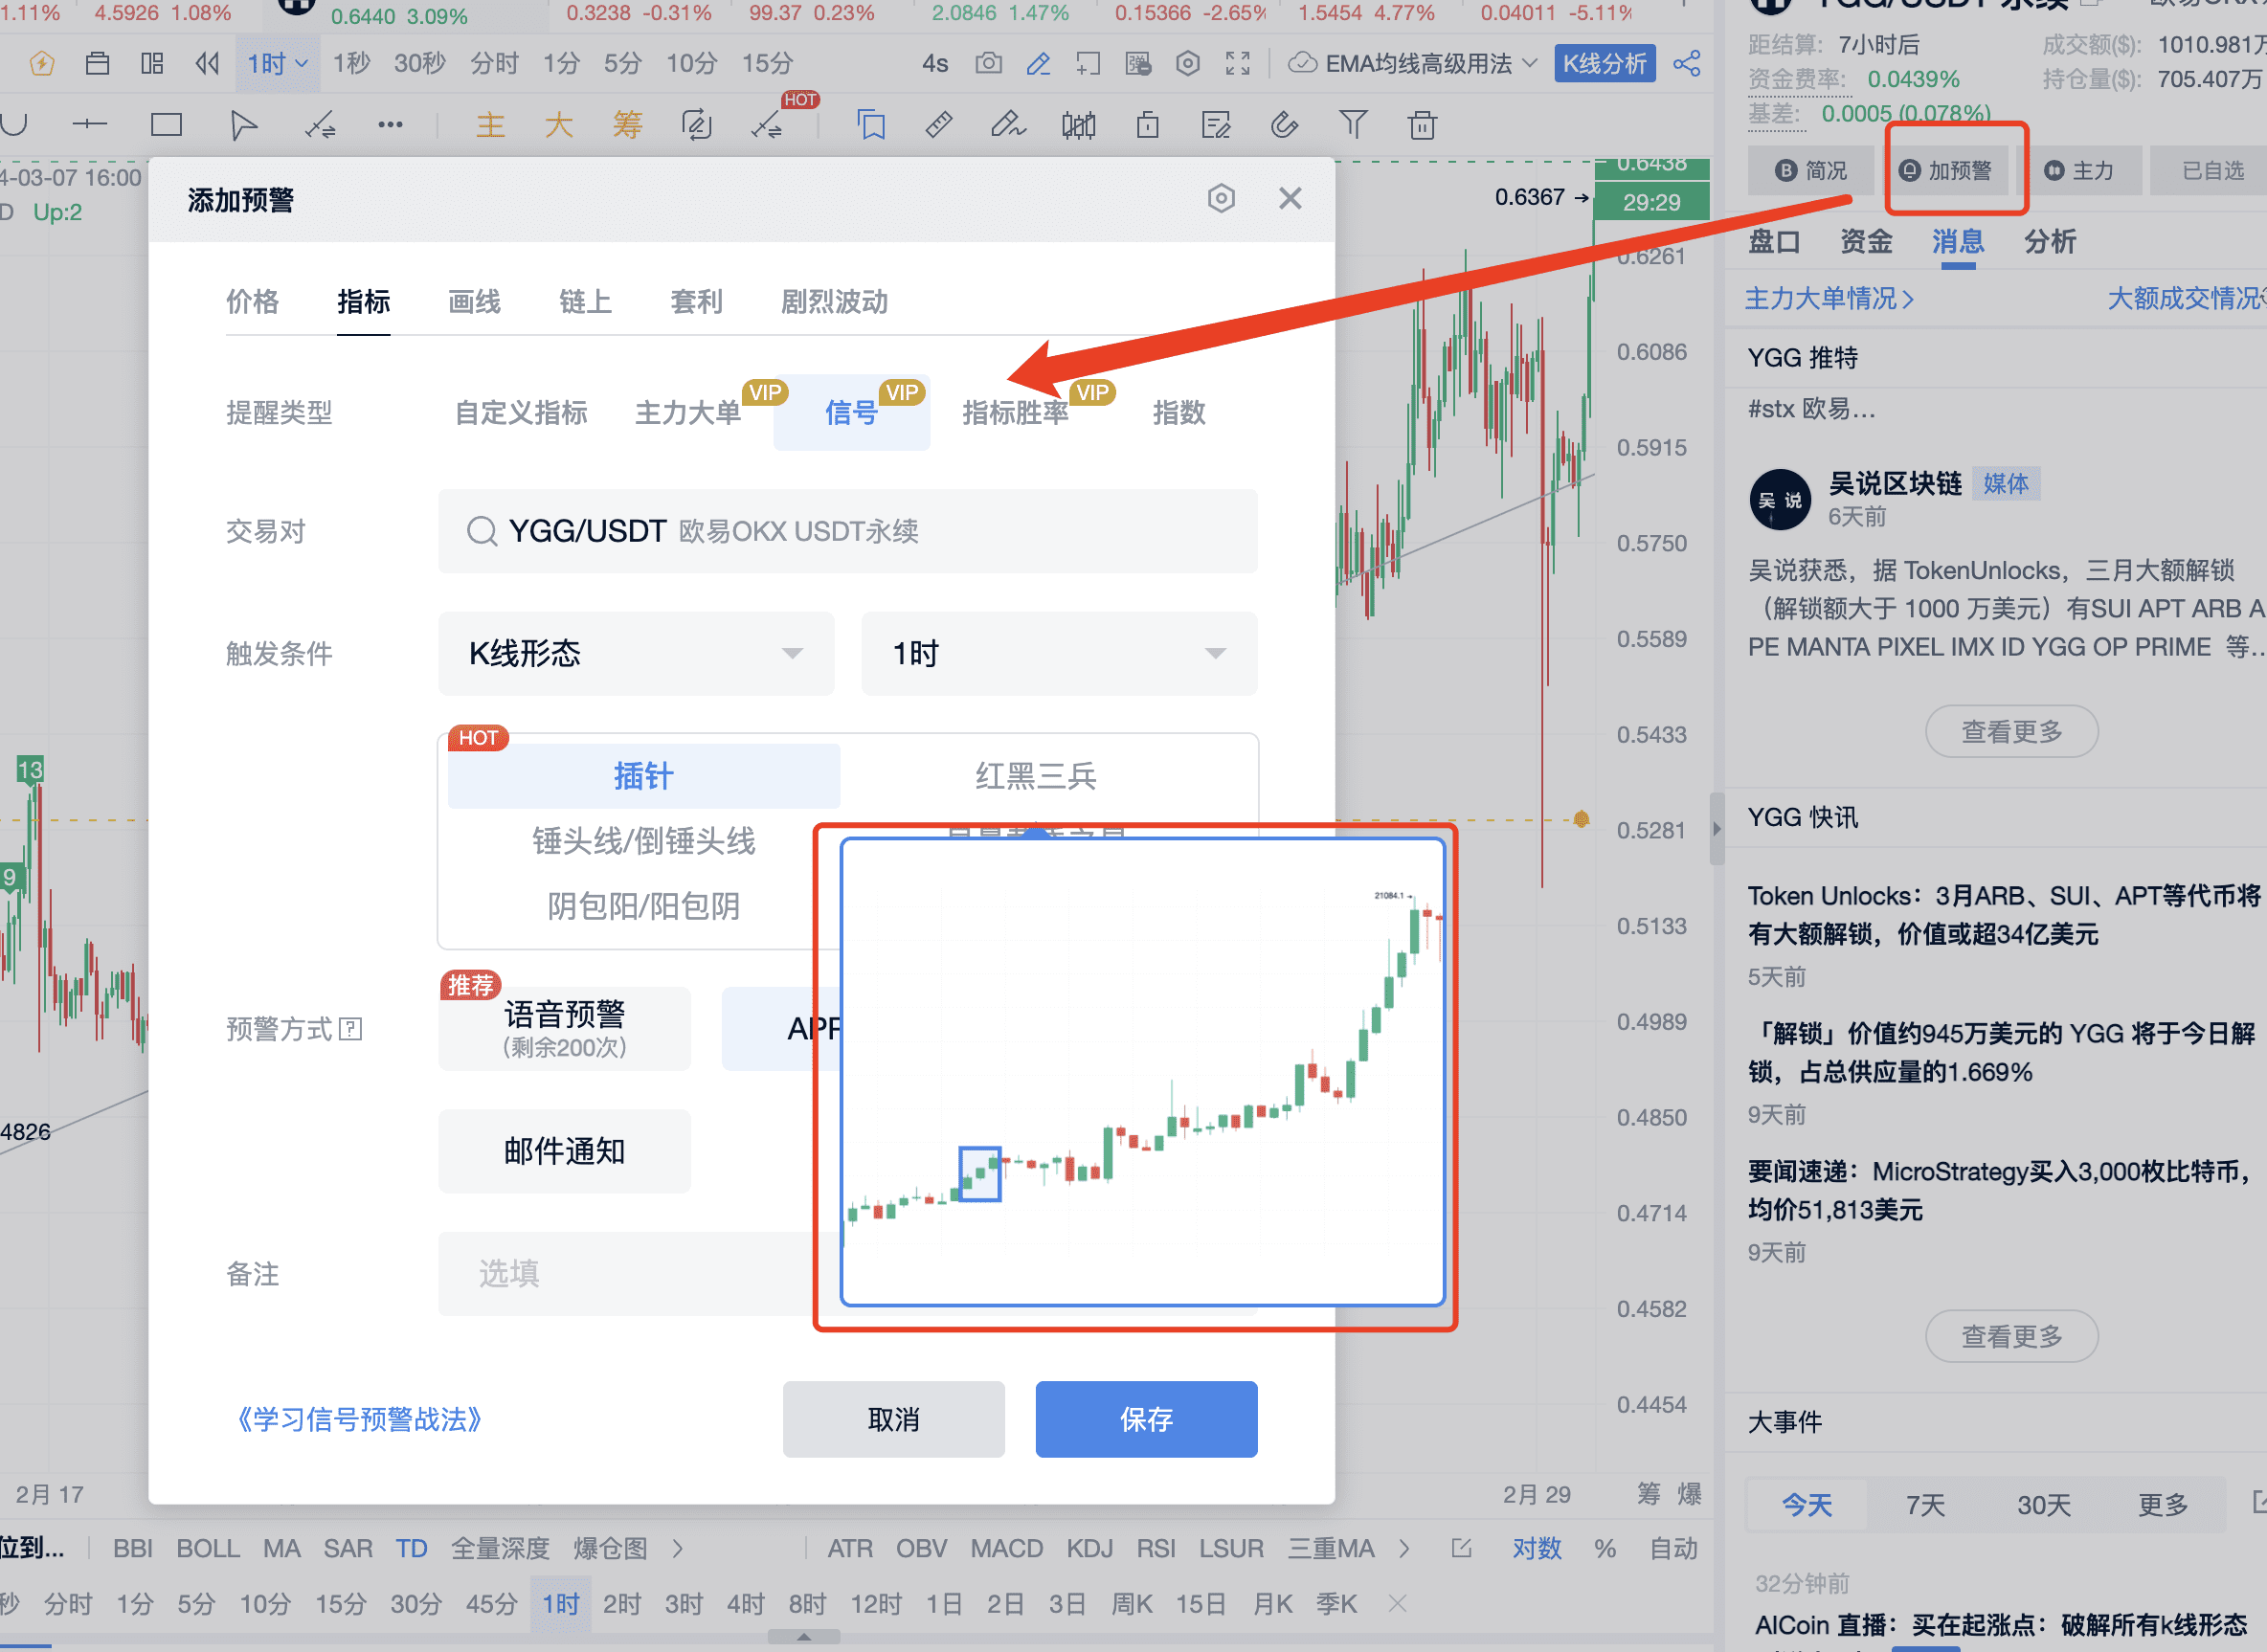
Signal alerts can be set for red three soldiers, with related alert periods and displayed on the candlestick chart. Especially when red three soldiers appear near the trend line, close to the touchpoint of the trend line, it indicates an impending breakthrough—this is the signal!
4. K-Line Patterns—Pin Bars and Red-Black Three Soldiers are worth paying attention to, as they are formed by the power of capital.
5. Trading Rules: Trend line breakthrough + K-line pattern (pin bar/hammer line/inverted hammer line/bearish engulfing/bullish engulfing/red-black three soldiers/morning star/evening star/spinning top).
Signal alerts can be set to monitor the K-line patterns above. Set alerts for the cryptocurrencies of interest to never miss out on market trends. Click to experience it immediately: https://aicoin.app/vip/signal
III. Summary of Key Points
1. Trading Rules: Trend line breakthrough + K-line pattern (pin bar/hammer line/inverted hammer line/bearish engulfing/bullish engulfing/red-black three soldiers/morning star/evening star/spinning top) (key positions + key locations) for a confident buy-in.
2. Combining K-Line Pattern Signals: Special K-line patterns like red three soldiers can only be set by members. Key positions plus key locations, double buy signals. To confirm these positions, in combination with AICoin's membership features, you can capture the best buy-in points at the earliest opportunity.
IV. Practical Roadshow of Trend Lines + K-Line Patterns
1. Drawing Trend Lines
OKX practical 5-minute chart, drawing lines for ETH.
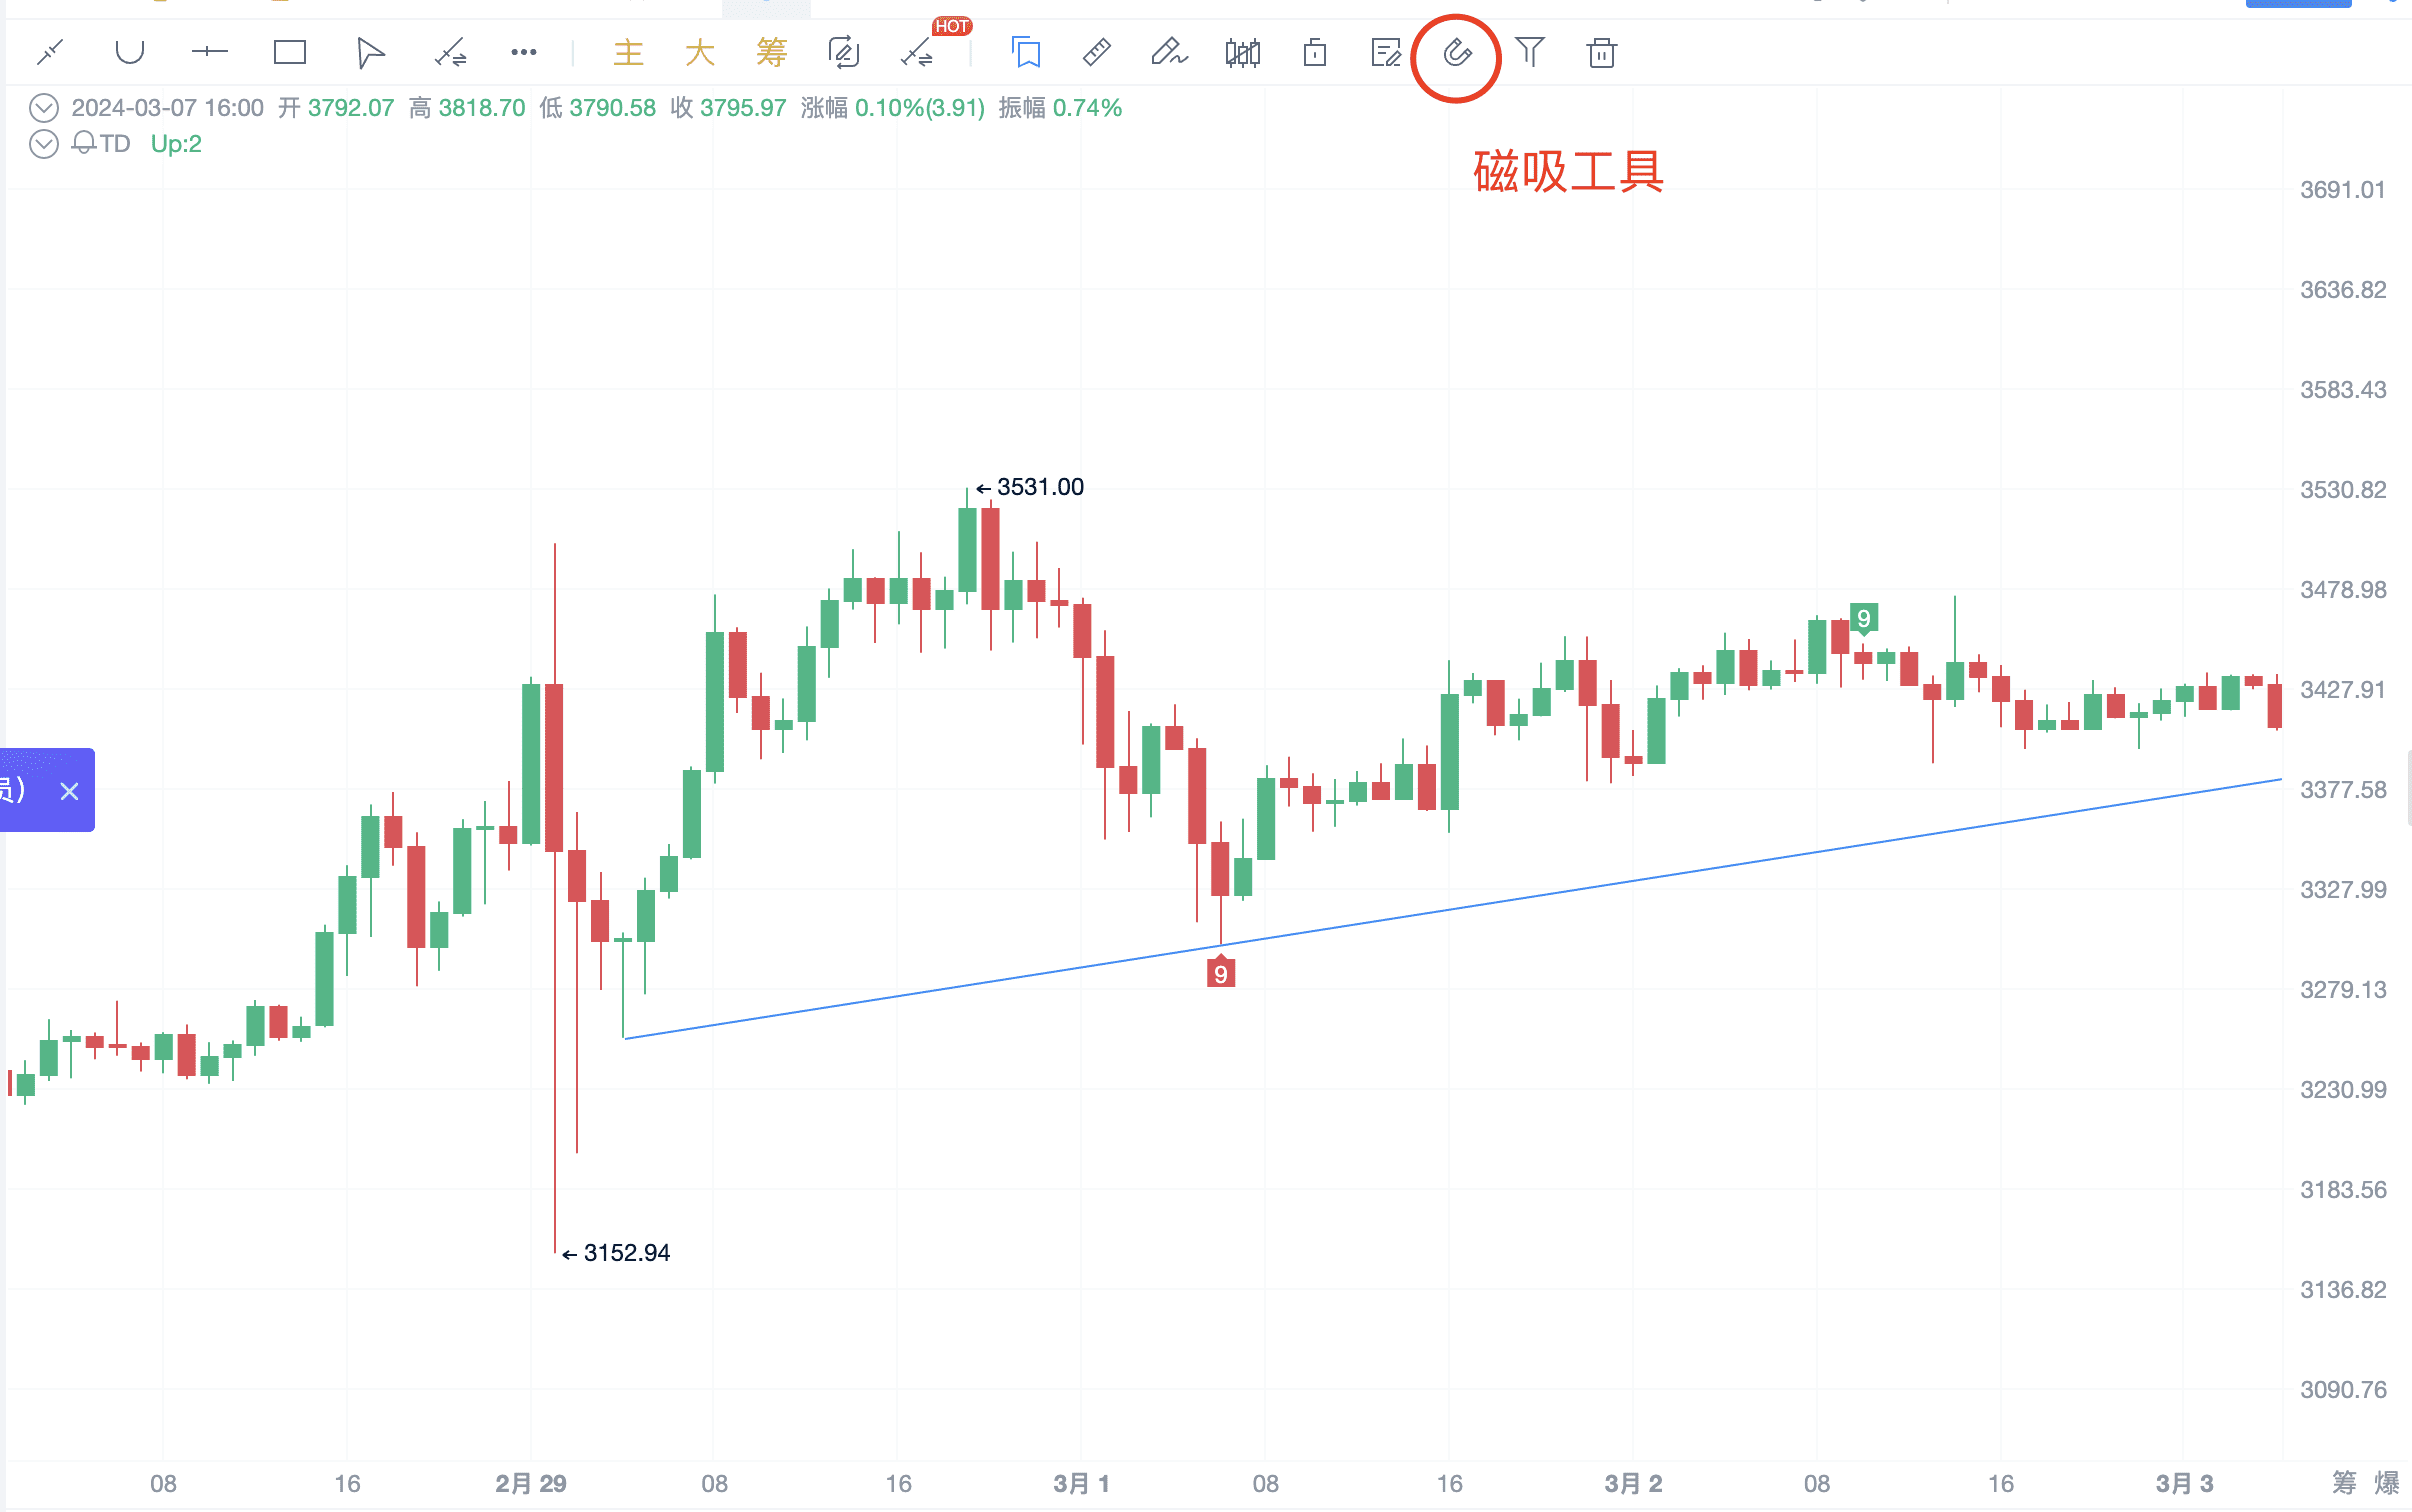
When drawing trend lines, it's best to start from the previous position of opening a position or find two relative lows from the previous position of opening a position. If not available or too close, and two relative lows or highs have not formed, then look for two relative lows directly ahead.
The lowest price position.
If the point cannot be located, the magnetic tool can be used.
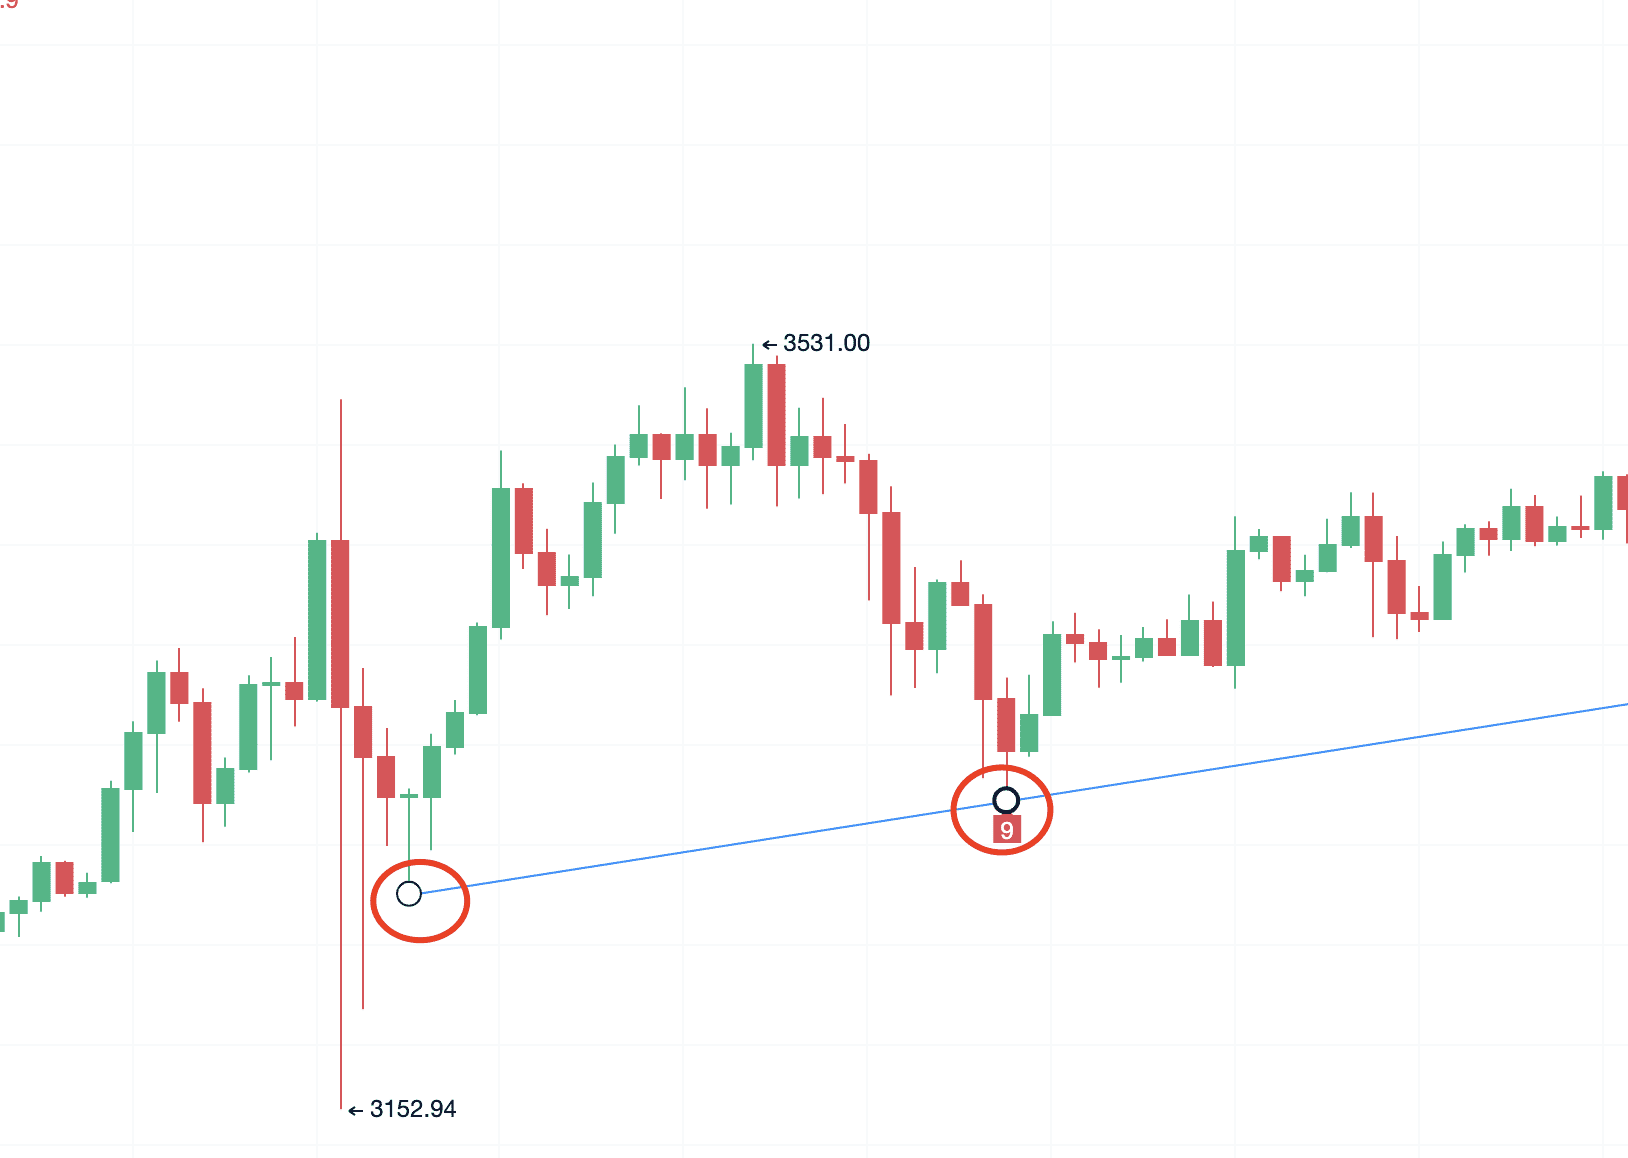
Two relative lows have been found, with touchpoints in between.
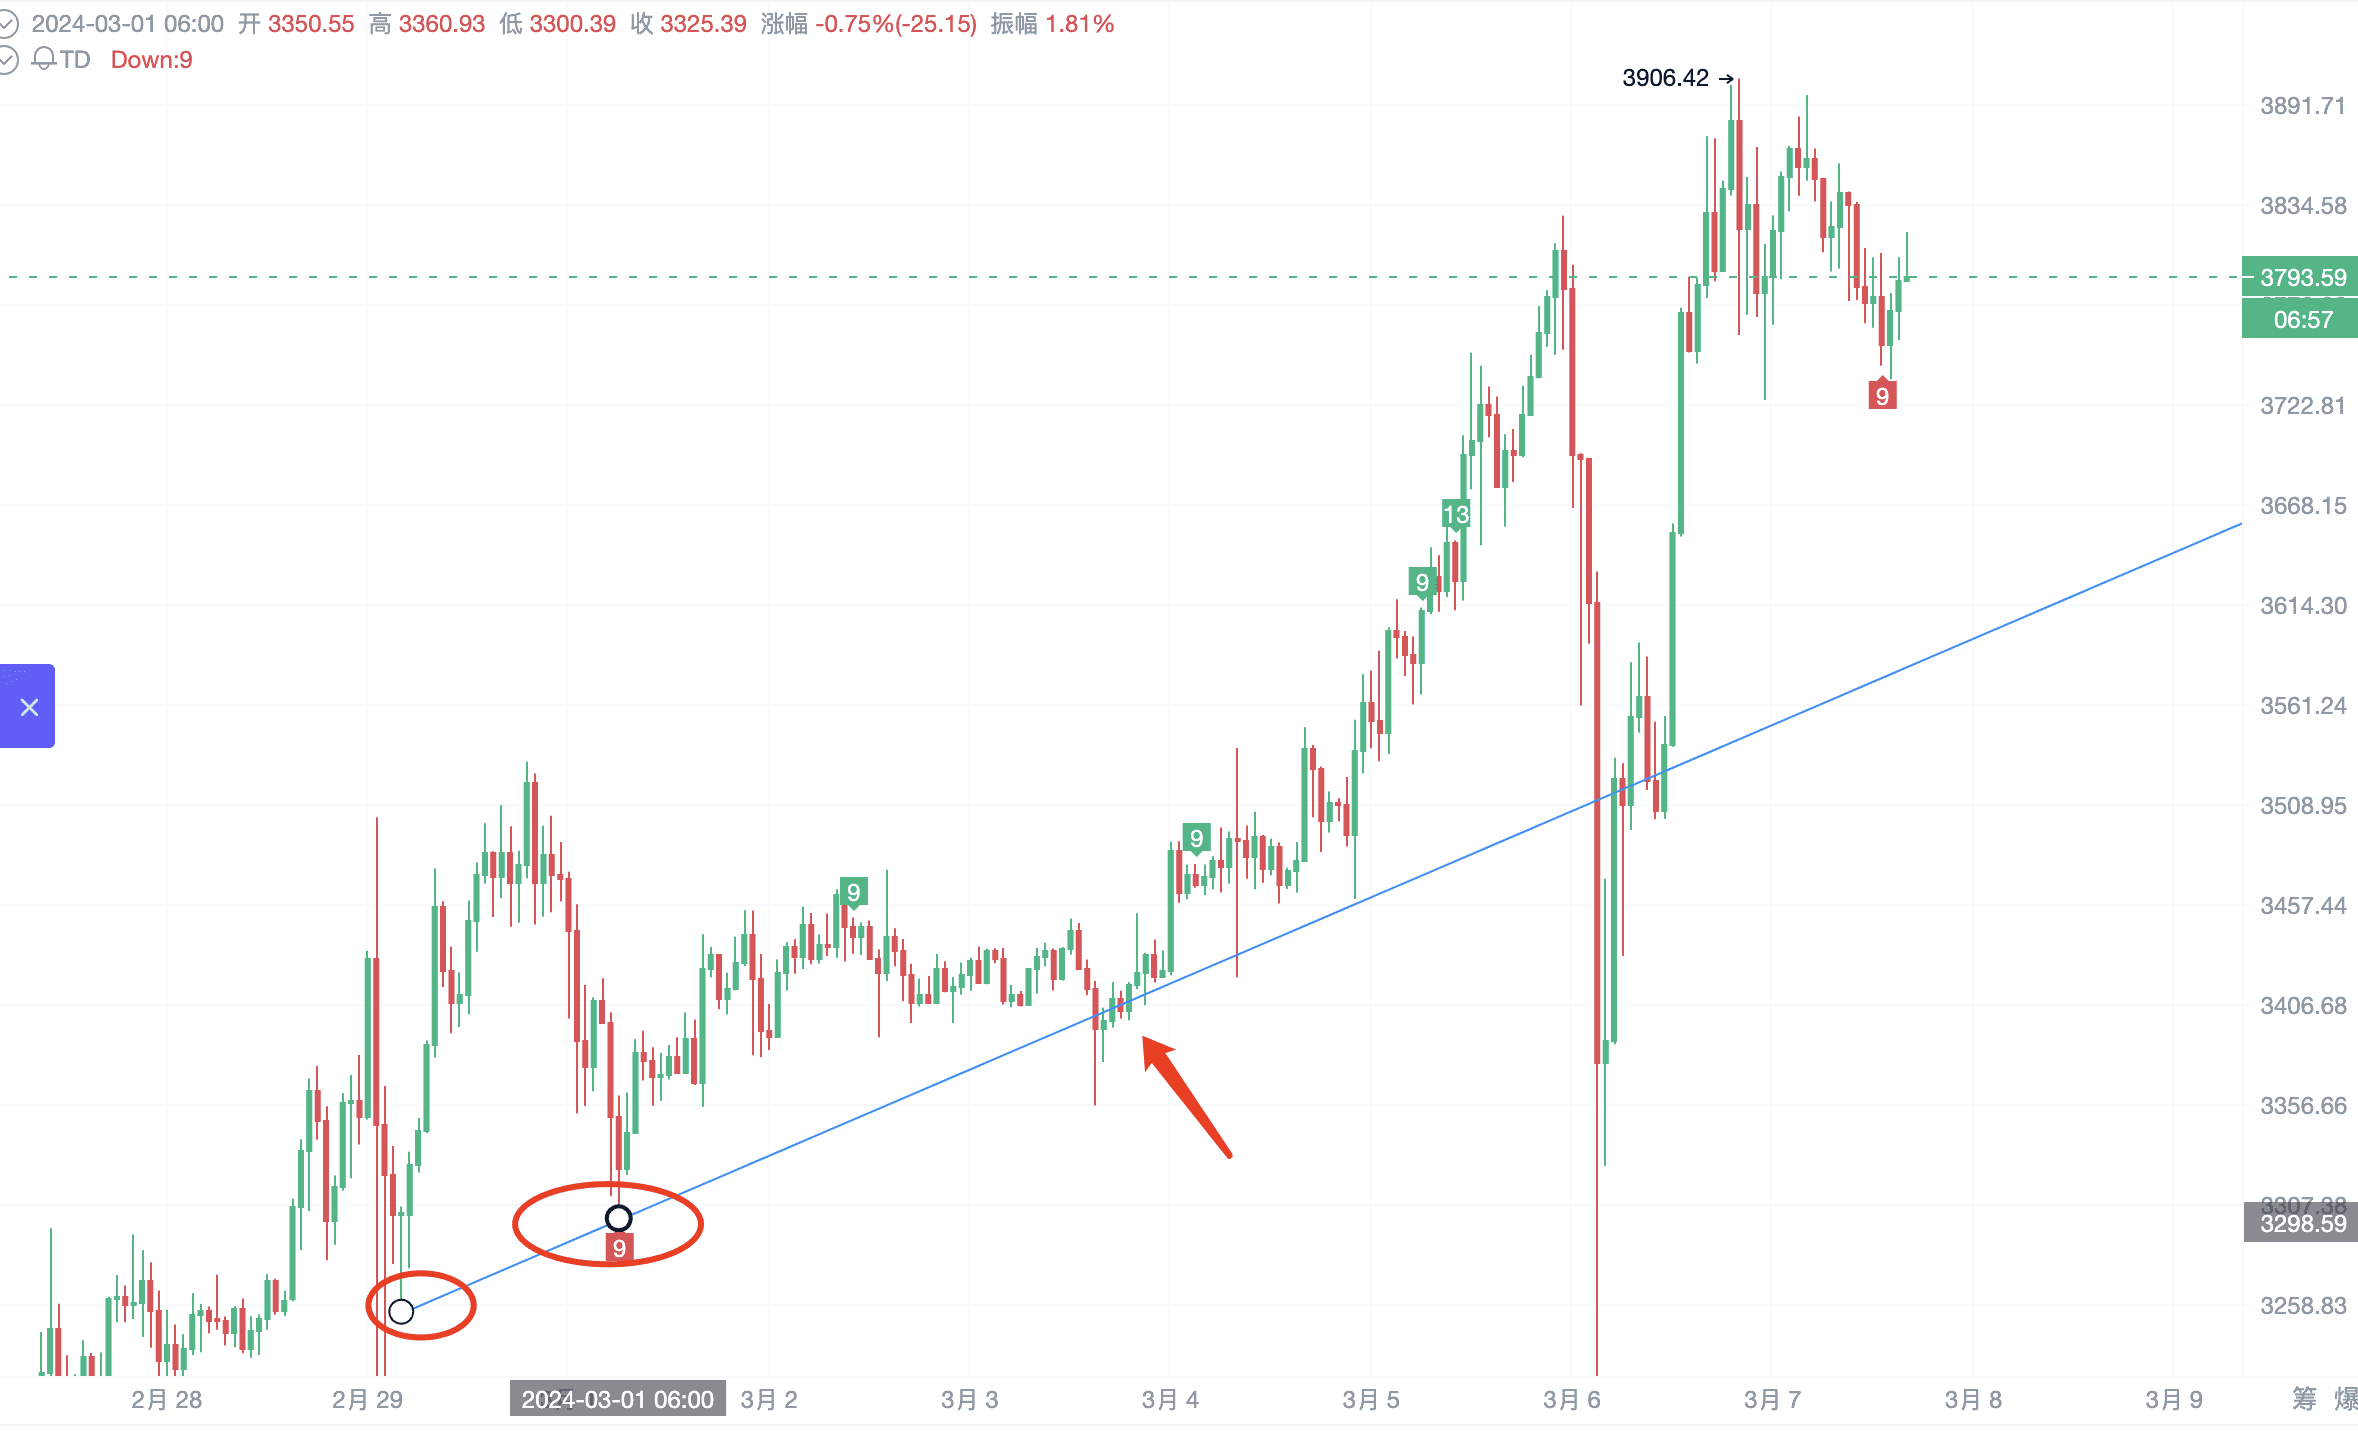
Drawing a trend line, using the one-hour chart, combining trend line touchpoints with signal alerts, particularly the black-red three soldiers reminder, has a significant effect!
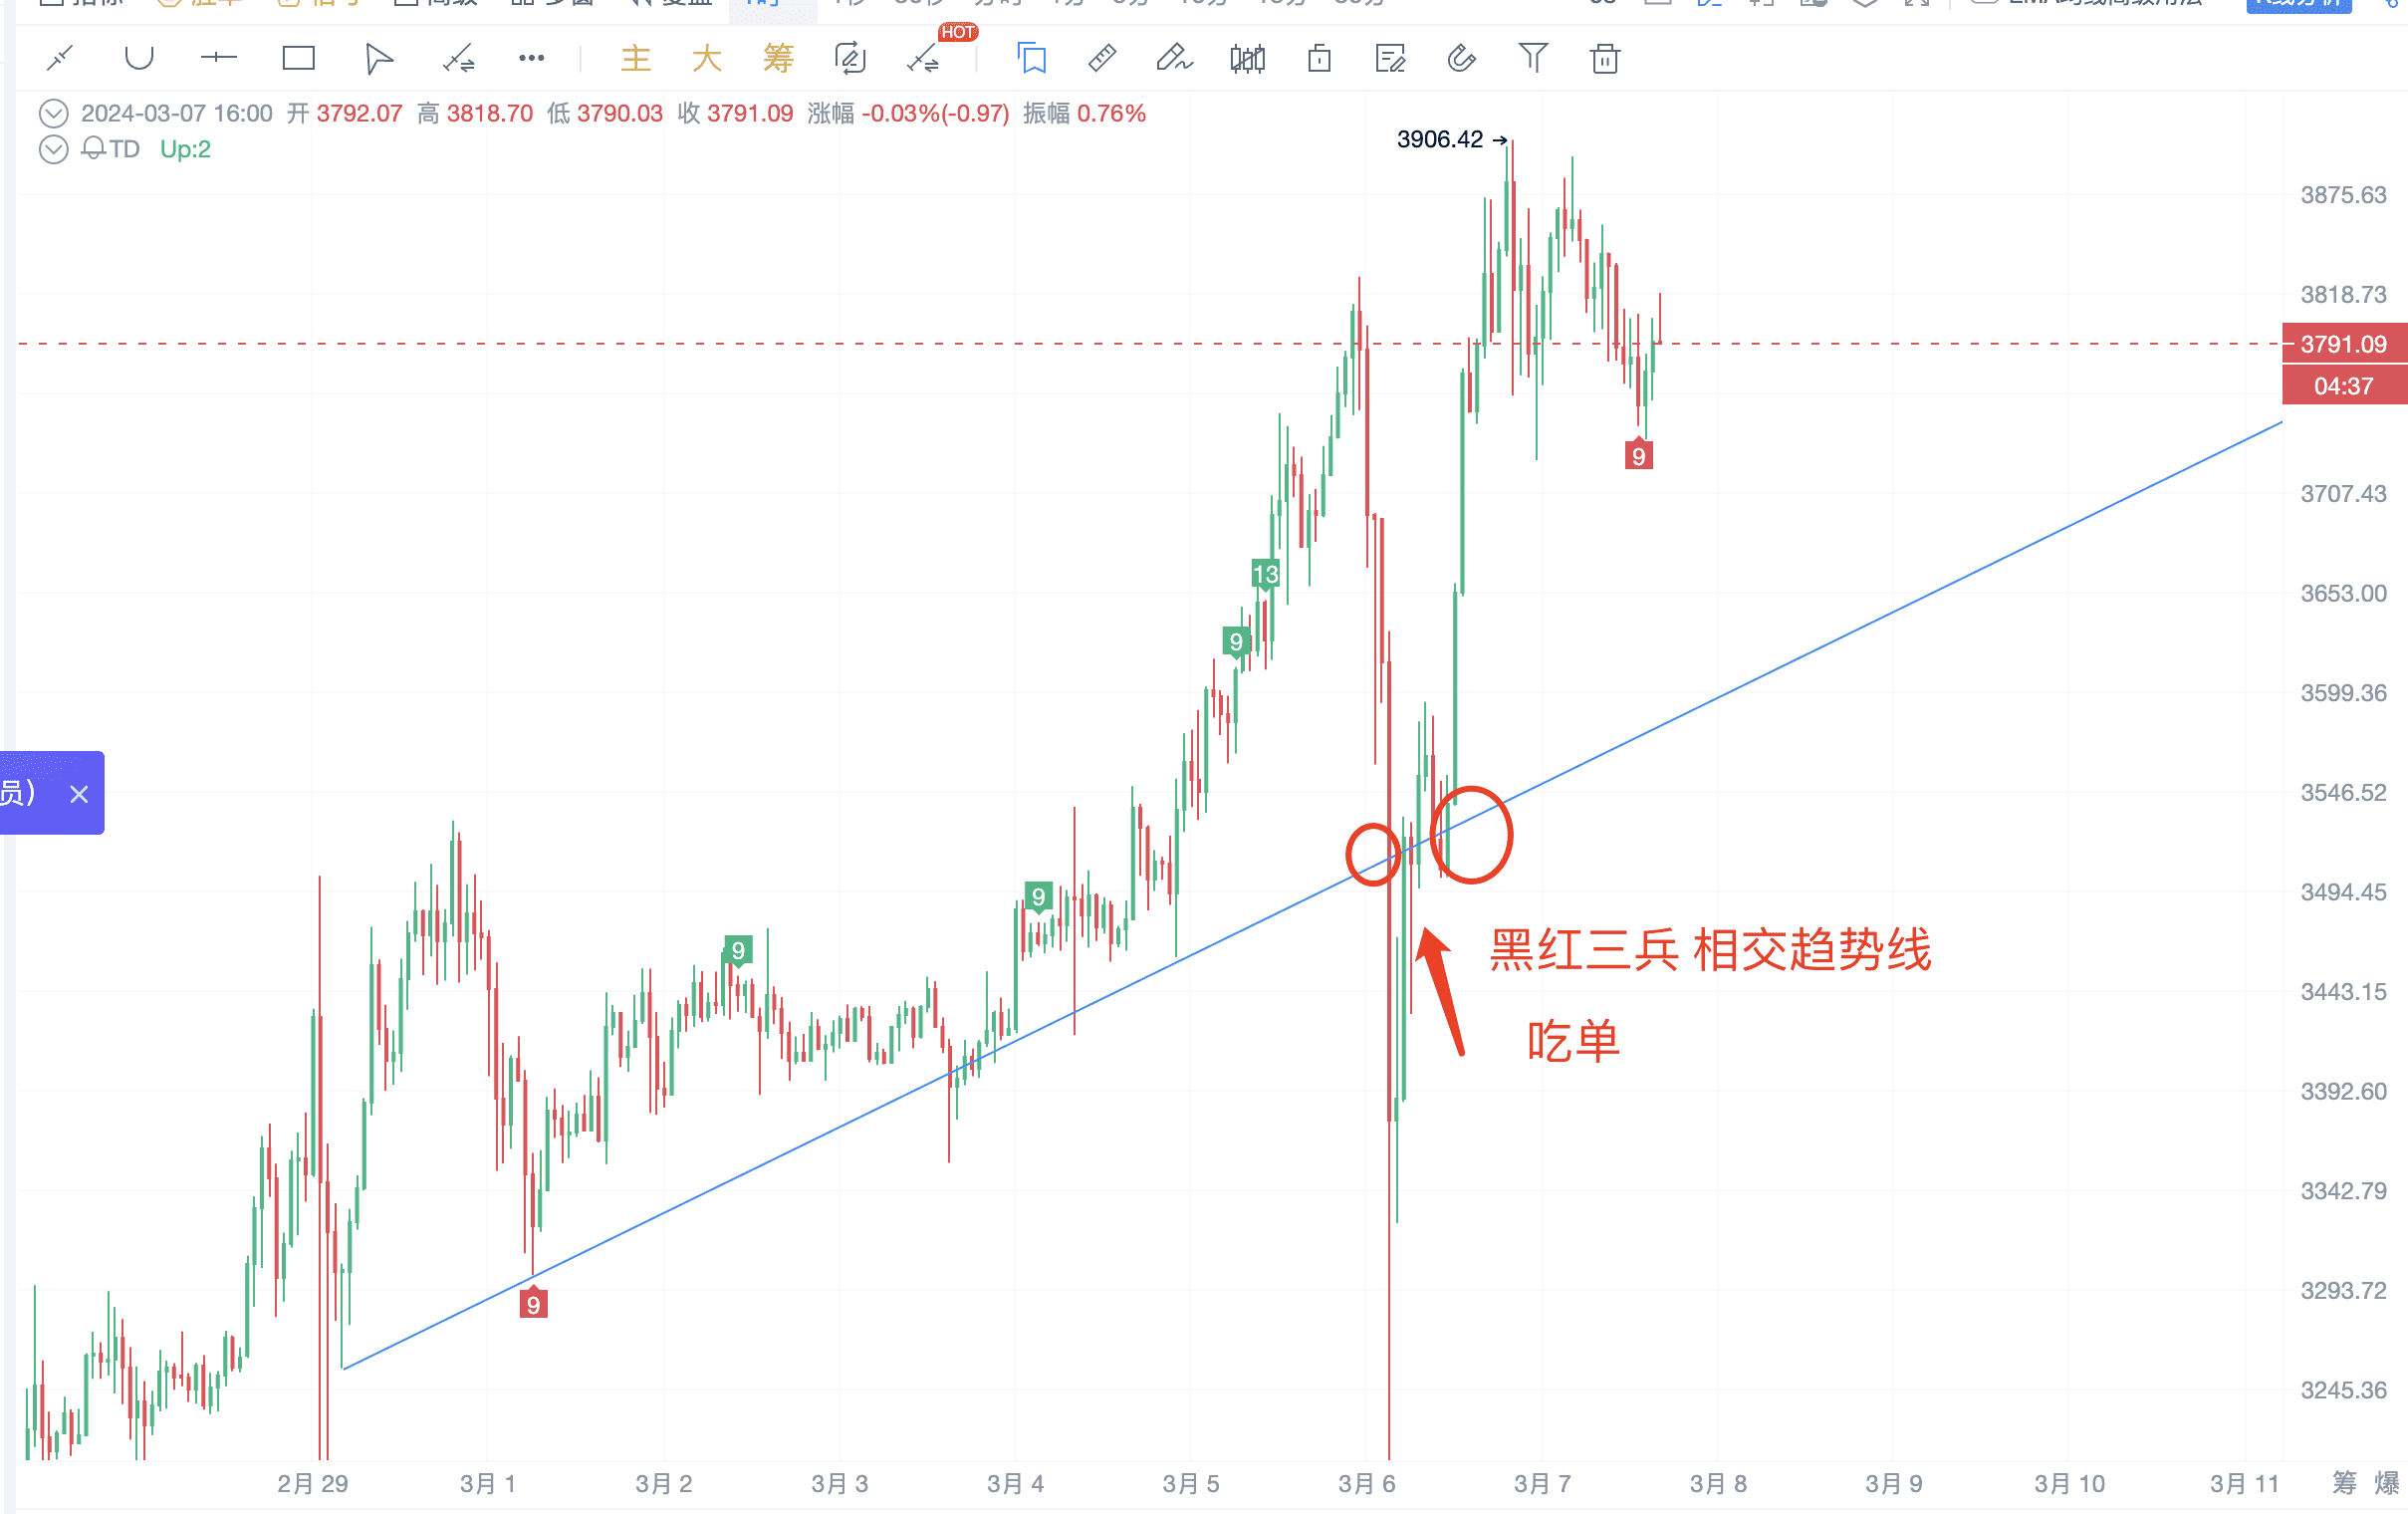
2. Activating Red-Black Three Soldiers Tracking
Activate the signal alert for tracking red-black three soldiers, and pay attention to whether related signals appear on the trend line. If the signals appear above the trend line, consider whether to open a position based on the presence of signals near the trend line.
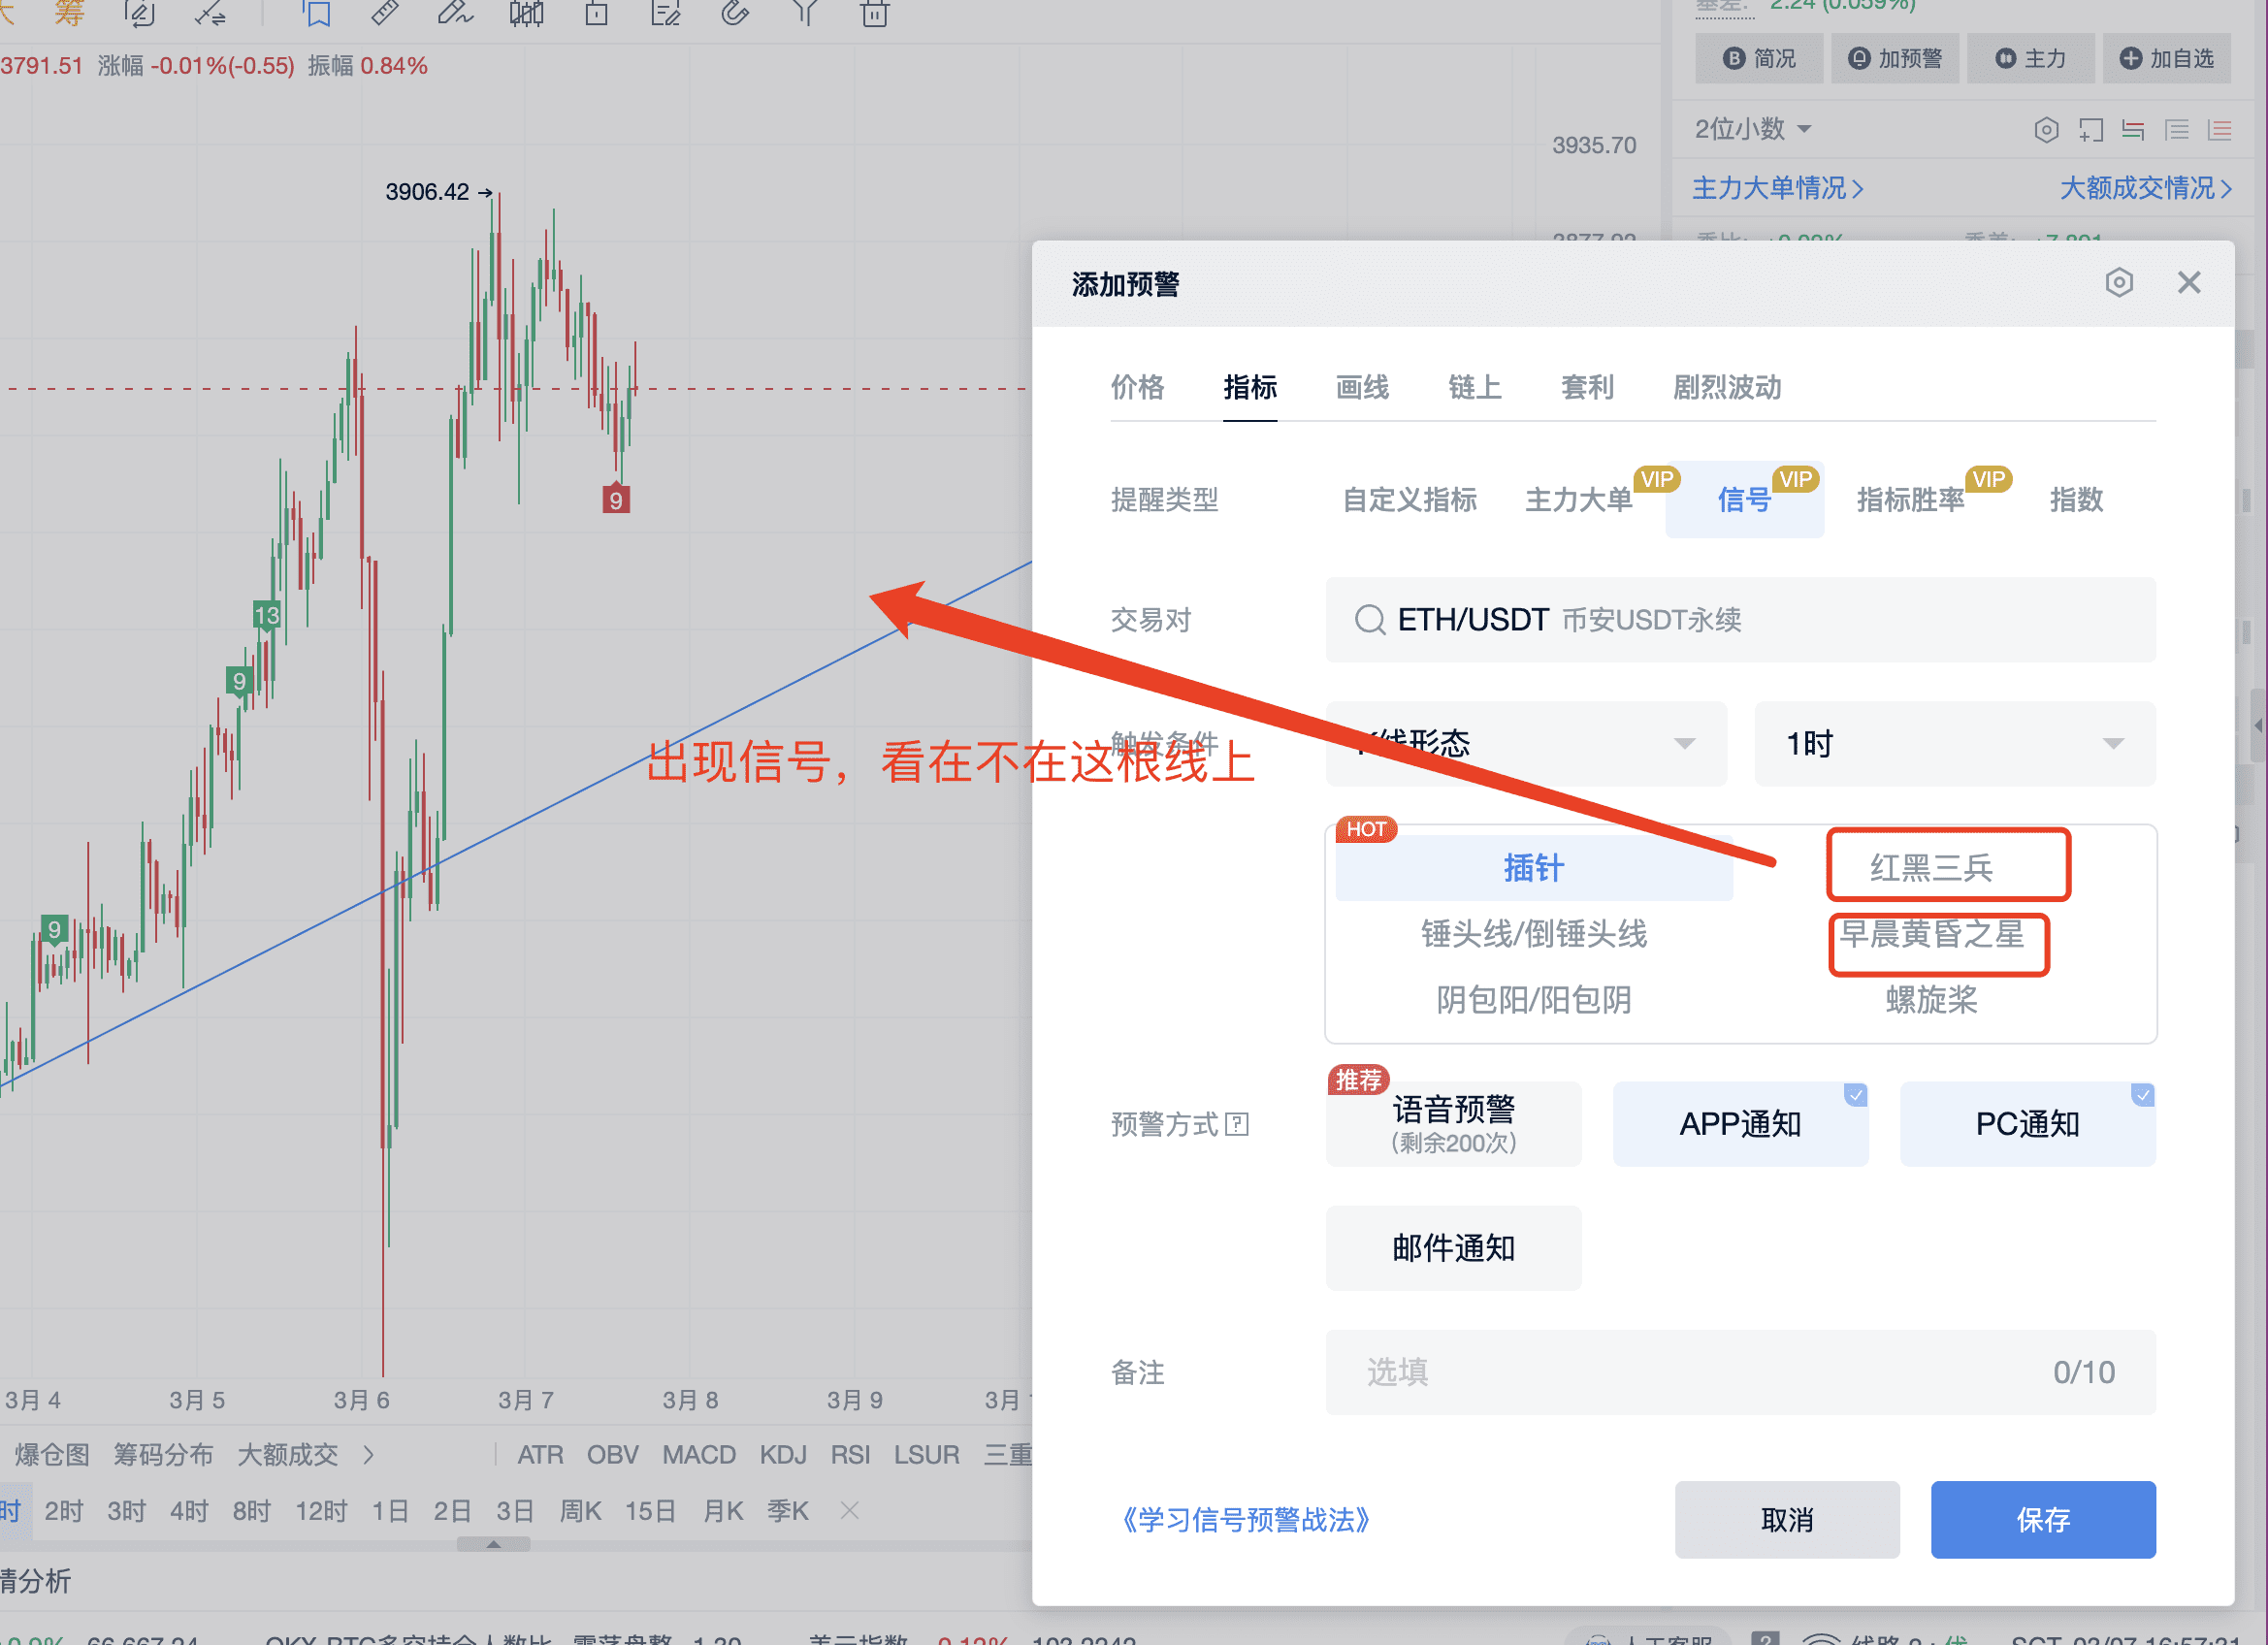
Signal alerts can display various K-line patterns on the candlestick chart and support alerts, making it easy for you to identify K-line patterns: https://aicoin.app/vip/signal
Recommended Reading
For more live content, please follow the AICoin "News/Information-Live Review" section, and feel free to download the AICoin PC End
免责声明:本文章仅代表作者个人观点,不代表本平台的立场和观点。本文章仅供信息分享,不构成对任何人的任何投资建议。用户与作者之间的任何争议,与本平台无关。如网页中刊载的文章或图片涉及侵权,请提供相关的权利证明和身份证明发送邮件到support@aicoin.com,本平台相关工作人员将会进行核查。