Background
Recently, the market value of BTC has reached a 2-year high, prompting us to analyze the exchange rate of altcoins other than BTC. First, let's observe the historical candlestick trends of some mainstream coins against BTC in TradingView.
Below are the historical exchange rates of some mainstream coins against BTC in TradingView:
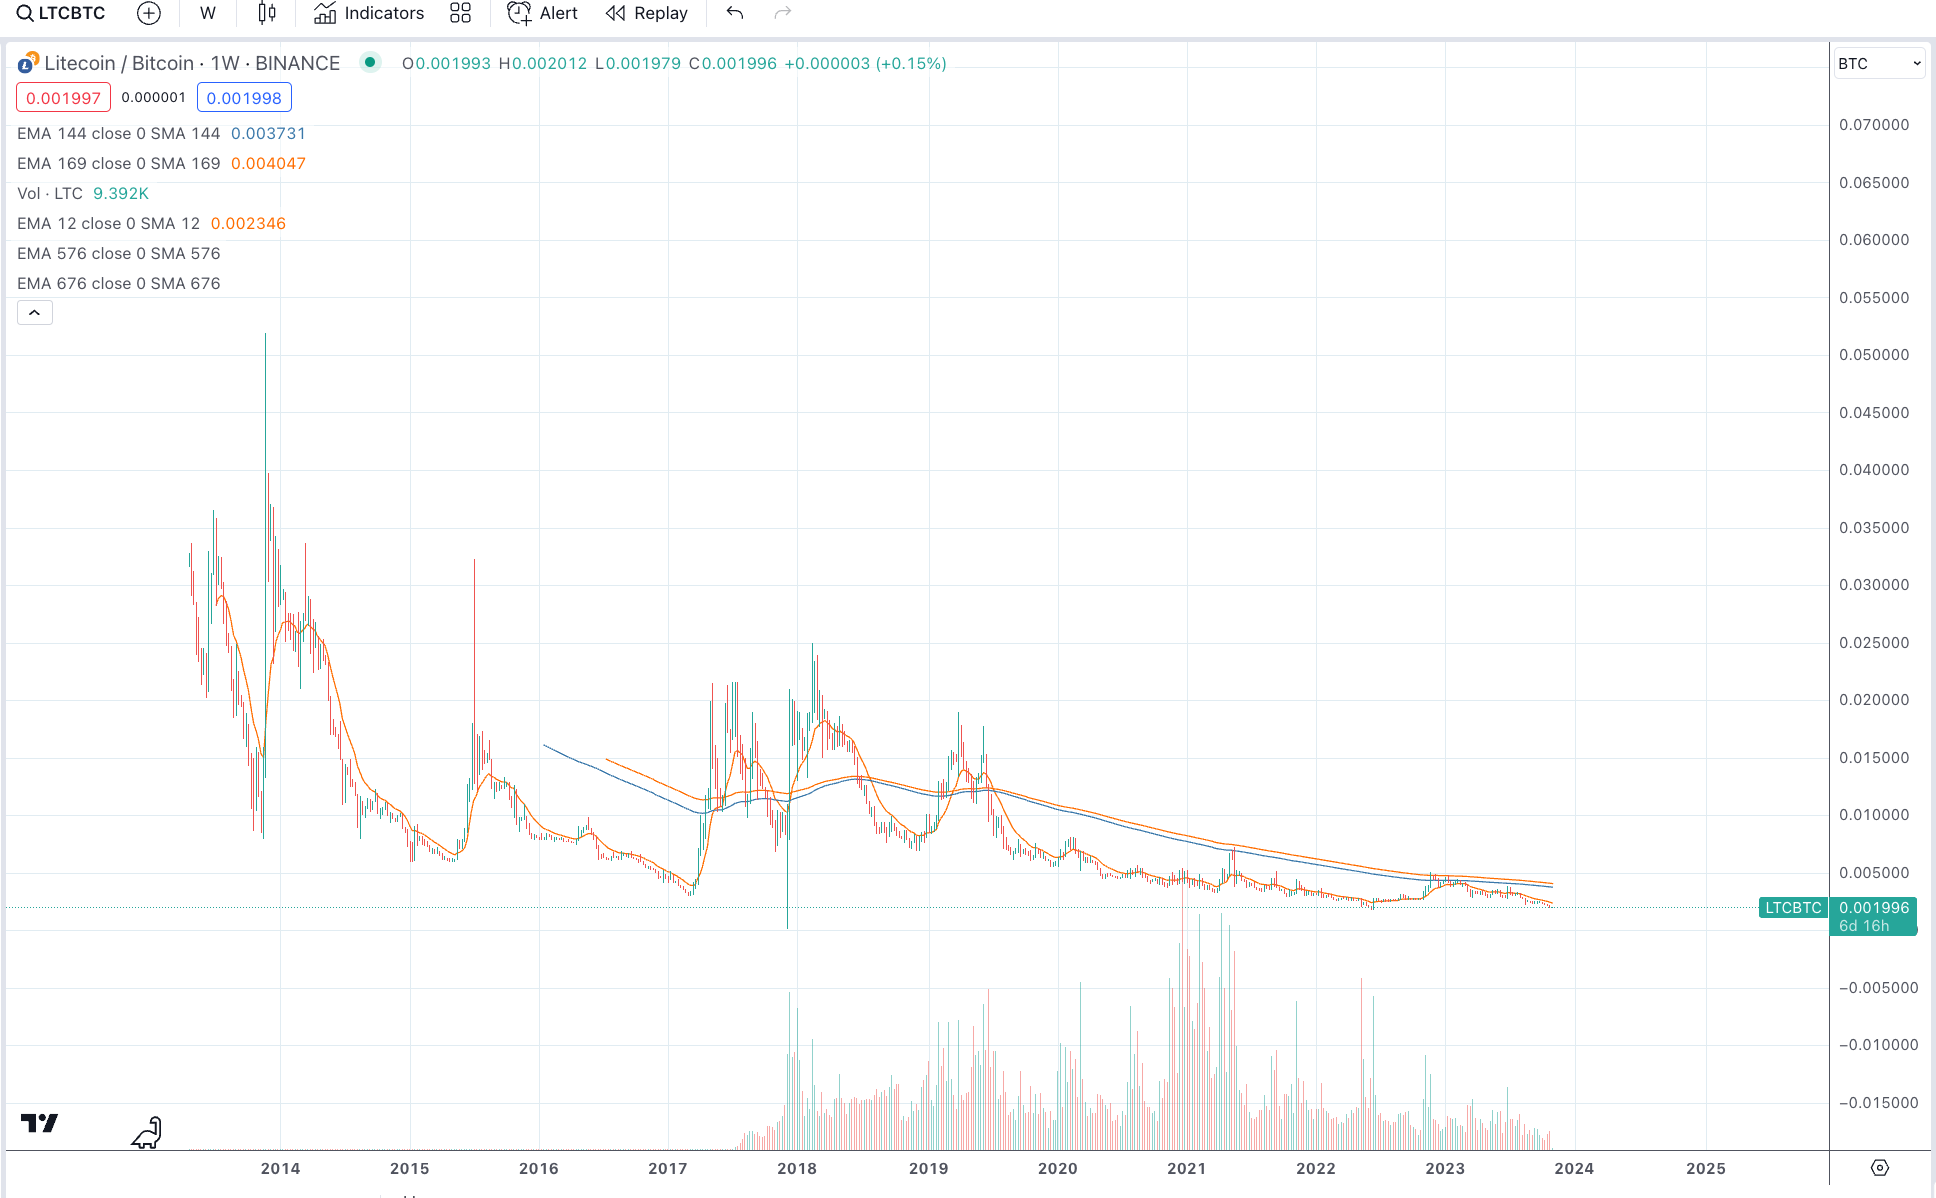
- LTC/BTC
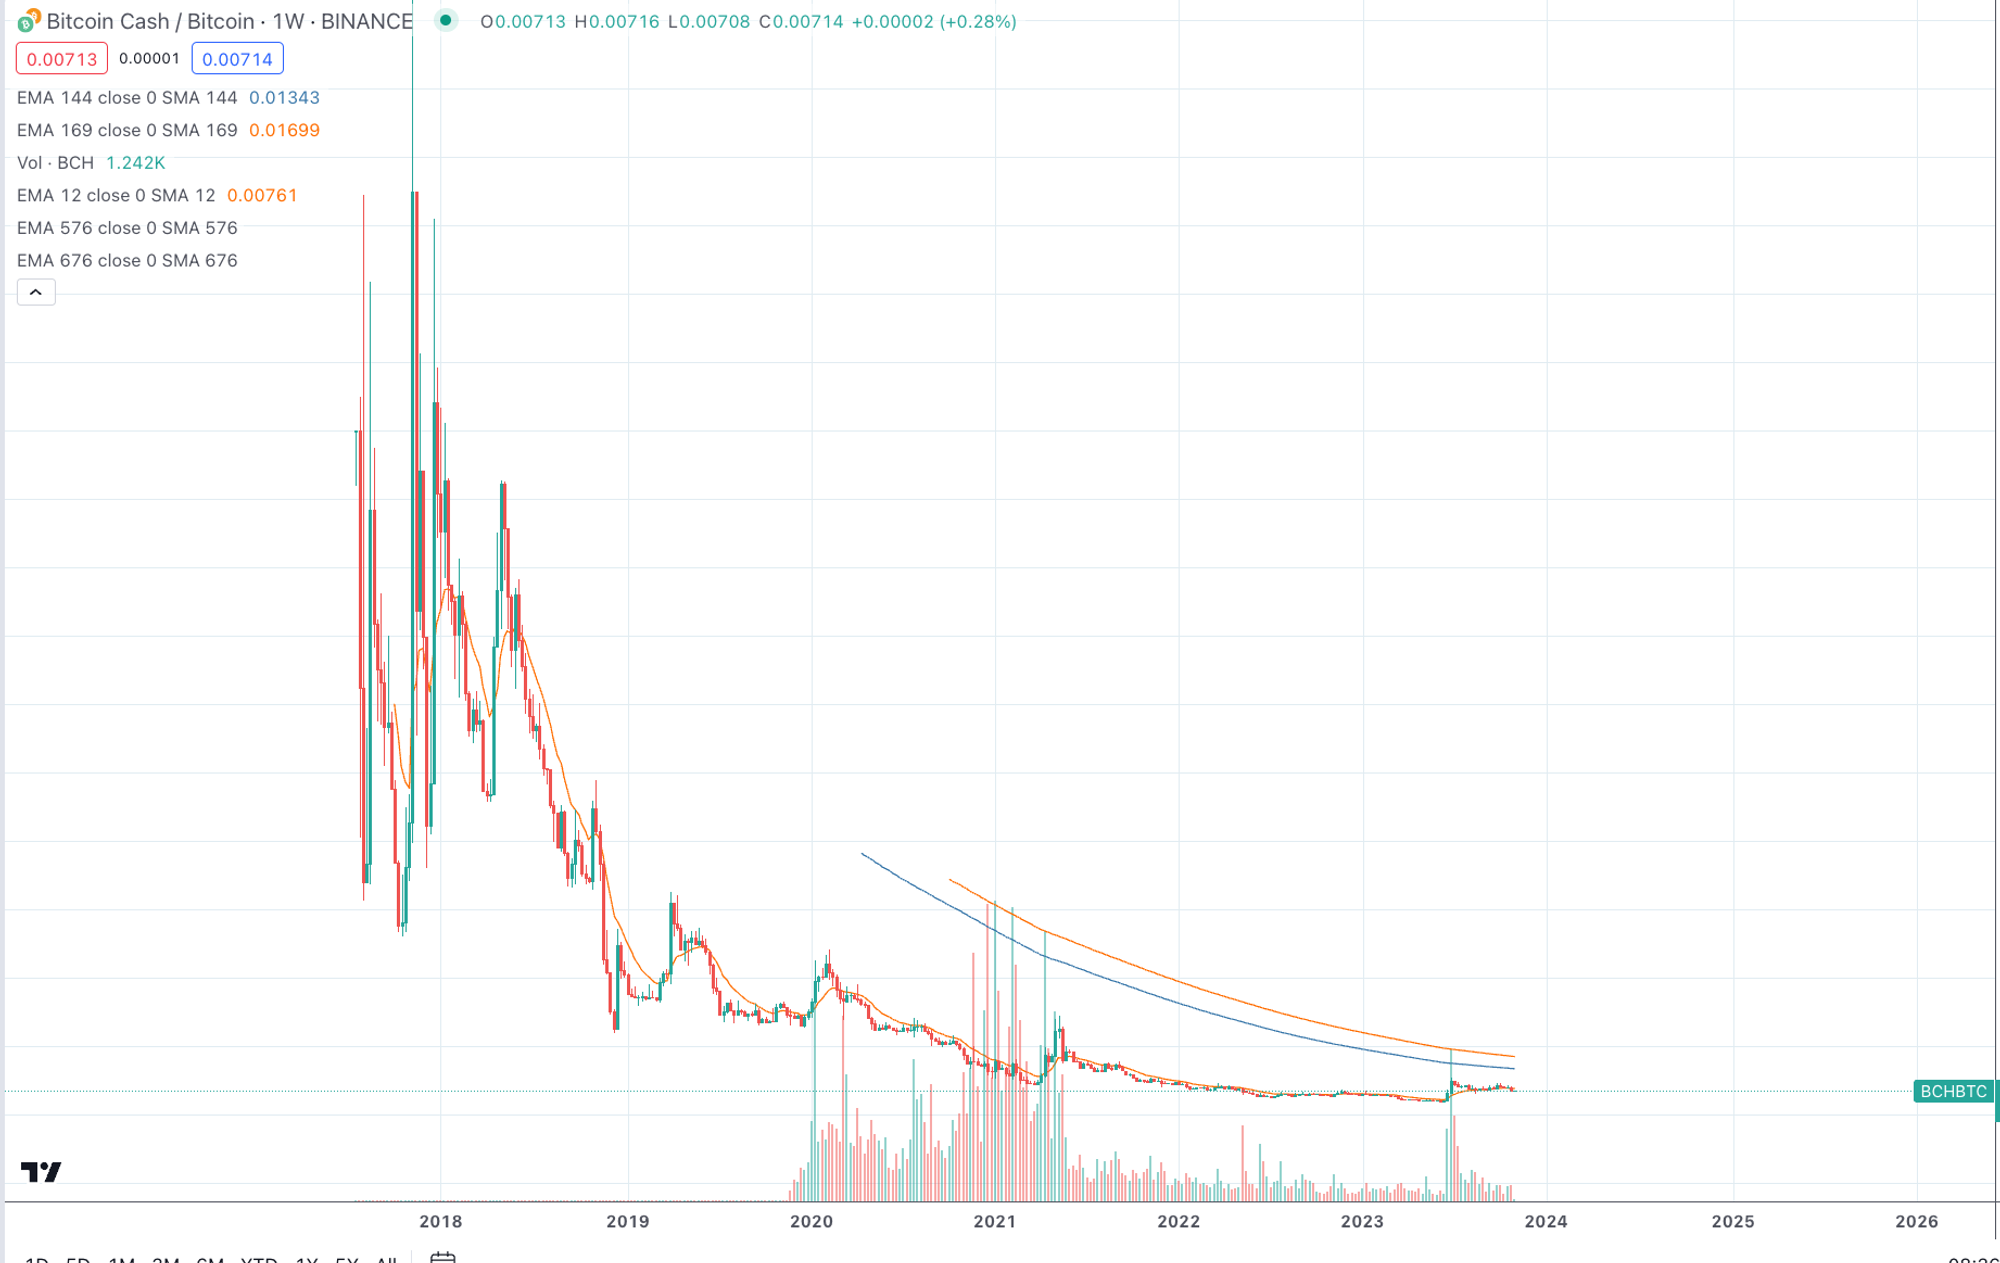
- BCH/BTC
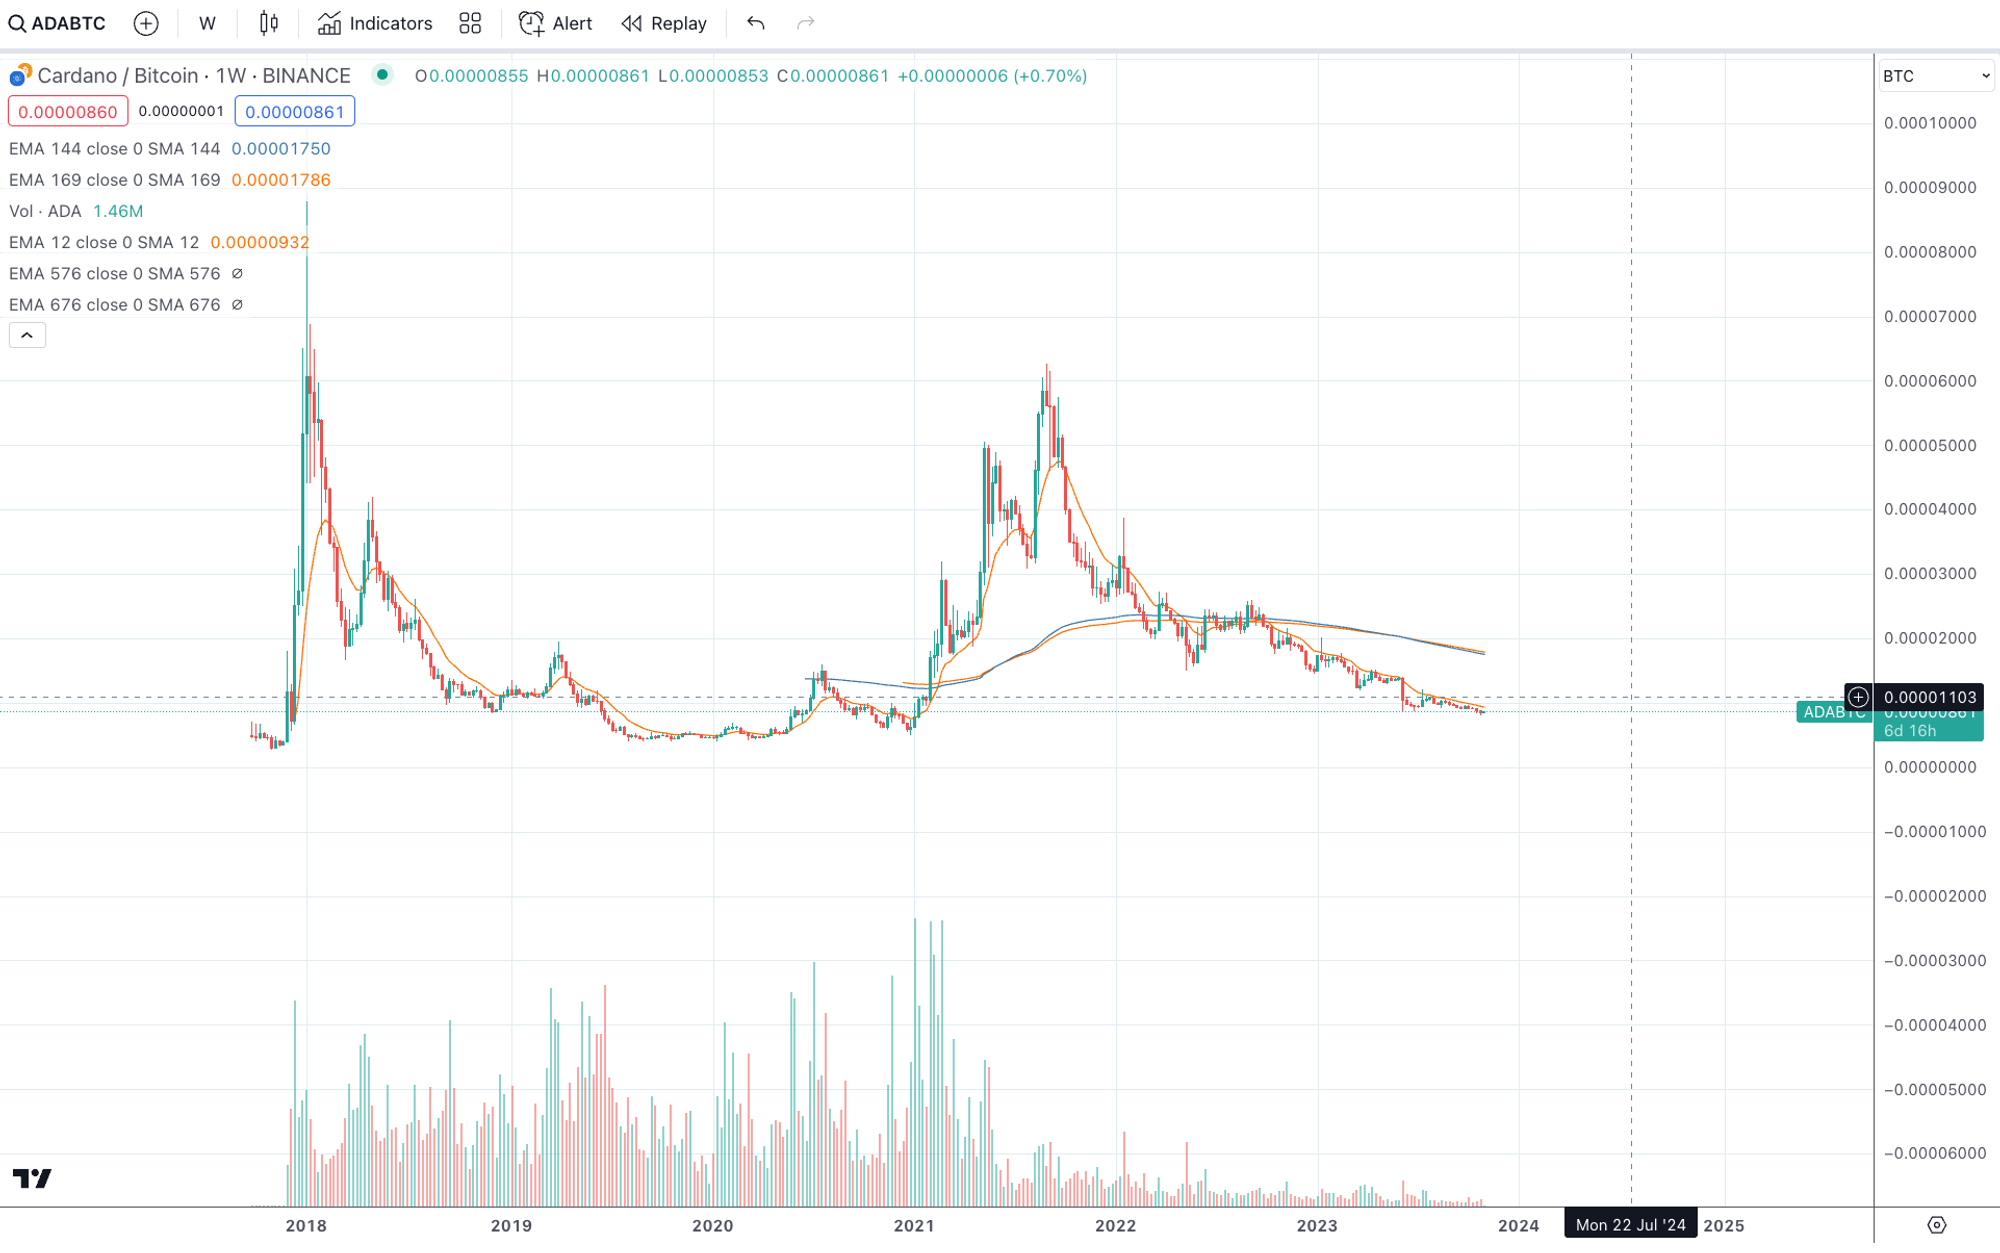
- ADA/BTC
- ETH/BTC
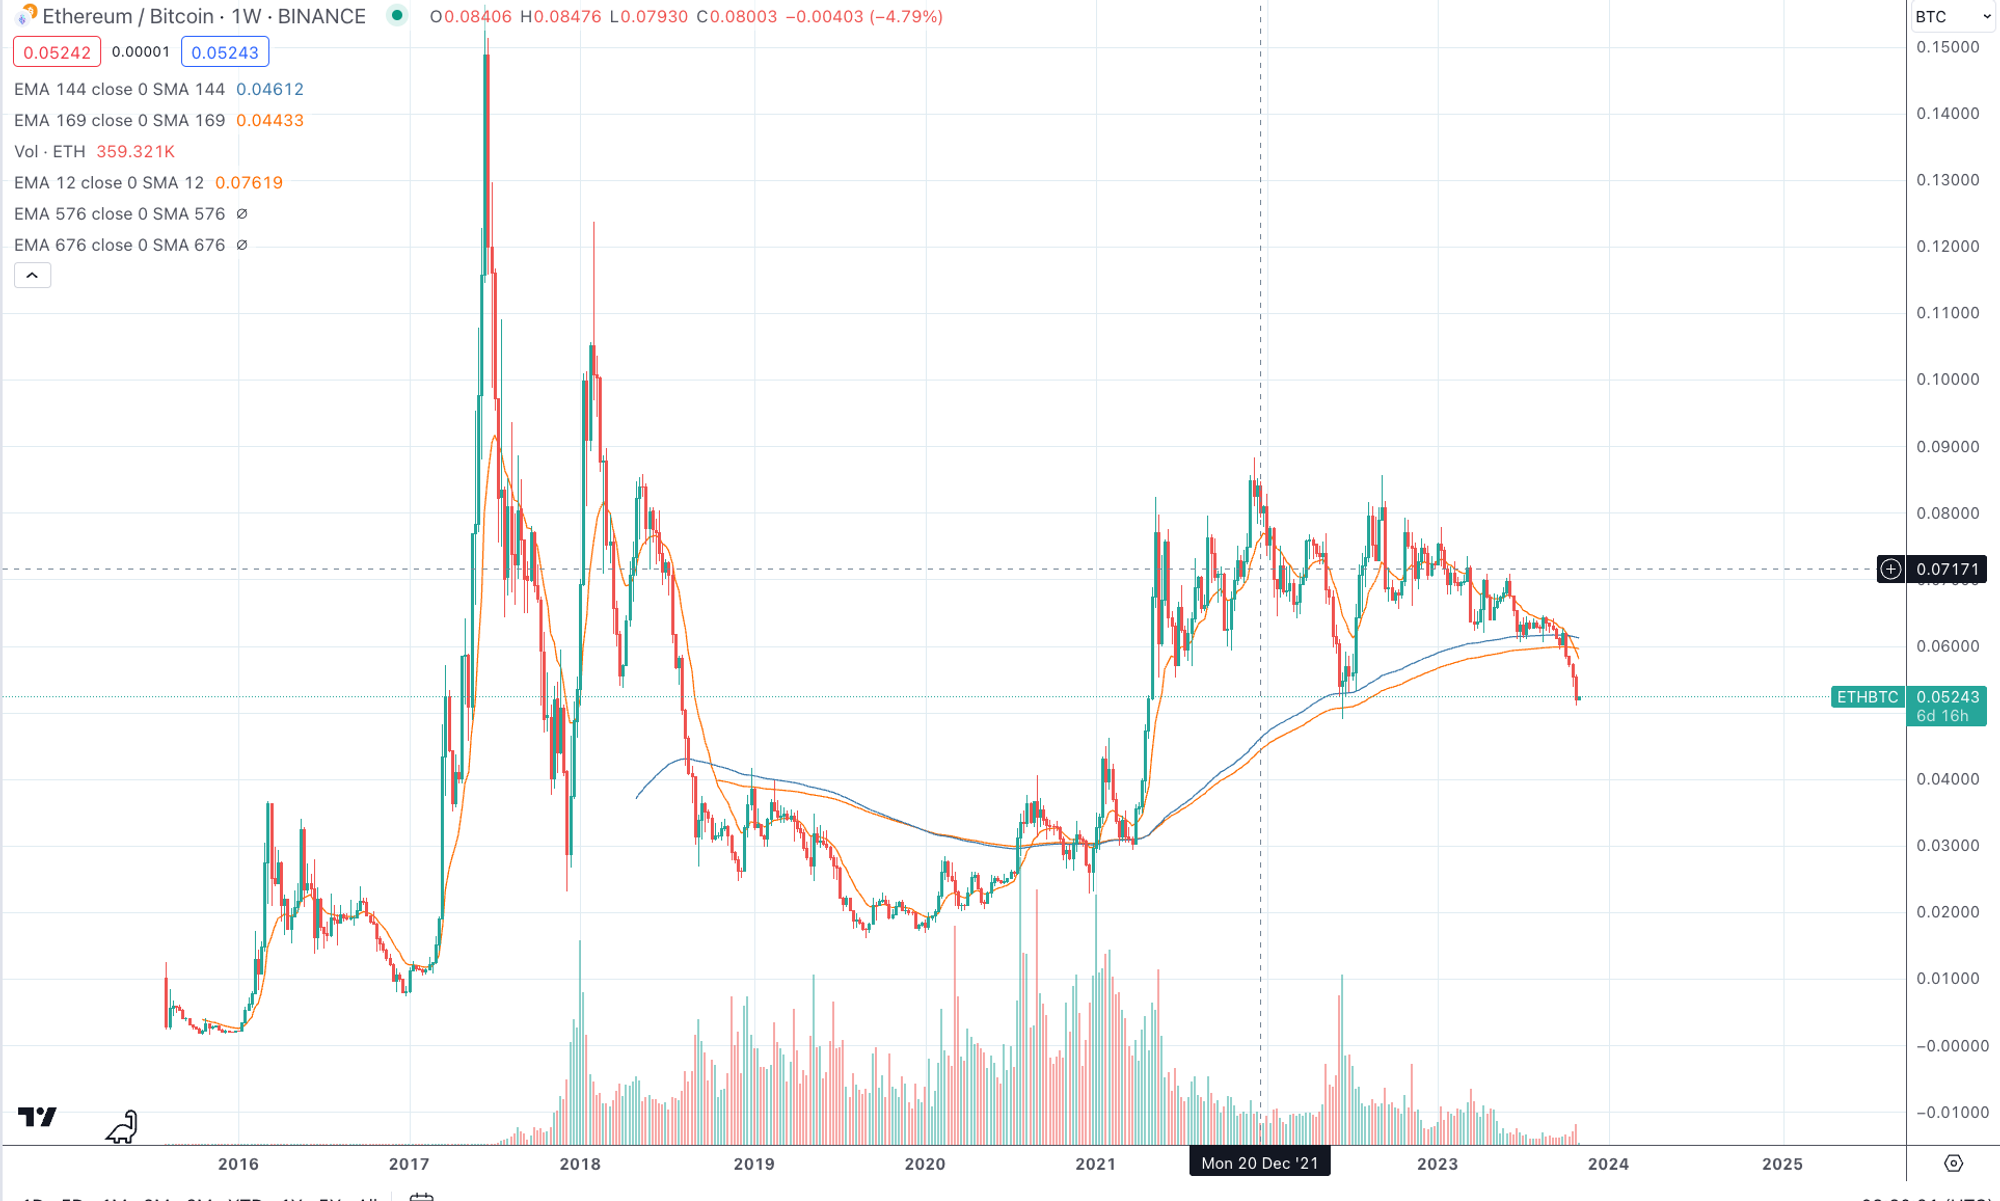
From the above charts, we found that even the best-performing tokens like ETH only reached their historical highest exchange rate against BTC in 2017, about 2 years after its launch. After that, the ETH/BTC exchange rate did not surpass the previous high.
Therefore, we decided to expand the scope of analysis: analyzing the historical exchange rate changes of all altcoins against BTC.
Method
- Select the top 500 coins by market value from CoinMarketCap
- Obtain the weekly price of these tokens from gate.io (gate has the longest historical prices for most tokens)
- Find the all-time highest exchange rate and date for all tokens relative to BTC
- Calculate the time from the start of trading to the date of the highest BTC exchange rate
- Calculate the time from the lowest BTC exchange rate to the current date
- Calculate today's exchange rate / all-time highest point
- This method has been open-sourced on GitHub (link at the end of the article)
- No complex statistics involved. In the future, we can use more statistical models for analysis.
Findings
Range of Tokens Finally Analyzed
Some of the top 500 tokens were not traded on Gate.io, and we excluded tokens with a trading time of 1 year. Finally, we analyzed about 350 tokens, covering most mainstream tokens.
Indicators
- Exclude tokens with a trading time of 1 year
- Use the high price of altcoin and Bitcoin weekly comparison to calculate the exchange rate
When do altcoins usually reach their historical highest price against BTC (All-Time-High, ATH)?
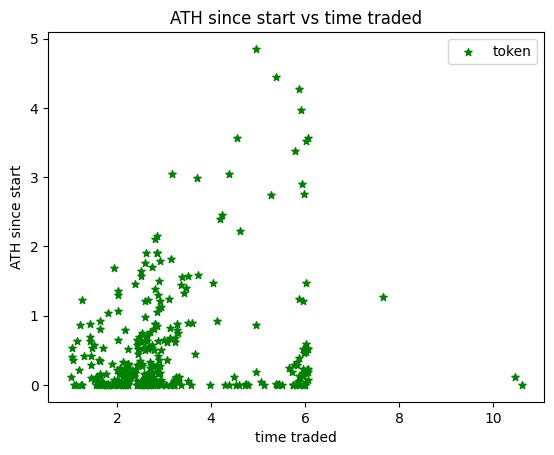
- The Y-axis represents the time span (in years) from the token's issuance to reaching the historical highest price (ATH).
- The X-axis represents the number of years the token has been traded.
From the chart, we can find the distribution of ATH time.
- Most tokens reach their ATH against BTC within the first year of trading
- Few tokens reach their ATH after 2 years
- Let's observe this through a pie chart for better visualization
Chart: Distribution of ATH since the start of trading
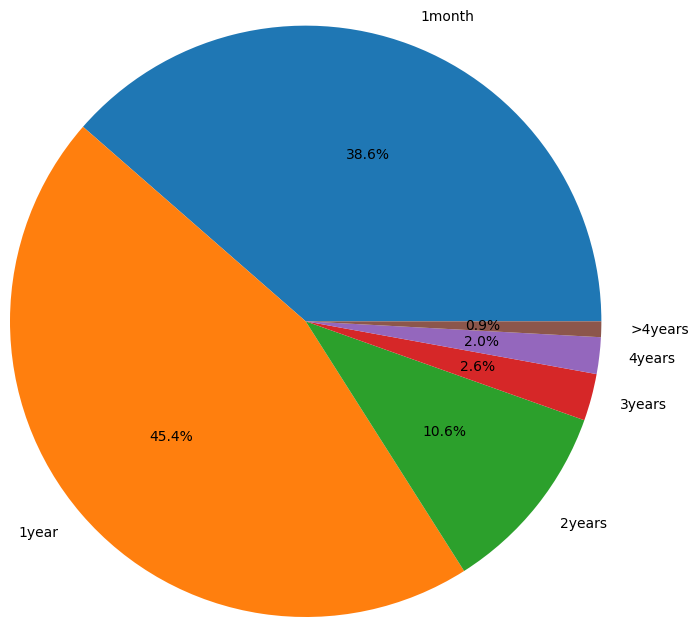
From the above chart, we can observe that:
- Only 5.5% of tokens reached their ATH against BTC 2 years after issuance, with the remaining tokens reaching ATH within 2 years of trading
- To better observe the results, we need to filter out tokens with a trading time of 2 years
- Once we remove tokens with a trading time of 2 years, we are left with approximately 289 tokens.
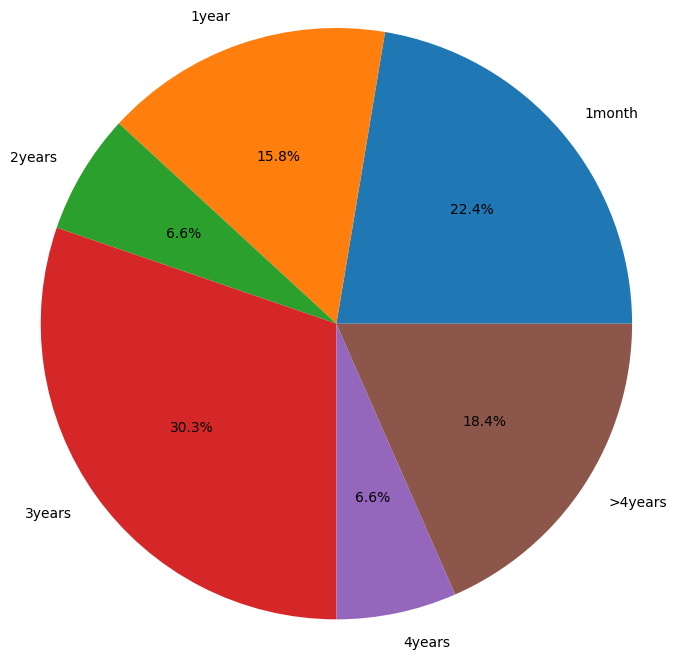
Chart: Distribution of ATH since the start date, excluding tokens traded for over 2 years
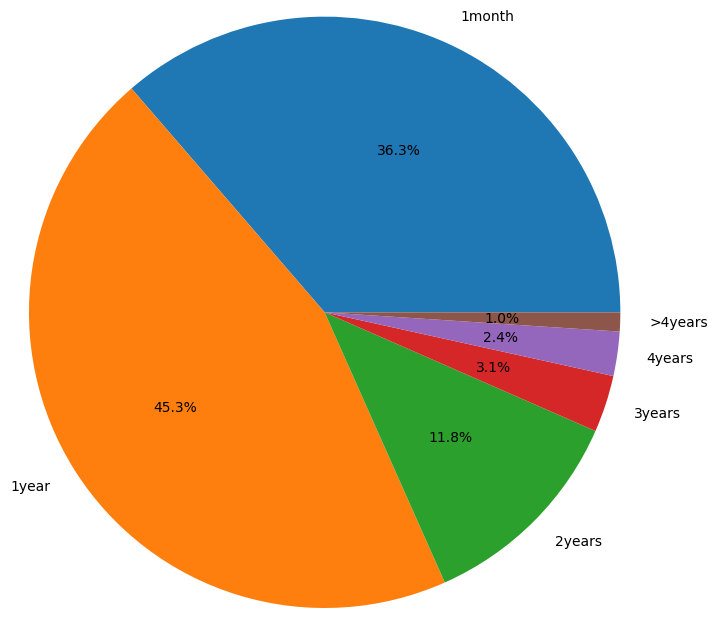
The results did not change much, with only 6.6% of tokens reaching their ATH against BTC after two years.
Let's delve into these tokens: ['BNB','DOGE','ETC','FIL','FRAX','FTM','GT','LEO','LINK','MANA','MATIC','OKB','ONE','TFUEL','THETA','TON','TUSD','VET','WAVES']
Among the 19 tokens, some may have been mistakenly included due to Gate's listing delay. The average trading length is 4.82 years, around January 9, 2019, when the BTC trading price was about $3500, marking the bottom of the previous bear market.
When do altcoins usually reach their historical lowest point (All-Time-Low, ATL)?
In the previous section, we analyzed when altcoins reached their highest exchange rate. Now, let's explore when altcoins reached their historical lowest exchange rate.
Indicators
- Exclude tokens with a trading time of 1 year
- Use the low value of altcoin and Bitcoin weekly comparison to calculate the exchange rate
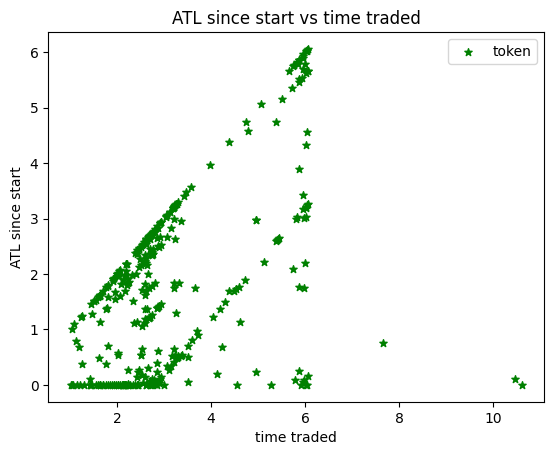
This chart is more interesting, showing that the altcoin/BTC exchange rate ATL is almost linearly related to the trading time, indicating that the longer the trading time, the higher the probability of the exchange rate being at ATL against BTC. Let's find out more information through a pie chart!
Since ATL is more meaningful for tokens with a trading time of over 4 years, we only include tokens with a trading time of over 4 years.
Chart: Distribution of ATL from the current date for tokens traded for over 4 years
Therefore, only 18.4% of tokens with a trading time of over 4 years did not reach their lowest point against BTC in the last cycle. Let's delve into these tokens:
They are ['ADA','DASH','DOGE','ETH','GT','KNC','LINK','LTC','MANA','MKR','SNT','THETA','TRX','VET']. These tokens mean that they did not perform worse against BTC in the last cycle. If we remove the two special old tokens ETH and LTC, the average trading length of the remaining tokens is 5.77 years, around 2018-01-25, which marks the end of the previous bear market, and the time difference between the issuance date and ATL is approximately 0.35, placing their ATL around 2018-06-05.
Conclusion
- Among the 350 tokens we analyzed, only 19 tokens set a new historical highest price against BTC in the last cycle
- They are:
['BNB','DOGE','ETC','FIL','FRAX','FTM','GT','LEO','LINK','MANA','MATIC','OKB','ONE','TFUEL','THETA','TON','TUSD','VET','WAVES'] - They were listed around March 2019, the bottom of the previous bear market
- They are:
- In the last cycle, only 14 tokens out of 350 did not create a new ATL against BTC:
- They are:
['ADA','DASH','DOGE','ETH','GT','KNC','LINK','LTC','MANA','MKR','SNT','THETA','TRX','VET'] - They were listed at the end of the previous bull market and reached their historical lowest price about 4 months later, at the start of the previous bear market
- The only overlap is
['DOGE', 'GT', 'LINK', 'MANA', 'THETA', 'VET'] - Therefore, bottom fishing is highly risky and is unlikely to bring the highest returns
- They are:
- Try to avoid purchasing tokens listed on the secondary market during the previous bull market!
- Most of them will continue to set new historical lowest prices
- Some tokens will see their historical lowest BTC exchange rate within a few months and then rebound in the next cycle. However, this rebound is not significant
- Only tokens launched during a major bear market can set a new ATH against BTC, not even ETH
- Try to sell tokens within 2 years of listing and gradually convert them to BTC during the bear market, as only 6% of tokens can set a new ATH against BTC in the next cycle, indicating a stronger performance than the previous cycle!
Ref
https://github.com/Astrapolis-peasant/ath_btc_exchange_rates/blob/main/price_analysis_gate.ipynb
免责声明:本文章仅代表作者个人观点,不代表本平台的立场和观点。本文章仅供信息分享,不构成对任何人的任何投资建议。用户与作者之间的任何争议,与本平台无关。如网页中刊载的文章或图片涉及侵权,请提供相关的权利证明和身份证明发送邮件到support@aicoin.com,本平台相关工作人员将会进行核查。


