Author: duoduo, LD Capital
Recently, Bitcoin has shown relatively strong upward momentum, attempting to break through the resistance range of 28000–28500 several times; while ETH has been relatively weak, testing the resistance level of 1750 only once. This article briefly analyzes the recent price performance of ETH and possible influencing factors.
I. Price Performance
ETH/BTC: in a downtrend since the MERGE in 2022
Over the past year, ETH has been in a weak position relative to BTC. Looking at the ETH/BTC index from the beginning of 2022 to the present, from the beginning of 2022 to June, it was in a downtrend, dropping from 0.081 to around 0.050. Then, due to the positive impact of the merge, there was a rebound, reaching around 0.8 in September 2022. After the merge was implemented, this index has been in an overall downtrend and is currently at 0.058, close to the weekly EMA200.
However, from a long-term perspective, ETH/BTC is in a growth phase. Looking at a longer time frame, during the bear market in 2018, the lowest point for ETH/BTC was 0.01, while in the current bear market from 2022 to the present, the lowest point for ETH/BTC was 0.05. This is mainly due to the development and growth of the ETH ecosystem, accumulating a large amount of on-chain value compared to the previous bear market.
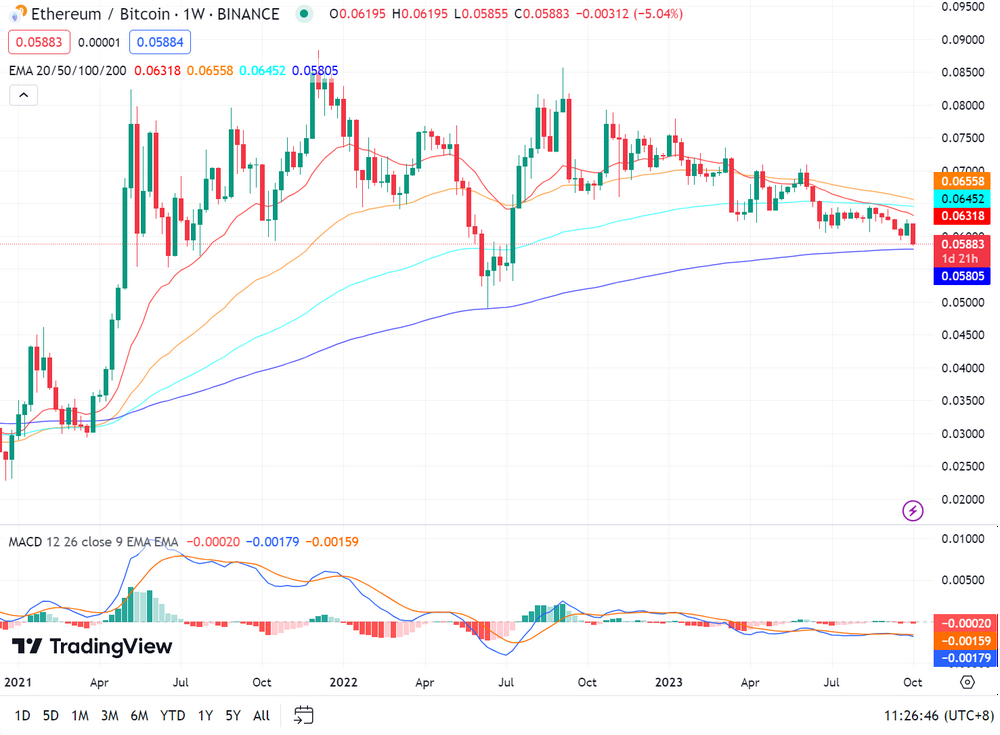
Source: tradingview
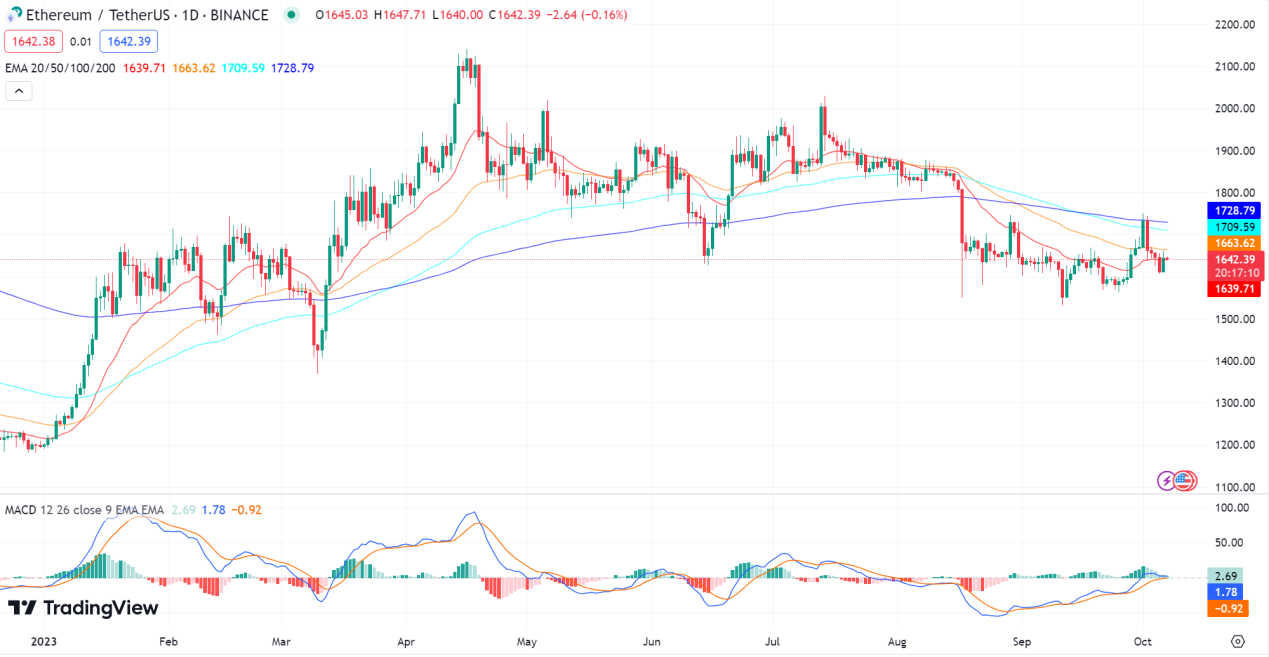
Technical Indicators
Looking at the daily chart, since the drop in ETH on August 18, it has been below the EMA200, and the MACD has just approached the zero axis. In comparison, on October 1, BTC rose above the EMA200 and the MACD also crossed the zero axis, entering the bullish zone.
II. Influencing Factors
The strength and weakness of ETH are influenced by very complex factors. At the macro level, this includes changes in the Fed's interest rate policy and the SEC's regulatory stance. At the micro level, this includes the development of the ETH ecosystem, the rise of layer 2 solutions, token consumption and supply, and market participation enthusiasm. This analysis focuses on factors that have undergone significant changes recently.
Significant reduction in gas consumption, ETH resumes inflation
In August and September 2023, on-chain transaction activity entered a quiet period. On one hand, there were no new hot projects on-chain, leading to a decrease in transactions. On the other hand, several potential airdrop projects experienced a large amount of hacking and rug-pulling behavior, leading to a decrease in interaction enthusiasm.
The on-chain gas for ETH has remained at 10 gwei or below. The reduction in on-chain activity and the decrease in gas fees have led to ETH supply exceeding consumption in the past 30 days, resulting in a resumption of inflation with an inflation rate of 0.275%, adding 27,000 ETH in the last 30 days.
However, overall, after the merge, ETH is still in a deflationary state. Since the merge, the deflation rate has been -0.217%, reducing a total of 277,000 ETH.
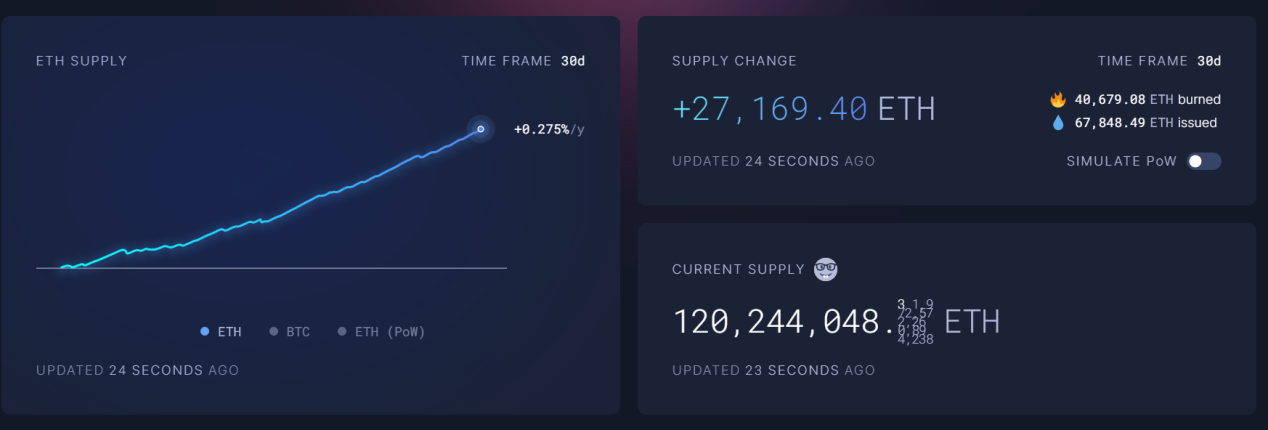
Source: ultrasound.money
Slowing down of staking, reduction in queued tokens for staking
Currently, there are a total of 844,000 active staking nodes on Ethereum, with approximately 27 million ETH staked, resulting in a staking rate of 25.33%.
Overall, the number of new stakings has significantly decreased compared to the second quarter of 2023.
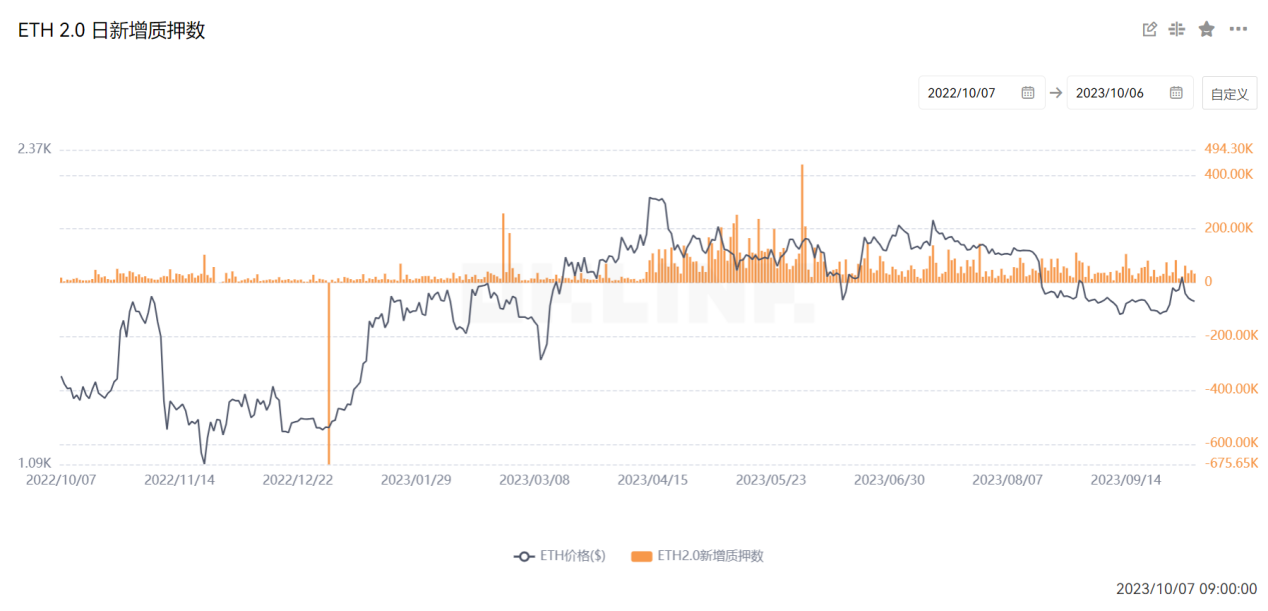
Source: OKlink
Currently, there are a total of 5723 nodes waiting to participate in staking, and Ethereum can add a maximum of 2700 new staking nodes per day. Therefore, without the addition of new tokens, it will only take 2 to 3 days to process all the waiting staking nodes. This is the shortest waiting period for staking nodes since the Shanghai upgrade.
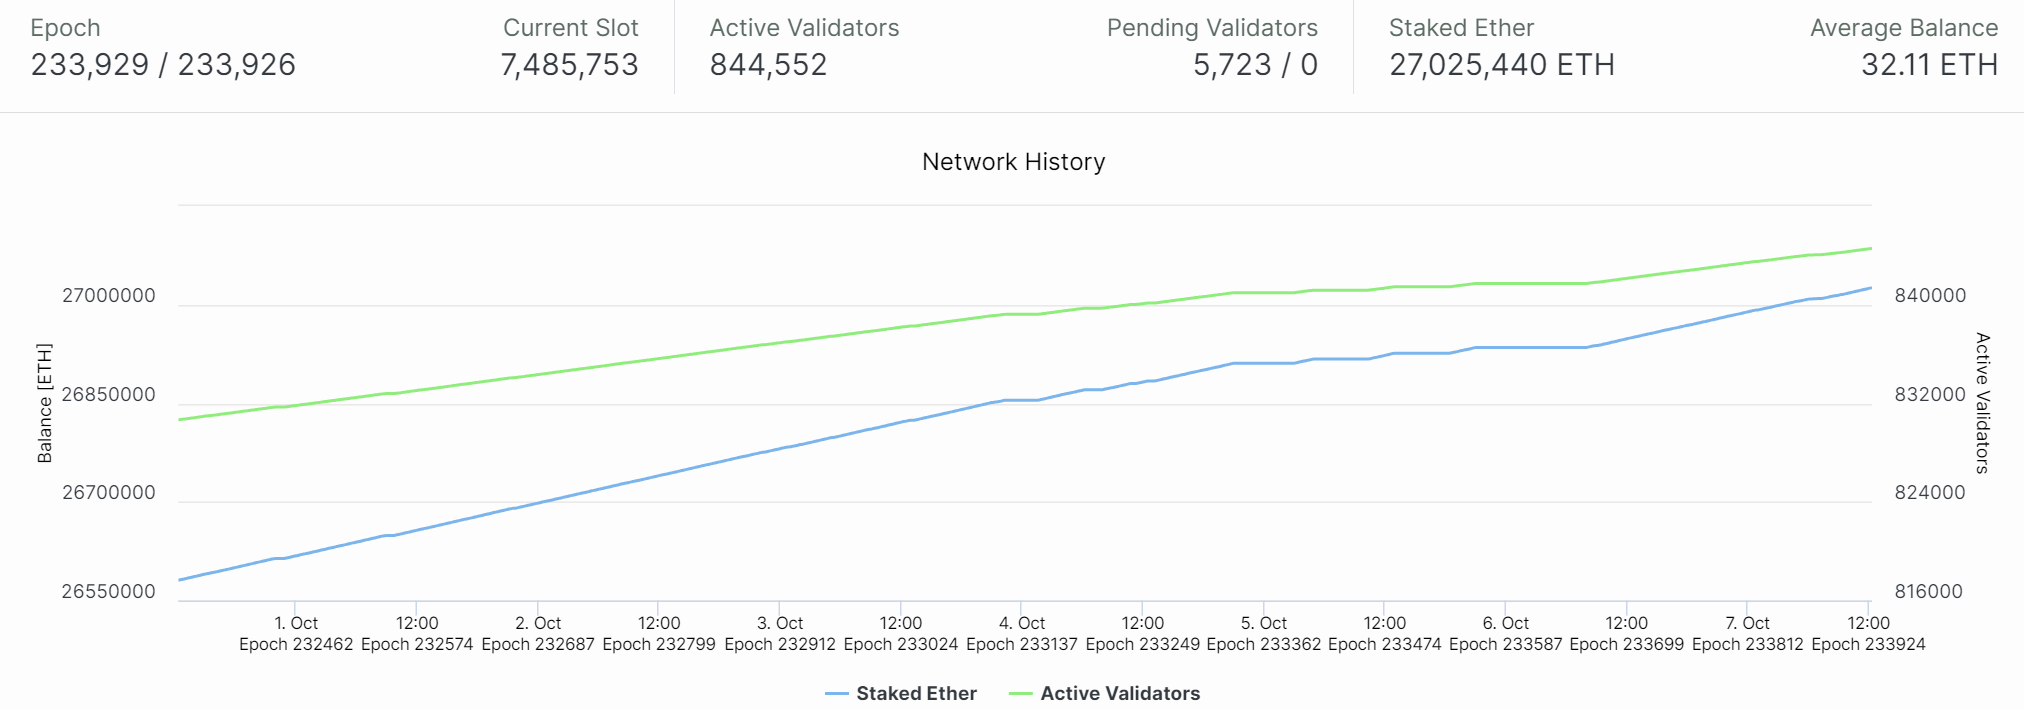
Source: beaconcha.in
Continuous selling of ETH by the founder over the past two months
Founder Vitalik's related addresses have shown continuous behavior of transferring ETH to exchanges. On October 7, he transferred another 1000 ETH (approximately $1.64 million) to Bitstamp. In the past two months, this address has deposited a total of 4400 ETH (approximately $7.23 million) into Bitstamp.
In terms of quantity and amount, this is not enough to affect the price of ETH. However, in terms of sentiment, it may affect investor confidence.
FTX hacker selling ETH, causing short-term selling pressure
The main event affecting ETH in the past 7 days is the FTX hacker selling ETH and buying BTC starting from October 1.
In November 2022, shortly after FTX filed for bankruptcy, hundreds of millions of dollars began to flow out of the exchange balance and into hacker addresses. On November 21, the hacker dispersed 185,000 ETH ($308 million) into 13 addresses and then entered a dormant state. After being dormant for 10 months, the hacker began transferring and selling the ETH from September 30.
From September 30 to October 6, 75,000 ETH ($120 million) was transferred from 5 addresses. Among them, 71,000 ETH was exchanged for BTC through THOR Chain. 2700 ETH was exchanged for 165 tBTC and then bridged back to the Bitcoin network through the Threshold Network. 1500 ETH was transferred through the privacy network RAILGUN_Project. This also led to THOR Chain announcing a temporary maintenance on the afternoon of October 6.
Currently, the hacker still holds 110,000 ETH ($176 million) in 8 addresses on the Ethereum network. 5 of the original 13 addresses have been emptied.
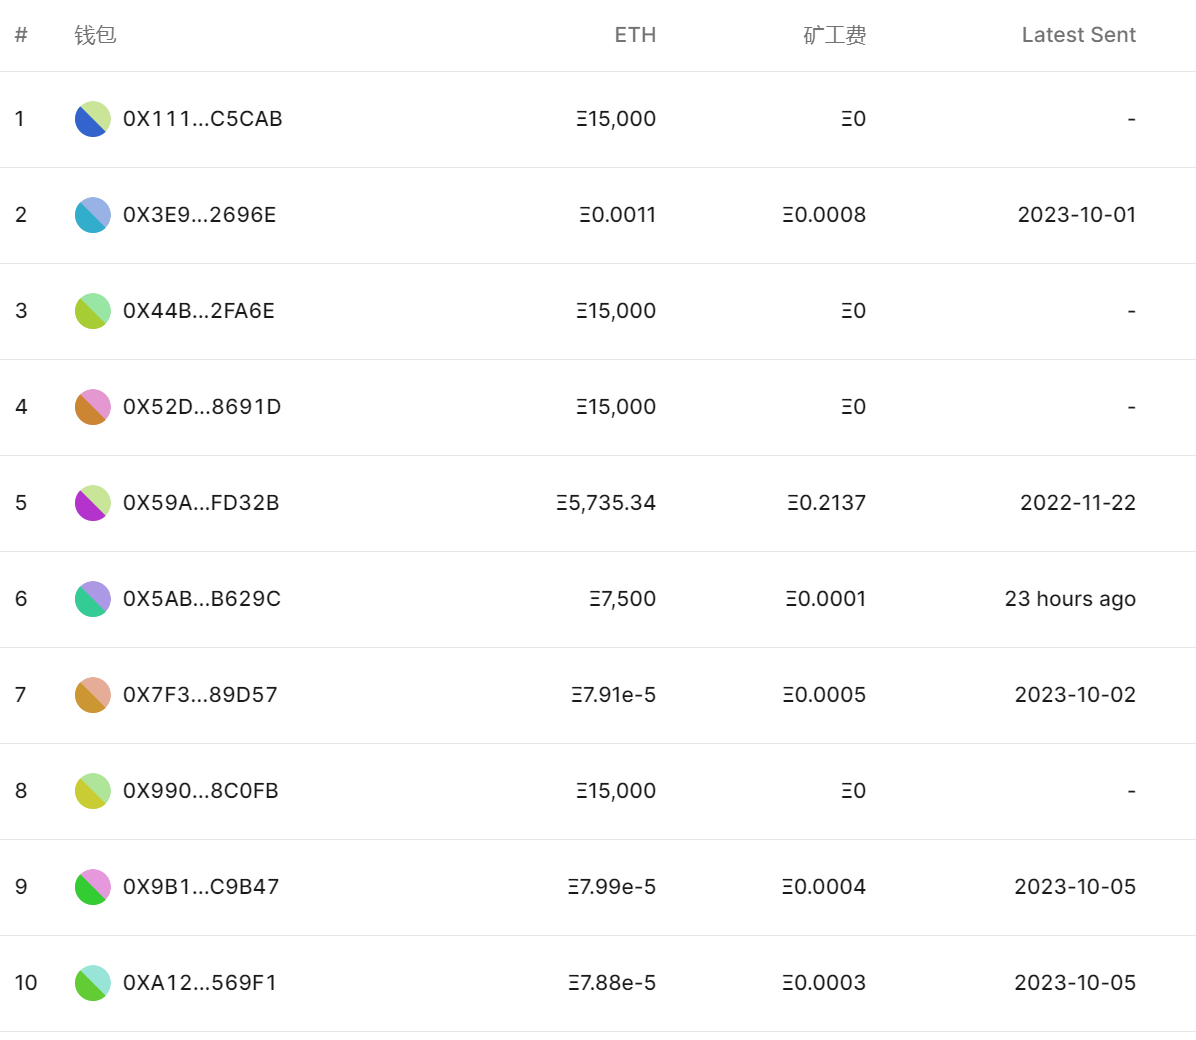
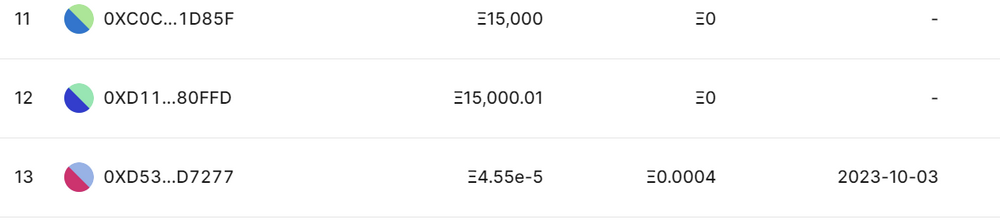
Source: mest.io
Contract Data
Main focus on changes in holdings, overall ETH holdings are in a declining state. In January 2023, when it rose to $1600, holdings were at the highest level of the year, approximately 2.37 million coins. In April, when it rose to around $2000, holdings were at 1.22 million coins, the second highest point of the year. Before the drop on August 18, holdings were at 890,000 coins. Current holdings are at 730,000 coins.
Compared to the peak at the beginning of the year, holdings have decreased by 45%; compared to the second highest point of the year, holdings have decreased by 37%; compared to holdings before the drop on August 18, there has been a 17% decrease.
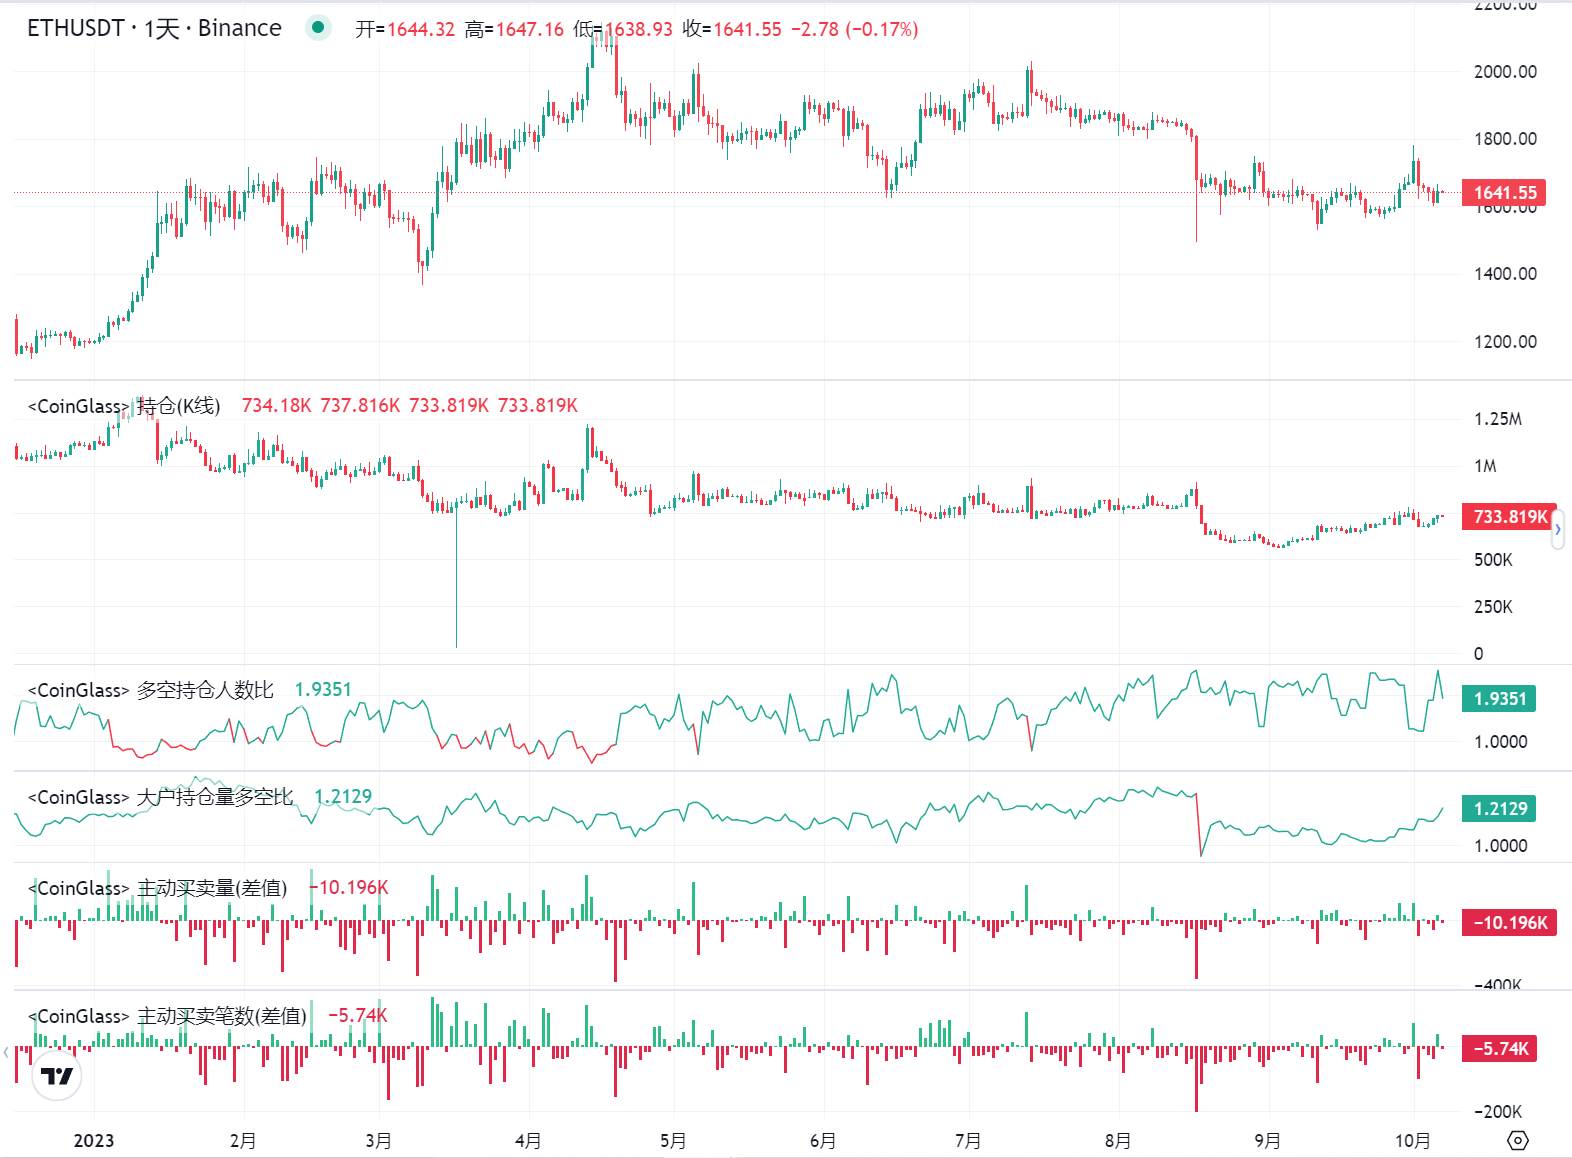
Source: coinglass
III. Conclusion
Long-term view: Compared to the previous bear market, due to the development of the ecosystem, ETH has been in an overall upward trend compared to BTC, rising from 0.01 to above 0.05. However, in the past year, ETH has been in a weak position compared to BTC, with the exchange rate in a downtrend.
Fundamentally, since the merge, ETH has been in a deflationary state with a deflation rate of -0.217%. However, in the past two months, with on-chain transactions slowing down and a significant decrease in gas revenue, ETH has entered an inflationary state, with an annualized inflation rate of 0.275% in the past 30 days.
In staking data, since the Shanghai upgrade, ETH staking has been in a continuous upward trend, with the current staking rate at 25.33%. However, there has been a slowdown in new staking data recently. The number of new stakings has significantly decreased compared to the second quarter of this year, and the number of nodes waiting to participate in staking is also lower, the lowest since the Shanghai upgrade.
In terms of selling pressure, the founder continues to sell ETH, which, although in small quantities, has a negative impact on confidence in holding the token. In addition, due to the FTX hacker selling ETH and buying BTC, there is significant short-term selling pressure.
In contract data, ETH contract holdings for the year are in a declining trend. Compared to the peak at the beginning of the year, ETH contract holdings have decreased by 45%; compared to the second highest point of the year, holdings have decreased by 37%; compared to holdings before the drop on August 18, there has been a 17% decrease.
Note: The data in this article is as of October 7, 2023.
免责声明:本文章仅代表作者个人观点,不代表本平台的立场和观点。本文章仅供信息分享,不构成对任何人的任何投资建议。用户与作者之间的任何争议,与本平台无关。如网页中刊载的文章或图片涉及侵权,请提供相关的权利证明和身份证明发送邮件到support@aicoin.com,本平台相关工作人员将会进行核查。


