What is the core of DEX competition?
Recently, Vyper suffered a re-entry attack, which had a significant impact on Curve based on Vyper, and caused quite a stir in the previously calm DEX ecosystem. We can see that some emerging DEXs, such as TraderJoe, Maverick, and Izumi, have achieved considerable trading volume on various public chains through their unique solutions, performing well. This article starts from several mainstream DEXs, focusing on stablecoin and interest-bearing asset trading, attempting to explore the evolving trends and potential directions of the DEX industry landscape.
Main Line 1: Evolution of Liquidity Overflow to Stock Real Trading Demand

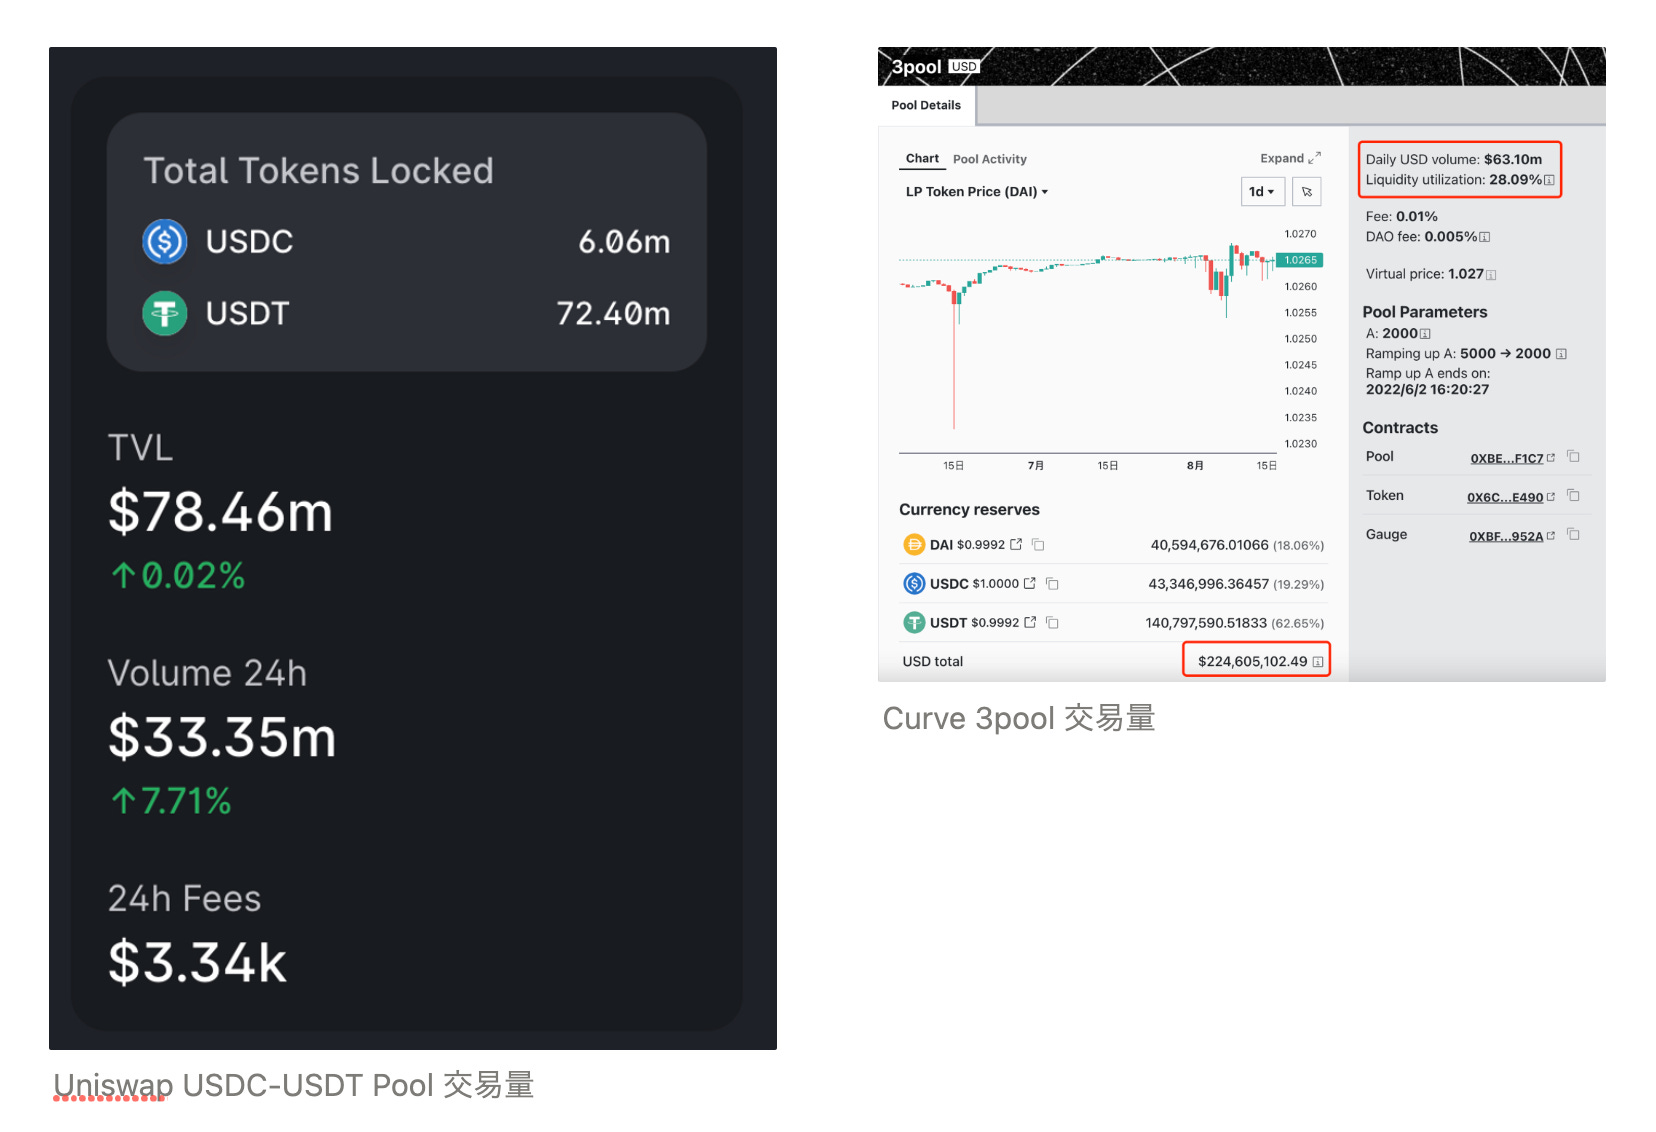
Since Curve was attacked due to the Vyper vulnerability, TVL dropped from 38 billion to 20 billion, almost halved. Now, after FRAX added liquidity back to Curve, TVL has risen to 28 billion. Interestingly, in this event, the panic about Curve's own lending default far exceeded the panic about stablecoin de-pegging. People have always closely associated Curve with stablecoins, and Curve is undoubtedly the leader in stablecoins. But in this hack, why did the concern about stablecoin anchoring not erupt?
The first question to be discussed is, how to define who is the "leader in stablecoins"?
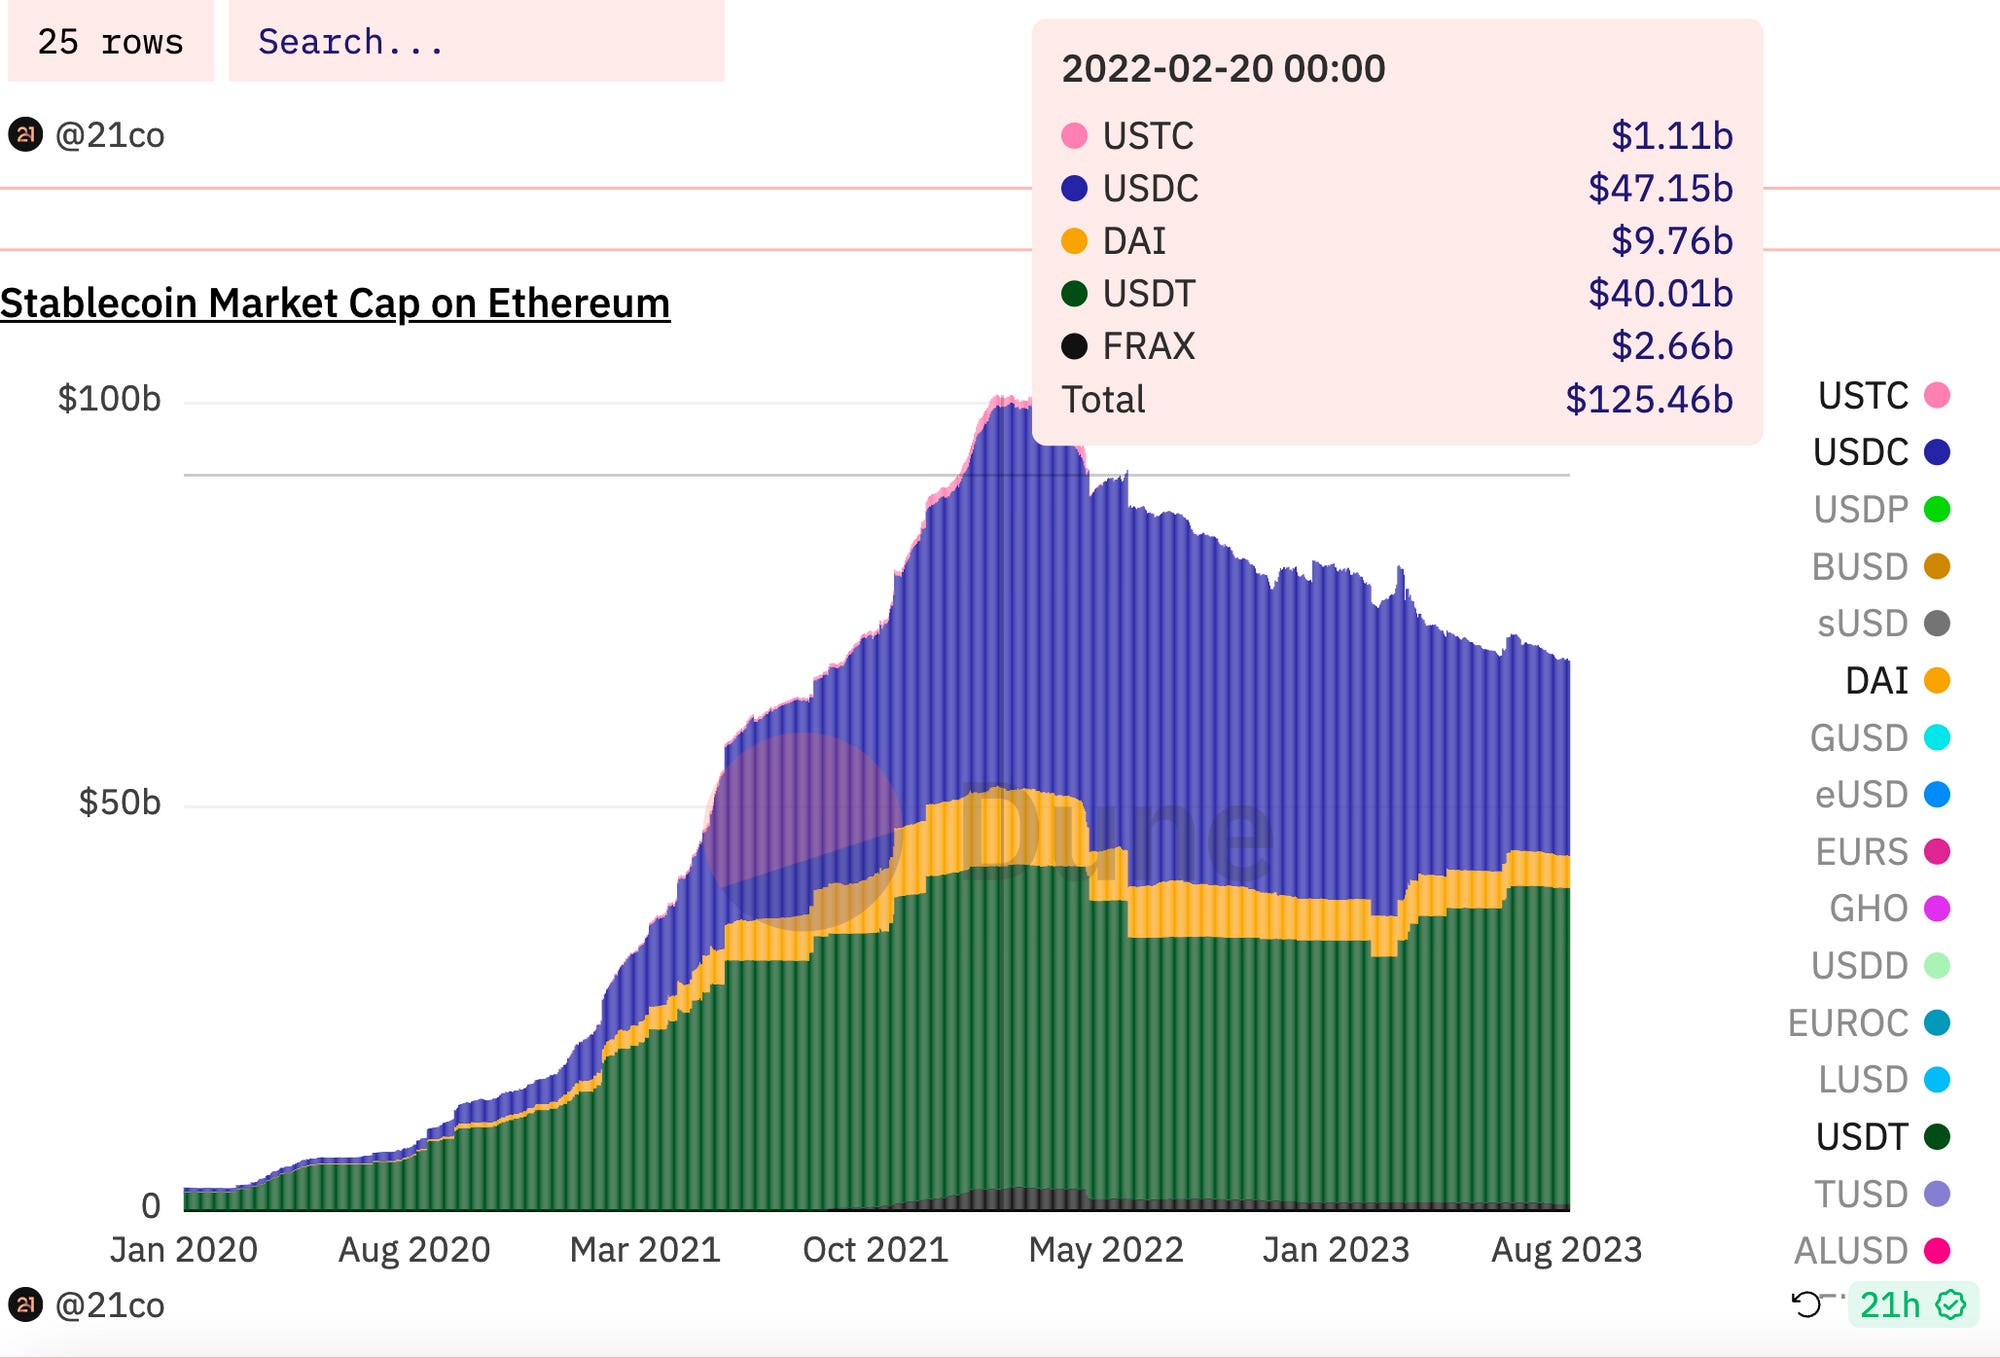
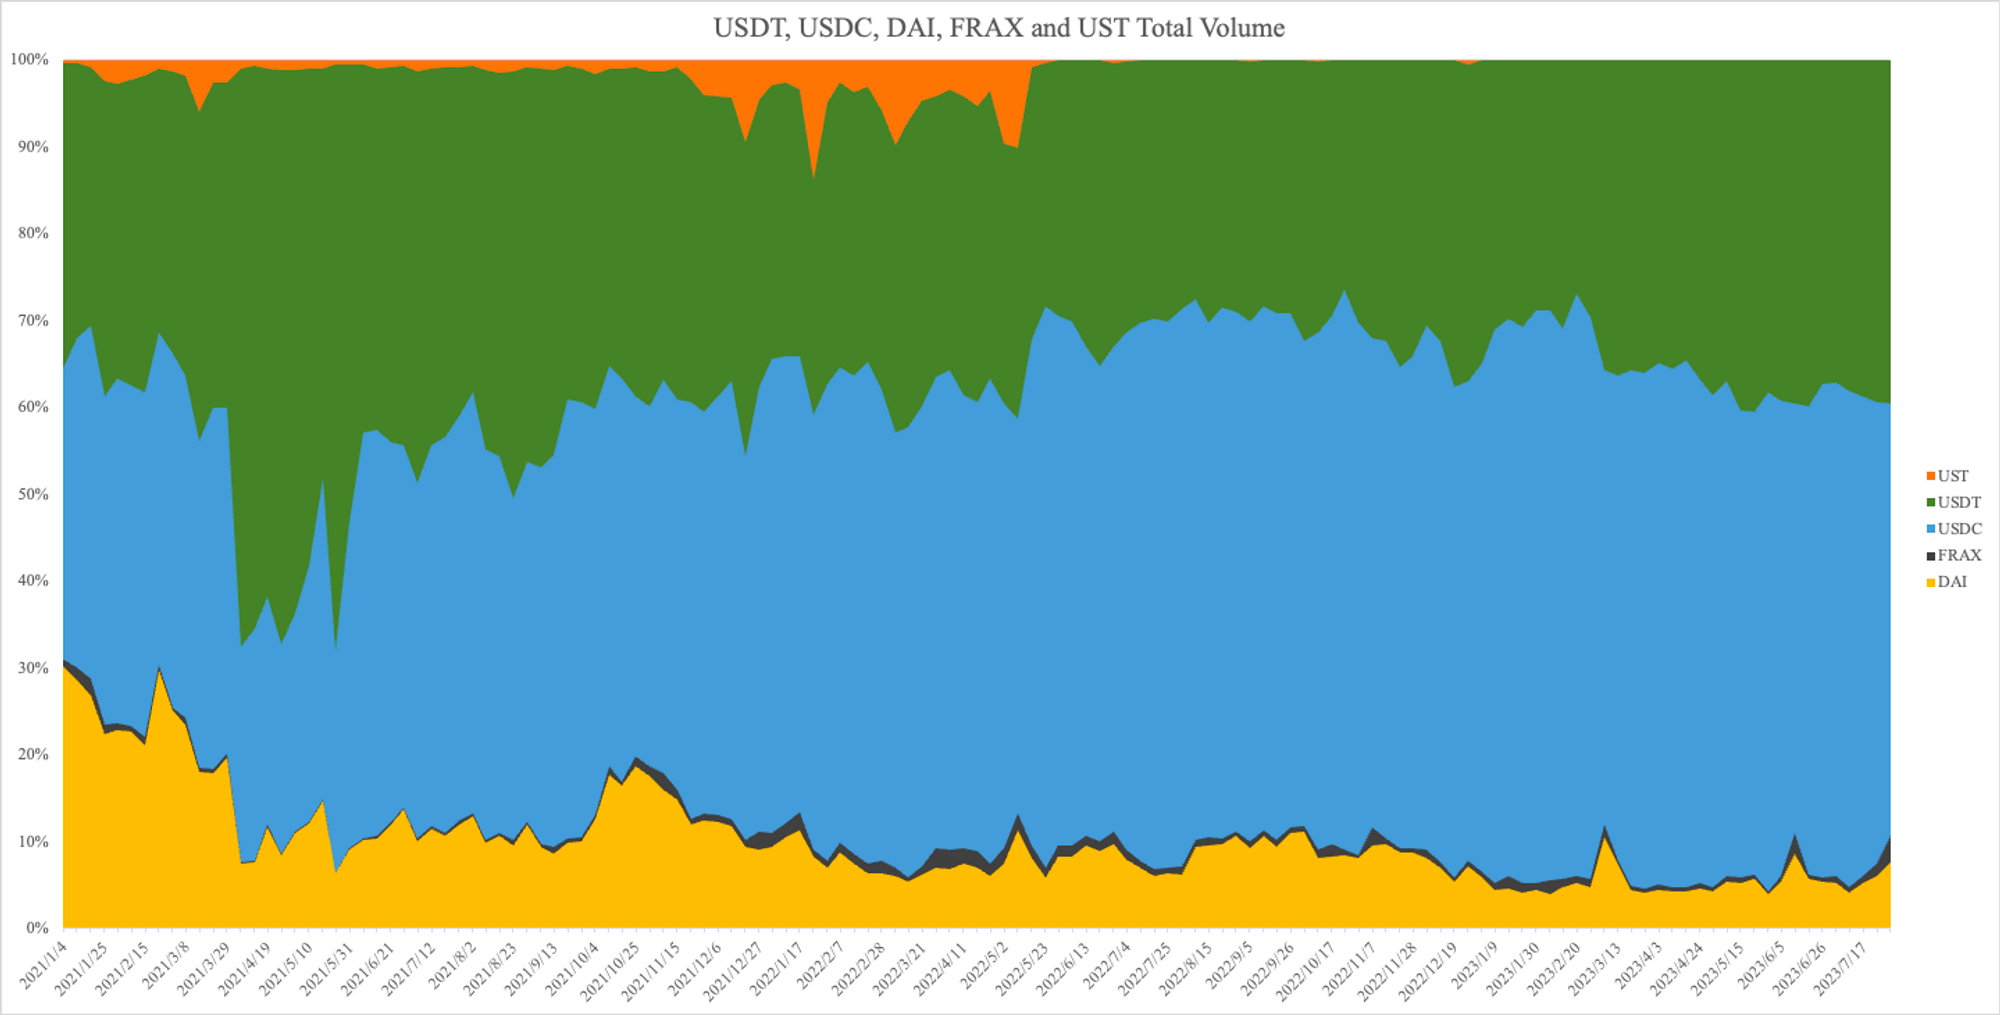
The following chart reflects the overall market value changes of stablecoins in the market. It is evident that from January 2020 to February 2022, the market value of stablecoins in the market has been continuously growing. The main contributors to the growth are USDC, USDT, DAI, and algorithmic stablecoins FRAX and UST.
The timeline in the following chart can be summarized as follows:
Data Source: https://dune.com/21co/stablecoin-dex-volume
January 2021: The total market value of on-chain USDC began to grow rapidly.
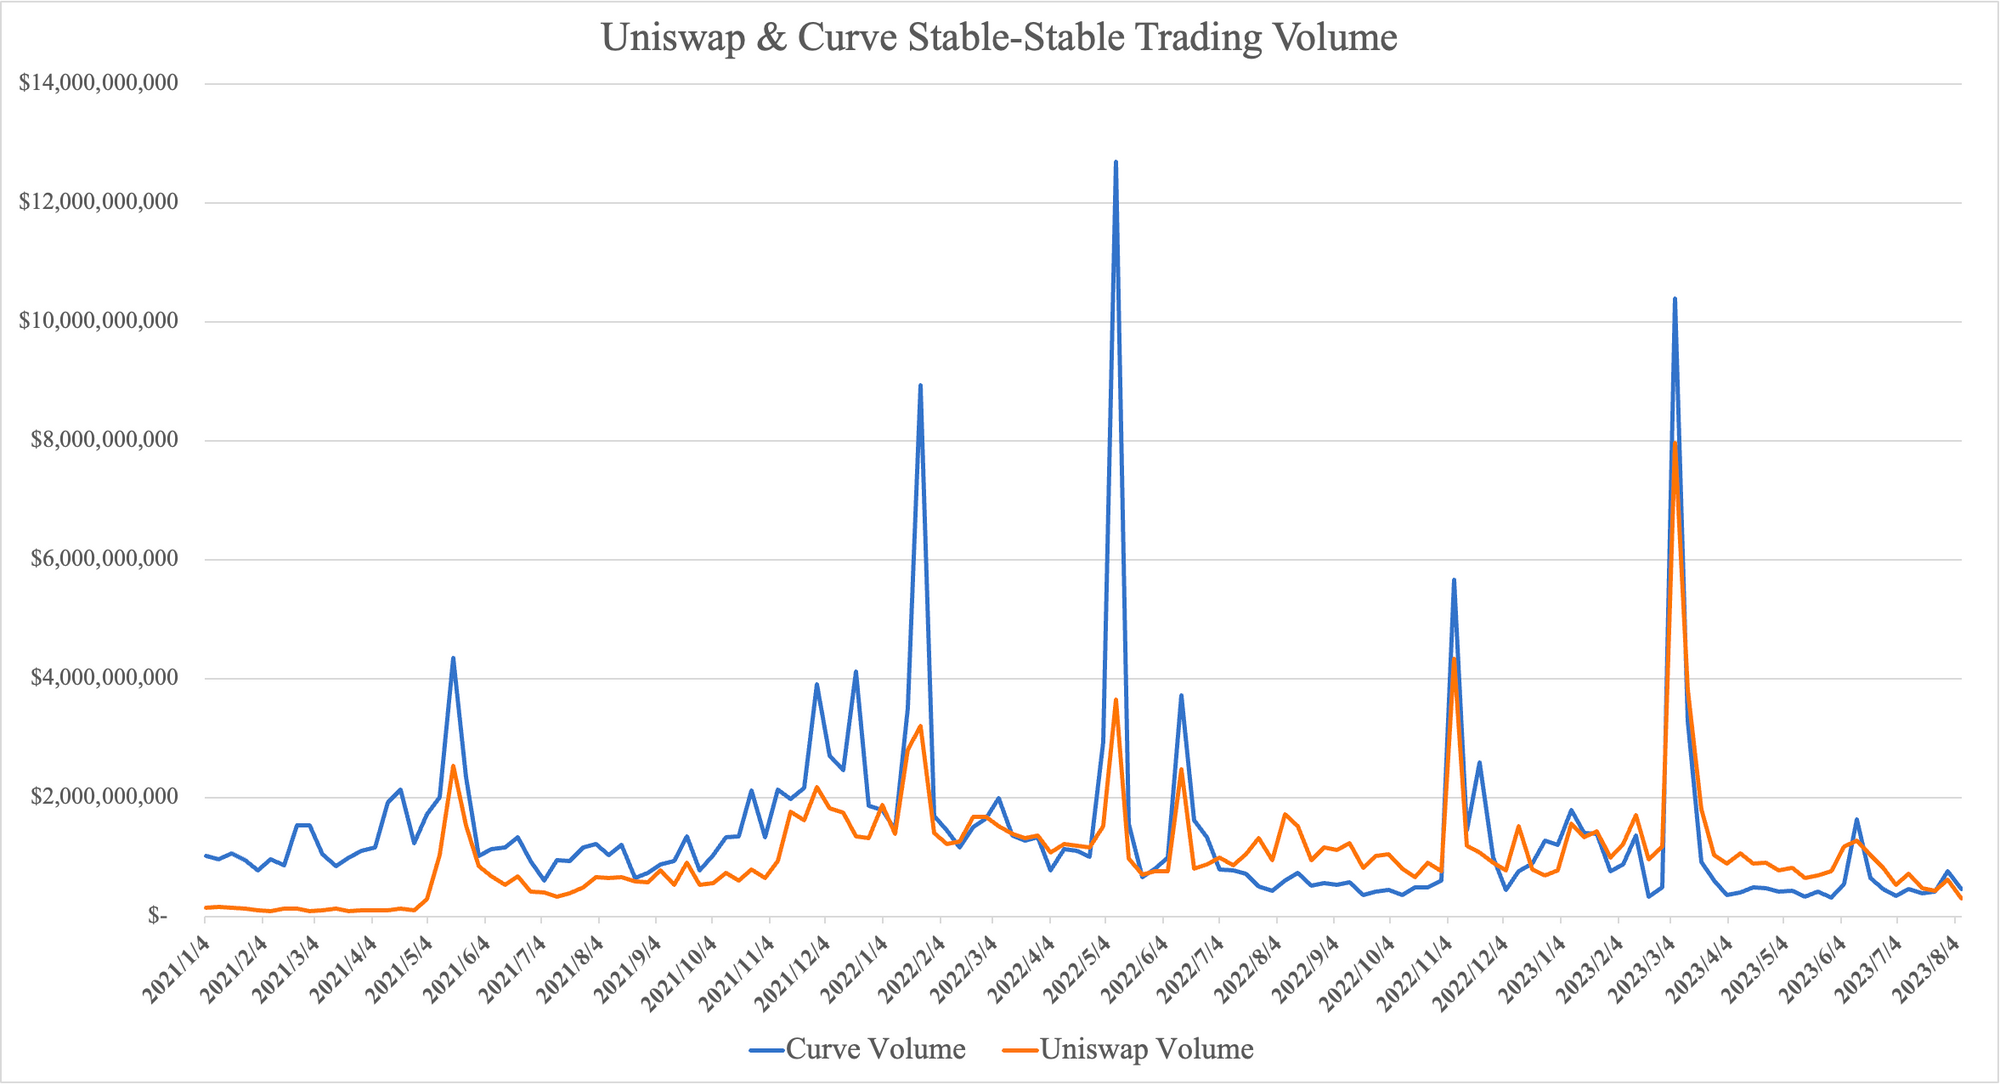
May 2021: Uniswap V3 launched, and people started trading stablecoins on Uniswap, although at this time, there was still a certain gap in trading volume between Uniswap V3 and Curve.
September 2021 to April 2022: The Curve War intensified, and the TVL and trading volume of algorithmic stablecoins such as FRAX, UST, and MIM surged.
May 2022: UST defaulted, significantly reducing the demand for stablecoins in the Curve War.
July 2022: Uniswap Stable-Stable (S-S) trading volume began to consistently exceed Curve.
April 2023: After the upgrade in Shanghai, stETH can be withdrawn 1:1 on Lido Buffer, leading to reduced demand for liquidity in the Curve market.
To help readers better understand the development context of stablecoin swaps, we will analyze stablecoin swaps as traditional stablecoin swaps (USDT, USDC, and DAI) and emerging stablecoin swaps (FRAX and UST) in the following sections.
Traditional Stablecoins: Maintaining Stability, Slight Decline
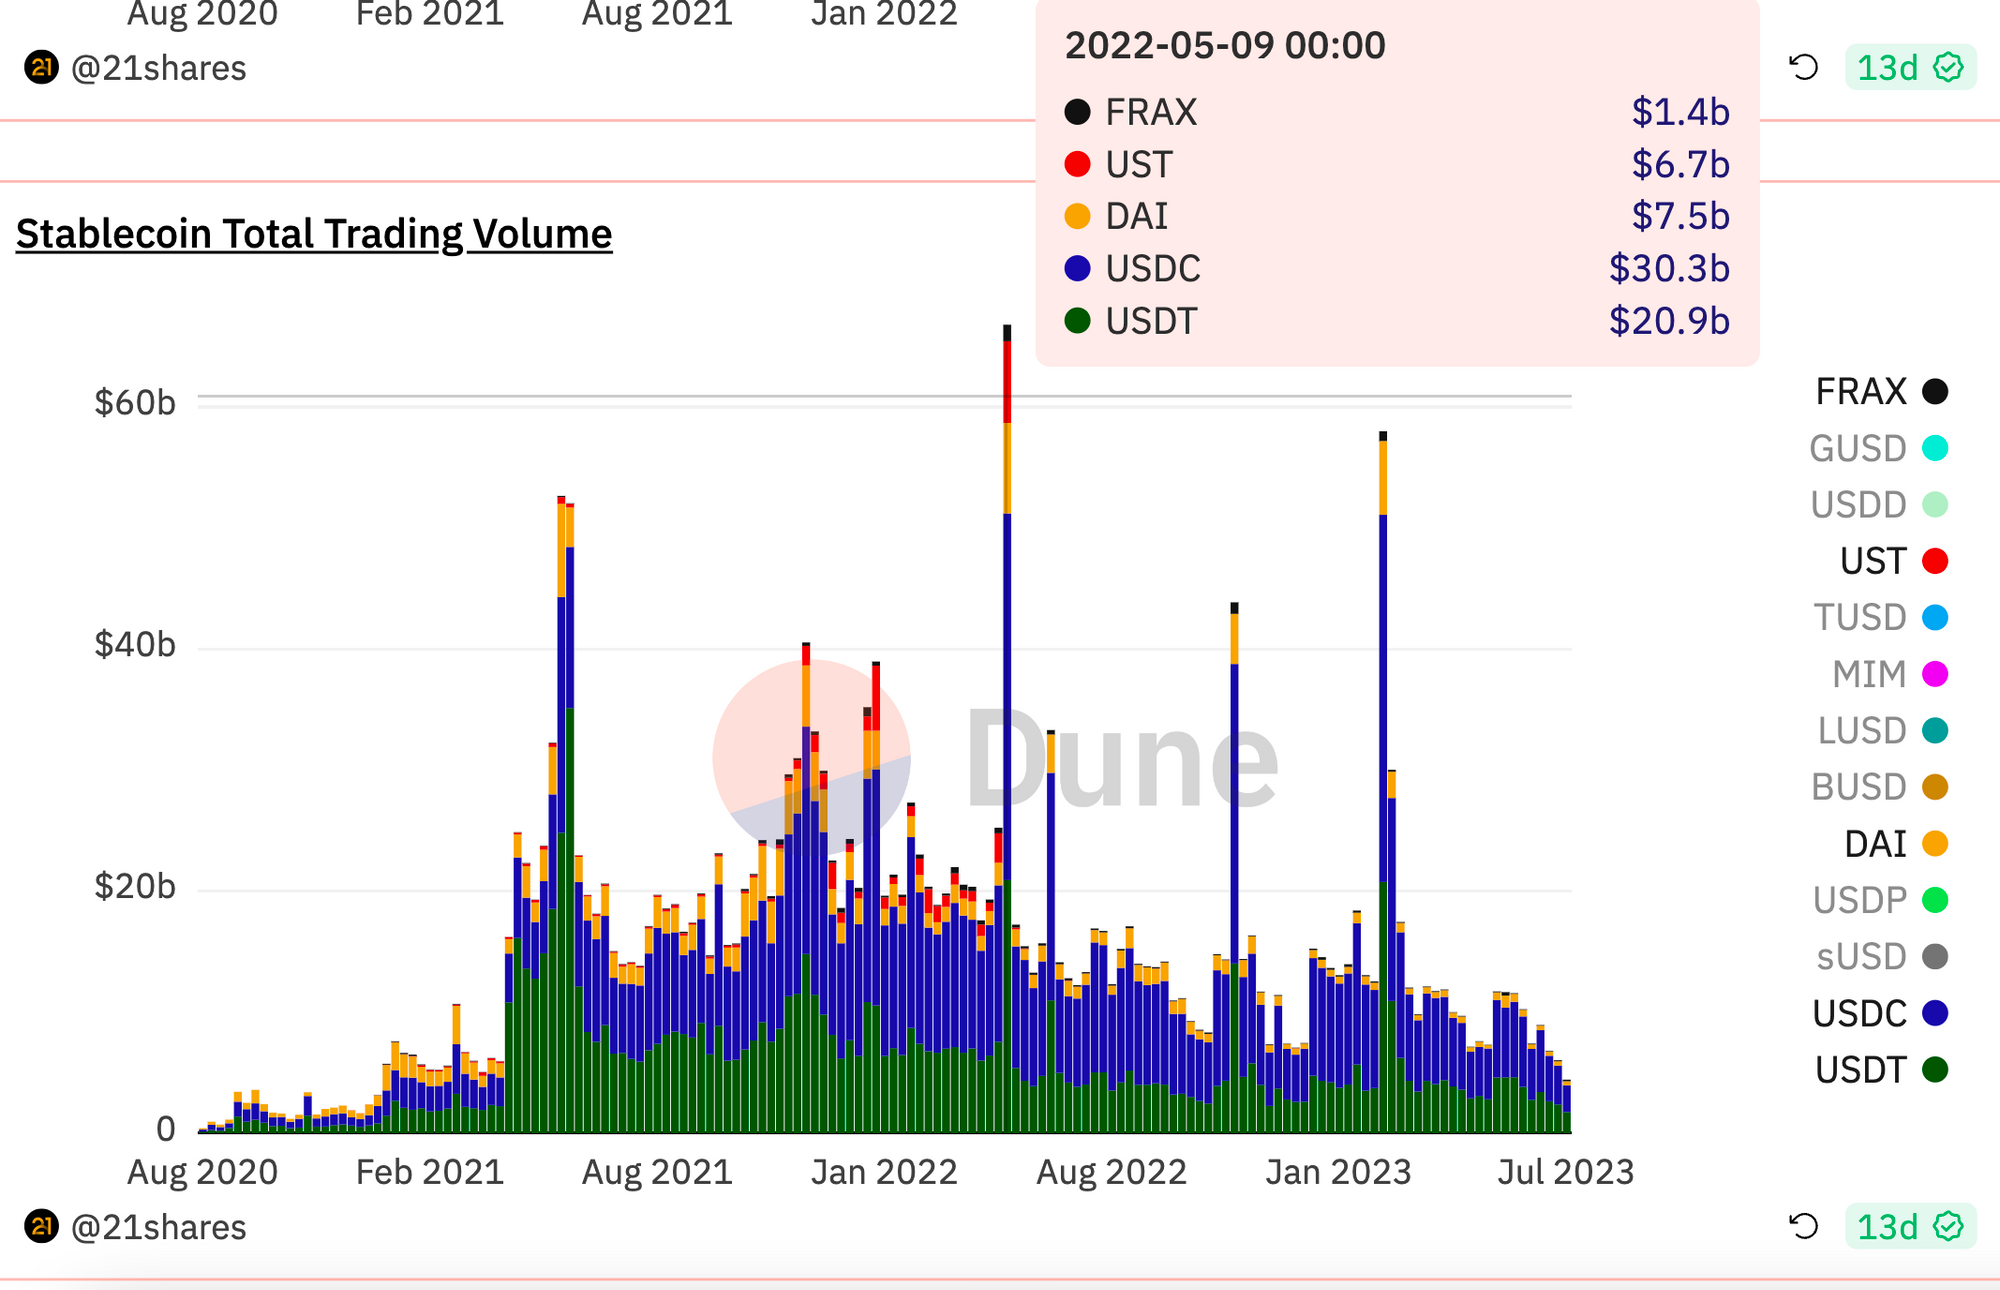
It can be seen that the trading volume of traditional stablecoins experienced a significant increase in April 2021, mainly due to the substantial increase in USDC market value. Subsequently, the trading volume of mainstream stablecoin swaps remained relatively stable until the UST default in May 2022, after which the overall stablecoin swap trading volume began to gradually decline.
Emerging Stablecoins: Fleeting, Competing with Curve
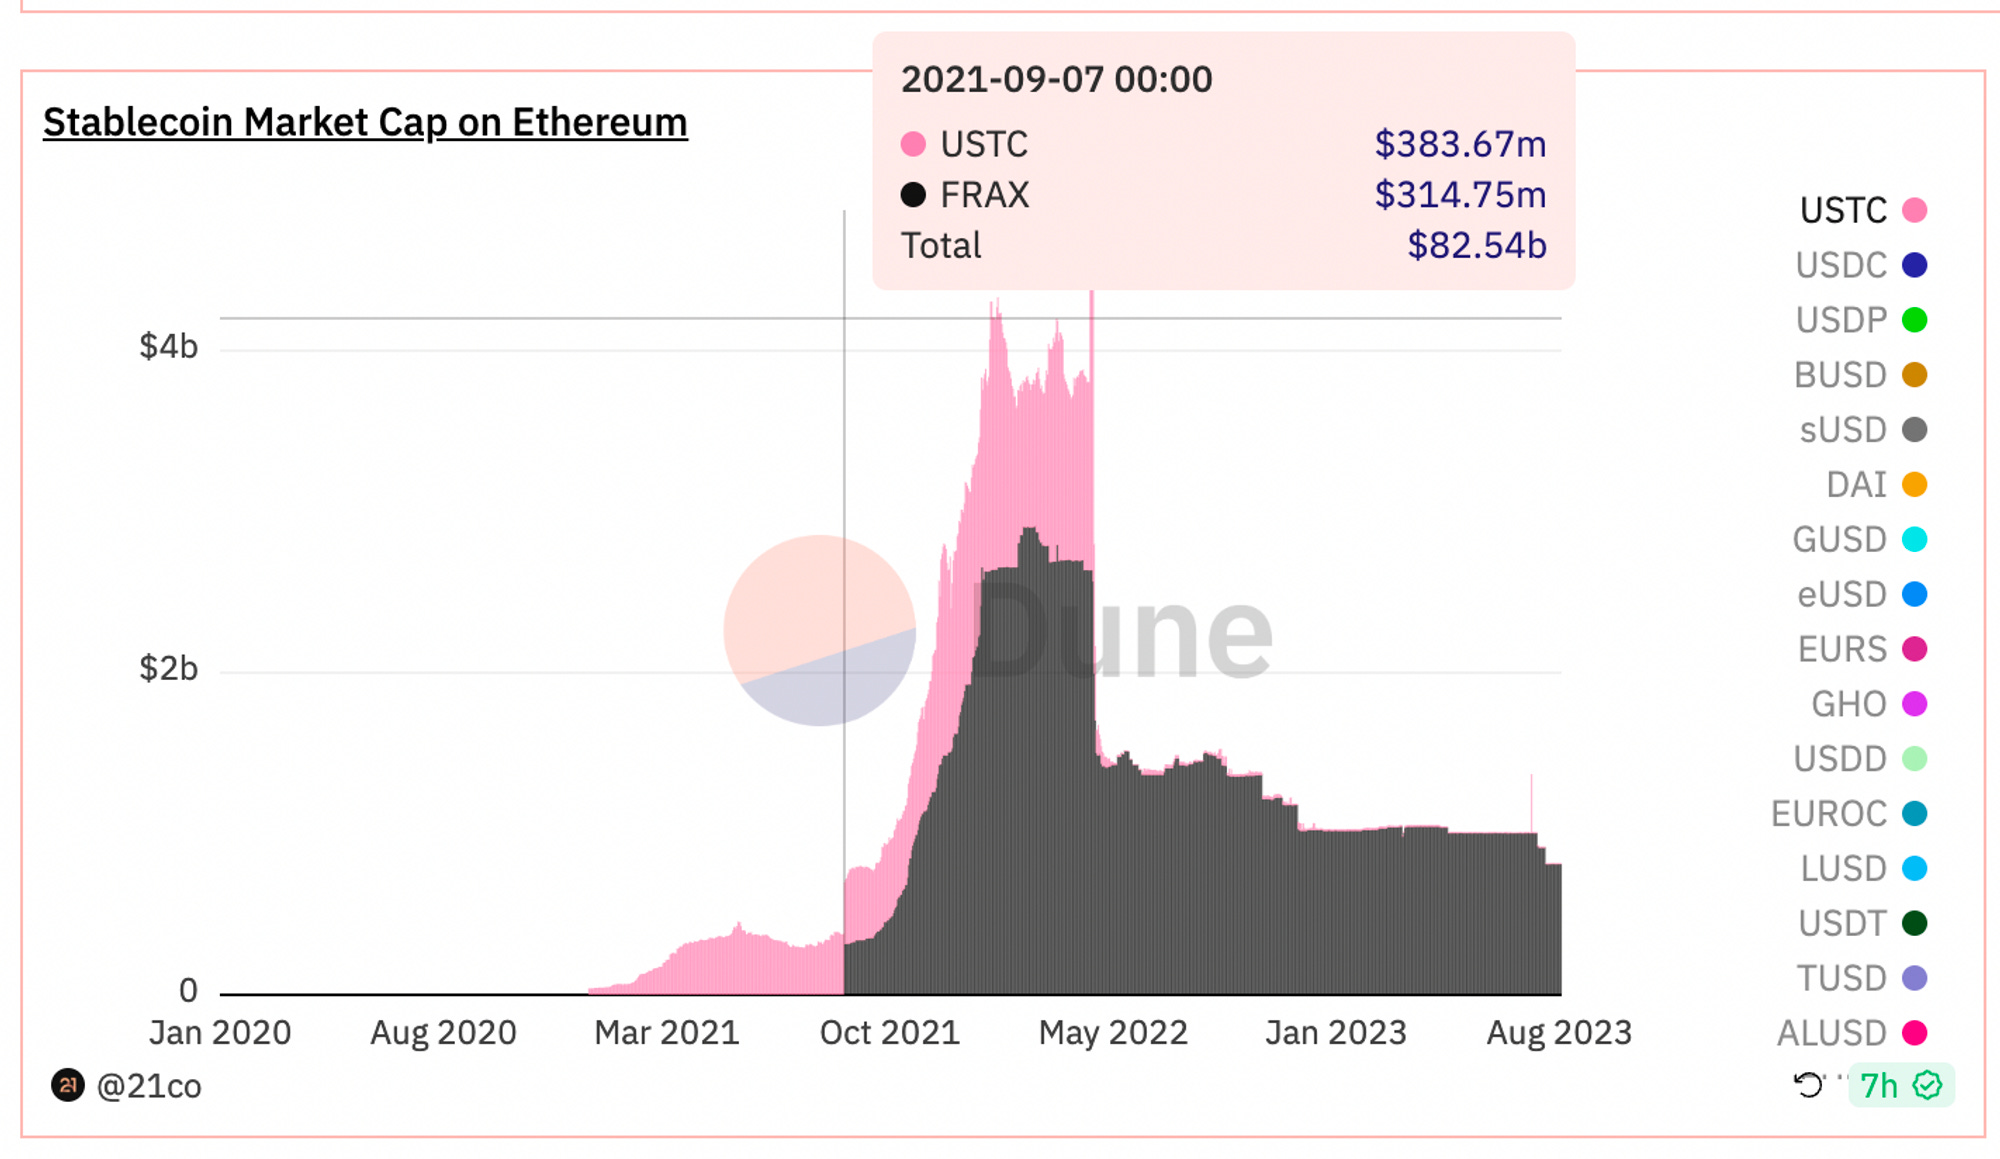
By observing the following data charts, we can clearly see the trend of the total market value changes of FRAX and UST before the crash. It is evident that starting from March 2021, the market value of UST gradually increased, and by September of that year, its market value showed an explosive growth alongside FRAX.
As shown in the chart below, the trading volume of UST surged in November 2021. At that stage, its highest trading volume accounted for 10% of the overall stablecoin trading volume. For algorithmic stablecoins like UST, establishing reliable credit support is the primary task for achieving anchoring. It is worth noting that this additional trading volume was mainly captured by Curve. This means that at that time, Curve was of significant importance for algorithmic stablecoins.
From the liquidity overflow of the window dressing effect to the real trading demand of stock competition
Before delving into the reasons why Curve occupies a large amount of algorithmic stablecoin trading volume, we first introduce an important concept: window dressing effect.
The window dressing effect is a term commonly used in the traditional finance industry, referring to the means by which fund managers present their company or portfolio in a more healthy, successful, or compliant manner to the public.
During that period, we could clearly perceive that Curve exhibited a significant window dressing effect to the entire stablecoin market.
Former U.S. Treasury Secretary Timothy Geithner once made a famous statement:
"I hope to have enough money in the window to match any potential debt."
Generally, the window dressing effect carries a certain negative connotation. However, in the context of Curve, this effect can be seen as a neutral or even positive phenomenon, and its existence has a certain necessity and rationality. Unlike the minimalist Uniswap frontend, Curve chose to openly display TVL to users, achieving the credit overflow of traditional stablecoins to new algorithmic stablecoins, which Uniswap does not possess. In this context, users tend to believe that whether they hold mainstream stablecoins or some smaller algorithmic stablecoins, they are supported by tens of billions of TVL. For stablecoin projects, they need to rely on a huge TVL to maintain the network effect of their stablecoins. As defined, showing "more success" and "healthier" behavior will encourage project parties to be more actively involved in Curve. The later cost of veCRV bribery is a matter to be considered after the bull market wave recedes.
Curve's core goal is to help emerging stablecoins build "showcase" credit. However, in the current context where UST has failed and the narrative of algorithmic stablecoins has been almost debunked, the market's demand for building credit has weakened, and the dominant factor is the real trading demand.
Currently, major DEXs have further vertically developed the AMM mechanism, shifting the competition focus from TVL scale to improving capital efficiency, i.e., competing for a larger share of trading volume by providing deeper trading depth and more competitive prices. This also explains the fundamental reason why Uniswap's S-S trading volume surpassed Curve, as mentioned at the beginning of this chapter.
Regarding the question of whether Curve is still the leader in the stablecoin market, from the perspective of the window dressing effect, the crypto industry does indeed need a showcase platform. Curve not only highlights the strong capital support behind stablecoins but also provides users with a "guarantee" of safe use.
However, in a phase where industry and DeFi attention is gradually decreasing, the demand for such a showcase platform is significantly reduced, both from users and project parties. People are starting to focus more on the real trading demand in the stock market. In such a big environment, it seems somewhat difficult to assert that Curve is still the leader in stablecoin trading in the current market. With the changing market dynamics and user demands, new leaders or a more decentralized market structure may emerge.
Titans are evenly matched, and new forces are showing their strength
In this chapter, we will analyze the mechanism and trends of the competitive landscape of stablecoin DEXs, starting from the mainstream stablecoin pairs for stablecoin trading, such as USDT, USDC, and DAI.
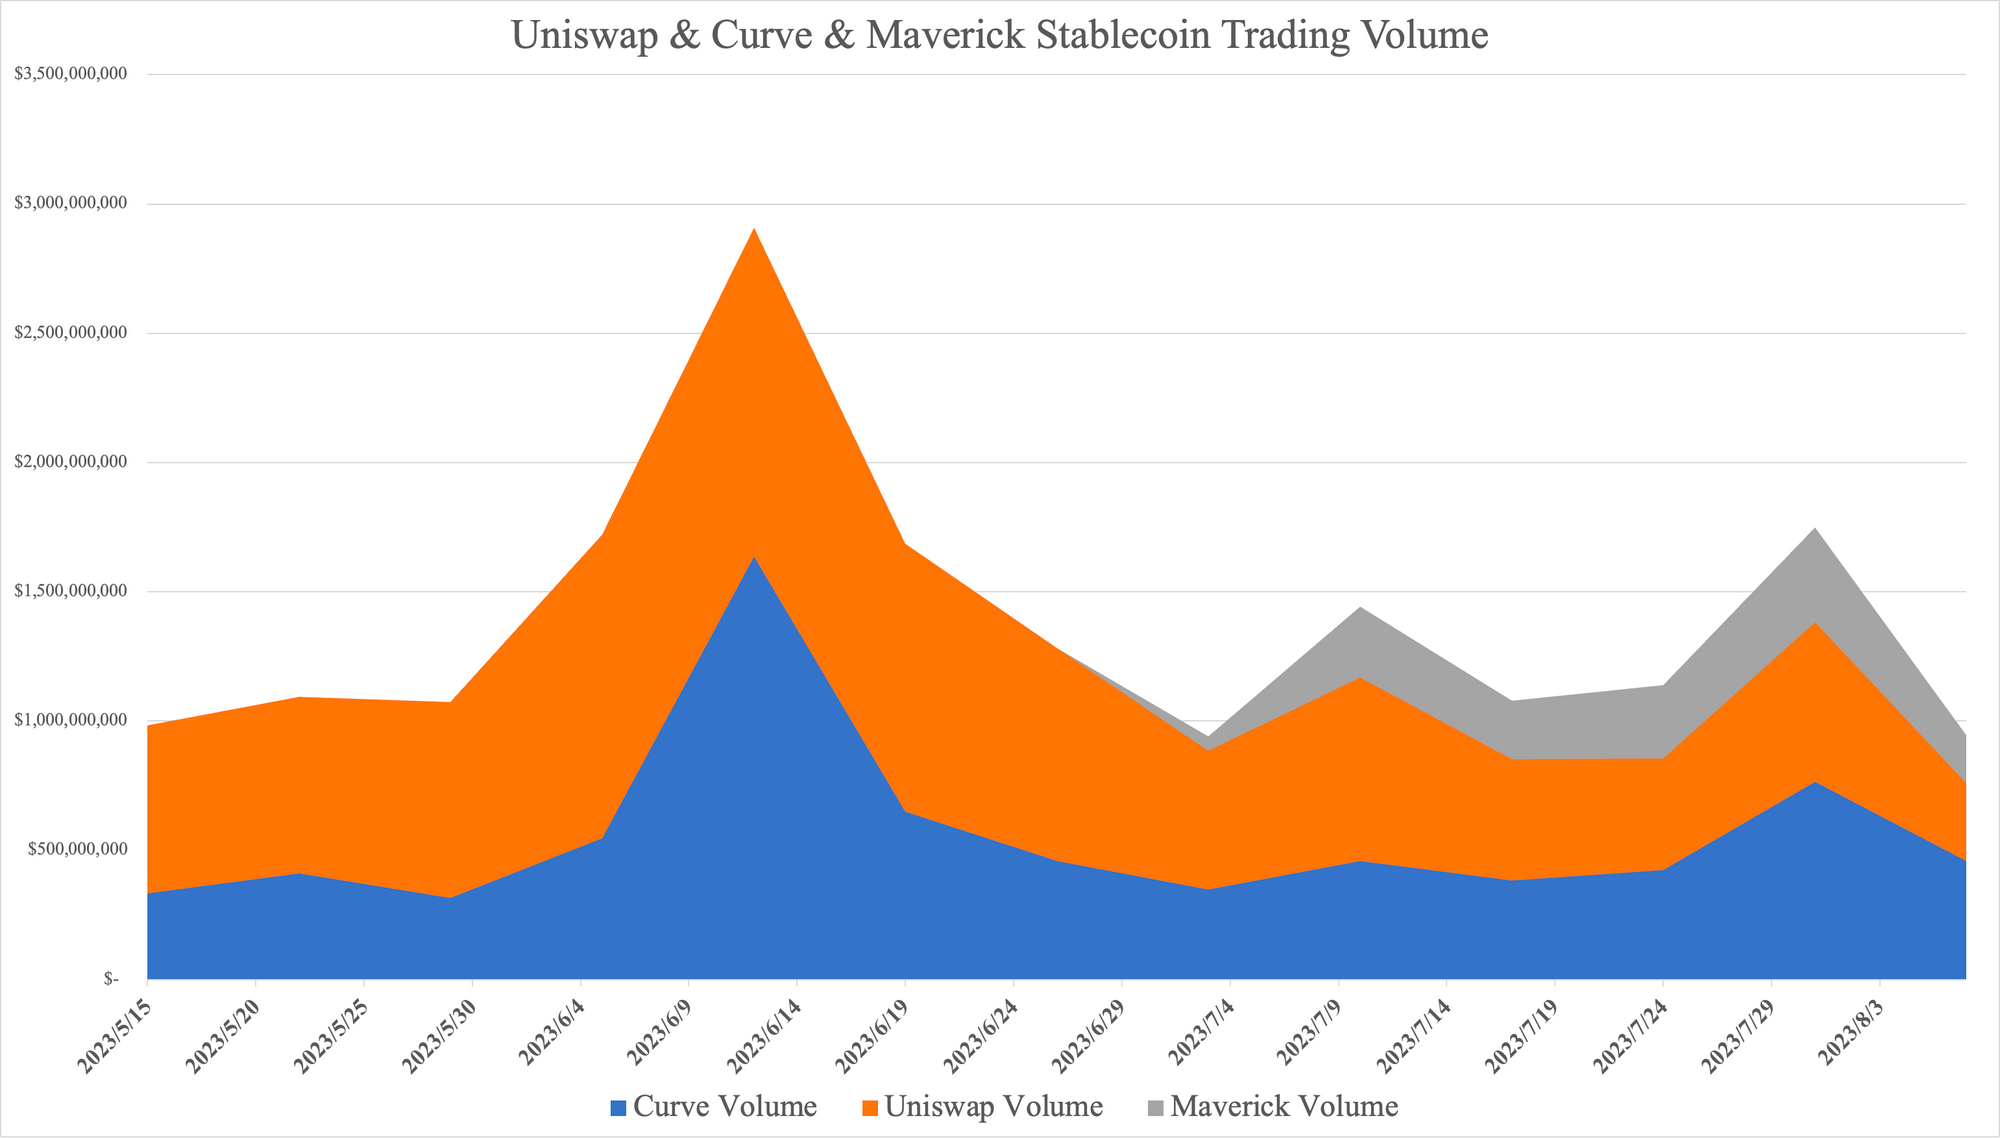
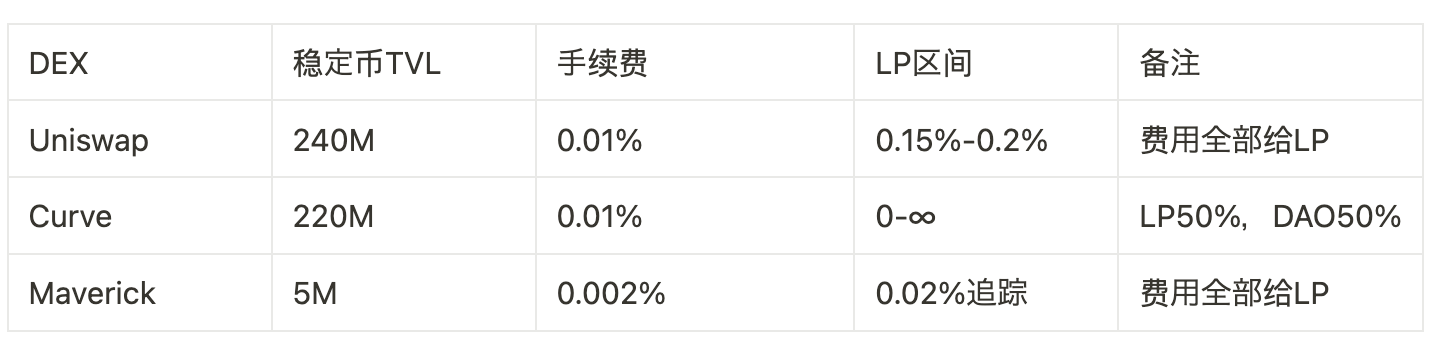
As mentioned in the previous chapter, we have already analyzed the changing trends in stablecoin swap trading volume between Uniswap and Curve. Curve has captured a certain market share based on its first-mover advantage, while Uniswap has gradually caught up with higher capital efficiency brought by V3. In the current widely used 1inch, the market competition for stablecoin swaps has become very flat and fierce. Since the vast majority of stablecoin-to-stablecoin trading volume is concentrated in the three major mainstream stablecoins, USDC, USDT, and DAI, the competition between DEXs is mainly focused on lower slippage and lower fees. The winner can attract more trading volume, thereby creating higher APY for LPs.
The chart below shows the recent changes in stablecoin-to-stablecoin swap trading volume. From the chart, we can observe that the competitive landscape between Uniswap and Curve has stabilized. However, it is worth noting that since July, Maverick's market share has significantly increased, successfully capturing a portion of the existing market, thereby reducing the market share of Uniswap and Curve.
Let's first understand Maverick. Maverick is a unique decentralized exchange (DEX) with a core mechanism that adjusts LP ranges based on Time-Weighted Average Price (TWAP) to aggregate LPs around the market price, providing the best trading depth. Maverick offers four modes (Left, Right, Both, and Static) to give LPs directional choices (predicting price increases or decreases), which helps to address market trends of unilateral increases, decreases, or sideways movements. For liquidity providers, Maverick not only significantly reduces management costs but also creates more income when correctly predicting market trends. In terms of results, this automated liquidity-following mechanism greatly improves Maverick's capital efficiency.
Capital efficiency can be calculated as "trading volume / TVL," i.e., the proportion of TVL actually utilized in a DEX's daily trading volume.
The chart below shows the capital efficiency of major DEXs on the Ethereum mainnet. According to the data in the chart, Uniswap's Volume/TVL ratio is approximately 0.16, meaning that 16% of TVL is actually participating in trading. In contrast, Curve's capital efficiency is lower, with only 6.7% of capital being used for trading, further confirming Curve's strong window dressing effect. Maverick is the only DEX platform with trading volume exceeding TVL, with a capital efficiency of 151%, far surpassing other competitors.
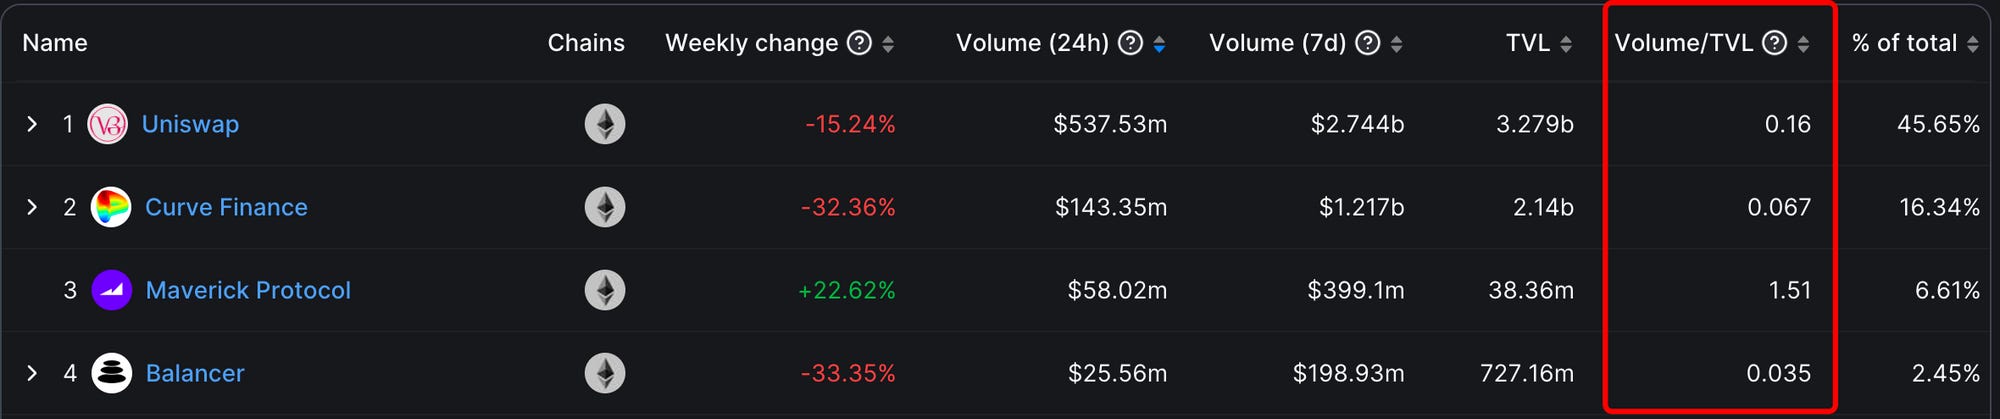
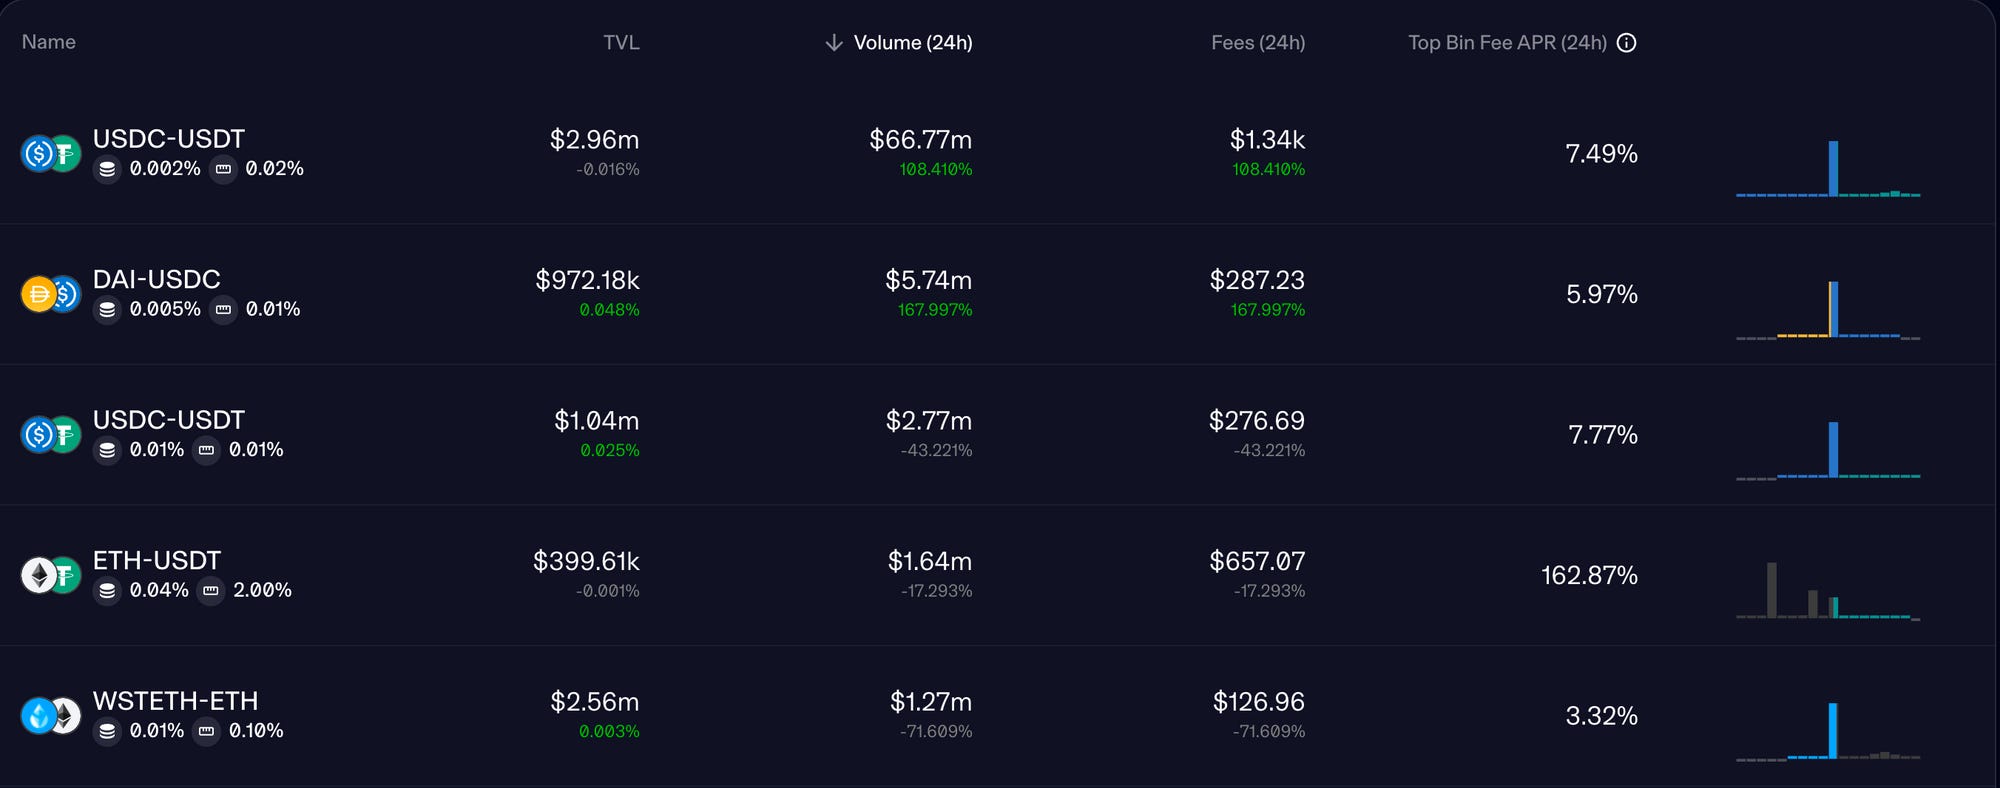
Further analyzing Maverick's TVL, we can notice that 90% of Maverick's trading volume (66M USD) is supported by the USDC-USDT trading pair, which accounts for less than 7% of TVL (3M USD). In terms of stablecoin pairs, Maverick's capital efficiency reaches 2000%, far exceeding the corresponding indicators of Uniswap V3 pools and Curve 3pool.
 Maverick Daily Trading Volume
Next, let's explore the fee and liquidity distribution of major DEXs. From the data, it is evident that Uniswap and Curve charge the same fees, but they are both higher than Maverick, which is an advantage for Maverick in attracting traders.
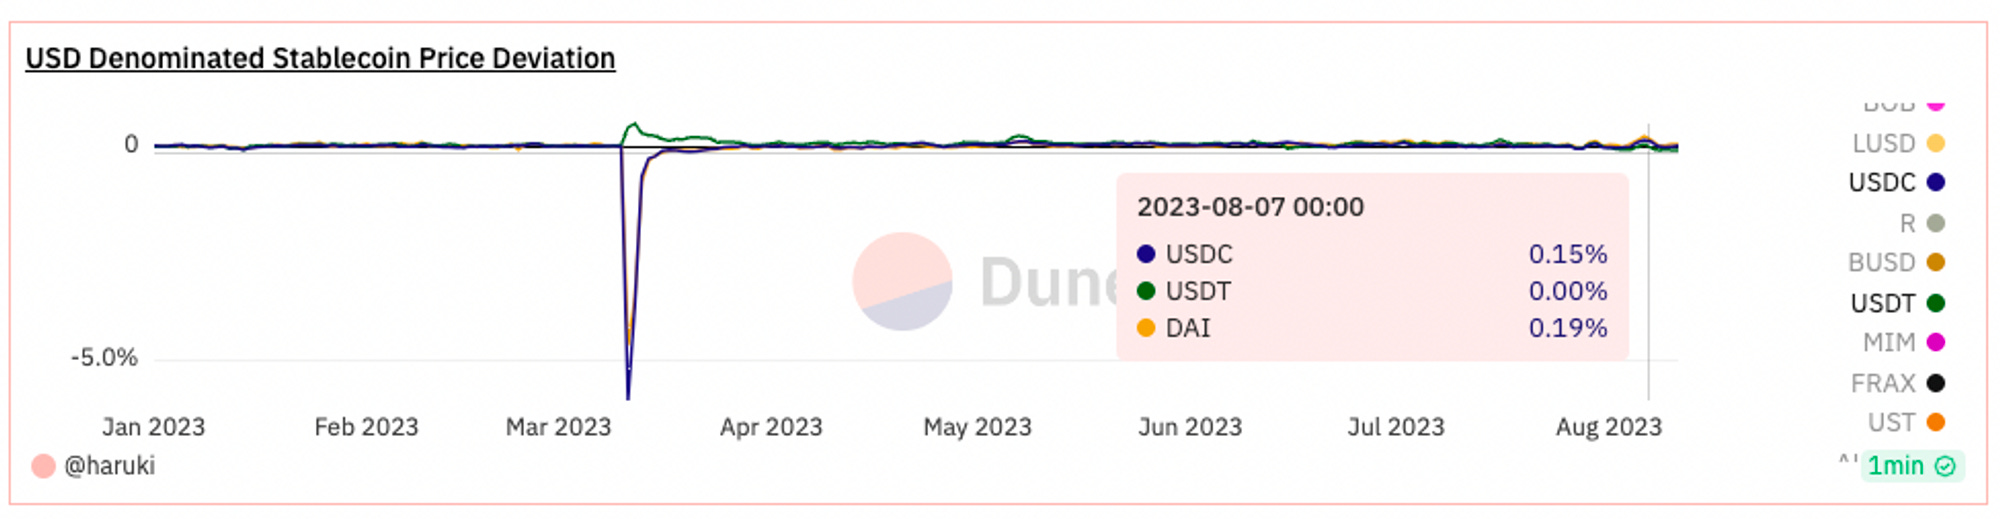
We can further analyze the historical price fluctuations of USDC, USDT, and DAI using the chart below. From the chart, we can see that a 0.2% price fluctuation difference is roughly the maximum fluctuation range under normal circumstances, which is consistent with Uniswap's set trading range, indicating that Uniswap has set a more reasonable trading range for stablecoin pairs. Maverick, on the other hand, by dividing Uniswap V3 LP ranges into 10 parts and following the market price of stablecoins, builds a higher trading depth than Uniswap, capturing more trading volume and providing users with higher APY.
In conclusion, Maverick has demonstrated significant advantages in capital efficiency and fees, which may be the important reason for its rapid rise in the market and capturing a portion of the stock from Uniswap and Curve.
Main Line 2: Aggregator Catalyzes Price Wars

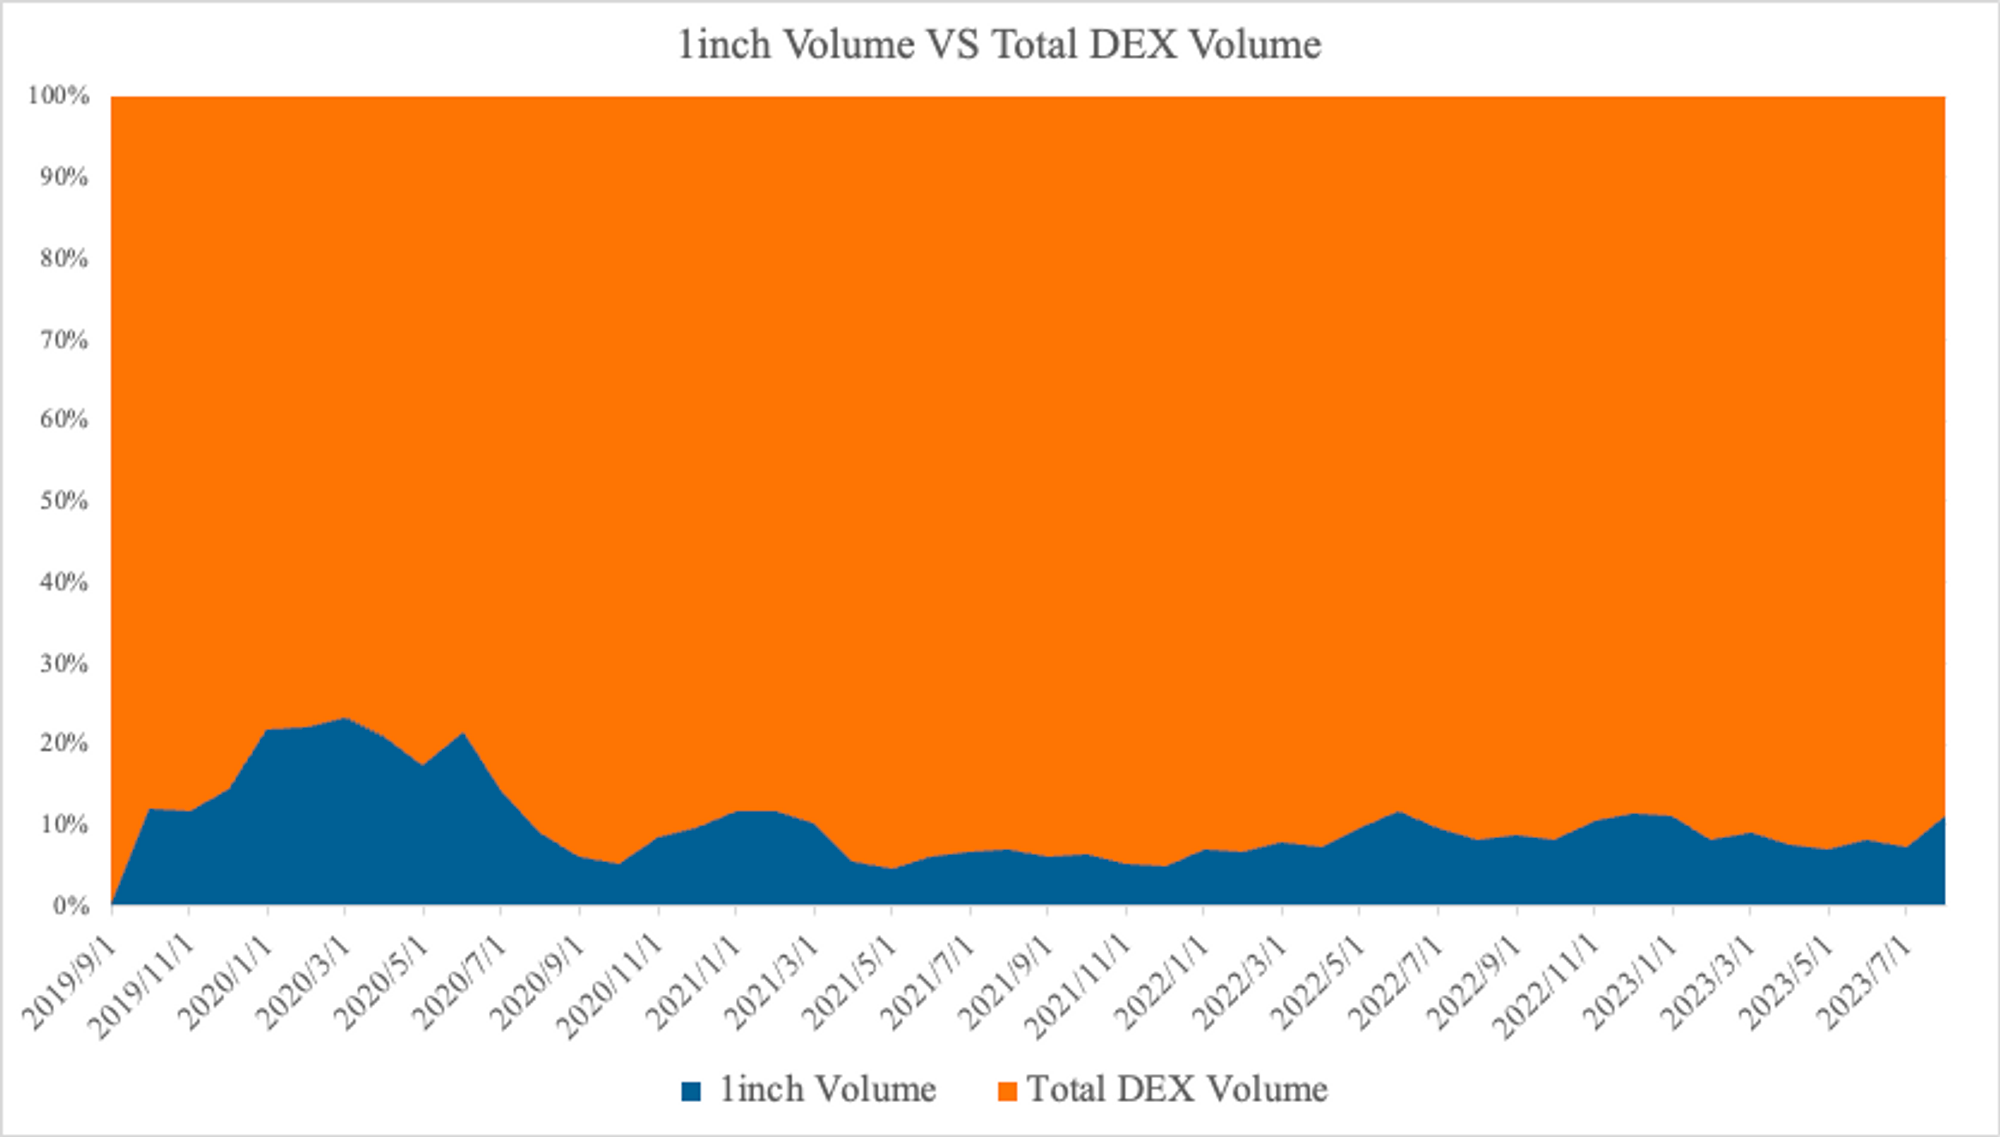
In the current aggregator race, the most leading player is undoubtedly 1inch. The following will cite several sets of data to demonstrate the importance of aggregators in DEX trading volume:
First, we can notice that in Uniswap's trading volume, over half (about 60%) comes from various types of MEV. Secondly, on the Ethereum mainnet, Uniswap accounts for approximately 50% of the overall DEX trading volume. Based on these two data points, we can infer that 20% of the overall DEX trading volume comes from Uniswap traders, 20% comes from other DEXs, and 60% comes from MEV bots.
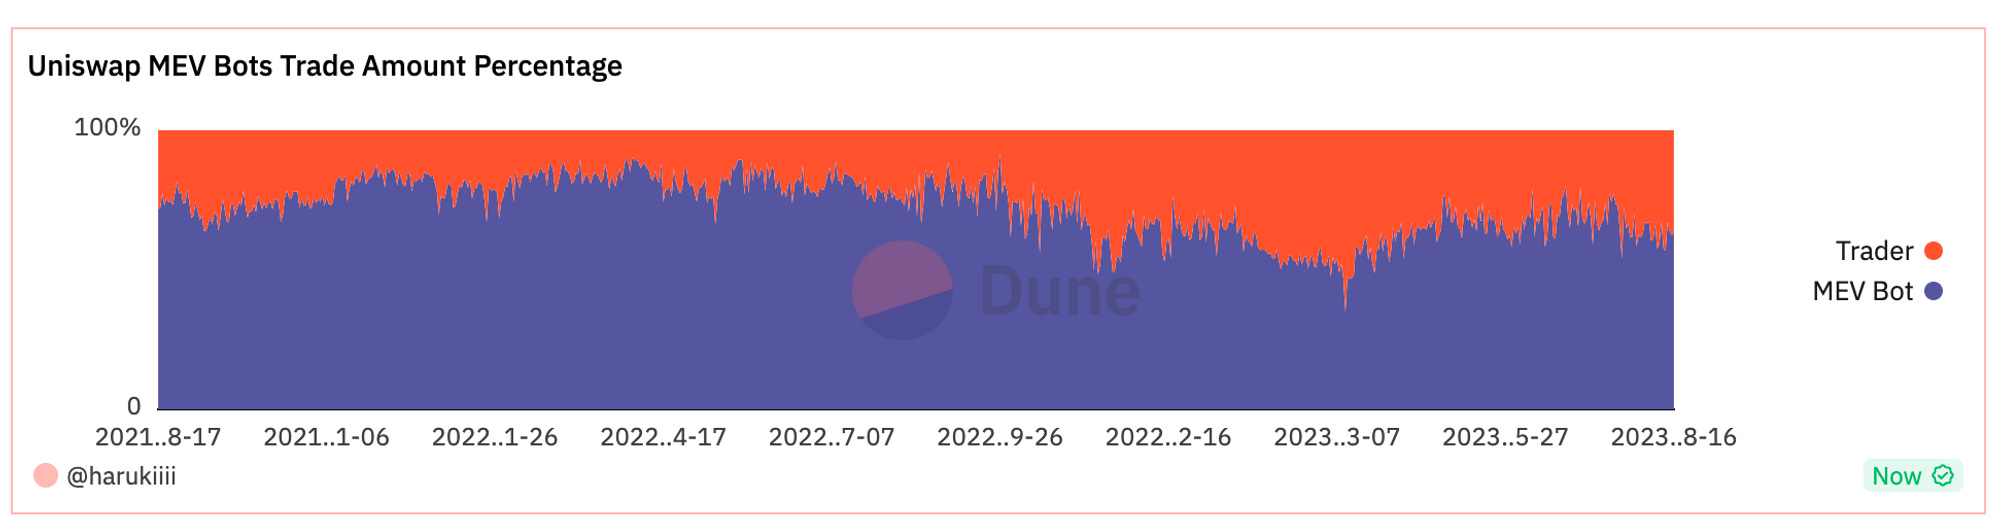
Currently, 1inch's trading volume accounts for approximately 10% of the overall DEX trading volume. Combining its roughly 50% aggregator market share, we can estimate that aggregators contribute to approximately 20% of the total DEX trading volume. Since MEV bots do not utilize aggregators for trading, we can consider that the trading volume of aggregators almost entirely comes from real traders. Therefore, it can be roughly estimated that 40%-50% of the real user trading volume in DEX comes from aggregators.
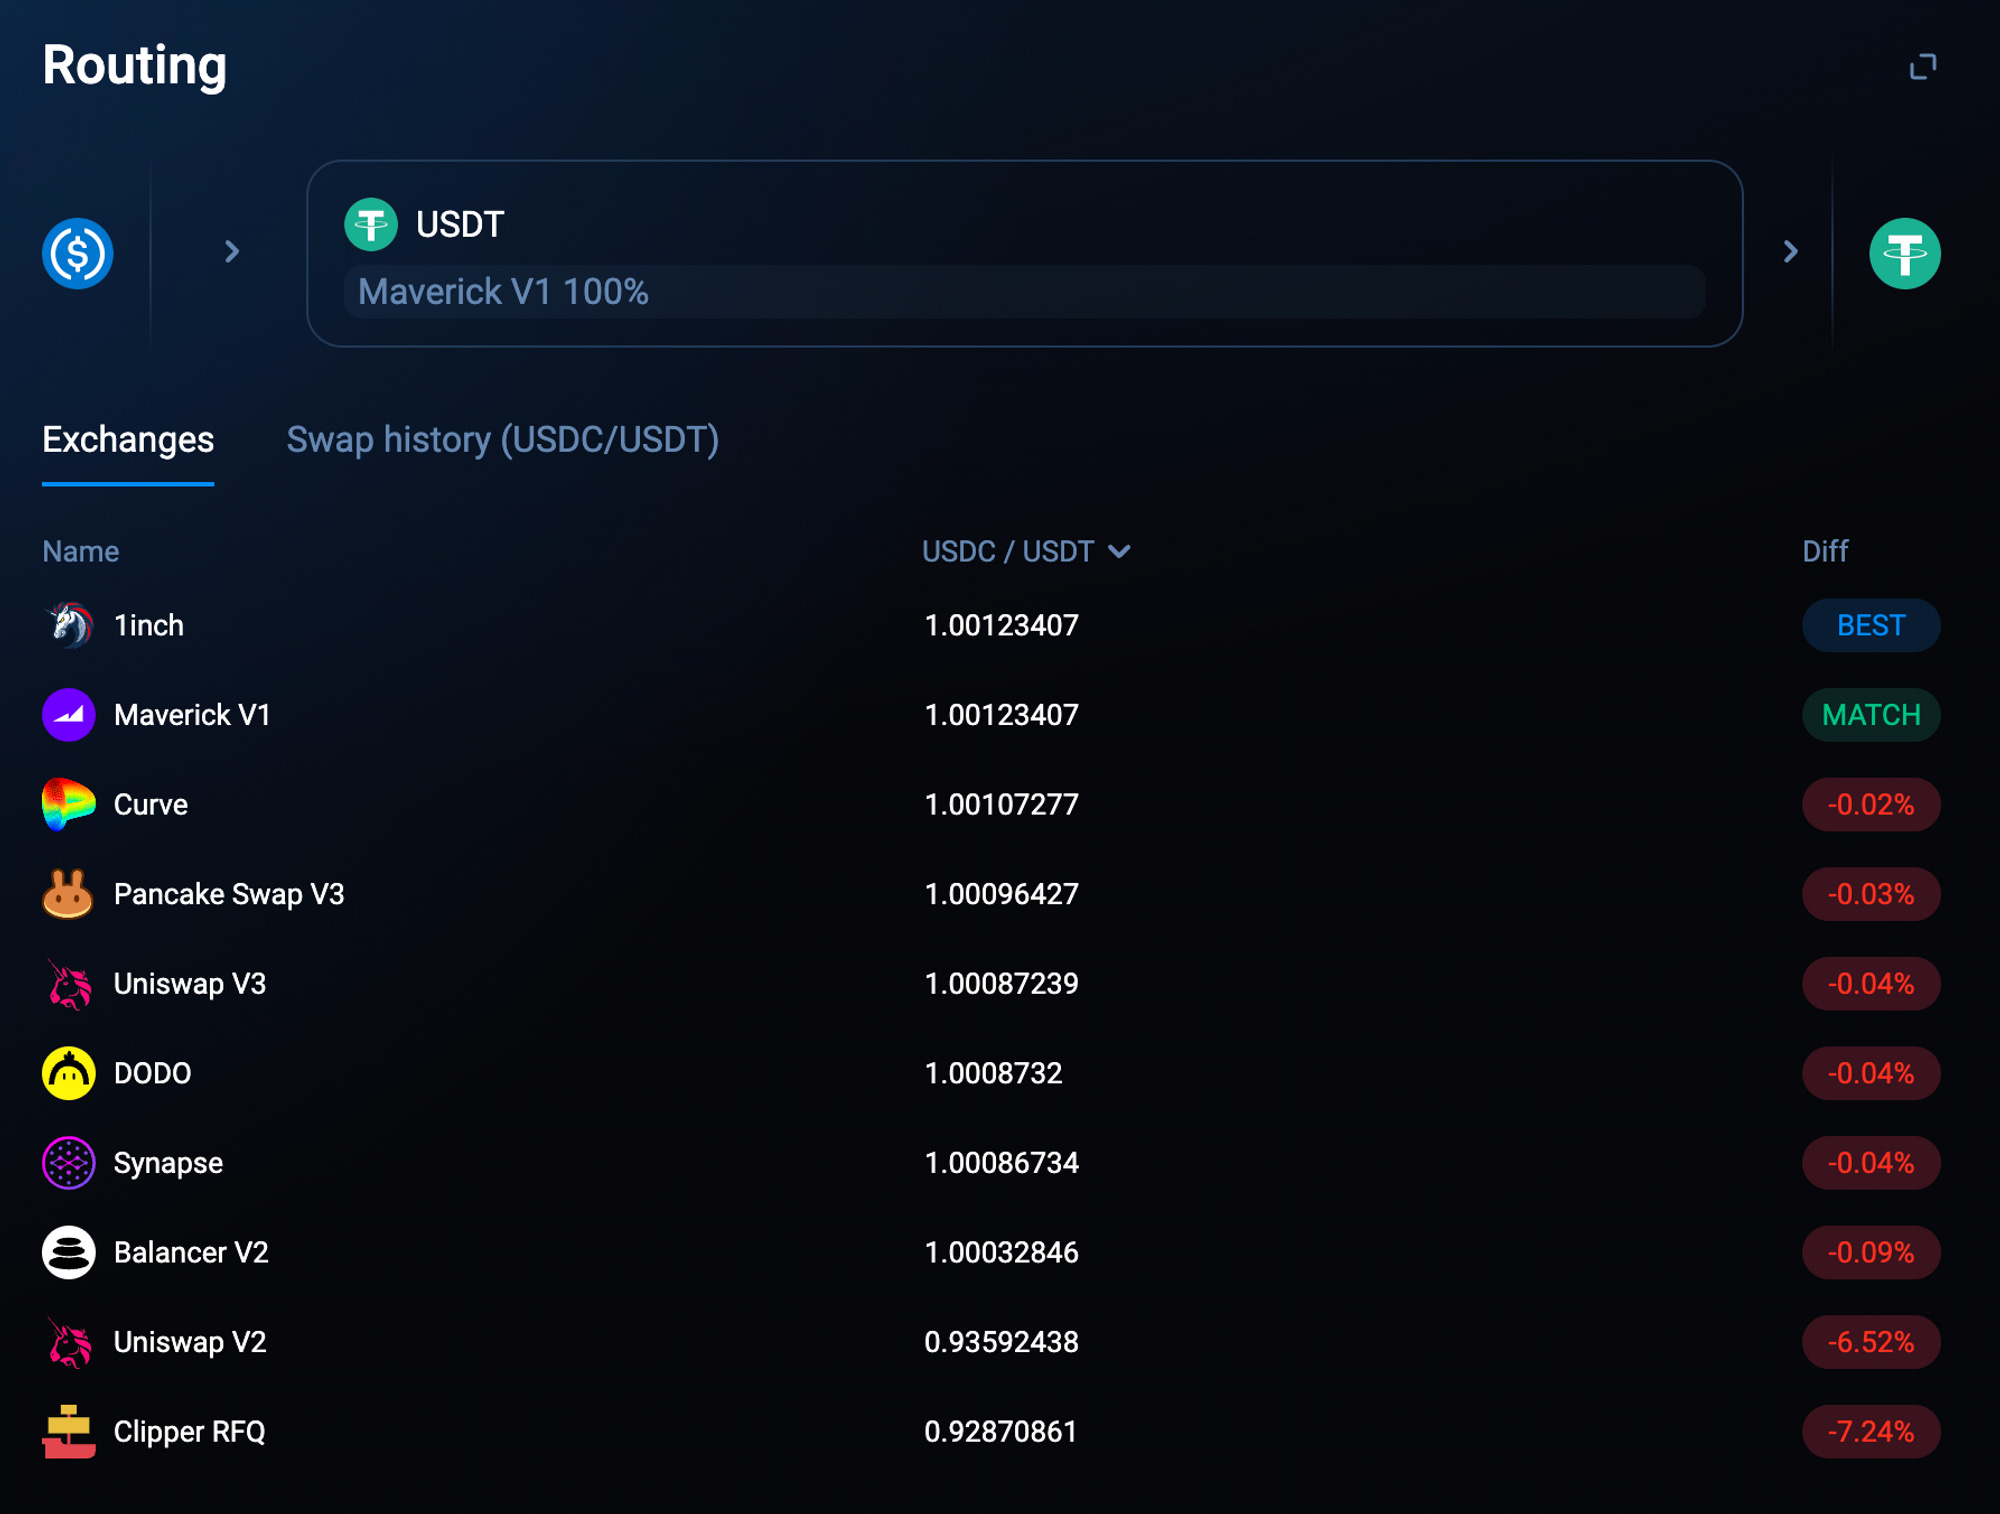
In the next section, we will simulate and analyze the depth and price advantages of major DEXs in handling different trading volume levels.
At the time of writing, Maverick has a more significant price advantage when handling trades of no more than 1M USD compared to other DEXs.
When the single trade amount increases to 4M USD, we notice that Curve and Maverick together occupy over 70% of the trading volume share. Clearly, Curve has a significant advantage in handling large trades due to its high Total Value Locked (TVL). Currently, Maverick's maximum trade processing capacity is approximately 1M USD, limited by its 3M USD TVL.
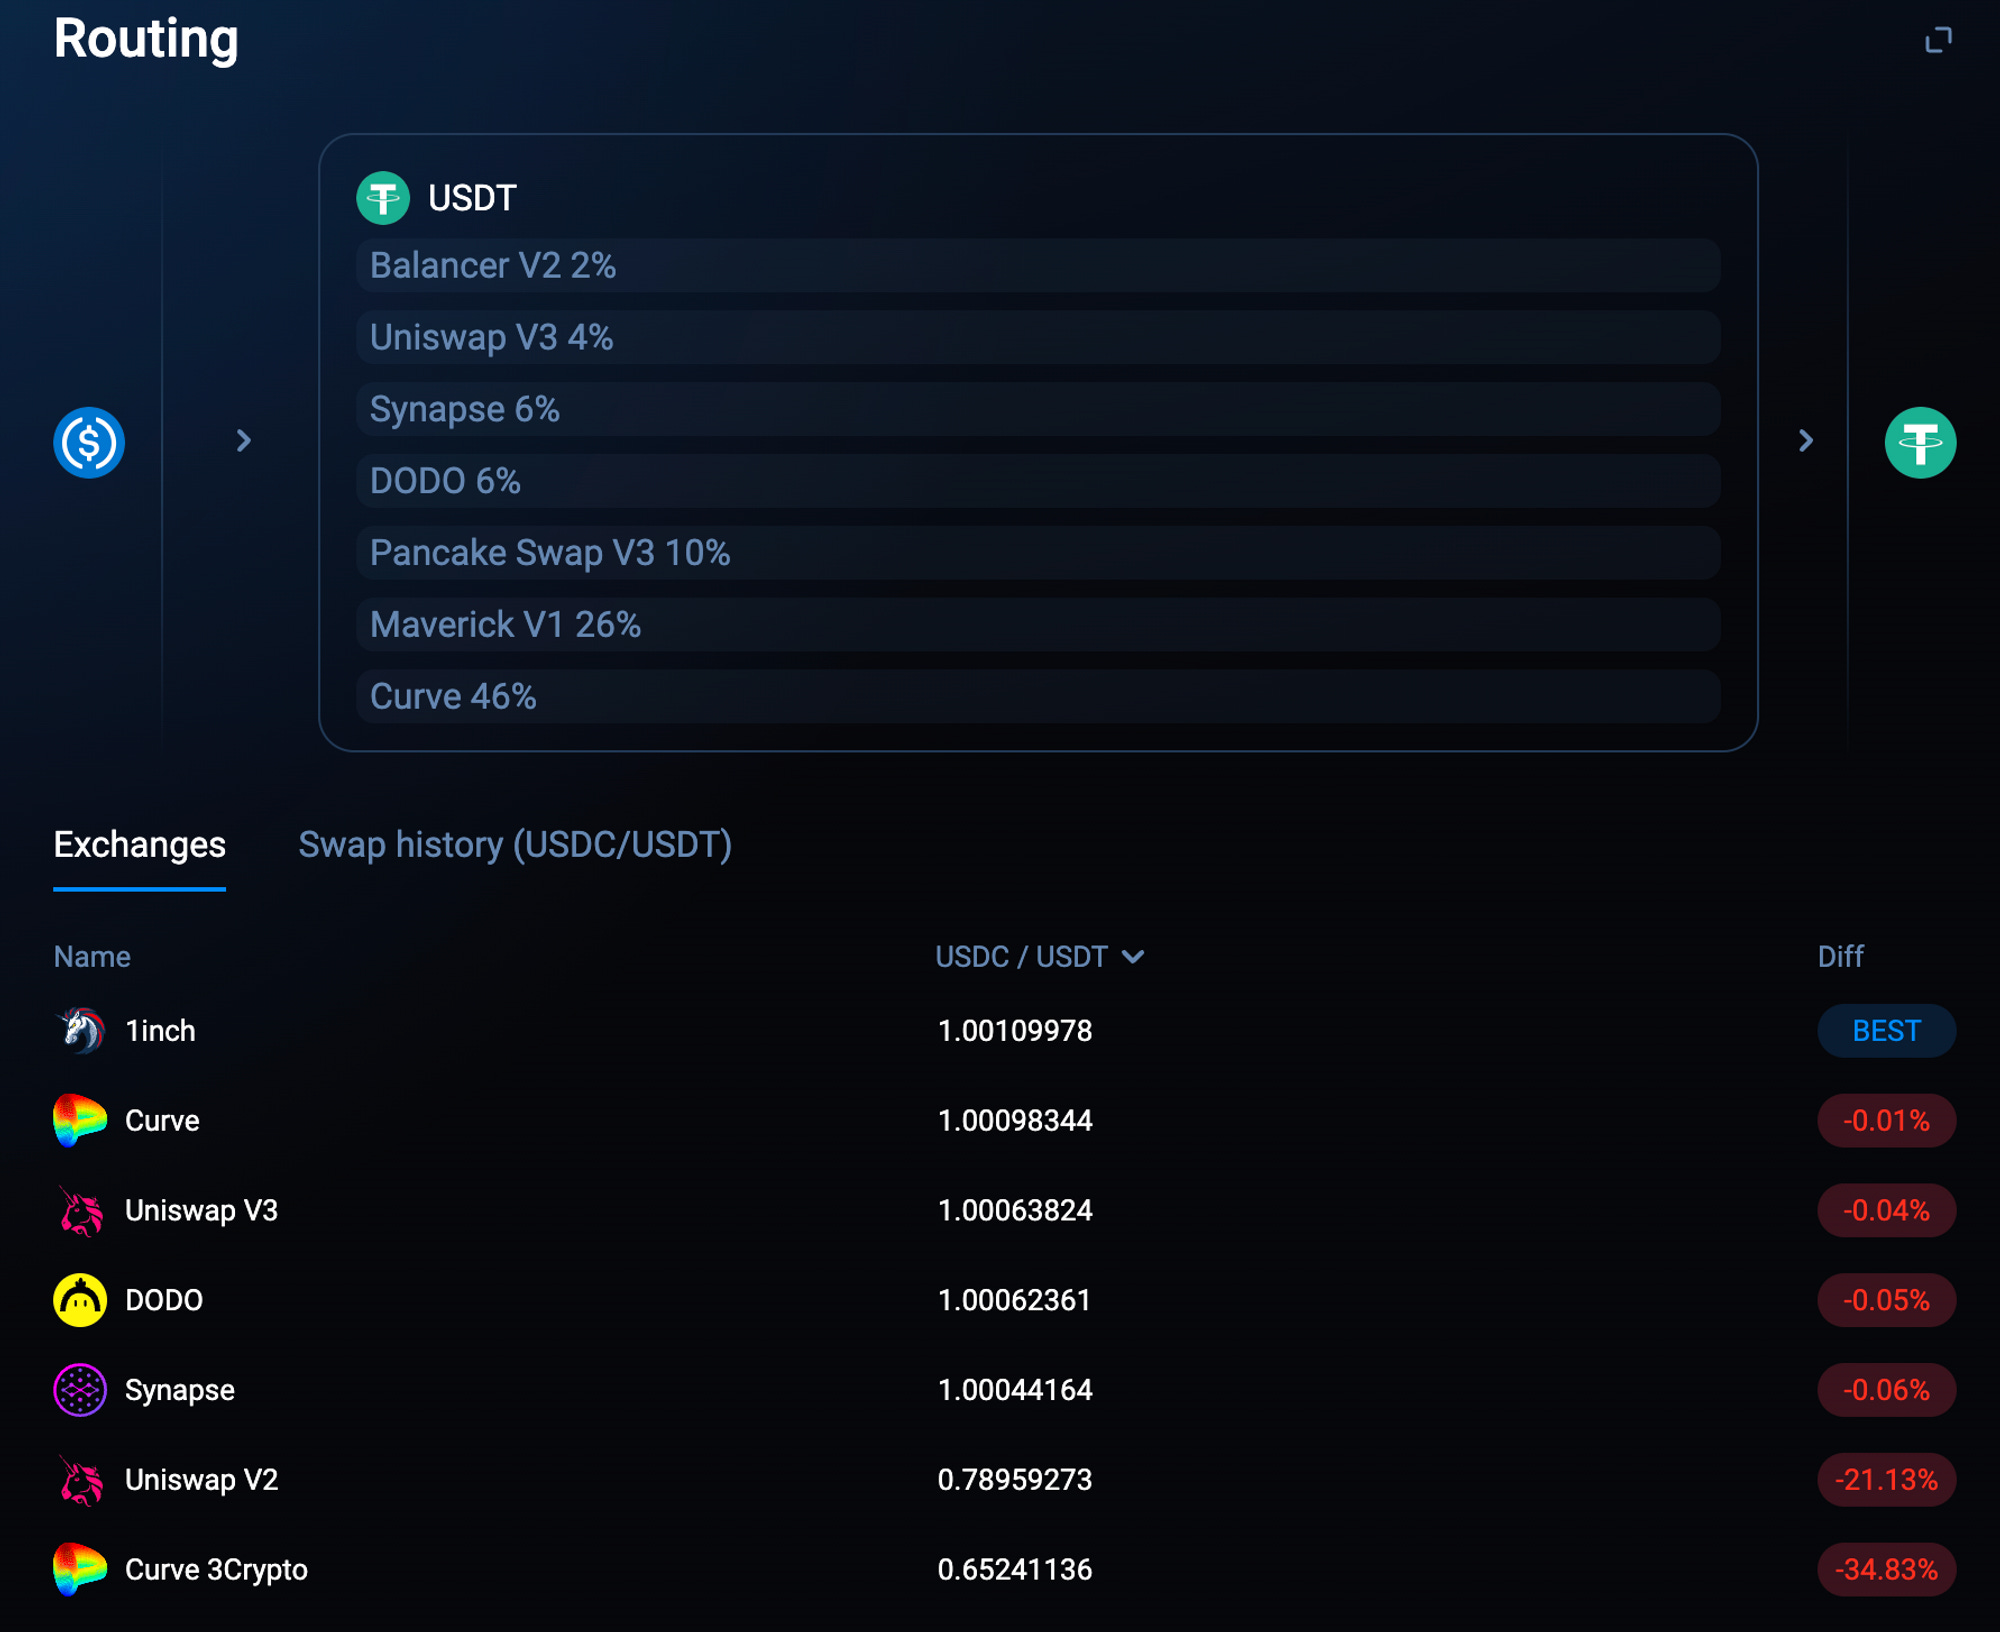
In conclusion, Uniswap and Curve's positions in stablecoin swaps remain solid. Their main advantages come from the ability to handle large trades provided by high TVL and the ability to counterbalance pool weight skew. Maverick, through high capital efficiency, provides the same depth as Uniswap and Curve in small and medium-sized stablecoin swap orders. However, due to its small TVL (3M stablecoin liquidity pool handling 59M USD in 24-hour trading volume), the pool is prone to extreme skew, requiring some reverse trades to correct the pool's skew in a biased market to continue capturing trading volume.
Overall, Uniswap and Curve's positions in the stablecoin swap market remain strong. Their main advantages come from the ability to handle large trades provided by high TVL and the ability to counterbalance pool weight skew. Although Maverick has a small TVL (3M stablecoin liquidity pool handling 66M USD in 24-hour trading volume), it can still provide the same depth as Uniswap and Curve in small and medium-sized stablecoin trades through high capital efficiency. However, Maverick's limited TVL can easily lead to extreme pool skew when handling large trades. In a biased market environment, it needs to rely on some reverse trades to correct the pool's skew to continue attracting trading volume.
Due to the presence of aggregators, DEXs of all sizes are brought to a level playing field to compete. DEXs within aggregators are not distinguished by size or brand, purely competing on trading depth and fees, with many DEXs not generating protocol income and distributing all fees to LPs. This competition is dominated by the AMM mechanism of DEXs and driven by users (traders). Over a longer period, the DEX that can consistently provide better depth and more competitive prices will capture more trading volume allocation from aggregators.
With the presence of aggregators, various DEXs are placed on a common starting line to compete. Within aggregators, the competition between DEXs mainly revolves around trading depth and fees, without considering the superiority of their respective brands. Many DEXs have forgone protocol income and distribute all fees to liquidity providers. This competition pattern, optimized by DEX mechanisms and dominated by user-side costs, means that in the long run, DEXs that can consistently provide better depth and prices will win more trading volume allocation from aggregators.
Uniswap X
Currently, the aggregator market has a heavyweight player—UniswapX. UniswapX is expected to further solidify Uniswap's leading position in the stablecoin exchange field.
1inch founder Anton Bukov mentioned in an interview that Uniswap has had a lot of "unfair" trading volume. This indicates that many people have not used aggregators to seek better prices but have directly traded through Uniswap's frontend.
Uniswap has also recognized its unique advantage and has launched Uniswap X as a powerful combination strategy with Uniswap V4. Uniswap X, as a product that integrates aggregators, cross-chain, and RFQ, has the following significance:
Attracting more frontend traffic through aggregation to provide users with a better trading experience and prepare for V4's Hook.
Cross-chain swaps can integrate liquidity in a multi-chain environment during the outbreak of L2 and liquidity contraction.
UniswapX's permissionless nature can prevent malicious behavior by relayers.
RFQ helps bridge the liquidity gap between CEX and DEX, bringing some of CEX's liquidity into DEX.
For stablecoin trading, even when operating through 1inch, there is still a significant difference in trading depth between DEX and Binance. UniswapX is expected to further narrow this difference, and with the widespread deployment of Uniswap X, Uniswap's market share in the stablecoin trading field is expected to increase further.
Potential Increment in the Future: LST and Interest-bearing Stablecoins
After the Shanghai upgrade, LSD is attempting to become the benchmark interest rate for DeFi. With Maker's EDSR climbing to 5%, various stablecoins have also been caught in an interest-bearing battle.
For stablecoin projects, there are two main ways to generate income from their stablecoins:
Protocols with large scale and certain capital accumulation will attempt RWA solutions, with DAI and FRAX being typical examples of this route.
New protocols tend to lean towards LSD integration, such as Lybra's eUSD and Gravita's GRAI.
These two methods are not mutually exclusive, but there are significant differences in implementation difficulty. The following analysis will focus on exploring from the perspectives of project parties and LPs: how will DEXs allocate this incremental volume under the rapid development of interest-bearing assets?
From the perspective of stablecoin or LST projects: first Uniswap/Maverick, then Curve.
Similar to the previous FRAX and UST, if emerging stablecoins or LSTs focus on credit building, they will be motivated to establish liquidity pools on Curve. Conversely, if stablecoins or LSTs prioritize smooth trading and higher capital efficiency, project parties are more inclined to build liquidity pools on Uniswap or Maverick.
Therefore, we can infer that in the early stages of stablecoin or LST competition, due to the relatively small scale of everyone, they will be more inclined to first meet users' trading needs on Uniswap V3 and Maverick, and then compete while ensuring smooth trading. As the competition enters the middle and later stages, when the leaders in the race gradually establish themselves, project parties will have the incentive to pay additional costs to go to Curve to build stronger credit.
From the perspective of stablecoin/LST LPs: first Maverick, then Uniswap/Curve.
Clearly, users holding stETH are more sensitive to interest rates than those holding ETH. We can refer to stETH data to provide a simple profile of interest-bearing asset users.
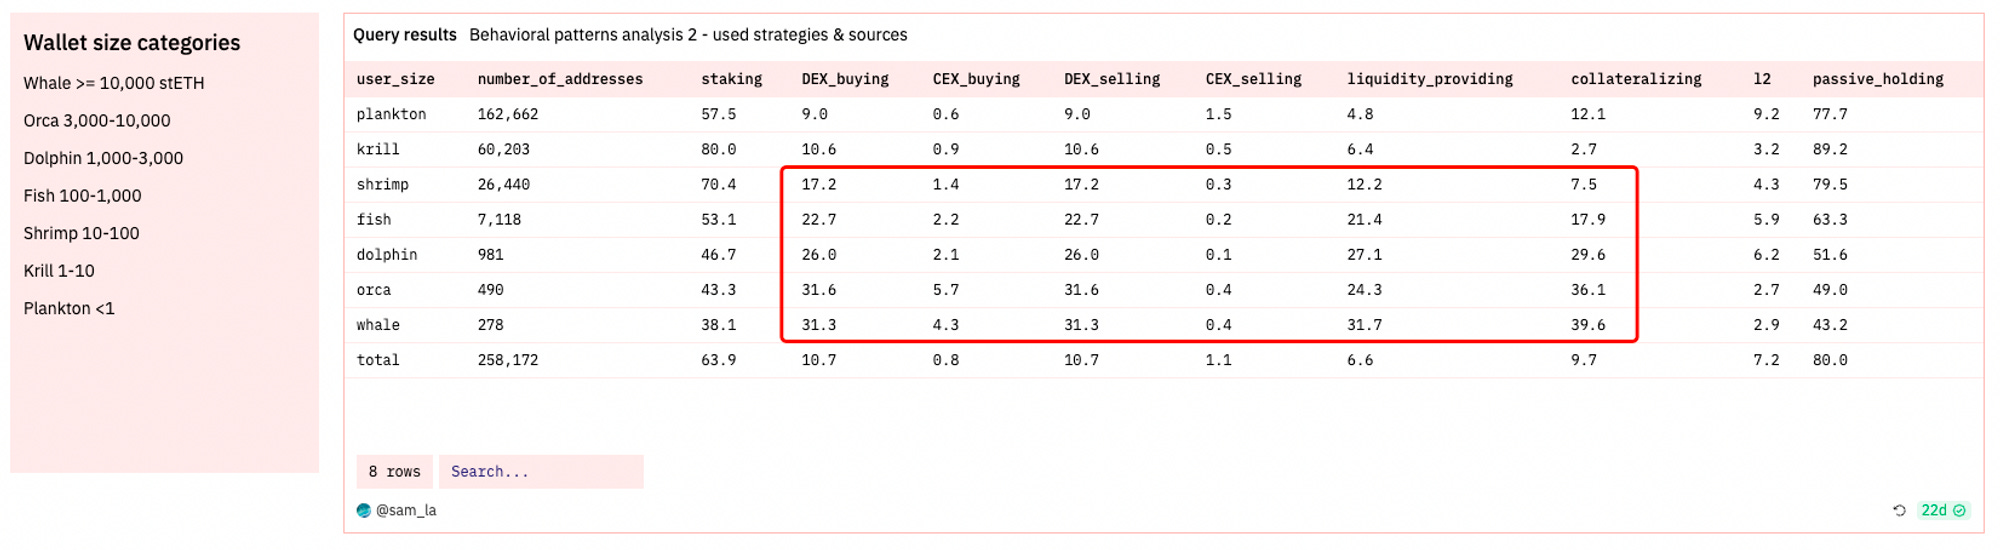
As shown in the above image, we can observe that users with more stETH are more inclined to trade stETH frequently and seek some derivative protocols related to stETH. In contrast, users holding less than 10 stETH seem less sensitive to additional interest rates.
This finding allows us to predict the market structure of interest-bearing stablecoins as follows: the interest-bearing stablecoin market is mainly dominated by large holders highly sensitive to interest rates. In other words, unlike traditional stablecoins and algorithmic stablecoins, interest-bearing stablecoins are primarily driven by LP income.
In the interest-bearing stablecoin sector, as there are currently no interest-bearing stablecoins with sufficient volume for analysis, we compare the 24-hour APY of USDC-USDT on Uniswap, Curve, and Maverick on August 15th (Curve takes 3pool).

It can be observed that the current APY of Uniswap and Curve is very similar and significantly lower than Maverick. Essentially, Maverick's LP position is equivalent to a Uni V3 LP that automatically adjusts based on the current price, with each bin interval being 0.02%, approximately one-tenth of Uniswap V3. Under Maverick's automated LP management, the APY of small interval LPs will obviously be higher than that of large interval LPs.
It is also worth noting that Maverick's capital efficiency can be seen as a cost advantage. This is very attractive to some early-stage interest-bearing stablecoin projects because they require less USDC to build liquidity pools on Maverick compared to Uniswap or Curve.
As for LST, currently only stETH shows growth in adoption among overall DeFi protocols, while others remain stable.
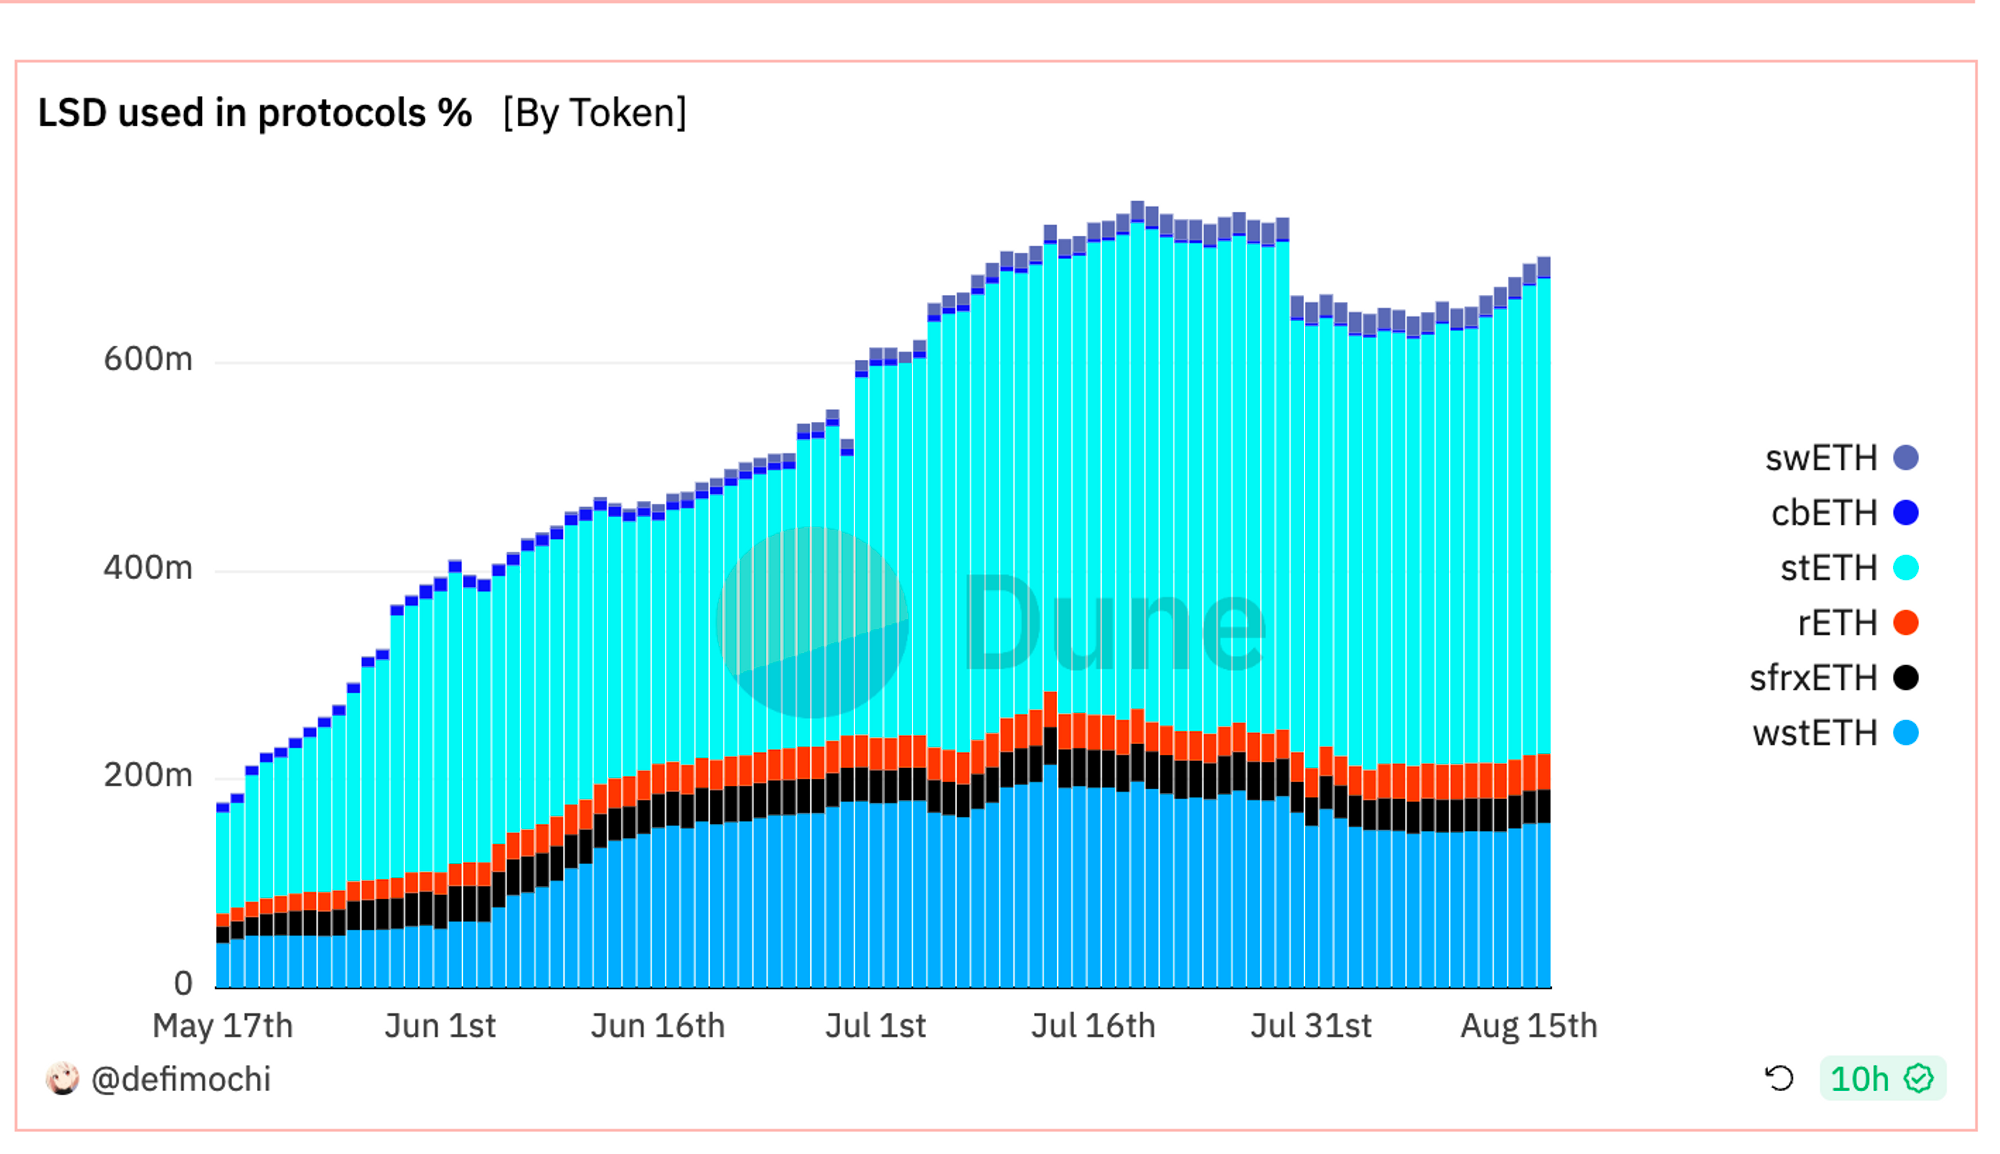
stETH is a Rebase Token, and due to its uniqueness, it is not supported by DEXs such as Uniswap V3, Maverick, and Balancer. Therefore, the primary trading venue for stETH is the liquidity pool specially designed by Curve, which is also Curve's biggest advantage in the LST field. However, after the Shanghai upgrade, stETH-ETH trading can also be done through Lido for short-term exits, weakening Curve's core competitive barriers. Additionally, due to the cessation of Lido's incentives and Curve's low capital efficiency, as shown in the image below, Curve's stETH supply has been decreasing since the Shanghai upgrade in April 2023.
As for other LSTs, such as wstETH and rETH, their staking income is reflected in the increase in exchange rate compared to ETH. In this type of LST trading sector, Curve does not have a clear advantage. The primary trading venue for wstETH is concentrated on Maverick and Uniswap, where LPs provide liquidity by setting a very narrow liquidity interval to achieve excess returns. While these LSTs have some characteristics of stablecoins, their prices are not stable but continue to rise at a relatively fixed rate.
For these types of LSTs, there will be significant differences in management costs between Uniswap V3 LP and Maverick LP. As shown in the image below, the wstETH interval of V3 is only 0.03%, and based on Lido's 4.5% staking APR, users need to adjust the liquidity interval at most every 3 days. The liquidity entry and exit of V3 require a gas fee of 30 USD each time, and to offset this gas fee, users need to have approximately 45K USD in capital, and to generate additional returns, the capital should be at least 150K USD. This threshold is unaffordable for most users on-chain. Through its automatic following function, Maverick checks the relationship between price and interval during each swap to move the bin, effectively reducing user management costs and gas fees, while providing an APR equivalent to Uniswap, lowering the participation threshold to the minimum.
In summary: How to define a good DEX?
DEX is undoubtedly the cornerstone of the DeFi ecosystem. Without DEX, all DeFi protocols would be impossible to discuss.
How to define an excellent DEX? Different roles on the blockchain have different focuses, and the answers given will also be different.
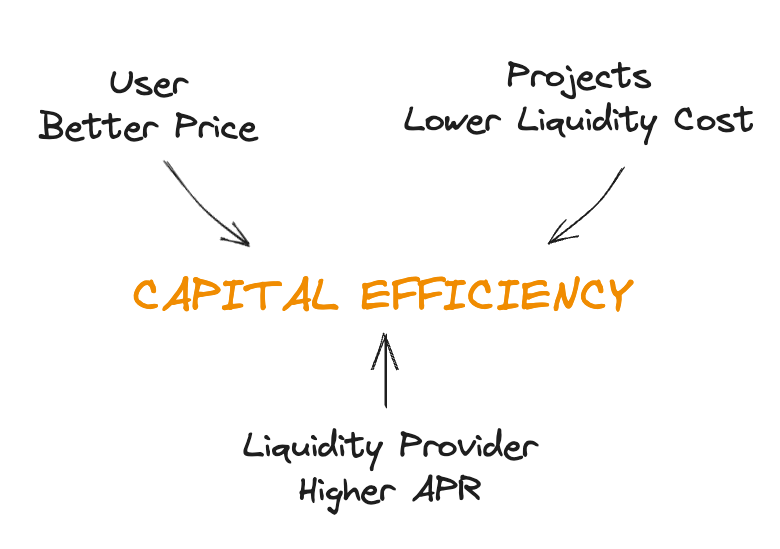
Users (traders) expect better trading depth (reduced slippage) and lower gas fees.
This requires a DEX to have higher TVL or more advanced mechanisms to ensure depth, as well as deeper contract code optimization to reduce gas fees.
Project parties seek better trading depth, lower liquidity costs (creating greater depth with less capital), and stronger storefront effects.
This requires a DEX to have more advanced AMM mechanisms to reduce costs, as well as excellent brand building and frontend display.
Liquidity providers (LPs) hope to achieve higher APR while reducing impermanent loss.
This requires a DEX's unit TVL to capture as much trading volume as possible or to provide higher incentives to LPs to hedge against impermanent loss.
We can see that there is a common long-term solution for traders' demand for depth, project parties' demand for liquidity costs, and LPs' demand for APR, which is to improve the capital efficiency of DEX.
Looking back at the two main threads, we see that in the stock market, catalyzed by aggregators, capital efficiency has become the core of DEX innovation. Whether it's CoWSwap, 1inch, or UniswapX's RFQ solution, or Maverick's following liquidity, they are valuable attempts. As these innovations continue to deepen and improve, future DEXs will undoubtedly become more efficient, flexible, and transparent, laying a solid foundation for innovation, development, and prosperity across the chain.
免责声明:本文章仅代表作者个人观点,不代表本平台的立场和观点。本文章仅供信息分享,不构成对任何人的任何投资建议。用户与作者之间的任何争议,与本平台无关。如网页中刊载的文章或图片涉及侵权,请提供相关的权利证明和身份证明发送邮件到support@aicoin.com,本平台相关工作人员将会进行核查。


