Author: Checkmate, Glassnode
Translation: Annie, Daling Think Tank
It is well known that Bitcoin is a highly volatile asset. However, the current volatility of the Bitcoin market is being extremely compressed. Is this because Bitcoin has lost its high volatility, or is the market incorrectly priced?
Abstract
- It is well known that the price of Bitcoin has always been extremely volatile, but the current range of Bitcoin volatility in the market is being extremely compressed, with fewer trading days with a smaller price range than in history, accounting for less than 5%.
- The performance of the futures market is mediocre, with both BTC and ETH trading volumes hitting historical lows, and the basis for futures-arbitrage yield is 5.3%, slightly higher than the risk-free interest rate.
- The implied volatility in the current options market has dropped significantly, reaching historical lows, even less than half of the 2021-2022 baseline.
- The put/call ratio and the 25% Delta skew indicator are at historical lows, indicating a significant increase in demand for call options in the options market, and the pricing of put options indicates very low future volatility.
Sideways Signal
The current spot price of BTC is above several widely used long-term moving average lines (111D, 200D, 365D, and 200W). These averages range from a low of $23,300 (200DMA) to a high of $28,500 (111DMA). The chart below also shows periods similar to the current situation in the past two cycles, which often correspond to macro upward trends.
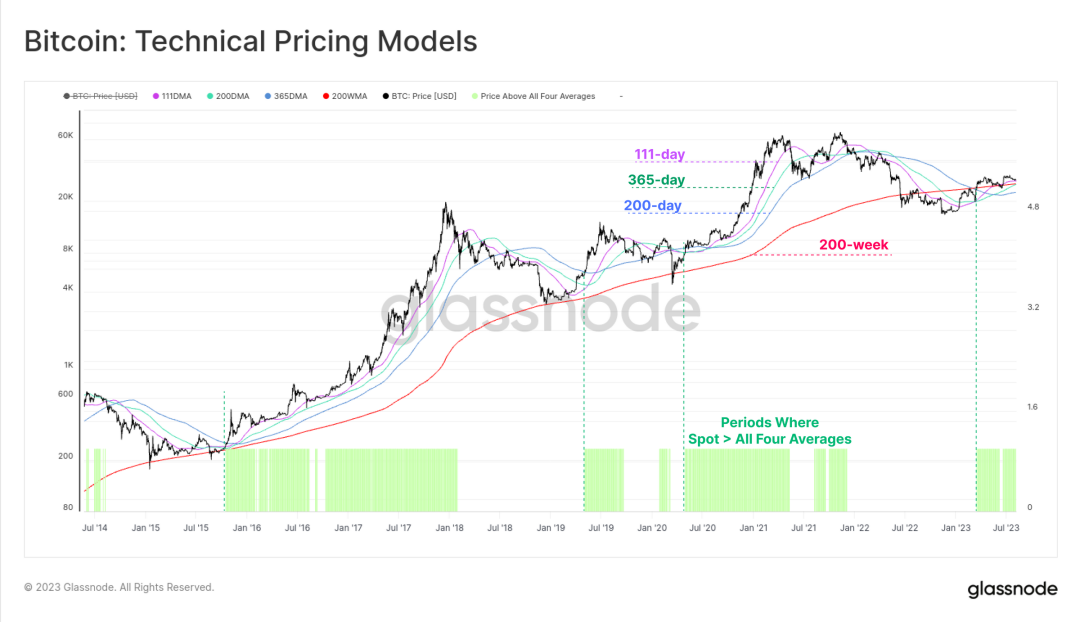
Figure 1: Long-term moving average price model
The realized price model is also the same, and we can build the model based on the basic costs of three different groups:
- Yellow: overall market (realized price).
- Red: short-term holders (holding tokens for no more than 155 days).
- Blue: long-term holders (holding tokens for more than 155 days).
The spot price is also higher than the realized price of these three groups, consistent with the situation of being higher than the long-term moving average price mentioned above.
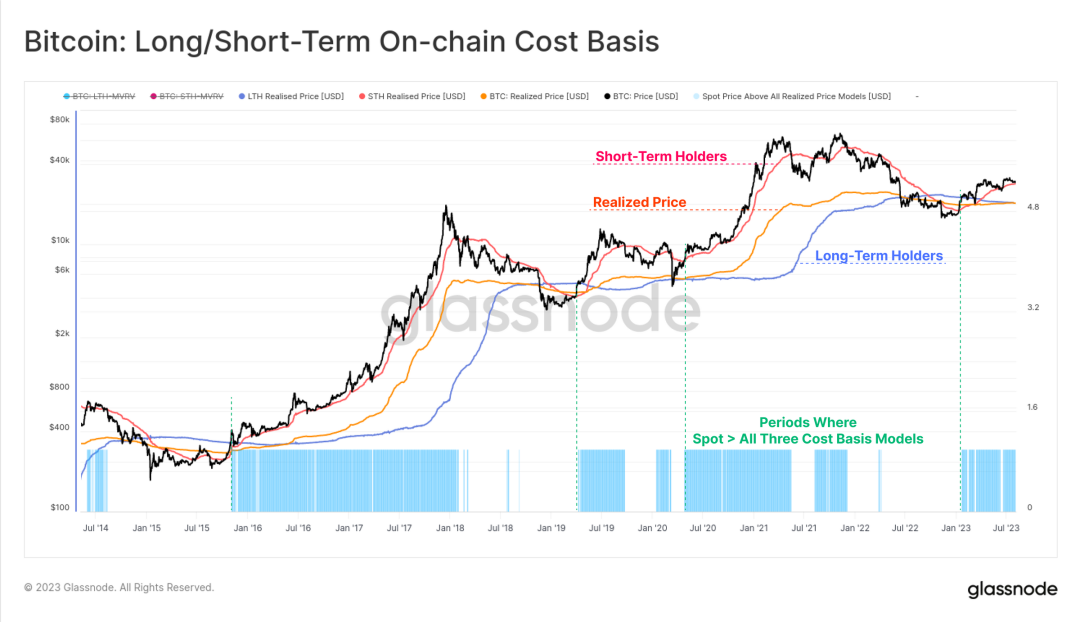
Figure 2: Long-term/short-term holder on-chain basic cost
Since the peak of the bull market in April 2021, about 842 days have passed. The market recovery in 2023 is slightly better than the previous two cycles, only 54% lower than the peak of the bull market, while the historical average is 64%.
We also noticed that in the 2015-2016 and 2019-2020 cycles, before the market accelerated beyond the 54% retracement level, there were 6 months of consolidation, which may indicate a possible sideways period in the future.
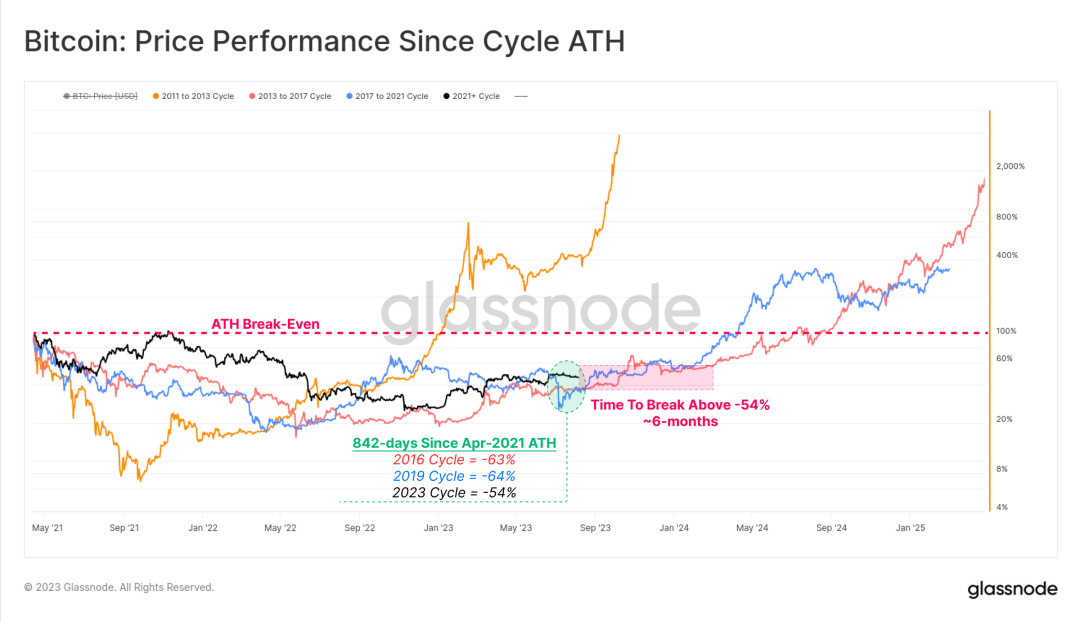
Figure 3: Price performance since the peak of the bull market
After the market heat dissipated earlier this year, Bitcoin's quarterly and monthly price performance has cooled down. This phase has many similarities with previous cycles. In previous cycles, the initial bottom rebounds were very strong, but then there would be a long period of consolidation.
This period is usually referred to by analysts as the re-accumulation period.
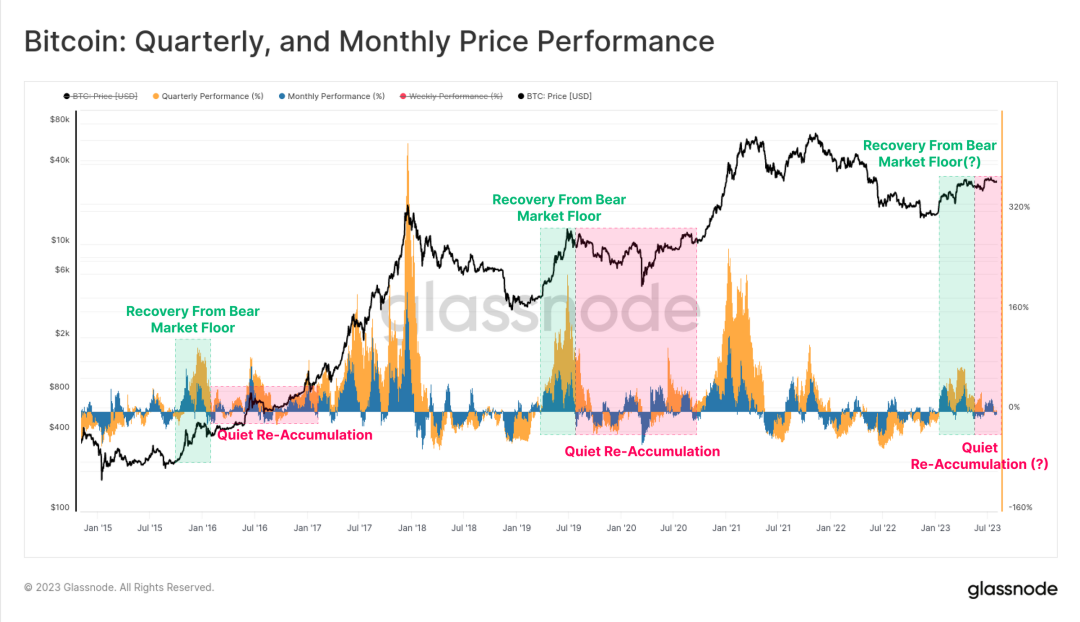
Figure 4: Quarterly and monthly price performance
Significant Narrowing of Bitcoin Volatility
The actual volatility of Bitcoin's 1-month, 3-month, 6-month, and 1-year windows has significantly decreased in 2023, reaching multi-year lows, with the 1-year window volatility being the highest. This is also the lowest level of 1-year window volatility since December 2016. This is the fourth such period of extreme volatility compression:
At the end of 2015 and the beginning of 2016, the market went through a re-accumulation phase; At the end of 2018, after a significant sell-off in November, the market entered a bear market. Then came the rebound in April 2019, with Bitcoin's price rising from $4,000 to $14,000 within three months; After March 2020, the market entered a period of consolidation; At the end of 2022, the market gradually digested the collapse of FTX.
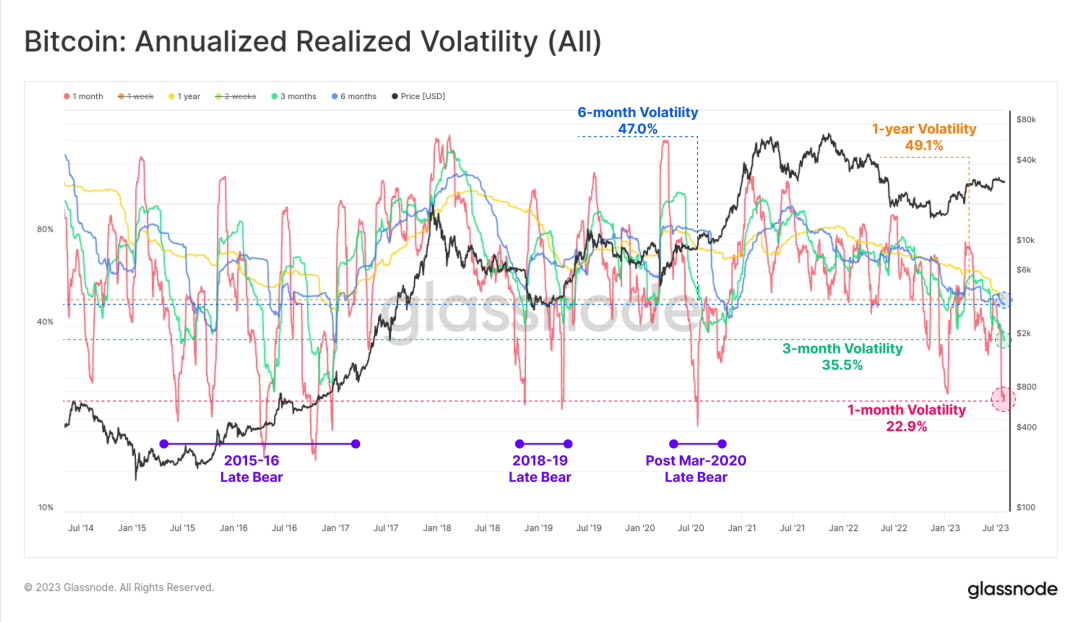
Figure 5: Annual realized volatility
Last week, the high and low points of the price range within 7 days were only 3.6% apart. Historically, only 4.8% of trading days have been lower than this value.
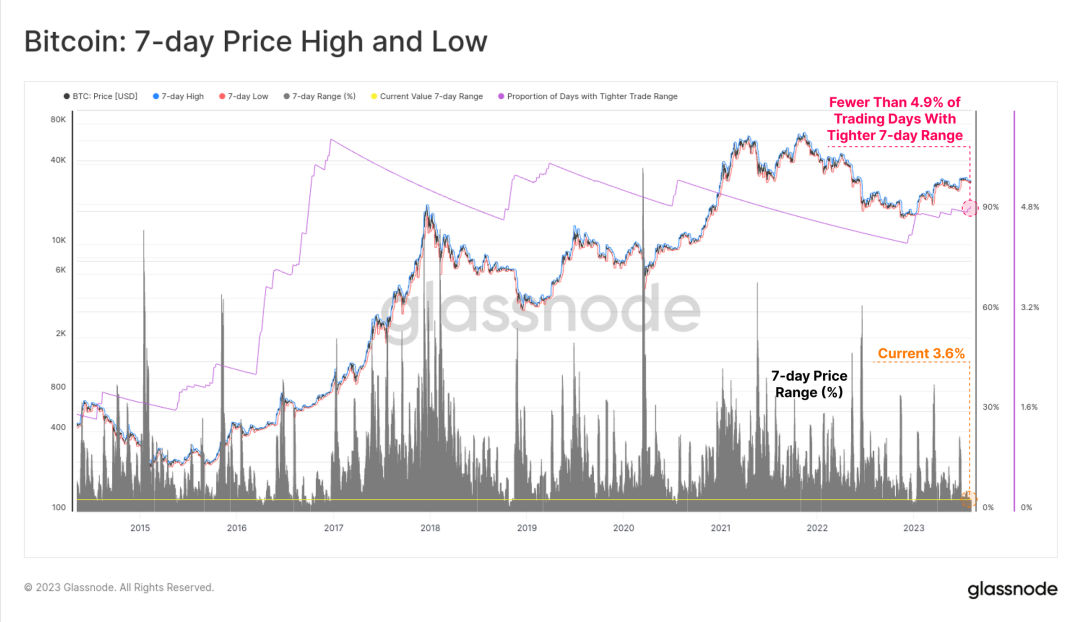
Figure 6: 7-day high and low points
The 30-day price range is also narrow, with the high and low points of Bitcoin's price last month differing by only 9.8%, and historically only 2.8% of monthly price ranges have been narrower than 9.8%. For Bitcoin, this level of sideways and low volatility is extremely rare.
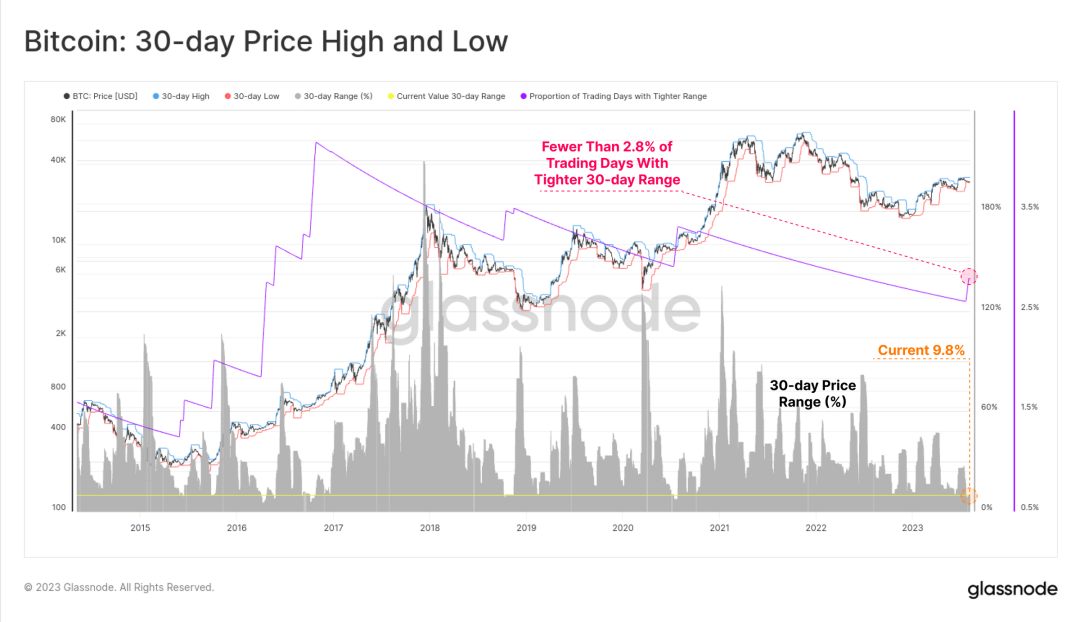
Figure 7: 30-day high and low points
Derivatives Market Equally Calm
This quiet state is also evident in the derivatives market for BTC and ETH. The total trading volume of futures and options for Ethereum and Bitcoin is at or near historical lows.
The total trading volume of derivatives in the current BTC market is $19 billion per day, while the total trading volume of derivatives in the ETH market is only $9.2 billion per day, reaching a new low since January 2023.
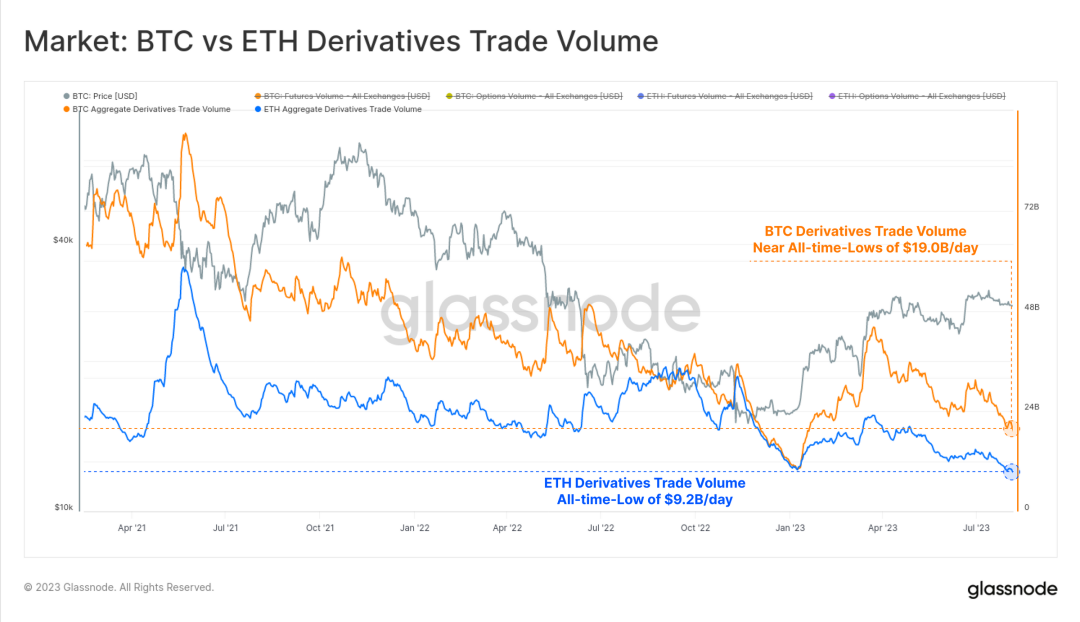
Figure 8: BTC vs ETH derivatives trading volume
Recently, investors have also been relatively risk-averse. In the futures market, the proportion of Bitcoin has been slowly increasing.
During 2021-2022, the trading volume and open interest of Ethereum futures market steadily increased, reaching a peak of 60 BTC: 40 ETH in the second half of 2022.
However, in 2023, the situation changed, and Bitcoin gradually gained the upper hand. Reduced market liquidity and decreased risk appetite have driven the risk curve higher.
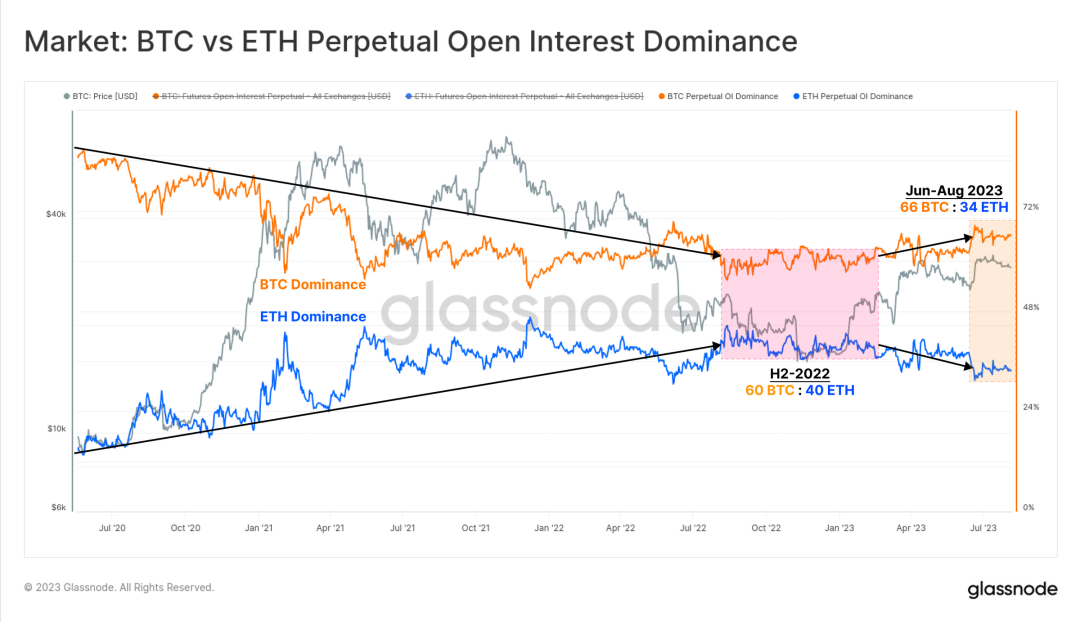
Figure 9: BTC vs ETH perpetual futures contract open interest ratio
Last month, the open interest in the futures market for Bitcoin and Ethereum was relatively flat at $12.1 billion. This is similar to the situation in the second half of 2022, when the price of Bitcoin was about 30% lower than it is now, and FTX did not collapse. It is also similar to the period of the price increase in January 2021, when the price of Bitcoin rose by 30% and the market was not yet mature.
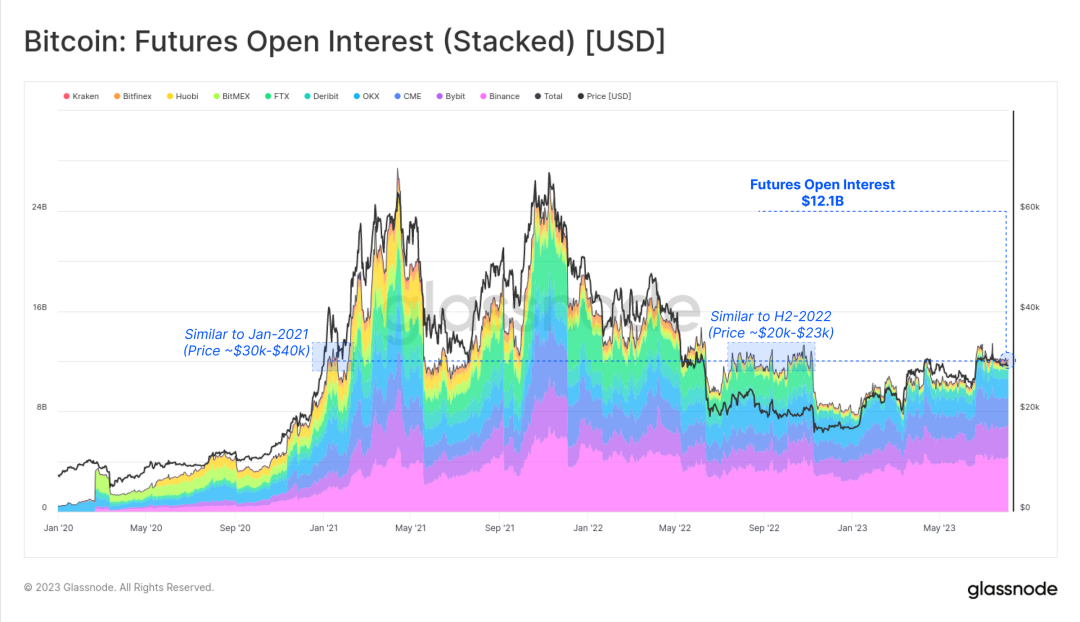
Figure 10: Open interest of futures contracts (pledge)
In contrast, the dominance of the options market has significantly increased, with open interest contracts more than doubling in the past 12 months. In terms of the scale of open interest, the options market is now comparable to the futures market.
On the other hand, since the end of 2022 (FTX collapse), the open interest in the futures market has been steadily declining, with only a slight increase in 2023.
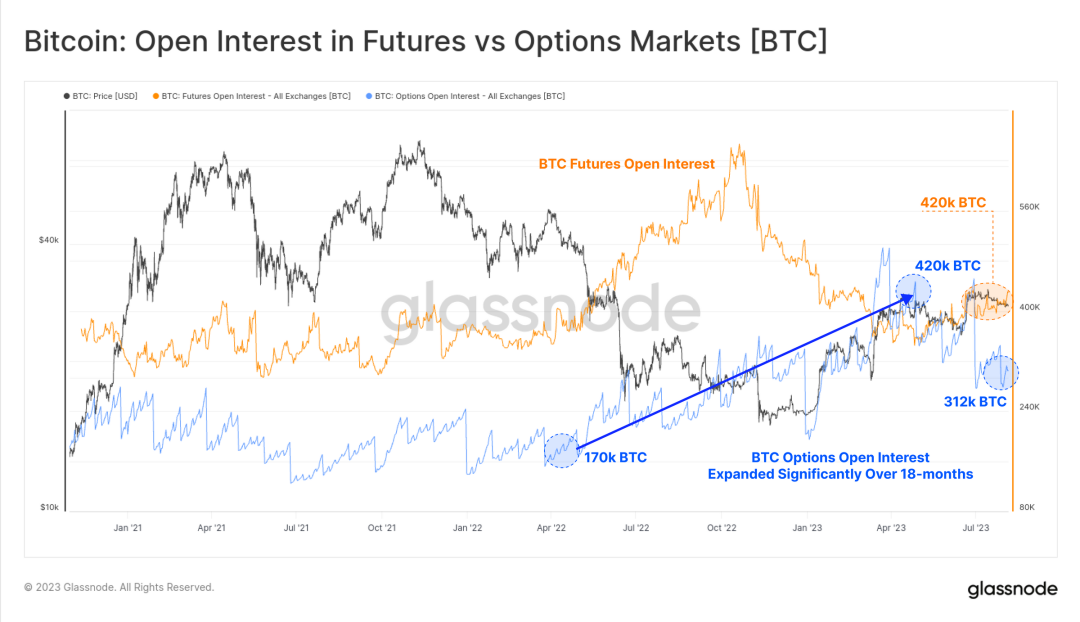
Figure 11: Open interest of futures market and options market
Strong Bullish Trend in the Futures Market
Due to the low trading volume in the futures market and the relatively low market activity, investors are focusing on identifying opportunities to reinvigorate the digital asset derivatives market.
In the futures market, the term structure (zero-coupon bond yield curve) indicates an annualized yield of 5.8% to 6.6% through futures-arbitrage (exploiting price differences between the futures market and the spot market to buy low and sell high). However, this is only a slight increase compared to the yield of short-term US Treasury bonds or money market funds.
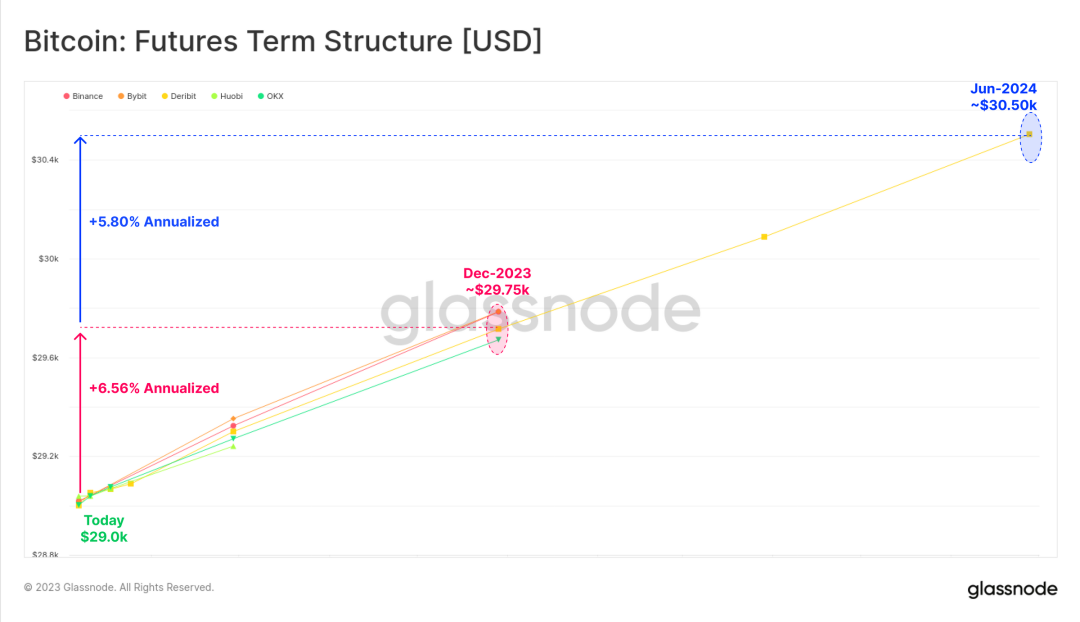
Figure 12: Futures term structure
The perpetual swap market is the most liquid trading market for crypto asset derivatives, where traders and market makers can lock in financing rates to arbitrage between futures and spot prices. The volatility of this futures-arbitrage is greater, with the current annualized yield at 8.13%, making it very attractive to investors.
In addition, since January, the financing rate has been steadily increasing, indicating a significant change in market sentiment since the end of 2022.
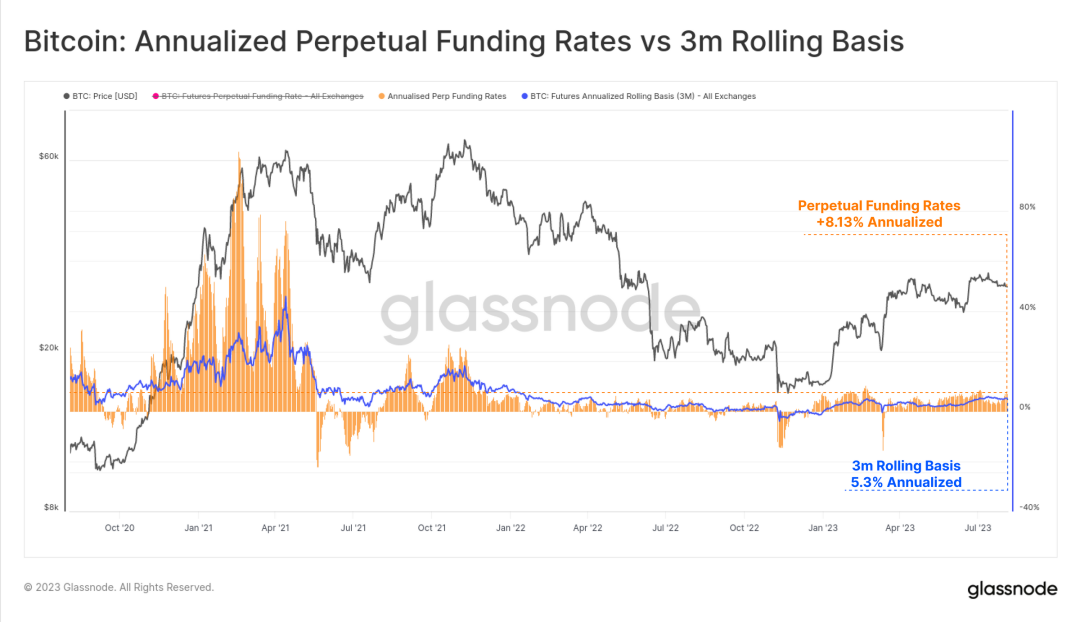
Figure 13: Annualized rate of perpetual fund vs 3-month rolling rate
Continuing to look at the options market, the current market volatility has been compressed to historically low levels, with implied volatility for all contract expiration dates reaching historical lows.
The volatility of the Bitcoin market is very high, with the implied volatility of options trading fluctuating between 60% and 100% in 2021-2022. However, currently, the volatility premium in the options market has reached a historical low, with implied volatility ranging from 24% to 52%, less than half of the long-term baseline.
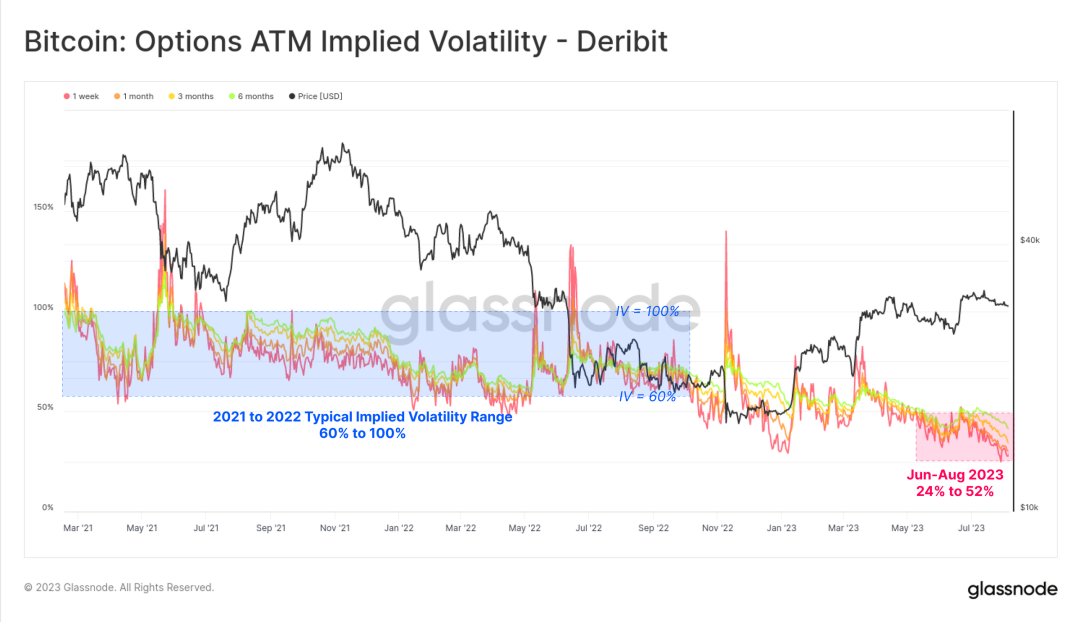
Figure 14: Current implied volatility of options
From the term structure of implied volatility below, it can be seen that in the past two weeks, the volatility premium has rapidly contracted. The implied volatility of options contracts expiring in December 2023 has decreased from 46% to 39%. The volatility premium for options contracts expiring in June 2024 is slightly above 50%, at a historical low.
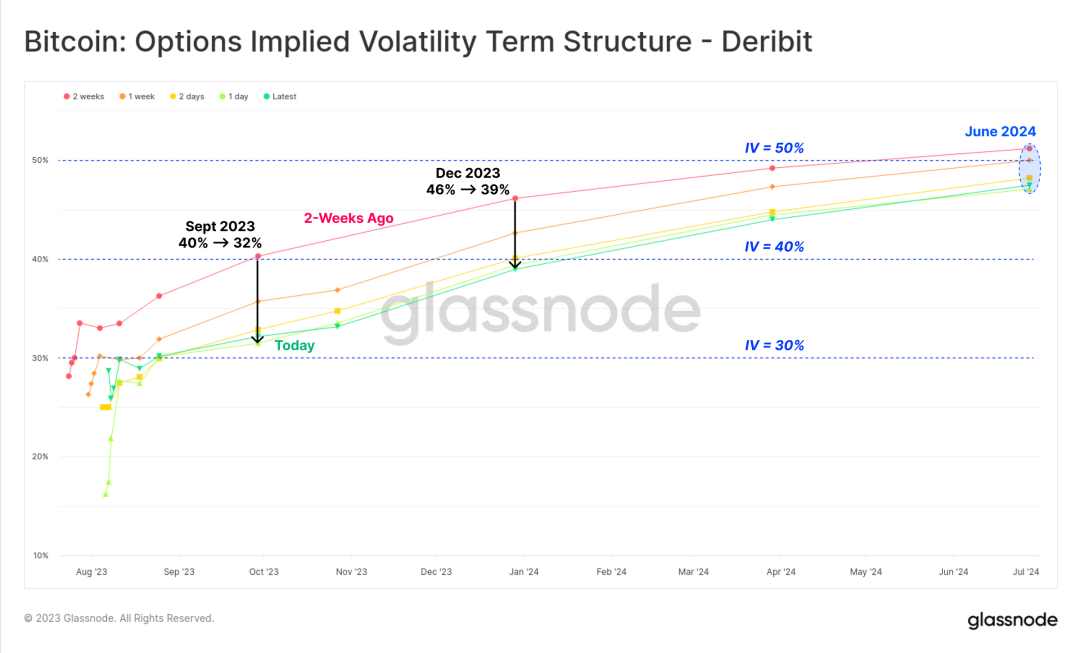
Figure 15: Term structure of implied volatility for options
The trading volume and open interest ratio of put/call options are at or near historical lows, at 0.42 and 0.48, respectively. This indicates that the market is mainly bullish, and the demand for call options still dominates.
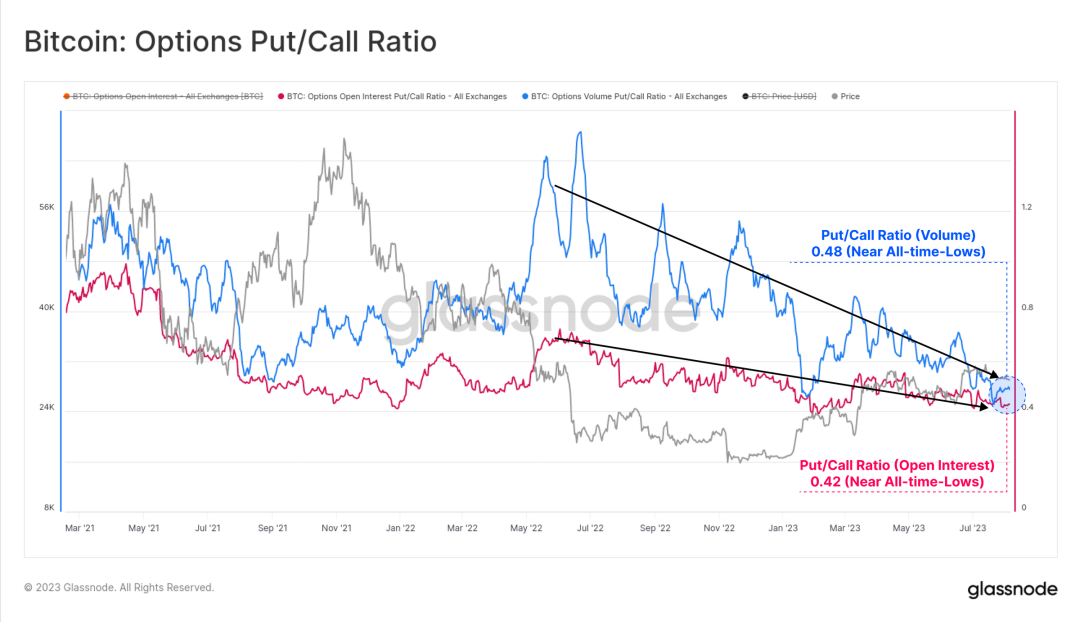
Figure 16: Put/call options ratio
Therefore, compared to call options, put options are becoming cheaper, with the 25% Delta Skew (calculated as the difference between the implied volatility of 25% Delta put options and the implied volatility of 25% Delta call options) reaching a historical low. Overall, this indicates that the options market and the futures market are of comparable size, and the implied volatility in the options market is at a historical low.
However, since historically less than 5% of trading days have had a price range for Bitcoin narrower than the current one, the question arises: has Bitcoin already shaken off the inherent impression of high volatility? Or is the result of Bitcoin being incorrectly priced?
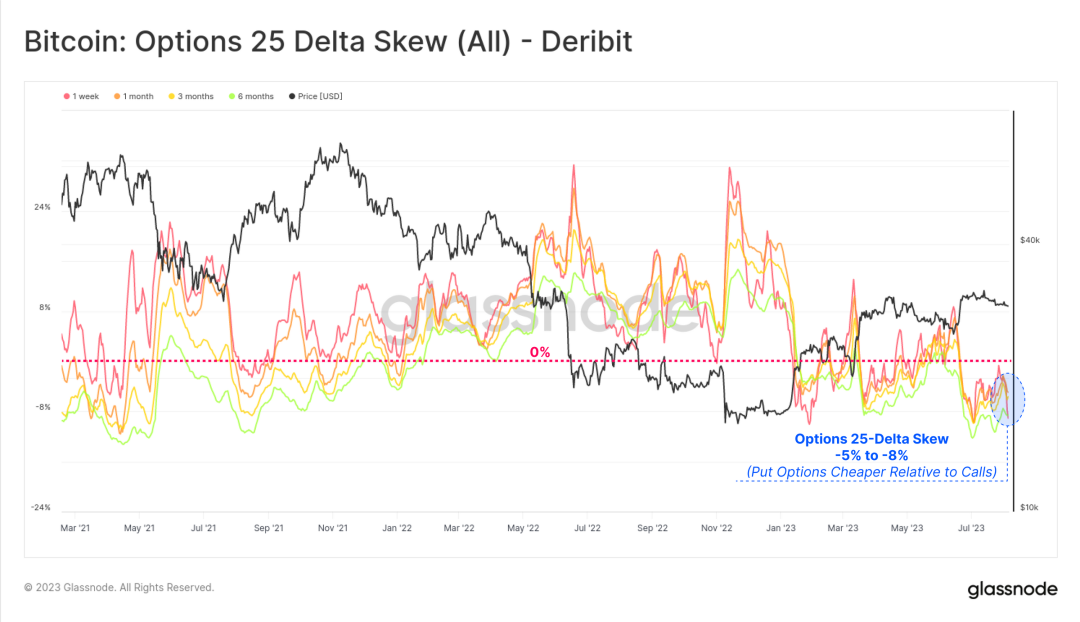
Figure 17: 25% Delta Skew indicator for options
Summary
We rarely hear anyone say that Bitcoin is a stable asset in terms of price. Everyone considers Bitcoin to be a highly volatile asset, so the phenomenon of Bitcoin's price fluctuating by no more than 10% per month is particularly surprising. It can be said that this is the period of lowest volatility in Bitcoin's history.
The futures-arbitrage yield ranges from 5.3% to 8.1%, slightly higher than the risk-free rate of short-term US Treasury bonds. The volatility premium in the options market is at a historical low, and the demand for put options is very weak.
免责声明:本文章仅代表作者个人观点,不代表本平台的立场和观点。本文章仅供信息分享,不构成对任何人的任何投资建议。用户与作者之间的任何争议,与本平台无关。如网页中刊载的文章或图片涉及侵权,请提供相关的权利证明和身份证明发送邮件到support@aicoin.com,本平台相关工作人员将会进行核查。


