
Author: Zhao Ying, Wall Street Journal
The current "atmosphere" in US stocks is "perfect," but historical records are not optimistic.
The chief technical market strategist at BTIG issued a warning in a recent report, the market is entering the most dangerous seasonal window of the year—with an exceptionally high position and extremely low volatility—from August to October of an election year. He bluntly stated that now is a highly attractive opportunity for investors to actively reduce risk exposure or hedge broad stock positions.
The equal-weighted S&P 500 index (SPW) has accumulated an increase of about 16% this year, with all sectors recording positive returns, achieving "breadth expansion" in the market. However, historical data show that since 1990, the S&P index has experienced at least a 7% pullback between August 18 and October 11 during election years, except in 2006. The current market enters at historical highs, the VIX is at a year-low, protective demand is nearly absent, and multiple technical signals are simultaneously raising alarms.
Seasonal Pattern: The "Curse Window" of Election Years
BTIG's data indicates that since 1990, the SPW has typically peaked around August 18 in election years, followed by a difficult downward phase until mid-October.
In 1990, 1998, 2002, 2010, 2014, 2018, and 2022, there was a pullback of at least 7% during August to October. In 1994, the decline was 5%, but it further expanded to 8% by December. The only exception was 2006, but that year had already recorded a 9% decline from May to July, essentially just shifting the adjustment period forward.
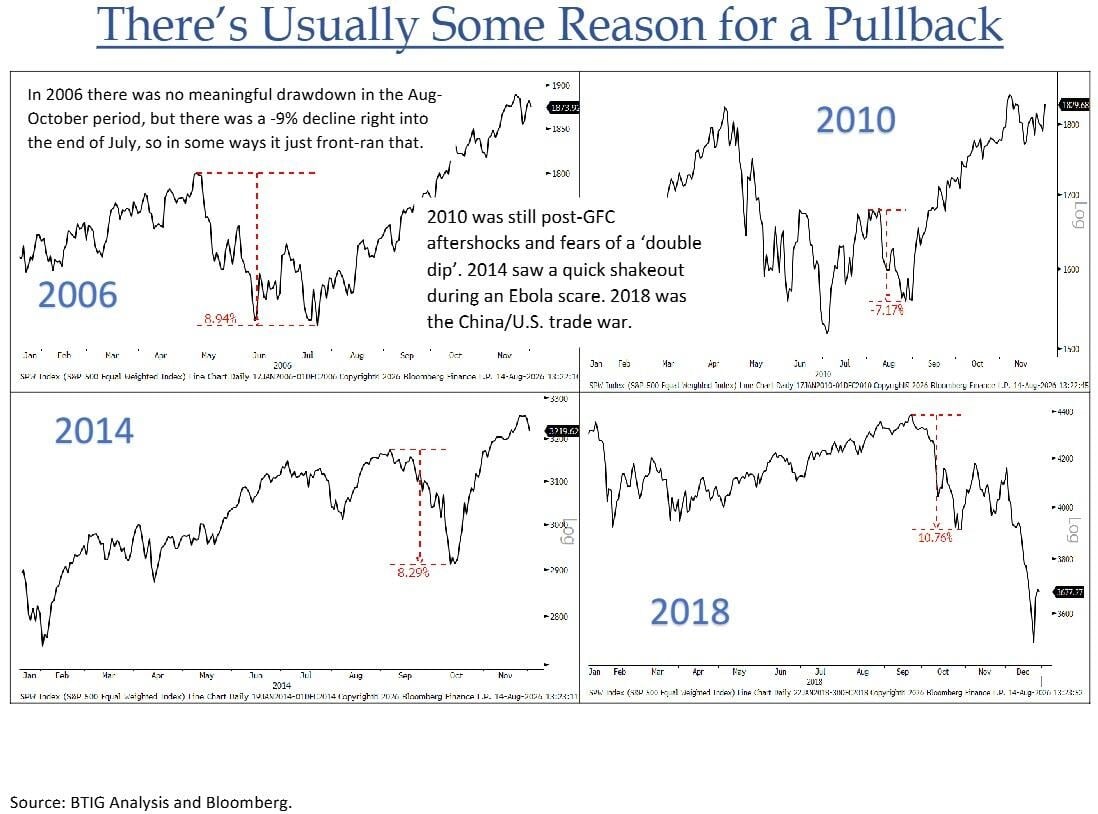
It is worth noting that the midterm elections themselves are not always the direct cause of volatility. BTIG points out that it is often an unknown external event that triggers the drop—such as Kuwait's invasion in 1990, the Long-Term Capital Management (LTCM) crisis in 1998, and the Ebola outbreak in 2014. This means that the potential risks currently facing the market are equally difficult to predict.
Technical Facets: Multiple Indicators Flash Yellow Lights
Apart from seasonal patterns, multiple technical indicators currently point to rising market vulnerabilities.
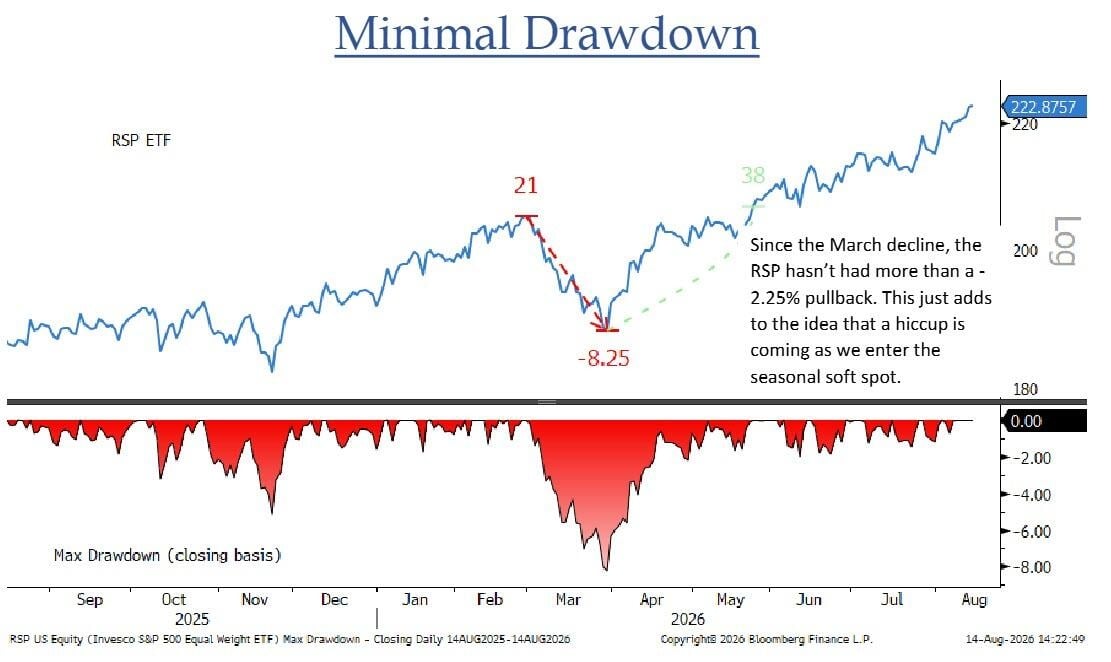
Since the March pullback, the RSP (equal-weighted S&P 500 ETF) has a maximum drawdown of no more than 2.25%, and this unusual calm itself is a signal of risk accumulation. Meanwhile, the current price of RSP is about 11% above the 200-day moving average, and BTIG points out that excluding the special circumstances after the COVID-19 pandemic, the deviation between RSP and the 200-day moving average typically does not exceed the current level; although the trend is strong, the stretch degree is already at a historical high level.
The absence of downward volume signals is also concerning. So far this year, the New York Stock Exchange has not seen a single "80% down volume day"—a trading day where down volume accounts for over 80% of total volume. The historical average is 21 such trading days per year, and since 1996, there has never been a year with fewer than 5. BTIG mentions that this is now the longest recorded stretch without an 80% down volume day, and the gap is significant.
Sentiment Aspect: Market Protective Demand at Extremely Low Levels
Investors' indifference to downside risks is also reflected in the options market. The 10-day moving average of the CBOE total put/call ratio has dropped to 0.82, within the low range of the past few years, indicating that market participants are nearly not buying protection against potential pullbacks.
BTIG associates this phenomenon with the market being at historical highs and the VIX at a year-low, arguing that the three together constitute a complete picture of the current market's complacent sentiment.
Long-term Interest Rate Anomalies: The Bond Market Issues Divergence Signals
At the macro level, there are also concerning divergences. Despite the non-farm payroll, CPI, PPI, and retail sales data presenting dovish characteristics in the past week, long-term US Treasury yields closed near their highest levels of this cycle.
This "interest rates ignoring positive data" trend forms a stark contradiction with the current optimistic pricing in the stock market, further increasing market uncertainty.
In sector allocation, BTIG points out that historical data shows the healthcare sector performs relatively well during the August to October period in election years, potentially having some defensive value.
In the semiconductor sector, the Philadelphia Semiconductor ETF (SOXX) encountered precise resistance at the 50-day moving average, which BTIG believes corresponds with the initial rebound trend after the "boom/bust top," and it is expected to find a bottom towards the 200-day moving average this year. Although the energy sector has shown several months of breakthroughs, BTIG takes a cautious stance on chasing gains, asserting that a single headline can reverse the upward trend and does not recommend actively chasing highs.
BTIG strategist Krinksy sums up by stating that now is an excellent time to reduce risk or hedge broad stock exposure, "the clock is ticking."
免责声明:本文章仅代表作者个人观点,不代表本平台的立场和观点。本文章仅供信息分享,不构成对任何人的任何投资建议。用户与作者之间的任何争议,与本平台无关。如网页中刊载的文章或图片涉及侵权,请提供相关的权利证明和身份证明发送邮件到support@aicoin.com,本平台相关工作人员将会进行核查。


